1
Establishing a Disaster Information System to Practically Support Disaster Countermeasures:
Conducting and Reviewing Demonstration Experiment
by
Akihiro Sanada1, Takaaki Kusakabe2 and Keiichi Tamura3
ABSTRACT
Although information systems are used in order
to collect and share information at a time of
disaster, such systems are not always effective.
In this context, after analyzing the reasons for
such ineffectiveness and current problems in
disaster countermeasures, we established an
information system as well as our disaster
countermeasures business model that would be
put into operation after introducing such an
information system. Then, we also conducted a
demonstration experiment in order to evaluate
the practical usefulness and effectiveness of the
information system and task model. Our
experiment revealed that the information system
would contribute to quickly collecting and
sharing
disaster
information,
but
the
operationality and operational rules require
some improvements and modifications. After
addressing these problems, the Chubu Regional
Bureau will start full-scale operation of the
system and business model. We also outlined
these outcomes in the system’s basic
specifications and some other documents. These
documents will contribute to mitigating system
development costs if policymakers refer to them
when they establish new disaster information
systems in the future.
Keywords: Disaster information system,
Gazetteer, Information Gathering & Sharing
Platform, Interface among systems
1. BACKGROUND
Information systems are used in order to collect
and share disaster information. However, such
systems do not always bring about the intended
outcomes in many cases because of inadequate
or inappropriate reporting system and rules,
which include the following problems:
Operators doubly enter data in the existing
systems; and staff still communicate over the
phone or by fax even after implementing a new
system.
To solve these problems, the Earthquake
Disaster Prevention Division and the
Information Technology Division, NILIM
(National Institute for Land and Infrastructure
Management), as well as the Information Access
Division, GSI (Geographical Survey Institute)
jointly began efforts in FY2003 to analyze
potential problems that prevent effective
operations of disaster information systems and
identify proper solutions for these problems. As
FY2005 is the last fiscal year for these efforts,
we have been working with Chubu Regional
Development Bureau since the beginning of
FY2005 to improve the practical outcomes of
setting up the joint review working group. On
February 16, 2005, we conducted a
demonstration experiment on the new disaster
countermeasures, assuming that we would
employ the new disaster information system
derived from our research. Then, we evaluated
the practicability and effectiveness of operating
such a new system and business model derived
from our research.
For more information on the detailed
background of our research, research process
and the business model, refer to the document
listed as [1] in the references.
2. OUTLINE OF DEVELOPED DISASTER
INFORMATION SYSTEM
1 Senior Researcher, Earthquake Disaster Prevention Division, National Institute for Land and Infrastructure
Management, Tuskuba-shi, Ibaraki-ken 305-0804 JAPAN
2 Team Leader, Earthquake Disaster Prevention Research Group, Public Works Research Institute, Tsukuba-shi,
Ibaraki-ken, 305-8561 JAPAN
3 Research Coordinator for Earthquake Disaster Prevention, National Institute for Land and Infrastructure
Management, Tuskuba-shi, Ibaraki-ken 305-0804 JAPAN
2.1 Examining Proper Functions of Such New
System
Even if a new information system is installed, it
does not always bring about the intended
outcomes in some cases. This is partly because
the existing disaster information system prevents
user friendliness if the system has too many
functional capabilities. In our research, we
analyzed problems in collecting and sharing
information by holding a hearing session with
staffs in MLIT regional development bureau
that
have
actually
handled
disaster
countermeasures during major earthquakes in
the past. Then, we identified the requirements
for system functions by examining whether or
not an information system would properly
contribute to solving these problems and, if so,
what kind of functional capabilities the
information system should have.
2.1.1 Problems in Collecting and Sharing
Information during a Disaster
We held a hearing session with MLIT regional
development bureau staffs that actually handled
disaster countermeasures during the Sanriku
Minami Earthquake in May 2003, the
Tokachi-oki Earthquake in September 2003, the
Niigataken-Chuetsu Earthquake in October 2004
and some other earthquakes. We held this
hearing
sessions
to
identify
actual
countermeasures and problems. Among the
hearing results, Table 1 shows the problems in
collecting and sharing disaster information.
2.1.2 Necessary Functions for Solving Problems
When solving the problems listed in Table 1, the
information system would make contributions
from the following aspects.
(1) Collecting disaster information
From various systems, operators will be able to
collect information useful for disaster
countermeasures.
(2) Analyzing information
Operators will be able to analyze from various
perspectives,
paying
attention
to
the
information’s roles in disaster countermeasures.
Operators will be able to properly select and
display the necessary information.
(3) Managing information
Operators will be able to manage information in
terms of time and location. Operators will be
able to easily categorize reported information.
(4) Distributing information
Operators will be able to view particular
information at multiple organizations or
departments at the same time. With a single data
processing task, operators will be able to
provide information to many stakeholders. (An
increase in such stakeholders should not lead to
heavier workload on data operators.)
From these viewpoints, the disaster information
system should have the following functional
capabilities.
(1) Requirement 1
By collaborating with information systems and
database
systems
used
under
usual
circumstances, operators will be able to search
for and cite necessary information.
[Example 1] By associating damage information,
and the affected facility’s drawings with
damage location or the affected facility’s
name as a key, operators will be able to
quickly collect the necessary information.
[Example 2] By using a camera system to
capture visual images of the site that are
necessary for disaster countermeasures, the
disaster information system will display a
camera icon on its map. The system provides
visual images captured with the camera
system if a data operator clicks on the camera
icon.
(2) Requirement 2
The information system should have “maps” and
a “bulletin board” as its basic capabilities.
Operators will be able to view necessary
information according to each aspect of disaster
countermeasures.
(3) Requirement 3
The disaster information system should manage
“time” and “location” data, which are included
in the reported information. For example, the
disaster information system should be able to
import temporal or location data from fax
messages and store up these data in the system.
(4) Requirement 4
By using a web-based approach, multiple
disaster countermeasure staff will be able to
view the data on their browser at the same time.
For example, if an operator receives information
from a local office and enters it in the system,
staff at the MLIT regional development bureau
and the MLIT headquarters will be able to view
the data at the same time.
(5) Requirement 5
In order to reduce the data entry workload as
much as possible, the information system should
employ the current fax-based data transmission
where possible, and minimize data entries. The
system should also replace telephone
communication because it is difficult to make a
phone call during disaster countermeasures.
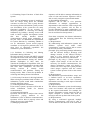
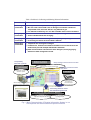
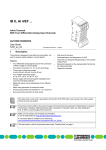
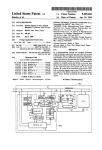
Newly developed disaster information system is
characterized by the following four points show:
(Fig.1)
(1) Platform for sharing disaster information
This platform electronically provides the same
functions as the traditional maps and whiteboard,
which are currently used for showing damage
information at the disaster countermeasures
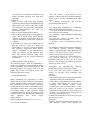
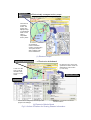
headquarters. Fig.2 provides the outline of the
electronic map, which electronically displays the
territory map, as well as the electronic bulletin
board, which electronically assumes the same
roles as the whiteboard.
They have the following main functions.
[Electronic map]
i) It is able to display the map at a designated
contraction scale. It is also able to designate map
levels, such as overall areas that the MLIT
regional development bureau or local offices are
in charge of, or a prefecture-wide map. The
system has six contraction scales, ranging from
1/300,000 to 1/2,500.
ii) As it employs an indirect location reference
database (gazetteer), the system is able to search
for an intended location by using a portion of the
location name as a keyword, and it displays a
list of intended location candidates. When an
operator selects one of these locations, the
system will display a map so that the selected
location lies at its center.
[Electronic bulletin board]
i) The electronic bulletin board has three
elements: the newest data portion on its top page,
the list data screen and the detail data screen.
ii) The list data screen is able to sort data on a
time-series basis, responsible local office basis
or prefectural basis.
iii) The system is able to print out its input data
in a designated list format. It is also able to
export data to spreadsheet software and
automatically generates a proper format
reportable to higher organizations.
iv) It is difficult to identify newer information
on the traditional fax sheets, because faxes
arrive one after another. On the other hand, the
information system provides easily viewable
data because it displays a new data element in
red.
v) An operator is able to easily confirm
incoming data.
vi) When entering follow-up data, an operator
needs only enter a new data element because the
system
automatically
imports
the
previously-entered data from the previous
report.
[Data link between Electronic map and
electronic bulletin board]
The information system provides a data link
between the electronic map and electronic
bulletin board. If an operator selects a location
on the map, the system displays data on the
selected location. From the detail data screen
that provides the detailed information on a
certain location, an operator is able to view and
confirm its location on the map.
(2) Interface among systems
If the existing system contains and manages
information, our new system prevents double
data entry because the system imports such data
from the existing system. In our project, we
developed a data exchange rule for intersystem
data exchange (i.e., intersystem interface
specifications). In our experiment, we actually
used the new rule, collected applicable data
from road closure database and specific systems
that handle CCTV camera images, and displayed
these data on the system screen.
(3) Indirect location reference database
(gazetteer)
If an operator inputs location data of affected
area by using mile posts that are currently used
for managing rivers and roads, the new system
converts it into longitude and latitude data, and
displays such data on the map. When an
operator inputs a distance mark in the new
system, the operator is able to search for data
related to such distance mark.
(4) FAX-OCR
Disaster countermeasures staff usually use
drawings that show handwritten disaster damage
information. On the other hand, when an
operator sends a paper document via fax in the
same manner as the traditional approach, the
new system automatically imports the received
data into its scanner, and electronically displays
and manages the data, rather than printing out
paper-based data.
3. OUTLINE AND OUTCOMES
DEMONSTRATION EXPERIMENT
OF
Applying the disaster information system and
our system usage stated in Section 2 above, we
conducted a demonstration experiment in order
to evaluate the effectiveness and practicability
of the disaster information system.
3.1 Purposes of Demonstration Experiment
The demonstration experiment has the following
main purposes.
First, we intended to evaluate the outcomes of
our research by actually operating our new
system and business model under a certain
disaster scenario.
As the first aspect in our evaluation process, we
focused on evaluating the practicability of our
developed system. This would reveal the
practicability and feasibility of our new
approaches, such as the FAX-OCR functions, as
well as the new disaster countermeasures
business model that incorporates the new
information system. As the second aspect in our
evaluation process, we focused on evaluating the
effectiveness of our development efforts. In
other words, we compared the new disaster
countermeasures tasks with the new disaster
information system installed and the traditional
telephone- or fax-based approach. By doing so,
we evaluated to what degree we could reduce
the workload. Our evaluation revealed necessity
of some improvements in the system, which
would contribute to enhance the practicability of
our new system.
Second, we intended to provide experiment
participants with some information on the
beneficial points of employing our new business
model and information system.
3.2 Outline of Demonstration Experiment
(1) Demonstration experiment
i) Participants
The following participants took part in the
experiment: Planning Department in charge of
coordinating the overall tasks of the MLIT
regional development bureau, the River
Department in charge of managing river-related
facilities, and the Road Department in charge of
managing roads, as well as river offices and
national road offices in charge of disaster
countermeasures on site.
ii) Player levels
Our demonstration experiment has two player
levels at departments in the MLIT regional
bureau and participating local offices.
1) Data reader: Decision makers
They mainly check out input data and
communicate with related departments/local
offices.
2) Data operator: Data operators, such as staff in
charge of entering system data
They mainly enter or coordinate data and
prepare documents.
(2) Disaster and scenario assumed
i) Outline of assumed earthquake
- Date/time: Around 11:00 a.m., February 16,
2006
- Seismic center: In the waters off Tokaido
- Others: No aftershock assumed. Assumed that
tsunami had arrived after the earthquake.
ii) Damages assumed
We assumed that some rivers and national roads
would suffer damage resulting from the
earthquake.
iii) Outline of scenario
Our scenario has two phases: Phase I and Phase
II.
1) Phase I
Phase I starts with setting up a
countermeasure framework and ends at initial
inspection. Players entered and viewed
inspection data. In Phase I, we finally
confirmed how well the entire system would
work and also evaluated how familiar data
readers and data operators were with their
own tasks.
2) Phase II
Phase II starts with when data operators
would have entered inspection/damage data to
some extent and ends at when they would
start emergency recovering tasks. We handled
disaster countermeasures by using our
information system.
iv)How to assume disasters and scenario
1) We assumed certain disaster countermeasures
tasks, which would bring about positive
impacts on disaster countermeasures if our
disaster information system were employed.
(Table 2)
2) In addition, we also set up certain tasks so
that we would be able to evaluate the
performance of our new system capabilities
and explicitly understand some positive
impacts. In addition to our assumption as
stated in 1) above, we also assumed some
tasks that would explicitly bring about
positive impacts on the system’s functional
capabilities.
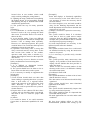
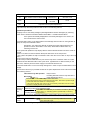
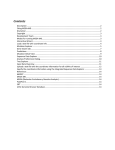
(3) How to allocate tasks for players
We allocated player’s tasks by distributing a
(pink color) card that specifies the player’s tasks.
In the experiment, the controller basically did
not orally specify the player’s tasks over the
phone. Fig.3 shows an example of the card
specifying the player’s tasks.
3.3 Experiment Results
When considering the experiment as whole,
participants from MLIT regional development
bureau staff that mainly acted as data readers in
the experiment provided positive responses,
stating that the new disaster information system
was helpful in their tasks. Local office workers,
who mainly acted as data operators, highly
evaluated that the new system provided an easily
viewable data screen, but they also pointed out
many
problems
that
would
require
improvements.
Positive responses are shown at 3.3.1 to 3.3.3
3.3.1 Overall Evaluation
- The new system is good because it only
imposes a smaller amount of workload than the
current system and also eliminates data input
errors.
- It is highly user-friendly and provides
significant positive impacts.
3.3.2 Supporting Capabilities in Collecting,
Analyzing and Sharing Information
- It is good because the system provides the
newest real-time information.
- It is possible to share information with many
stakeholders.
- By using the system, it becomes easier to
coordinate disaster-related data.
- It becomes easier to understand affected
locations.
3.3.3 Impacts of Specific Functional Capabilities
- The indirect location reference database
enables a map-based data search. With the new
system, it becomes easier to collect data on a
certain location (a specific mile post).
- FAX-OCR is effective if a local office has a
poor network connection or if staff are
unfamiliar with how to use a PC. It is good
because a fax document is attached to the map
(on the top of the screen).
Participants also indicated the following
problems that require some improvements.
(1) In some cases, the system is difficult to
operate or provides some confusing data
screens.
[Examples]
i) The button names do not represent functional
capabilities intuitively understandable.
ii) Icon marks are not intuitively understandable.
iii) Some improvements are necessary for
switching over multiple screens, screen
locations and screen sizes when there is more
than one screen on the display. (Operator
sometimes needs to find the screen he/she was
working on, as another screen may appear on
the top by some data process.)
(2) Some improvements are necessary to prevent
data operator’s errors.
[Examples]
i) Buttons should be properly located to prevent
data operator’s errors. (These buttons are
located close to one another, which could
easily result in pushing the wrong button.)
ii) Updating the map is different from updating
the bulletin board. (I had wrongfully thought
that updating the map or bulletin board would
automatically update both.)
(3) The system has way too many operation
steps.
[Examples]
i) It is troublesome to confirm incoming data
because I need to do it by opening the detail
data screen. (It would be better if we could do
that on the list.)
ii) As an decision maker, I have two different
screens for inspection data and for damage data
because I like to manage them separately.
However, as a data-input operator, the system
would be better if we could enter the inspection
and damage data at the same time.
iii) Operators could easily select a wrong data
entry screen and enter the wrong data. As the
data screens look similar to one another,
operators could easily make a mistake (e.g.,
damage data might be entered on the inspection
data screen).
(4) It is necessary to have a function to ensure
timely confirmation of new incoming data.
[Examples]
i) It is difficult to distinguish between
already-read data and unread data.
ii) The system should have an alarm to let us
know when new data arrive at the system.
(5) It is necessary to modify or supplement the
current rules.
[Examples]
i) Each division should check out their data
when sending or reporting their data. (A report
from a local office to a regional bureau
requires the approval of the head of the local
office. However, a new approval rule is
necessary in order to operate the new system in
a better manner.)
ii) Report titles are not coherent. We don’t have
a proper rule on describing data even though
this kind of rule is a must for proper data
analysis.
(6) Others
i) It would be better if we could customize
screen shots or functional capabilities for each
user.
[Examples]
-Some data displays or functional capabilities
are not necessary at the local office level. (It
was necessary to select the necessary data at
the local offices.)
-Two data categories (river and road) would be
okay for the Planning Department, but the
Road Department will need more detailed data
categories of only road.
ii) Proper screen shot or expression is necessary
[Examples]
-The system would be better if it calculates
some data so that we could answer routine
questions from the MLIT headquarters. (For
example, the system should be able to calculate
the inspection progress percentage.)
iii) Some improvements are necessary in the
indirect location reference database.
[Example]
-The system would be better if we could search
an intended location by using the intersection
name as a keyword.
iv) It is necessary to provide easily viewable
maps.
[Examples]
-The system provides many unnecessary data
displays. (It is possible to set the data items for
dispaly, but the default data shot provides so
many data items.)
- When we have an increased number of data
showing on the screen, it is difficult to identify
the selected data items.
v) Problems in FAX-OCR
[Examples]
-The system should have an alarm to let us know
that the data have arrived.
-The data entries in OCR format should be fully
optimized.
vi)The system should have more functional
capabilities in the future.
[Examples]
-The system should automatically import data
by using sensor-based systems.
-The system would be better if it imported data
from GPS mobile phones.
-We need applications for our tasks under usual
conditions.
We have been making efforts to solve the
aforementioned problems after setting up our
priorities.
4. FUTURE EFFORTS
After some modifications in line with our
experiment outcomes, the Chubu Regional
Development Bureau will start operating its new
disaster information system in FY2006.
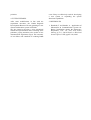
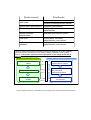
We also intend to develop a new operational
manual and specifications after correcting some
problems, paying attention to the results of our
demonstration experiment (Fig4). The outcomes
of our efforts will contribute to reducing R&D
costs if they are effectively used for developing
a new system or expanding the system
functional capabilities.
5. REFERENCES
1. Kusakabe, T. and Sanada, A. : Application of
Information & Communication System for
Better Coordination among the Emergency
Responders, Proc .the 37th Joint Panel
Meeting of U.S.- JAPAN Panel on Wind and
Seismic Effects UJNR, pp297-310, 2005
Table 1 Problem in Collecting and Sharing Disaster Information
Tasks
Current problems
Collecting
information
1) The system does not provide visually apparent data.
2) We also need various data such as damages on facilities outside our
responsible areas, but such data are very difficult to get.
3) It is difficult to effectively use our data available under normal conditions.
Analyzing
information
4) Information will become deteriorated. Data processing is difficult.
5) Some redundant tasks are emerging.
Managing
information
6) The system is difficult to manage data temporally or spatially.
7) Processing a massive amount of data is difficult.
Distributing
information
8) Telephone line convergence emerges.
9) Inefficiencies, workload and artificial mistakes will increase because the
staff need to provide multiple stakeholders with data.
10) Data communication channels have been designed, merely by paying
attention to data management needs.
Compatibility
with other systems
2) Intersystem
Link Interface
1) Platform for sharing
disaster information
Easily manages massive amount of data
• Data management with electronic map and electronic
bulletin board
• Data link between maps and bulletin board
Eliminates troublesome data
entry tasks
Imports data from other
information systems
4) FAX-OCR
The system converts
FAX-based documents
into an electronic
format and displays
the data on the screen.
Other existing information systems
Example) The system displays camera
images by working with a CCTV camera
system
Associating distance marks
with latitude/longitude data
3) Indirect Location Reference Database
Displays data on the electronic
map even if mile posts are used
Searches for location data
by using mile post.
Fig.1 Main Characteristics of Disaster Information System in our
Development and Demonstration Experiment Efforts
Electronic
Maps
⇒Electronically manages territory maps
There are six
contraction
scales. The
system also
displays maps
on a prefecture
basis or local
office’s
responsible
territory basis.
An example of
screen contraction
scales: 1/10,000 (right).
The system is also
able to display maps
at the 1/2500 level
(1) Electronic maps
Electronic Bulletin Board
--> Electronic whiteboard
A click on a data
entry on the list
will lead to data
screen in a map
format.
By clicking an icon on the map,
operators are able to check out
detail data on such location
(or vise versa).
Detail data screen
List screen
A list of various categories, such as inspection
progress and damages
Detail data on inspection zones and
affected locations
(2) Electronic Bulletin Board
Fig.2 Outline of Platform for Sharing Disaster Information
Table 2 Scenarios assumed (details)
Collecting information
[All staff are able to check out information once the data is entered in the system]
• Staff would answer questions from mass media, local governments and other organizations.
◆ They would provide information (without making inquires to pertinent organizations) based on
the data displayed on the system.
• River office staff would confirm detours.
◆ They would provide information (without making inquires to pertinent organizations) based on
the data displayed on the system.
• By using media information (residents evacuation to river area or tsunami residues accumulation at
coastal areas) when little information is available, the staff would provide inspection-related
instructions to check out these locations.
◆ The system would provide data that have been difficult to use so far.
Analyzing information
[Easily manages information]
• Staff would answer questions from local governments about XXX River, Route XX or a certain
location.
◆ The system would identify the location in question from address data or distance marks and
display the data relating to such location.
• Staff would coordinate data available as of XX o’clock and report them to senior officials and the
Ministry headquarters.
◆ They would coordinate the data entries (without transcribing or re-typing them).
◆ The system would automatically sort out the data in the bureau’s jurisdiction into a report format
acceptable to the Ministry headquarters.
• Staff would answer questions from XX Prefecture about prefectural information, XXX River or
National Route XX.
◆ The system would display a map on a prefectural basis or local office’s responsible territory
basis.
◆ The system would display a list of bulletin boards by using prefectural, river or route name.
[Others]
• We assumed serious damages, less serious damages and death of passengers or users.
◆ Evaluates priority in sending data
Table 2 Scenarios assumed (details) (Continued)
Managing information
[Easily manages information]
• Road or river administrators would address the damages after receiving a report from residents. They
would manage data, associating them with resident reports or actual disaster countermeasures.
◆ The system would comprehensively manage related data in a category, such as unidentified data
or administrator’s confirmed data.
• Damages would occur at the same time at an embankment at adjacent distance marks.
◆ The system would properly manage data by enlarging maps or displaying a bulletin board list
even if multiple affected locations exist nearby.
• The system would easily convert data into an electronic format because it has FAX-OCR.
◆ The system would manage data that are difficult to use so far.
[Real-time data and historical data on disaster countermeasures are available]
• Data operator would enter wrong damage data in the system and then correct them.
◆ They would easily search for data entry (sorting out the data on a time-series basis, facility basis,
or mile post basis).
◆ The system would also display the data correction process. It is available to any staff at the site.
• As some other departments have provided disaster data, staff would instruct a local office to collect
data on site and conduct subsequent countermeasures.
◆ As the system would display actual disaster countermeasures at affected locations, system users
would easily confirm actual countermeasures that are taken in line with their own instructions.
Distributing information
[Proper role sharing between information system and FAX/phone]
• River office staff would identify a road disaster.
◆ They would report such damage, and they would be able to check out the data on the system
(without making a phone call or sending a FAX).
• They would make the first report of damage over the phone and check out detailed data on the system.
◆ Proper role sharing between the phone call and the information system
• Staff would state necessary equipment over the phone and enter equipment data in the system for the
purpose of data management.
◆ Proper role sharing between the phone call and the information system
Role instruction card
To:
Data readers at Shonai River Office
Reference #
Sho-etsu 14-6
From:
-
Time of delivering
the card:
14:50
Inquiries from the police department
Re:
The police department has made inquires about the 8-8.2km slope collapse on the right bank.
Output the map data and provide the data via fax in the following manner.
Operational procedures
1) Display a list of river facility damages ("Shonaigawa River Serious damages") by selecting
Bulletin board - Disaster Information Bulletin Board Menu - Facilities Disaster-River
If the system has already displayed the river facility damages on the screen, the
user should use the same screen.
2) Click the “Map” button on the data window of the damage at the 8-8.2km on the right bank to
display the map of the affected location.
Sometimes, you might face difficulty in identifying proper data because the list
provides too much information. In this case, select “Shonai River Office” by
switching over the list.
3) The system will update the map display data so that the affected location lies at the center of
the map.
4) Select 1:10,000 from the Contraction Scale pull down menu of the map screen.
5) The system will update the map’s contraction scale. Click the “Print” button on top of the map
screen.
6) Print out the map from the printer.
7) Follow the procedures stated above to print out the map at the contraction scale of 1:5,000.
8) Write down the affected location name (river name, right/left bank or distance mark) on the
report form, and then place it and the map(s) in the FAX transmission box.
9) Click the Detail button on the river facility damage list in order to open the detail data on such
damage.
10) Record the fact that you provided the data to the police department. Enter and store the data
in the following manner.
Titles filled in by data operator
Player's name
Description
Providing affected location’s map data to the
police department via fax.
Provides instructions on data entry or data screen tasks.
Some data operators might provide itemized instructions, while other operators might
provide their instruction written in a colloquial style.
In the case of the latter, staff need to find out necessary information from the context
and enter or display the data on the system
System functional capabilities
Purpose of ・Displaying and printing out the map data
This section describes what you would like to evaluate by allocating
allocating
System operation player roles (e.g., evaluating system's operationality or efficiency
roles
improvement)
organization(s)
・Providing data for other
If you have any comment on data system operation, please write it down in the margin on this
format.
Related
topic(s)
Fill in this section if you have any additional comments,
such as the Nth report.
Fig 3 Sample of Card to Specify Players’ Task
[Studied contents]
[Final Results]
Disaster countermeasures
task model
Use case chart
System basic specifications
Standard specifications
Data dictionaries
JPGI-compatible standard
specifications
System interface
specifications
Standard specifications (draft)
FAX-OCR
Project book, functional
specifications, user manual
Indirect location reference
database
Project book, functional
specifications, user manual
Disaster countermeasures manual
If decision makers refer to these documents (including the definitions for system capability
requirements) when establishing a new system or adding capabilities of their existing
systems, cost to define system function requirements and to design system will be
reduced.
General flow of establishing a new system
Outcomes of Session meeting I available in the future
Use case chart disaster
countermeasures manual
Defining system users’
needs
Developing a new
system
Customizing
Designing a new system
System basic specifications
Data dictionaries
Interface specifications
Sharing disaster information
PF prototype
Fig 4 Final Result and Its Contribution in Developing New Disaster Information System