1
8.
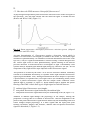
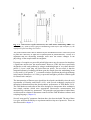
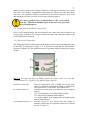
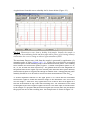
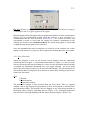
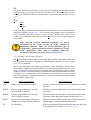
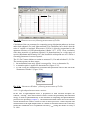
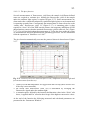
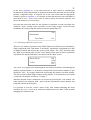
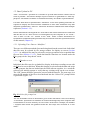
Fig. 2-4. During the saturation pulse (marked by the arrows) the fluorescence signal
exceeds the range of the A/D converter. The peak of the pulse is cut from the trace
but sampled (incorrectly) as 4095 bits by the software.
The peak fluorescence signal is effectively cut from the recording. This situation may
be corrected by reducing instrument gain (Section 2.4.1.5.) or re-orienting the
fibre-optic further away from the sample. If left un-corrected erroneous
measurements of Fm and PSII will be stored when measurements are made.
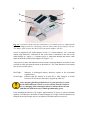
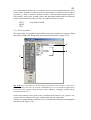
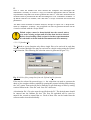
As referenced above, all of the FMS configuration and data management facilities are
accessed from the “drop-down” menu (C, Figure 2-1) whilst execution of
measurements and on-line control of instrument light sources is initiated via the
instrument toolbar (D, Figure 2-1). The following sections detail the configuration
and data management facilities available from the “drop-down” menu. Description
of each item on the instrument toolbar is given in Section 2.6.
2.4. “Drop-Down” Menu Functions.
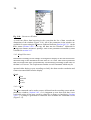
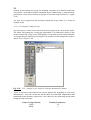
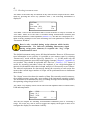
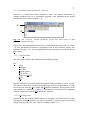
The “drop-down” menu contains seven groups of related functions under the
following headings:
Files
Script
Hardware
Graph
Tools
View
Help
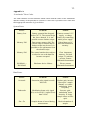
In this section the groups are described in three broad catagories:
• Configuration of hardware & software
(Hardware, Graph, Tools and View)
• Data Handling & Export
(Files)
• Instrument Programming via User-Defined (Script)
Scripts