1
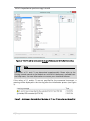
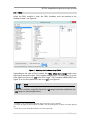
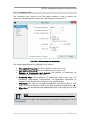
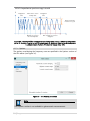
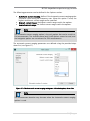
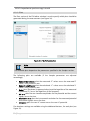
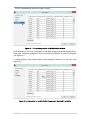
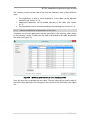
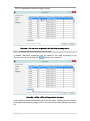
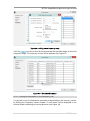
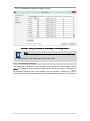
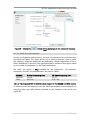
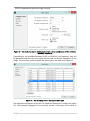
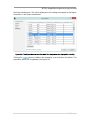
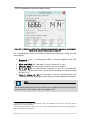
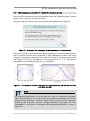
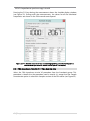
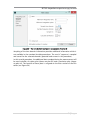
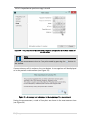
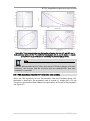
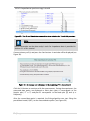
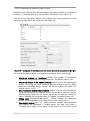
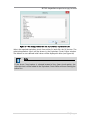
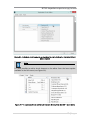
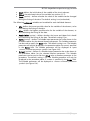
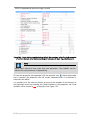
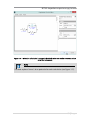
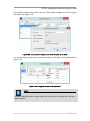
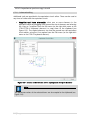
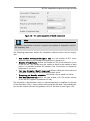
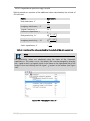
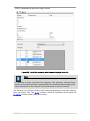
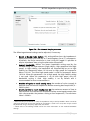
NOVA Impedance spectroscopy tutorial • • • of the FRA module. The time domain information consists of the raw X and Y sine waves. This information can be used to build a Lissajous plot, or to evaluate the signal to noise ratio and to verify the linearity of the cell response. The Time domain, X (AC) and Y (AC) and X resolution and Y resolution signals are added to the data for each individual frequency when this option is on. Sample frequency domain: if this option is active, the frequency domain information will be sampled and stored for the X and the Y. The frequency domain information consists of the calculated FFT results obtained from the measured time domain. The frequency domain information can be used to evaluate the measured frequency contributions. The Frequency domain, X frequency domain and Y frequency domain signals are added to the data for each individual frequency when this option is on. Sample DC: if this option is active, the DC components for both the potential and current will be sampled and stored alongside the impedance data. The Potential (DC) and Current (DC) signals are added to the data for each individual frequency when this option is checked. This option is active by default. Calculate admittance: if this option is active, the admittance values will be calculated during the measurement (Y’, -Y”). Note The names defined in the External section of the FRA editor will be used to identify the X and Y signals in the procedure editor. Additional settings can be specified in the Advanced editor. To toggle the display of the parameter, click the button next to the Advanced label in the editor (see Figure 170). Note The Advanced settings are predefined to an optimal value for most measurements. Please read the following section of the manual carefully before adjusting these settings. 128 | P a g e