1
NOVA Impedance spectroscopy tutorial
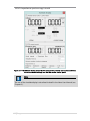
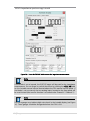
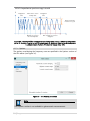
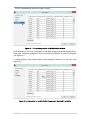
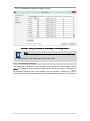
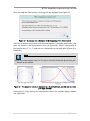
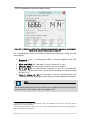
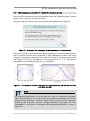
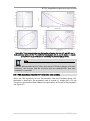
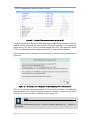
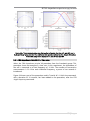
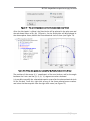
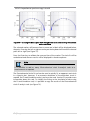
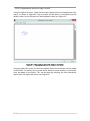
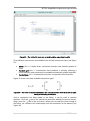
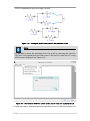
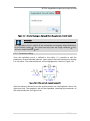
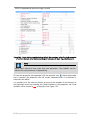
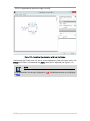
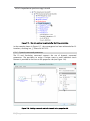
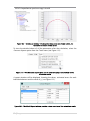
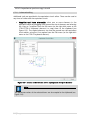
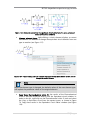
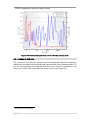
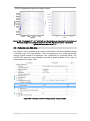
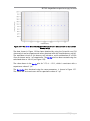
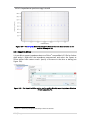
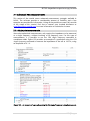
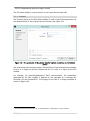
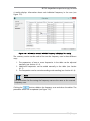
Figure 56 – The measured values are displayed as a Nyquist plot (top left, plot #1) and a
Bode plot (top right, plot #2). The additional time domain data is used to create a Lissajous
plot (bottom left, plot #3) and a resolution plot (bottom right, plot #4)
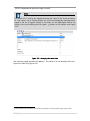
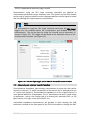
Note
Since the data provided by the Collect time domain FRA data changes with each
frequency, the Lissajous and the resolution plot are updated after each new
frequency is measured.
5.4 – FRA impedance tutorial #4 – Real time data analysis
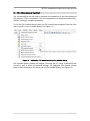
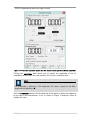
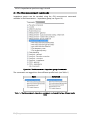
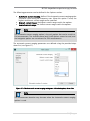
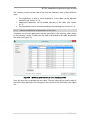
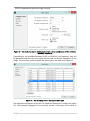
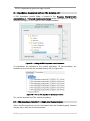
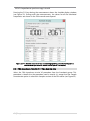
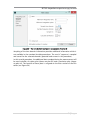
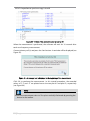
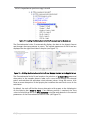
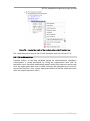
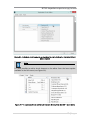
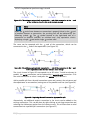
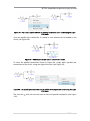
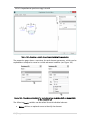
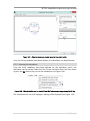
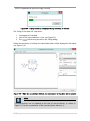
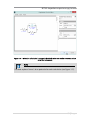
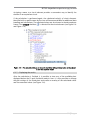
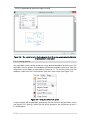
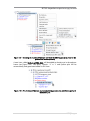
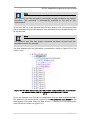
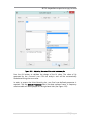
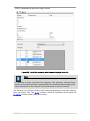
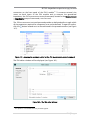
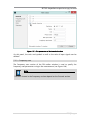
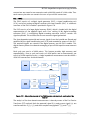
Select the FRA impedance tutorial #4 procedure from the Standards group. This
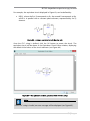
procedure is identical to the procedure used in tutorial #1, except that a Fit and
Simulation command has been added to the procedure, at the end of the procedure
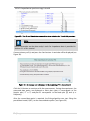
(see Figure 57).
51 | P a g e