1
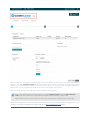
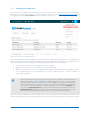
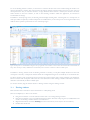
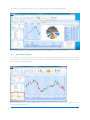
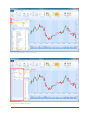
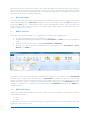
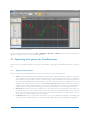
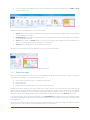
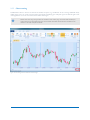
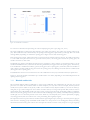
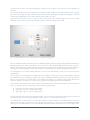
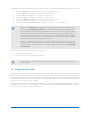
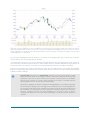
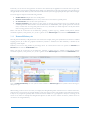
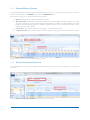
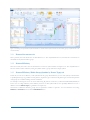
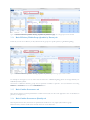
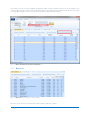
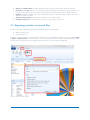
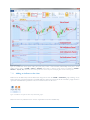
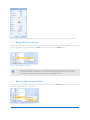
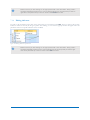
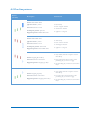
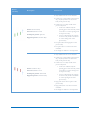
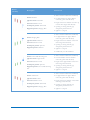
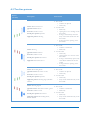
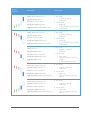
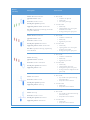
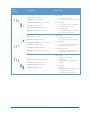
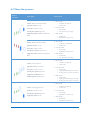
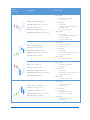
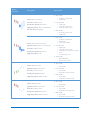
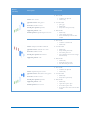
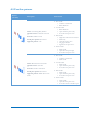
5 Working with statistics It’s not enough just to know that a pattern has occurred on the candlestick chart, but also how "well" or "badly" it had performed in the past. In other words, how effective is the signal being generated? And here, even before going into a heavy duty backtesting analysis, we can check some simple statistics first. As a first pass, there's no need for detailed model optimization, no need for sophisticated entry/exit methodology and no need for risk and money management rules, just a basic analysis of the underlying statistics. What matters at this stage is: the number of accurate occurrences (how statistically significant the results are) and the price behavior within 10 subsequent candlesticks after the pattern's occurrence, The most challenging aspect is to effectively convey the statistics and present them in such a way readily showing pattern efficiency, just after its occurrence. CandleScanner adopted very simple principle. If there is a bullish reversal or a bullish continuation pattern on the chart, the next 10 candles should demonstrate its prognostic value. CandleScanner checks how many times over the next 10 candles, closing prices were higher than the closing price on the candle when the pattern occurred. The resulting signal value is then classified as belonging to one of the following categories: False forecast: 0 candles Low efficiency: 1-3 candles Medium efficiency: 4-6 candles High efficiency: 7-10 candles Please note, we are not talking about the number of consecutive candles in a row, but the total number within the test period of 10 candles. For example, if after pattern occurrence a correct signal was subsequently confirmed on the first, eighth and tenth candle, it means that the candle pattern was confirmed on only 3 occasions, indicating its low efficiency. Of course for bearish reversal patterns or bearish continuation patterns, we are looking for days with closing prices below the closing price on the candles of pattern occurrence. Please note that scanner settings (see chapter 4.4) may have a great impact on the number of identified patterns and consequently on statistics. For example changing the maximum acceptable deviation of the maximum body height for doji candles may cause major impact on the number of found patterns. It may happen, for instance, that a Hammer pattern will be identified as a doji candle and will be rejected. Therefore, it is recommended that any changes to the settings of the scanner are performed with a full understanding of possible consequences during the scanning process. 5.1 Symbol statistics Symbol statistics calculates, as the name implies, statistics related only to a specific symbol. This type of statistics should be used to have detailed information on the level of the given symbol. It is very important to know that the same pattern can behave totally different between symbols. To open symbol statistics click HOME » Symbol Statistics from the New Window buttons group on the ribbon bar. When the statistics window is opened and active a context menu (called STATISTICS) for statistics module will appear. When you switch into another window which is not of statistics type, statistics menu will disappear. In the STATISTICS menu you can select the date range for which statistics is being calculated. You can also specify that the statistics should be calculated for all available quotes for a given symbol. After any changes to date range Calculate Statistics button needs to be pressed to reflect the changes. Symbol Statistics window is composed of tabs. Every tab presents statistics from a different perspective. CANDLESCANNER USER GUIDE 41