1
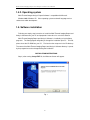
a50 and z50
Thermal Imaging Report
and Analysis Software
User Manual
WD1060 Rev A
November 28, 2011
Wahl Instruments Inc.
234 Old Weaverville Road
Asheville, NC 28804
Toll Free: 800-421-2853
Phone: 828-658-3131
Fax: 828-658-0728
Email: [email protected]
Wahl Thermal Imaging Report and Analysis Software User Manual
Contents
1. Introduction................................................................................................................. 4
1.1. Copyright........................................................................................................... 4
1.2. Disclaimer......................................................................................................... 4
1.3. Quality Assurance............................................................................................. 4
1.4. System requirements........................................................................................ 4
1.4.1. Recommend hardware configuration...................................................... 4
1.4.2. Operating system.................................................................................... 5
1.5. Software installation.......................................................................................... 5
1.6. Starting the software......................................................................................... 8
1.6.1 Opening Screen.....................................................................................8
1.6.2 Create a report - Using the Wizard.........................................................9
2. Software interface .......................................................................................................13
2.1. The Main Operational Window.........................................................................13
2.2. Menu bar...........................................................................................................14
2.2.1. File menu................................................................................................14
2.2.2. Edit menu................................................................................................14
2.2.3. View menu ..............................................................................................15
2.2.4. Drawing menu.........................................................................................15
2.2.5. Windows menu........................................................................................16
2.2.6. Help menu...............................................................................................16
2.3. Toolbar...............................................................................................................16
2.3.1. Standard Toolbar.............................................................................................16
2.3.2. Format toolbar.........................................................................................16
2.3.3. Drawing toolbar.......................................................................................16
2.3.4. Play toolbar..............................................................................................16
2.3.5. Measure toolbar.......................................................................................16
2.3.6. Page control toolbar.................................................................................17
2.3.7. Adjust toolbar...........................................................................................17
3. Getting Started................................................................................................................18
3.1. Create new report...............................................................................................18
3.2. Open up saved reports .......................................................................................18
3.3. Save report.........................................................................................................19
3.4. Save as report ....................................................................................................20
3.5. Save as template................................................................................................20
3.6. Export the report as MS WORD file....................................................................20
3.7. Print setup ..........................................................................................................20
3.8. Print preview........................................................................................................21
3.9. Print report...........................................................................................................22
3.10. Batch process....................................................................................................22
3.11. Exit ....................................................................................................................24
4. Report Generation & Analysis....................................................................................... 25
4.1. System interface ................................................................................................. 25
4.2. Composing the report......................................................................................... 25
4.3. Operations of IR object ...................................................................................... 26
Wahl Thermal Imaging Report and Analysis Software User Manual
4.3.1. Create IR object..................................................................................... 26
4.3.2. Link IR object.......................................................................................... 27
4.3.3. Analyze IR object.................................................................................... 28
4.3.3.1. Setup analysis .............................................................................. 28
4.3.3.2. Modify analysis……....................................................................... 30
4.3.3.3. Delete analysis............................................................................. 31
4.3.4. Infrared image parameters setup........................................................... 31
4.3.4.1. Image display setup ..................................................................... 32
4.3.4.2. Object parameters setup.............................................................. 33
4.3.4.3. Analysis parameters setup........................................................... 34
4.3.4.4. Palette setup................................................................................ 35
4.3.5. Voice playback....................................................................................... 35
4.4. CCD image object............................................................................................ 35
4.5. Text tool object................................................................................................. 36
4.5.1. Change font and align mode.................................................................. 37
4.5.2. Cut copy, paste text contents................................................................. 37
4.5.3. Change text, line and background color..................................................37
4.6. Results table tool setup...................................................................................... 38
4.7. Table tool setup................................................................................................ 39
4.8. Profile tool for line analysis............................................................................... 41
4.9. Histogram tool for line or area analysis........................................................ 43
4.10. 3D map object tool.......................................................................................... 44
4.11. General operations of object .......................................................................... 46
4.11. Page operations.............................................................................................. 47
WARRANTY & CALIBRATION
REGISTRATION at
www.palmerwahl.com/register
Registration is fast and easy. In about a minute you
can have your product automatically registered for
Warranty Protection and our Calibration Reminder
service. Let Palmer Wahl help you protect your
investment, and maintain product accuracy and
compliance with ISO and other quality standards.
Questions? Call Customer Service
at 1-800-421-2853 or 828-658-3131
Or email: [email protected]
II
Wahl Thermal Imaging Report and Analysis Software User Manual
1. Introduction
Thank you for purchasing Wahl Thermal Imaging equipment. The Thermal Imaging
Report and Analysis Software provide you with the tools to generate quality reports for you
and your customers. It is a word based software package with many unique features to
allow on screen analysis or to generate professional quality reports.
1.1. Copyright
Wahl reserves all rights of the Wahl Thermal Imaging Report and Analysis Software.
No parts of the software may be reproduced or copied without the prior written permission
of Wahl Instruments, Inc.
1.2. Disclaimer
While Wahl Instruments strives to deliver high quality products, Wahl does not
guarantee this software to be free from defects. In the event you experience problems
please contact Wahl so that we may make corrections for the next release of the software.
Wahl Instruments, Inc. reserves all rights to upgrade this manual without prior notice.
1.3. Quality Assurance
The quality management system under which the products are developed and
manufactured has been approved to be compliant to the ISO 9001 standard.
1.4. System requirements
The files which are involved in the Wahl Thermal Imaging Report and Analysis
Software are thermal images, CCD pictures and graphics. Those three kinds of files are far
larger than the ordinary file; therefore the PC system should have enough memory
capacity, hard disc space, high processing speed and high screen resolution.
1.4.1. Recommend hardware configuration
• PENTIUM III 1.4GHz CPU or higher
• 256 Mbytes or higher system memories
• 20G or higher hard disc space
• 1024×768 or higher for the screen resolution
4
Wahl Thermal Imaging Report and Analysis Software User Manual
1.4.2. Operating system
Wahl Thermal Images Analysis Report Software is compatible with Microsoft
Windows2000, Windows XP. Other operating systems and multi-language version
software are under development.
1.5. Software installation
Following are step by step instructions to install the Wahl Thermal Imaging Report and
Analysis Software onto your PC and preparation instructions for use of the software.
Wahl Thermal Imaging Report and Analysis Software is installed by using the Setup
programs. The Setup program will guide you through the installation process. To install,
please insert the CD-ROM into your PC. Find and run the setup.exe in the CD directory.
The name of the Wahl Thermal Imaging Report and Analysis Software directory is preset
by the program but can be changed during the installation.
INSTALLATION INSTRUCTIONS
Step 1) after running “Setup.EXE” file, the Welcome Screen will appear.
Fig.1
5
Wahl Thermal Imaging Report and Analysis Software User Manual
Step 2) select “Next”, the system will ask for the user name, company name and the
Software Serial Number:
Fig.2
Please note: All three items must be entered, or the “Next” button will not be active.
Please find the Software Serial Number on the cover of the installation CD.
Step 3) select “Next”, the system shows that this process will install the Wahl
Thermal Imaging Report and Analysis Software into the Windows System Directory.
Fig.3
6
Wahl Thermal Imaging Report and Analysis Software User Manual
Step 4) allows you to verify the previous installation selections. Select “Next” and the
system will copy files to your PC system.
Fig.4
Step 5) the “Install Wizard Complete” screen will display, indicating the Wahl Thermal
Imaging Report and Analysis Software has been successfully installed onto your PC.
Fig.5
7
Wahl Thermal Imaging Report and Analysis Software User Manual
1.6. Starting the software
After complete the installation of the Wahl Thermal Imaging Report and Analysis
Software, please return to the WINDOWS interface and the Wahl software icon should
appear as below:
Fig. 6
Double click the icon to start the Wahl Thermal Imaging Report and Analysis Software.
The Wahl Thermal Imaging Report and Analysis Software will also create the menu icon
in the system “Start” menu as below:
Fig.7
This icon m a y also be selected to start the software.
1.6.1 Opening screen
The Wahl Report and analysis software includes the following methods of report writing:
Empty Page: Build report from a blank page. Also used to develop custom templates and
edit existing reports.
Create new report (not using template): Enables Wizard for fast report entry.
Template1: User generated templates are shown in this list.
Fig. 8
8
Wahl Thermal Imaging Report and Analysis Software User Manual
Empty Page – Building report from blank page
This method consists of populating a blank page with images, text blocks, tables
and graphs. See sections 2 through 6 for detailed instructions of the available functions.
These functions may also be used to modify existing reports made from the Wizard or
from templates, as desired.
1.6.2 Create new report – Using the Wizard
To create a report using the Wizard, select “Create new report (not using template)”
and the “Using the Wizard” button will become active. Click on the “Using the Wizard”
button and the report wizard will open with the following screen.
Fig. 9
The information in the above screen will appear on the Reports Title Page. Text
Information Changes can be used for contact name, address, phone number, etc. After
completion of the text data, click Next and the Image Selection page will open. Click on
“Add” to select the image to put into the report. Make sure to install the SD card from the
camera or preload the images to a folder on your computer. Multiple images may be
added, for which the report will generate a new page for. You may enter a Page Title for
each page in the Page Title area in the lower right corner of the screen.
9
Wahl Thermal Imaging Report and Analysis Software User Manual
Fig. 10
After clicking “Add” the Select Pic window will open. Navigate to the images and
select the desired image. The
will allow switching between different viewing
modes, including thumbnails, as shown. If the image has a voice recorded message with
it, when it is selected the
button will become active. Clicking
this button will allow playback of the audio tract.
Fig. 11
Once the image is selected, click on the Open button and the image will be loaded into the
10
Wahl Thermal Imaging Report and Analysis Software User Manual
image selection page and appear as below.
Fig. 12
To add additional photos, click “Add” and repeat the process.
When all the desired images are in, click on “Next” and the Table Information page will
show.
Fig. 13
This page allows selection of which tables or charts are automatically put in the report.
See the details in the following sections of this manual for definitions of the options listed.
After selection, click the “Finish” button and the report information page will be displayed
for confirmation, prior to the report generation. Click on the “OK” button to continue.
11
Wahl Thermal Imaging Report and Analysis Software User Manual
Fig. 14
The following report will be generated, which may then have text edited, images analyzed
and measurement objects installed, as detailed in the remaining sections of this manual.
The completed report will appear as follows:
Fig. 15
12
Wahl Thermal Imaging Report and Analysis Software User Manual
2. Software interface
Wahl Thermal Imaging Report and Analysis Software is a standard WINDOWS
application program.
It works with Windows XP or Windows 2000 Operating Systems.
This manual is based on the assumption that you are familiar with the Windows system,
and when necessary, please refer to the Windows operation manual, though some of the
characteristics of Windows are also explained in this manual.
2.1. The Main Operational Window
Fig. 16
When the Wahl Thermal Imaging Report and Analysis Software is started, the file
window of the software will also open.
The window size, shape and toolbar position will appear as it was the last time the
program was exited. The window of the Wahl Thermal Imaging Report and Analysis
Software may be changed in size, minimized, maximized or repositioned.
The top of the Wahl Thermal Imaging Report and Analysis Software interface contains
the title bar, followed by the menu bars. At the bottom of the Wahl Thermal Imaging Report
and Analysis Software interface is the state bar, which the user may set to display or hide.
There are six toolbars underneath the menu bar. The area below the toolbar is the
13
Wahl Thermal Imaging Report and Analysis Software User Manual
working space, where the report is generated and edited.
2.2. Menu bar
2.2.1. File menu
File Menu items function as in normal MS Windows environments. See section 3.6 for
Export to Word instructions and 3.10 for Batch instructions
2.2.2. Edit menu
Edit Menu items function as they do in MS Windows environments and as described later in
this manual.
14
Wahl Thermal Imaging Report and Analysis Software User Manual
2.2.3. View menu
Paper Color: selects background color of report.
Grid Lines: displays grid lines on report when enabled. Grid lines do not print.
Units Setting: allows selection of distance in Feet or Meters and Temperature Scale in
Fahrenheit, Celsius or Kelvin
Lock/Unlock: locks or unlocks position and size of images, measurement objects and
text boxes. Contents can still be edited or changed and object can be deleted.
Hide/Display Symbol: hides or displays image reference numbers attached to each
object.
Style: selects background color of report window.
Tool Bars: shows/hides selected toolbar.
2.2.4. Drawing menu
Drawing menu items function as they do in MS Word.
15
Wahl Thermal Imaging Report and Analysis Software User Manual
2.2.5. Windows menu
Windows menu items function as they do in MS Word.
2.2.6. Help menu
2.3. Toolbars
2.3.1. Standard toolbar
2.3.2. Format toolbar
2.3.3. Drawing toolbar
2.3.4. Play toolbar
2.3.5. Measure toolbar
16
Wahl Thermal Imaging Report and Analysis Software User Manual
2.3.6. Page control toolbar
2.3.7. Adjust toolbar
17
Wahl Thermal Imaging Report and Analysis Software User Manual
3. Getting Started
3.1. Create new report
After starting the software, a new report has been setup by default. If another report
needs to be created, it can be created by pressing the
button in the toolbar or by
selecting “File → New” in the submenu.
Fig.17
In the above window, users can choose to start with a blank report layout or use
one of the existing saved templates. The template file extension is “.rpm”.
3.2. Open up saved reports
If changes or verifications need to be done on saved reports, please press the
icon on toolbar or select from the file menu “File → Open” in submenu and the standard
Windows file dialog box will display. Select the proper file path and file to be edited and
then press the open button to open. The report file extension is “.rpt”. When the file
has been opened, a new sub-window will be opened automatically. The window looks as
below:
18
Wahl Thermal Imaging Report and Analysis Software User Manual
Fig. 18
3.3. Save report
After making changes or verifications to reports, the report needs to be saved by
pressing the
button on the toolbar or by selecting “File → Save” in the submenu.
The standard “File Saving” dialog box will display. By changing the file path or choosing
the desired file path, enter the file name and press the “save” button. The extension of
the report file is “rpt”.
Fig. 19
19
Wahl Thermal Imaging Report and Analysis Software User Manual
3.4. Save as report
If the original file is to be saved along with the edited file, the “Save As”
command should be used. By selecting “File → S ave As” in th e submenu, the
standard “save as” dialog box will display. S e lect the file path and enter the desired file
name, then press the “Save A s” button to save. If the new file name is the same as the
saved file name, the system will prompt you. The extension of the report file is “.rpt”.
3.5. Save as templates
The system is capable of saving any report as a template. The function of the
template is to ease report generation and provide consistency to your reports by
providing a “blank” report with locations for all the information to be used.
When a new “similar” report is needed, the corresponding template can be used. To save
a report as a template, select “File → Save As Template (M)” in the submenu and the
standard file “Save As” dialog box will display. Select the file path and enter the desired
file name, then press the “Save A s” button to save. If the new file name is t h e same
as the one of the saved file name, the system will remind you. The extension of the
template file is “.rpm”.
3.6. Export Report as MS Word File (2003 & 2007 Word only)
The system can convert the current operating page into a WORD file by selecting “File
→ Export To Word” in submenu, the standard file “save” Windows dialog box will display.
Select the file path and enter the desired file name, then press the “Save A s” button to
save.
After the MS Word file has been created the system will automatically display the enquire
dialog Window. If “yes” is chosen, the system will open up the converted MS Word file.
Note: Use of this function requires Microsoft Word versions 2003 or 2007 software
to be installed on your PC.
The system converts the Analysis Report into WORD files. Due to variations in
operating systems, there might be some differences in typesets and fonts that may
need to be adjusted by the user.
3.7. Print setup
The user can change the size of the page as needed by selecting “File → P rint
Setup” in submenu. The standard Windows print setup dialog box will display, as below:
20
Wahl Thermal Imaging Report and Analysis Software User Manual
Fig. 20
3.8. Print preview
User can view the created report in two ways:
1) Click on the
button on the toolbar;
2) By selecting “File → Print Preview” in the submenu, the preview interface is as
shown below.
Fig. 21
21
Wahl Thermal Imaging Report and Analysis Software User Manual
3.9. Print report
User can print out the report in three ways:
1) Click on the
button;
2) Select “File → Print” in the submenu;
3) On the Print Preview Interface, click on “Print” button. The “Standard Print Dialog
Box” as shown below will display.
Fig. 22
3.10. Batch process
The system can batch process reports of the same type based on a series of images.
Select “File → Batch” in the submenu and the following dialog box will appear.
Fig. 23
22
Wahl Thermal Imaging Report and Analysis Software User Manual
By selecting “Report” or “Picture”, a batch setting dialog box will appear, as shown
below.
Fig. 24
A file path or pictures that need to be processed can be selected. If “Picture” is
selected, click on “Next”, the “PIC Batch Setting” dialog will appear as shown below.
Fig. 25
23
Wahl Thermal Imaging Report and Analysis Software User Manual
The Transfer Type of “Palette” or “No palette” is selectable as is the “Palette type”.
Click on “OK” to confirm and automatically create the pictures that have been selected.
If the “report” has been selected, click on “next”, the “Select Template path” dialog box
will appear, as shown below.
Fig. 26
After the template has been selected, click on “OK”, the corresponding reports will be
automatically created according to the selected template.
3.11. Exit
By selecting “File → Exit” in the submenu, the system will display the confirming
dialog box. Click on “OK” to exit from the system.
24
Wahl Thermal Imaging Report and Analysis Software User Manual
4. Report generation and analysis
4.1. System interface
The main system interface is shown in the picture below. On top it contains the main
menu bar, common operator toolbar, page toolbar, word processing toolbar, objects toolbar
and analysis toolbar. The empty space is the report working area.
The best monitor resolution for this software is 1024 X 768.
Fig. 27
4.2. Composing the Report
The report consists primarily of infrared thermal images, image analysis data, CCD
pictures, formatted text, results lists, tables and objects, linear analysis and histograms.
The following sections explain the functions used to generate a report.
25
Wahl Thermal Imaging Report and Analysis Software User Manual
4.3. Operations of IR object
The IR object tool is used to display an infrared thermal image, it also can be used to
analyze and show the temperature of spots, lines and areas (rectangular and circle)
and data such as highest or lowest temperature. It can be used to playback the voice on
the saved infrared thermal images and display the corresponding CCD pictures. The
primary purpose is to create reports of the infrared thermal images.
4.3.1. Create IR object
Use the mouse to click on
infrared thermal image button in the objects toolbar
to activate the function. The button will be highlighted when active. With the button
active move the mouse to the plain space on the page and the mouse symbol will become
a cross-hair. When the mouse is positioned, left-click the mouse button and drag the
mouse to create a rectangular box on the page. Release the mouse button. Fig. 28
below shows the large rectangle with eight small black squares (sizing handles) as the
new IR object without the infrared thermal image installed. To resize the image, grab one
of the corner sizing handles and left-click and hold the mouse. Moving the mouse will
resize the image, while maintaining the proper image aspect ratio for the thermal image.
There is no limit to the number of IR images that can be put into a report, other than what
is limited by the capacity of system memory.
Fig. 28
26
Wahl Thermal Imaging Report and Analysis Software User Manual
4.3.2. Link IR object
The new IR object must be linked with the desired infrared file to be able to display the
infrared thermal image for analysis, if a previous infrared image has been linked, the new
image will replace the previous one. There are two way to do the link.
1) By menu
Move the mouse into the IR object and click on the right button, analysis submenu will
display as below.
Fig. 29
Click on “Open” in the submenu, the window with the infrared thermal image files will
display for preview, as shown below. Change the file path or select the desired infrared
file, then click on “Open” to select that image. The extension of the infrared thermal
images is “.jpg”.
27
Wahl Thermal Imaging Report and Analysis Software User Manual
Fig. 30
2) By double clicking mouse
With cursor in IR object area, double click on left mouse button, the image selection
window above will display. Change the file path or select the desired infrared file, then
click on “Open” to select that image.
4.3.3. Analyze IR object
4.3.3.1. Setup analysis
Image analysis can be performed after importing the infrared thermal image. Results
are displayed by various means and include Tables, Profiles and Histograms. See
sections 4.6, 4.7, 4.8 and 4.9 for details. Details for editing existing analysis objects are in
section 4.3.3.2. The analysis toolbar includes:
1)
Spot analysis (additional spots); enable the Spot analysis cursor by left-
clicking the mouse on the icon, move the mouse to the corresponding thermal image and
select the position to be analyzed (mouse symbol will be cross-hair). Click on left mouse
28
Wahl Thermal Imaging Report and Analysis Software User Manual
button to add a new analysis spot. There is no limit to the number of analytic spots and
the system will title the spots in order Point01, Point02, Point03…
2,
Instantaneous spot analysis; this button is similar to the spot analysis, but
displays the instantaneous measurement of the mouse location as it is moved on the
image. Left-clicking will add a permanent analytic spot to the current location.
3,
Line analysis; enable the Line Analysis cursor, move the mouse (mouse symbol
as cross-hair) to the corresponding thermal image and select the starting position of the
analytic line by pressing and holding the left mouse button. Move the mouse to the
desired end point and release the mouse button. A new analytic line will be created.
There is no limit to the number of lines that can be added to an image. The system will
title them in order, Line01, Line02, Line03...
4,
Rectangular analysis; enable the Rectangular Analysis cursor, move the
mouse (mouse symbol as cross-hair) to the corresponding thermal image and select the
starting position of the analytic rectangle by pressing and holding the left mouse button.
Move the mouse to create the desired shape and size and release the mouse button. A
new analytic rectangle will be created. There is no limit to the number of analytic
rectangles on the image. The system will title them in order Area01, Area02, Area03...
5,
Circle analysis; enable the Circle analysis icon and move the mouse
(mouse symbol as cross-hair) to the corresponding thermal image and select the start
position of the analytic circle by pressing and holding the left mouse button. Move the
mouse to create the desired size and release the mouse button. A new analytic circle
will be created. There is no limit to the number of analytic circles on the image. The
system will title them in order Area01, Area02, Area03.... Note the Circle and Rectangle
area numbers will share the area designators.
6,
Isotherm analysis; enable the Isotherm analysis icon and move the cursor (shown
as crosshair) to the color palette on the right side of the thermal image. Place the cursor on
the starting temperature, left-click and hold the mouse button, drag the cursor down to the
end point and release. The palette will show a uniform color for the entire range selected,
and corresponding temperatures in the image will show the same color. Isotherms allow
defined color ranges to be “highlighted” for easy analysis. A maximum of 10 Isotherms can
be placed on an image.
Section 4.3.4.3 shows the setup of the Isotherm, including color
selection.
29
Wahl Thermal Imaging Report and Analysis Software User Manual
Fig. 31
4.3.3.2. Modify analysis objects
To modify the infrared object analysis, the
button in the object toolbar must be
active, along with the infrared object to be adjusted.
The frame of the object will have
eight small black squares around its perimeter. If the object is not active, click on the
object to make it active.
Move the mouse on the infrared image and the mouse symbol
will determine the adjustment to be made in accordance with the following symbols. To
modify the object left-click and hold the mouse button and drag the mouse for the desired
change.
Cursor symbols for spot, lines and areas are as follows:
Move spot: moves spot in any direction
Move line: moves the entire line in any direction
Modify line: moves the selected end point in any direction
Move rectangle: moves rectangle in any direction
Modify rectangle: moves the selected segment vertically or horizontally
Move circle: moves circle in any direction
Modify circle: moves diameter of circle in or out
Modify Isotherm: Move the mouse inside the palette of isotherm area. The mouse
symbol will determine the adjustment to be made in the following 3 ways:
1) If the mouse is over the center the mouse will show crosshairs with arrows on the
ends. Clicking and dragging the mouse, then releasing, will allow the entire
30
Wahl Thermal Imaging Report and Analysis Software User Manual
isotherm to be adjusted up or down, while maintaining the same span.
2) If the mouse is at the top edge of the isotherm area, a pair of horizontal lines with a
vertical arrow going off each will appear.
Clicking and dragging the mouse, then
releasing, will allow the top edge to be adjusted up or down, increasing or
decreasing the total span.
3)
If the mouse is at the bottom edge of the isotherm area, a pair of horizontal lines
with a vertical arrow going off each will appear.
Clicking and dragging the mouse,
then releasing, will allow the bottom edge to be adjusted up or down, decreasing
or increasing the total span.
4.3.3.3. Delete analysis
To delete an Infrared Object Analysis, the
button in the analysis toolbar must be
active along with the infrared object. Use the mouse to move over the analysis object to
be removed and the mouse symbol will change to.
by left clicking the mouse button.
The analysis can then be deleted
After deleting an analysis cursor, the software will
automatically update result tables, profiles or histograms.
To delete an Isotherm A nalysis, the
button in the analysis toolbar must be active
along with the infrared object. Use the mouse to move over the isotherm area on the
palette and the mouse symbol will change to
. The Isotherm Analysis can then be
deleted by left-clicking the mouse button.
To delete all Analysis, move the mouse to the desired infrared image, right-click the
mouse button and in the infrared image analysis submenu and click on the “remove
analysis” function. This will clear all analysis functions from the image, including
isotherms. After deleting, the software will automatically update result tables, profiles or
histograms.
4.3.4. Infrared image parameters setup
The software allows the user to set parameters for the entire image in addition to
individual settings for Analysis Objects. Settings include emissivity, ambient temperature,
distance and humidity. To access setup menu, move the mouse to the desired infrared
image, right-click on mouse button to display infrared image analysis submenu and select
the “Setting” command. This will display the Setting window, which contains tabs for
Image, Object Parameters, Analysis, and Palette settings.
31
Wahl Thermal Imaging Report and Analysis Software User Manual
4.3.4.1. Image display setup
Fig. 32
Image settings are as follows:
Show Scale: controls the display of the temperature scale to the right of the image.
When checked the scale is displayed, and unchecked, the scale is removed.
Show analysis labels: controls the display of the analysis objects on the image.
When checked the labels are shown, and unchecked, they are not shown.
Measurements are still displayed in tables, profiles and histograms.
Update temperatures while moving analysis: controls weather temperatures are
displayed when analysis objects are moved. When checked temperatures are updated,
and unchecked, does not update temperatures.
32
Wahl Thermal Imaging Report and Analysis Software User Manual
4.3.4.2. Object Parameters setup
Fig. 33
Object parameters are global settings that affect the entire image. Multiple image
reports may have different object parameters for different images. Changing values will
not change Analysis parameters that have been individually set in the Analysis tab.
Emissivity: sets the emissivity for the image, scaling and measurements.
Distance & Relative humidity: compensates for distance and relative humidity, not
active in all versions.
Object Type: allows setting of emissivity from list of common materials.
Temperature: sets references and background temperatures, not active in all versions.
33
Wahl Thermal Imaging Report and Analysis Software User Manual
4.3.4.3. Analysis parameters setup
Fig. 34
Analysis settings allow the user to set parameters for each analysis object individually.
Analysis objects must be present on the image in order to adjust settings.
Analysis object drop down box: selects analysis object to be modified.
Colour: selects the color of the analysis object indicator and label.
Label: allows a name to be defined for the analysis object, along with the measurement to
be displayed with that label.
Options available depend on the type of analysis object.
Isotherm: allows selection of an individual Isotherm and its color to be displayed as.
Own Object Parameters: allows setting of parameters such as Emissivity, Distance,
Background and Reference Temperature for individual analysis objects.
Emissivity is active
on all versions but other functions may be inactive on some versions of software.
34
Wahl Thermal Imaging Report and Analysis Software User Manual
4.3.4.4. Palette setup
Fig. 35
Palette allows selection of the color palette used.
Palette drop down box: allows selection from the drop down box. The palette will
change upon clicking OK.
Invert: allows the user to invert the color assignments of the present palette.
4.3.5. Voice playback
If the selected image object has a voice annotation attached, the voice button
the analysis toolbar will be active. Click the button to playback the voice message. The
voice annotation will playback through the computer’s audio system based on the audio
settings of your system.
4.4. CCD image object
CCD images are digital visible light (VL) photos that are stored with the thermal image
for the purpose of clear identification of the Infrared Thermal Image. These images are
saved in .jpg format and are saved when “Link Save” is set to “On” in your cameras
settings. There are 2 methods to add the VL photo to your report.
1) This method is recommended for placing VL images that are taken with the
thermal image. Place the mouse cursor onto the desired image and right-click
35
in
Wahl Thermal Imaging Report and Analysis Software User Manual
the mouse button. Select “Show CCD” from the menu and the VL image will be
placed to the right of the thermal image. The VL image can be sized by selecting
the image then left-click and hold on one of the corner boxes and drag the mouse
to the desired size, then release the mouse button. Moving the cursor to the
image area will allow the image to be positioned.
2) This method is recommended for placing digital images taken by another camera.
Use the mouse to click on the Photo Object button
in the objects toolbar to activate
the function. The button will be highlighted when active. With the button active move
the mouse to the plain space on the page and the mouse symbol will become a crosshair. When the mouse is positioned, left-click the mouse button and drag the mouse to
create a rectangular box on the page. Release the mouse button. Right-click in the
image area and select Open. Navigate to the desired file and double click on the file.
To resize the image, grab one of the corner squares and left-click and hold the mouse.
There is no limit to the number of VL images that can be put into a report, other than what
is limited by the capacity of system memory.
The report images will appear as in Fig. 36.
Fig. 36
4.5. Text Tool
The Text Tool editor is a powerful text editor that supports multi-formatted text in the
same Text Box, including Fonts, size, alignment, etc... Text boxes can be placed for
titles, customer information, findings, summaries, recommendations and so forth. There
is no limit to the number of text boxes that can be included into the report. To insert a
Text Box:
Click on the text tool
in the objects toolbar to activate the function. The button will
be highlighted when active. With the button active move the mouse to the plain space on
the page and the mouse symbol will become a cross-hair. When the mouse is positioned,
left-click the mouse button and drag the mouse to create a rectangular box on the page.
36
Wahl Thermal Imaging Report and Analysis Software User Manual
Release the mouse button and a text box will be placed. To adjust position or size of text
box, left-click in the box and the border with 8 small squares will appear. To adjust
position place the cursor on the box outline between the small squares, and when it
becomes 4 arrows, left-click and hold, drag the mouse and release when in proper
position. To adjust size, move the mouse over one of the 8 small square blocks, left-click
and hold and drag the mouse in the direction of the arrows. Release when mouse button
when size is properly adjusted.
4.5.1. Change font and align mode
Fig. 37
Select the text to be modified, and use the tool bar to select the text font, size, bold,
italic, underline and alignment.
4.5.2. Cut, Copy, paste text contents
Formatted text objects can be cut, copied or pasted between the Clipboard and report.
To cut, copy or paste, select the text or position, right-click on the mouse and select the
appropriate action from the submenu.
4.5.3. Change text, line and background color
Select the text to be modified and use
the desired text color; use
button in main interface toolbar to select
button in main interface toolbar to adjust line color; use
button in main interface toolbar to adjust line thickness; and use
button in
main interface toolbar to select the background color needed. The color selections are
shown in Fig. 37, below.
Fig. 38
37
Wahl Thermal Imaging Report and Analysis Software User Manual
4.6. Result table tool – setup
The result table is used to show user selected infrared object parameters in a table
format. Click on the result table button
in the object toolbar to make it active.
Move the mouse to plain space on the page, the mouse symbol becomes a cross-hair,
left-click and hold the mouse button, then drag the mouse to adjust the position and width
of the table. Release the button and the blank result table will appear.
The result table now has to be linked with the corresponding infrared objects to display.
Place the mouse cursor in the result table and either double click the left mouse button or
right-click and select “Properties...” The following properties box will display.
Fig. 39
Select the desired IR image, and then select the Object to be added. The value items
will change in accordance with the Object selected. Check the Value item to be included
in the table. Multiple items from different objects can be added to the table in the same
edit session. Click on “OK” to confirm, and the selected parameters will display in the
Result Table on the report. Press “cancel”, to abort the edit. The result table after
selection is shown below.
38
Wahl Thermal Imaging Report and Analysis Software User Manual
4.7. Table tool - setup
The Table Tool allows generation of a customizable table consisting of user edited text
and selected infrared object parameters. Click on table tool button
in object
toolbar to make it active. Move the mouse to plain space on the page, the mouse
symbol will become a cross-hair, left-click and hold the mouse button, then drag the
mouse to adjust the position and size of the table. Release the button and the following
table submenu will appear. Enter the number of rows and columns desired, click OK and
a new result table will be created.
Fig. 40
To enter text information, left-click in the desired cell and the text editor will allow text
entry.
To enter infrared object parameters, right-click within the desired cell and the following
Properties menu will display.
Fig. 41
39
Wahl Thermal Imaging Report and Analysis Software User Manual
Select “Field” and the following Properties box will display.
Fig. 42
Select the desired IR image, and then select the Object to be added. The value items will
change in accordance with the Object selected. Check the Value item to be included in the
table. Multiple items from different objects can be added to the table in the same edit
session. Click on “OK” to confirm, and the selected parameters will display in the Result
Table on the report. Press “cancel”, to abort the edit. The result table after selection is
shown below.
4.8. Profile tool for Line Analysis
The profile tool is used for analysis of Line Cursors in the infrared object. Click on
profile tool button
in object toolbar to make it active. Move the mouse to plain space
on the page, the mouse symbol will become a cross-hair, left-click and hold the mouse
button and drag the mouse to adjust the position and size of the Profile graph. Release
the button and the Profile graph will appear.
The linear analysis object has to link with the corresponding infrared object to show
the proper result. To link and edit the table either double click on the table or position the
mouse on the Profile graph, right-click and select “Settings”.
menu will open.
40
The following Properties
Wahl Thermal Imaging Report and Analysis Software User Manual
Fig. 43
Settings Tab:
Options: enable display of the Gridlines, Legend or Result table within the graph.
Profile Display: selects display parameters for the graph. The longest line is used fill
the graph’s x-axis. Align left shows shorter lines only going part way across the screen.
Stretch will stretch shorter lines to fill the x-axis also.
Temperature Axis: sets the y-axis temperature scale values. IR-Scale sets to match
the IR scale set on the thermal image. Auto sets it to min and max of the image data.
Fixed sets it to the values entered into the Max and Min fields.
Compart line colour: sets the color of the vertical cursor. To move the cursor, align the
mouse cursor over the line until 2 vertical bars with horizontal arrows appear and left-click
and drag the mouse to the correct position. Values of all lines will be displayed in the
Result table below the graph. Cursors will be placed on the Line analysis lines in the IR
image showing the corresponding location of the vertical cursor on the graph.
Colour tab:
IR image number: selects the image number for which the graph is associated with.
Lines: allows selection of which lines to include on the graph. Null is the default for
lines that have not had their names changed in the image. If names have been changed,
the new name will appear in this column.
To change the color, click on the color bar to the right of the selected line, and then click
on the pop up box designated by “...”. Select the desired color and press OK.
41
Wahl Thermal Imaging Report and Analysis Software User Manual
Fig. 44
Fig. 45 shows an example of the line analysis and its corresponding IR image as it
appears in the report.
The result table displays Min, Max and Cursor value for each
line assigned to the graph.
Fig. 45
42
Wahl Thermal Imaging Report and Analysis Software User Manual
4.9. Histogram tool for line or area analysis
The histogram tool gives a visual representation of the temperature distribution across
a line measurement or area cursor. The X-axis gives the temperature and the Y-axis
gives the relative percentage of a given temperature. To add a Histogram, click on the
Histogram tool button
on the object toolbar to make it active. Move the mouse to
plain space on the page, the mouse symbol will become a cross-hair, left-click and hold
the mouse button and drag the mouse to adjust the position and size of the Histogram.
Release the button and the Histogram will appear.
The Histogram object has to link with the corresponding infrared object to show the
desired results. To link and edit the table either double click on the table or position the
mouse on the Histogram, right-click and select “Settings”. The following Properties menu
will open.
Fig. 46
43
Wahl Thermal Imaging Report and Analysis Software User Manual
Histogram Connect tab:
IR image number: selects the image number for the Histogram to be associated with.
Area number: selects area object and the specific area number.
Line number: selects line object and the specific line number.
Fig. 47
Histogram Settings Tab:
Gridlines: displays vertical gridlines on the chart when selected.
Under-overflow classes: displays additional data above or below the span settings.
Class values: displays percentage of each class when selected.
Class limits: displays class values in degrees when selected.
Threshold: displays area designator at bottom of graph.
Number of classes: adjusts resolution of classes. Example: A setting of 20 with 10°
span would have 0.5° per class.
Temperature Axis: sets the y-axis temperature scale values. IR-Scale sets to match
the IR scale set on the thermal image. Fixed sets it to the values entered into the Max
and Min fields.
4.10 3D map object tool
This tool generates a 3D view of the image with relative temperature as the third
dimension. To add a 3D Map, click on the 3D Map tool button
on the object toolbar
to make it active. Move the mouse to plain space on the page, the mouse symbol will
44
Wahl Thermal Imaging Report and Analysis Software User Manual
become a cross-hair, left-click and hold the mouse button and drag the mouse to
adjust the position and size of the 3D map. Release the button and the 3D Map area will
appear.
The 3D Map object has to link with the corresponding infrared object to show the
desired results. To link and edit the table either double click on the table or position the
mouse on the 3D Map area, right-click and select “Settings”.
Settings window in Fig. 48 shows a preview of the image, with the setup menu
consisting of the following items.
Select Scope to Render: allows selection of the image, or portion of, to be 3D
rendered.
Show Infrared Object: selects entire Infrared object for rendering.
Show Rect Analysis Object: allows a portion of the image to be rendered. To select
this, first add a rectangular area analysis object to the image.
IR image number: selects the image number to be rendered.
Area number: when “Show Rect Analysis Object” is selected, selects the area to
render.
Adjust View model: allows adjustment of the image.
Rotate X Axi: rotates image in X axis.
Rotate Y Axi: rotates image in Y axis.
Scale: sets relative magnification of the image
BG Color: selects background color of the image
OK: confirms the analysis and places the final image on the report. Only the image
appears on the report. To make changes, right click
Fig. 48
45
Wahl Thermal Imaging Report and Analysis Software User Manual
Fig. 49 shows the same image rotated +21° in the X axis, +42° in the Y axis and scale set
to 14.
Fig. 49
Fig. 50 shows the same image with Rectangular analysis selected, rotated -10° in the X
axis, -40° in the Y axis and scale set to 27.
Fig. 50
4.11. General operations of object
Select object
Click on
in toolbar to make it active, click on report object to be selected; eight
sizing handles (small black squares) will appear around the perimeter of the frame. The
object is now active. Note: Use mouse to click on the frame to select text object.
46
Wahl Thermal Imaging Report and Analysis Software User Manual
Move object
All objects can be moved around the page. After selecting the object and with the
mouse cursor in the image so 4 arrows are displayed, left-click and hold mouse button,
drag the mouse to the desired position and release.
Change object size
After selecting the object, move the mouse over one of the black sizing handles and
right-click and hold the mouse button. Move the mouse in the direction of the arrow to
the desired size, then release mouse button. Note: IR and CCD images will maintain the
proper aspect ratio and all center sizing handles may not work.
Copy, Cut, Paste and Delete
These functions work just like in popular word processors and are available either in
the “Edit” drop down or by right-clicking on the object to be modified. The only difference
is the objects are placed near their origin and are then moved to the final destination after
pasting. Copy, Cut and Paste should be used to move images between sheets as
images cannot be dragged from sheet to sheet. Delete will allow deletion of any table,
image or text box.
4.12. Page operations
Add page
Used to create multipage reports by clicking on “Add page” button
in main
interface, which will display Add Page dialog box, as shown below. Pages can be added
to beginning or end of report or before or after current page. Page titles are only used on
by the page selection function on the Page Management Toolbar.
Fig. 51
47
Wahl Thermal Imaging Report and Analysis Software User Manual
Delete page
On plain space of the page click on mouse right button to display submenu, select
delete” or click on
button in control toolbar to delete current page. After deleting,
report needs refreshed by going to the dropdown page selector in the Page Management
Toolbar and select a page other than the one being displayed. Note: deleting the page
will also delete all contents in the page.
Move page
Note: Move page is currently not activated in all versions. To use page management
System, Click on the following icons located on the page management toolbar, to move
through the pages.
Go to first page
Go to previous page
Go to next page
Go to last page
Go to page entered
Zoom in, zoom out and zoom to fit
Using the page management toolbar in main interface to zoom in or out the page and
adjust the vision.
Zoom in
Zoom out
Zoom to fit
234 Old Weaverville Road, Asheville, NC 28804
Toll Free: 800-421-2853 • Phone: 828-658-3131 • Fax: 828-658-0728
www.palmerwahl.com
[email protected]
48