1
User Manual for
Rotas Archive Evaluation
Discom GmbH, Göttingen, Germany
Contents
Archiving Acoustical Measurements
1
Introduction .........................................................................................................................1
Organisation and Designation of Archives ..........................................................................2
Archive Settings in the Rotas Measurement Program .........................................................3
Selecting Archive Sorting....................................................................................................5
Automatic Presentation........................................................................................................7
Store Additional Information in an Archive ........................................................................9
Evaluation of acoustical measurements
10
The Evaluation Program ....................................................................................................10
The Presentation’s Control Dialog.....................................................................................11
Section „Archive“................................................................................................11
Section „List“ ......................................................................................................13
Section „Data“.....................................................................................................15
Section „Graphics“ ..............................................................................................15
Section „Database“..............................................................................................17
Section „Macro“ ..................................................................................................17
Displaying Measurements..................................................................................................18
Assigning a graphic object ..................................................................................19
Displaying data....................................................................................................20
Further Display Options ......................................................................................21
The Active Item...................................................................................................22
Complete the Display ........................................................................................................24
Colored Curves....................................................................................................24
Printing Graphics ...............................................................................................................26
Managing Layout Pages.....................................................................................................26
Hints to Manage Layouts.....................................................................................27
Names and Instance Names.................................................................................28
How to work with the list of measurements ......................................................................29
Exporting Data...................................................................................................................31
Exporting Graphics..............................................................................................31
Excel-Export........................................................................................................31
Macros ...............................................................................................................................33
Make a Macro and Use It ....................................................................................33
Editing Macros ....................................................................................................35
Rotas Archive Evaluation
Contents • i
Archiving Acoustical
Measurements
Introduction
The Rotas measurement program gives the opportunity to store test data. These
data are stored in so called archives in a special file format. This file format
allows to bundle different measurements and to store multiple single
measurements in one archive file.
The complement of the archiving measurement program is the evaluation
program, called „Presentation Tool“. This program reads archive files, displays
and evaluates the content (measurement data). While the measurement program
Rotas can only be started on a PC which is equipped with signal processor
cards, the presentation tool is applicable on almost any PC. The presentation
tool is based on the Discom application “Compass”.
Both programs, the Rotas measurement program and the Compass program
have a modular structure. Their functions are carried out by modules, which are
assembled followed the principle of a construction kit.
For the Rotas measurement program it means that the function „Archiving of
measurements“ is fulfilled by one or two independant modules and not all Rotas
applications include this function. The presentation itself consists of modules
either, but here only one module serves the function “Read and Evaluate Data”.
Other modules allow to display the data in different graphical figures.
Rotas Archive Evaluation
Archiving Acoustical Measurements • 1
Organisation and Designation of Archives
The Rotas archiving function in the measurement program is carried out by two
modules. One module is the “archive writer”. It collects the measurement data
you want to archive and bundles it in an archive file. The second module is the
“concatenator”, which assembles archive files created by the writer and sorts
them according to different criteria.
Both modules allow a variety of options for archiving measurements:
•
Numbered files: every single test (test cycle) gets its own file. Files
are automatically numbered (“Test_001”, “Test_002” etc.)
•
Serial numbers: As for numbered files, each test gets its own file, but
they are named after the serial number of the candidate. (This option
naturally implies that the measurement program currently knows
serial numbers.)
•
Several measurements per file: As for numbered files, but here,
each file contains e.g. 20 test runs and not only one.
•
Files are sorted according to Type / Day / Calendar Week: The
archive concatenator generates its own archive on the basis of the
above mentioned criteria and assigns every measurement to the
corresponding file. That way, all measurements of e.g. the same type
can be bundled together.
•
Week Days: The archive concatenator generates an archive for each
week day (Monday, Tuesday, ...). After a week, the file from the
previous week is deleted and a new one is created.
Archive names depend on the selected archiving and sorting method. All
measurement archives have the same file extension “.rdt”.
Rotas Archive Evaluation
Archiving Acoustical Measurements • 2
Archive Settings in the Rotas Measurement Program
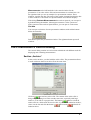
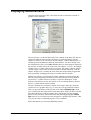
If you want to make settings for archives, open the window System
Configuration first. It is normally covered by measurement display windows.
If it has not been opened, go via the menu File:New. You will see a window
like that:
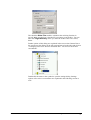
This window shows the module configuration of the Rotas application. The
modules are organized in a tree, the so-called “system tree”. The module
configuration and the system tree content differ between applications (depend
on the real test application). In each case the application contains “Host Pc” as
the lowest object entry. Click on the small + in front of the “H”-symbol to open
the list of modules in the container “Host Pc”.
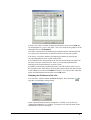
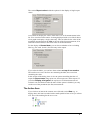
Now, search for the object “Archive measured data” among the modules in the
“Host Pc” container and in its submodules. You may find it directly in the
container Host. Otherwise, open further lists of submodules (click on +) to
search for it. Most configurations have “Archive measured data” in the list of
modules pertaining to “Measurement Data”:
Doubleclick the symbol or the name to open the settings dialog for archiving:
Rotas Archive Evaluation
Archiving Acoustical Measurements • 3
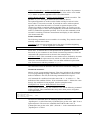
The checkbox Write Files enables or disables the archiving function in
gereral. Make sure the box is checked if you want to get an archive. You can
enter the Target directory where you want the archive files to be stored,
below.
Further options of this dialog are explained in the next section. Return first to
the system tree (the dialog can be left open and moved to the side) and click on
+ belonging to the item “Archive measured data”. You will see the archive
concatenator:
Doubleclick the name or the symbol to open the settings dialog. Settings
options of the archive concatenator are explained in the following section as
well.
Rotas Archive Evaluation
Archiving Acoustical Measurements • 4
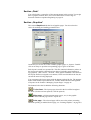
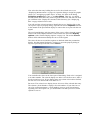
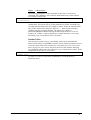
Selecting Archive Sorting
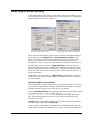
In the setting dialogs of the archive writer and the archive concatenator you set
how the final archive files are named and sorted. (See the section “Organisation
and Designation of Archivess” on page 2.)
left: Dialog of the Archive writer
right: Dialog of the Archive concatenator
Please note that both modules can be activated or deactivated independently of
one another (by setting Write Files or Concatenation is active). If you
deactivate the writer, no archives are generated. If you deactivate the concatenator, you will get the files which have been created by the writer. If the
concatenator is active, it “glues” the files the writer created into sorted archives.
In both dialogs you have to enter a Target Directory. This is the directory
where the archive files are stored. When the concatenator is running the writer
generates only temporary files. Nevertheless, a valid directory must be entered
where the writer can store these temporary files. It can be the same directory as
for the concatenator.
Furthermore, you will need to give a Base name in both dialogs. The names
of the archives are given by adding further specifications to the base name (e.g.
the serial number).
Archives without concatenator
If the concatenator is deactivated, there are several options for the files created
by the writer: Numbered files, filenames including the serial number, filenames
including the time stamp (the time when the test was started).
Check the Numbered Files box in the dialog. The files which are then created
are named Base name + counter number, like Track_0001.rdt,
Track_0002.rdt, Track_0003.rdt etc. The numbers are 4-digit, that means
after 10,000 measurements, the new ones will overwrite the previous ones,
using the same name.
Counter displays the number which assigns the next or current test run. Reset
counting to 0001 with the button Reset to 1.
As an alternative or in addition to a number, the serial number and/ or the time
stamp can be included in the filename. If you want to use the serial number, the
Rotas Archive Evaluation
Archiving Acoustical Measurements • 5
test bench control of the measurement program must have access to a serial
number. In general, the test bench transfers a serial number to the Rotas
measurement program before finishing the test cycle. If you want, you can add
the time stamp to the serial number (the time when the test was started). If you
do so, repeated measurements of the same candidate result in different
filenames. For example, a test of a candidate with the serial number AB678 at
11:57 will result in a file name AB678_11-57.rdt. (Actually, the filename
contains a detailed time stamp, including year, month, day, hour, minute,
second.) If you don’t have access to a serial number, you can also use the
basename and the time stamp alone.
Please note, that you will continuously get new files when you name with serial
numbers or time stamp, and that previous measurements will never be
overwritten. (Thus, different to numbered files, where the maximum archive
number is 10000). In this way, you will never loose measurements, but you
have to be careful that the PC hard drive does not fill up.
Archives with Concatenator
The concatenator’s task is to sort the single archive files created by the writer
and add them to larger archive files. For example, if you have the concatenator
sort by type, it will produce one archive for each candidate type which contains
all measurements of candidates having that type.
The concatenator offers the following sorting methods:
Sorting by Week: Archives are named by calender weeks, like Base name +
Week number (like Archive_13.rdt for the 13th calender week). All tests which
have been carried out within one week are attached to the week file. After a
year, all measurements are added to the first file, so that old archives are not
overwritten. (Note: As per calender, week no 1 is the first week of the year that
begins with a Monday. The days before are officially part of week 53 of the
previous year. However, the concatenator will count these days as week 0.)
Sorting by Day: Similar to weeks, but names are given by days (in a year).
For example, all measurements of April 24, are filed in Base name_114.rdt (or
115 in leap years). Here again, after a year, measurements are added to the file
of the previous year.
Sorting by Type: Measurements are sorted by candidate types. The
concatenator generates file names like Base name_Type designation.rdt and
attaches each measurement to the corresponding archive.
Sorting by Type & Week: The concatenator generates sub directories named
by calendar weeks (see above sorting by weeks). In these week directories,
archives are generated according to Sorting by types, see above.
Sorting by Weekday: The concatenator generates seven archives, which are
named by weekdays: Base name_Monday.rdt, Base name_Tuesday.rdt etc.
For example, all measurements of Wednesday are attached to the archive of
Wednesday. After a week (next Wednesday), all previous measurements are
deleted and a new archive file is being started. This way, you will always have
the measurements of the last seven days, so you don’t have to worry about
filling up the hard disk and having to delete measurement files.
All in Target File: All measurements are attached to the archive Base
You will get only one, probably very large file.
name.rdt.
Rotas Archive Evaluation
Archiving Acoustical Measurements • 6
Note: If you activate the concatenator, no measurements (except for the option
Weekdays) will get lost, however, you need to prevent accumulation of files by
cleaning off your hard drive regularly.
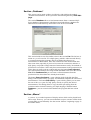
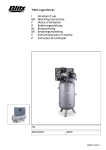
Further Options
The dialog of the archive writer has a button with a balloon icon in the upper
right corner. If the button is pressed, the archiver emits messages about written
archives in the window StdOut.
By selecting the option Show Alert Messages you will get the same
function for the file concatenator. One side effect of this option is that when an
error is encountered (like a write-protected file) a dialog opens which interrupts
the Rotas program. This dialog is closed by clicking OK. You should activate
“Show Alert Messages” only if you are working in the vicinity.
The concatenator’s activities are visible in the fields Last File and Pasted to.
If the concatenator is deactivated and you want to sort previous measurements
now, go via the Manual... button.
Automatic Presentation
You can remotely control the presentation program (which is described in the
rest of the handbook) from within the Rotas measurement program. In this case,
at the end of each measurement cycle the presentation program will be ordered
to load the archive file containing the previous test cycle, display the containing
data in a way which you have preselected and send it to the printer. (The exact
moment of this function is after the writer has written the archive file and before
the concatenator glues it.) You will find the module “Presentation Remote
Control” controlling this function as submodule of the archive writer and
sibling module of the concatenator:
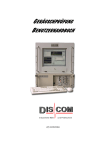
You make the necessary settings in the setting dialog of this module:
Rotas Archive Evaluation
Archiving Acoustical Measurements • 7
First of all, you can activate of deactivate the automatic presentation with the
check-box Automatic Presentation active.
If you activate automatic presentation, make sure that the presentation program
is running. The measurement program is not capable of starting the presentation
program. Only a running presentation program can be controlled remotely.
Enter in Window title of presentation-application the name from the title
bar of the presentation program. The measurement program finds the
presentation program using this title. If no window with this title can be found,
no automatic presentation will be done and you will get an error message.
Enter in Macro-Name the name of the macro which shall be executed after the
archive has been loaded. Marcros will be explained in the second part of this
manual.
You can test the remote control function by presseing the button Go!. Before
you do this, enter a valid archive file in the area Manual / Test or select it via
Browse....
Make sure that the correct printer has been defined as standard printer for
windows. Normally, you can’t use a printer on LPT1, since the measurement
program communicates with the DPM42 signal processor cards via this port.
Rotas Archive Evaluation
Archiving Acoustical Measurements • 8
Store Additional Information in an Archive
The content of an archive is mostly automatically defined: all evaluatable
mesurement data. In addition to that, start time of the test, candidate type, serial
number, test bench ID and evaluation result of the test are stored. Furthermore,
you can store additional informations like for example the name of the test
operator. All information which is stored in Rotas’ seas like Application sea,
Candidate sea, Sps sea or Messages sea can be stored in an archive.
Enable this function by adding a list of the following form to the Rotas’
Application sea:
AdditionalArchiveInfos: {
Pruefer
Application
WheelRName
Candidate
}
Every line of the list contains two entries. The first one defines the name of a
resource in the Rotas’ sea defined by the second entry. In the example shown
above, a resource named „Pruefer:“ in the Application sea and a resource
„WheelRName:“ in the Candidate sea would be read and their values copied into
the archive. The presentation can read this information then.
Resources from the Candidate sea are important since their origin can be the
parameter database.
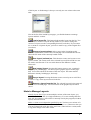
The archive writer allows to display the actual values of the additional archive
informations. Right click on the archive writer module to open its context menu.
Select Archive contents:
The archive contents dialog opens. You see the components of the archive in
the upper part. (They reappear as chapters in the content list of the archive
later.)
In the lower part, the additional archive informations are listed. If you open this
dialog after a measurement has been made, you can see the current values as
well.
Rotas Archive Evaluation
Archiving Acoustical Measurements • 9
Evaluation of acoustical
measurements
The Evaluation Program
In general, the evaluation program is named „Presentation Tool“ and you find it
in a subdirectory of C:\RotasData\ or in a subdirectory of the current
measurement application. Some systems provide a desktop link to open the
presentation program.
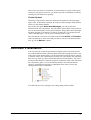
If you start the presentation, you may see the following figure:
Maybe not all windows shown above have been opened or other additional
windows have been opened, also. The different windows have the following
functions:
In the top left corner of the figure, you see a window „ComPass Modules“. This
is the system tree window of the application similar to the system configuration
window of the measurement program (see “Archive Settings in the Rotas
Measurement Program” on page 3) The large dialog Evaluate
Rotas Archive Evaluation
Evaluation of acoustical measurements • 10
Measurements on the left hand side is the control window for the
presentation. You select archive files and measurements to evaluate here. On
the right hand side you see an example for a presentation window. These
windows visualize the data. The usage of the graphic elements that display data
in these windows is described in a separate manual “Presentation display”.
If the dialog Evaluate Measurements has not been opened, you can open it
by doubleclicking the module „Messungen Auswerten“ in the system tree.
If the system tree has not been opened either, you can open it via the menu
File:New.
You can open a selection of some presentation windows with toolbar buttons
below the menu bar:
Each button opens one presentation window. The rightmost button opens all
windows.
The Presentation’s Control Dialog
The control dialog contains several sections which deal with different tasks for
displaying and evaluating measurements.
Section „Archive“
In the section Archive, you deal with the archive files. The presentation allows
to work with more than one archive file at the same time.
Click on
, to load one archive file. The content of the archive file is
being analysed during load. This can take some time, especially with large
allows to load all
archives. (You will see a progress bar). The button
archive files in a folder with one mouse-click. If you want to unload an archive,
. The button
unloads all
select it in the list and click the button
loaded archives.
Rotas Archive Evaluation
Evaluation of acoustical measurements • 11
You can delete single measurements from archives using the list of
measurements in the section List (see below). After doing this, you should use
the button Cleanup to reorder the archive file. It will be removed from the list
at the same time.
It is harmless to open an archive while the concatenator of the measurement
program adds data to it. Only the new data won’t be added to the list
automatically. Press Re-read to update the list.
If you select an archive file and click Mark content, the corresponding
measurements will be marked in the section List (see below).
If you activate the option Automatically reread archives at next
program start all archives which have been loaded when closing the
presentation program will be re-loaded and analysed immediately on start of the
presentation program.
Filter-Functions for Loading Archives
If you have archives or folders containing many measurements, you may not
want to load all data every time, since the analyzing process on load takes some
time. Thus, you have the opportunity to use a filter and load only the
measurements you want to evaluate.
You can either define a filter which is used automatically on load of every
archive file, or use the function „Load Preselection“ (see below).
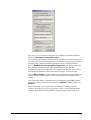
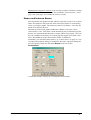
Defining a global filter is done by activating the check box Filter next to the
button
which you have to press next. You see the filter dialog:
Enter here, which measurements you want to load. In the figure shown above
only measurements of candidates of the type “ABC” will be loaded where an
additional information “OperatorName” exists and has the value “Charly” and
which contain spectrograms in test section “VL”. Leave those fields blank
where you don’t want to make a selection (like the serial number and the test
bench in the figure) and disable the check in front of time, if you don’t want to
use this criterium.
Rotas Archive Evaluation
Evaluation of acoustical measurements • 12
From now on only those measurements will be loaded from the archives which
match the filter criteria above until you disable the control box Filter (or
change the filter criteria).
The criterium Minimum archive size is used anytime, even if you have
disabled the filter. For this reason, you find it on the Archive page directly. If
you want to disable the minimum file size check, set the value to 0.
Load Preselection
Press the button
. You get the normal file select dialog first where you
can select one or more archives. But these archive files will not be loaded and
analysed automatically. Instead, you will see a list of all measurements in that
archive (similar to the list in the section List). In this list, select the measurements you want to load by mouse-click. You can sort it by clicking the column
headings to simplify the selection of likewise measurements (e.g. same type).
After pressing OK only the selected measurements will be loaded.
Remember: Measurements which have already been loaded are not displayed in
the preselection list.
Section „List“
In this section, every single test cycle from the loaded archives is listed:
The list displays the „General Information“ of each test run, being: Start Time,
Serial, Type and Test Bench. You can sort the measurements by clicking on the
heading of a category.
You can mark measurements in this list and you can make a measurement
prominent. The data (curves) of marked and prominent measurements will be
drawn with different colors. There is one difference between marking and
making prominent: You can mark multiple measurements, but only one
measurement can be made prominent.
If you want to mark a measurement, select it in the list and press the button with
the green arrow. The selected measurements are marked in the list with the
same symbol:
Rotas Archive Evaluation
Evaluation of acoustical measurements • 13
You have two colors available to mark measurements. In the section List they
are distinguished as „green“ and „pink“. The colors used for the graphics can be
changed in the section Graphics.
You make a measurement prominent by pressing the button with the blue ball.
As expected, the measurement is marked in the list with the same symbol.
You remove a selection (marking and making prominent) by pressing the
corresponding button (arrow or ball) another time.
If you double click a measurement in the list, this measurement is treated with
the same action you carried out last. Thus, if you used the pink button for
marking last, the pink marking is used once again.
In addition to the already mentioned buttons, you find a button with an eye in
the top right corner of the dialog. Pressing this button redraws the data selected
in the contents list of the section data (see below). You will see later what that
means and which further function the section list allows.
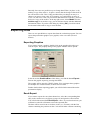
Selecting the Columns of the List
You can select, which columns the list shall display. Press the button
open the corresponding settings dialog:
to
Select which information shall be included as a column. You can also use
„Additional Information“ as columns. You only have to enter the name of the
information as shown in the figure.
Rotas Archive Evaluation
Evaluation of acoustical measurements • 14
Section „Data“
You will find the „content list“ of the measurements in this section. You assign
data to graphic elements here. The section Data allows a wide range of
functions which are explained beginning on page 18.
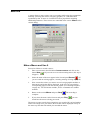
Section „Graphics“
The section Graphics holds the list of graphic pages. You also select the
colors for marking and making prominent here.
On the left you see the list of the available graphic pages or „layouts“. Double
click on an entry to open the corresponding page or get it to the front.
Each layout is stored in a separate file. This file contains information, where on
the layout each graphic element has been placed, including page headings or
logo graphics. (The contents – the data - of the graphic elements is not stored in
this layout file but is assigned to at runtime.) In the text field below the list, the
current file name is being displayed.
You can manage the layout pages with the buttons right of the list. The topmost
button loads another layout into the list. Further details about the management
of layouts can be found in “Managing Layout Pages” on page 26.
The buttons below the list hold the following functions:
„To the front“: The layout page selected in the list will be brought to
the front. (If it has not been opened, it will be opened.)
„Wipe page“: All data (measurement curves, etc.) in the graphic
elements of the selected page will be “wiped out”.
„Print page“: The selected page will be sent to the printer (assuming
automatic printing is enabled for this page, see “Printing Graphics” on page 26).
Rotas Archive Evaluation
Evaluation of acoustical measurements • 15
„Print all pages“: All open layout pages will be sent to the printer at
once.
Select printer: If this checkbox has been checked, the usual windows printer
dialog opens if you press one of the „Print“ buttons. This means, you can select
a printer and make further printer settings. If Select printer has been disabled,
the current standard windows printer will be used without hesitation.
On the right, you define the colors which are used for marked and prominet
curves on the grahic pages.
Rotas Archive Evaluation
Evaluation of acoustical measurements • 16
Section „Database“
This section can be made visible or invisible by right clicking the module
„Evaluate measurements“ in the system tree and selecting the enrty View SQLpage.
The section Database allows to load measurements from a connected SQLServer database. Measurements which have been loaded from a database are
added to those loaded directly from archive files in the section List.
This section holds its own list similar to that in the section List. The list here is
meant as a preselection list. Via a SQL-Query (which is either entered directly
or constructed using the assistent), this list is filled with references to
measurements in the database. Since the actual load of the measurement data
takes some time (especially if you load via a network connection) and since a
SQL-Query can produce a huge amount of measurements easily, the method of
preselection is used here. Select only those measurements in the preselection list
whose data you really want to evaluate and press the button Load selected.
The selected measurements are being loaded and added to the list in the section
List. With Condense list you can remove all measurements from the
preselection list, whose data have already been loaded.
The button Query-Assistent... opens a dialog which looks like the filter
dialog of the section Archive (see page 12) and which simplifies the selection of
measurements. The button SQL-Query... opens a dialog where you can enter
the text of the WHERE-part of a SQL Query directly to specify the desired
measurements. This dialog allows to copy the time span setting form the
assistant window instead of entering it in SQL-language. With the button
Database... you can control which database the program shall use as data
source
Section „Macro“
A „macro“ is a recorded sequence of display actions which can be played-back
like a script. That way, you can run an automatic script to execute actions which
you normally execute manually. See the section “Macros” beginning at page 33
for further details.
Rotas Archive Evaluation
Evaluation of acoustical measurements • 17
Displaying Measurements
Open the tab section Data. This is the main section to control the creation of
graphics and evaluations.
The tree structur e on the left hand side is the contents of the data. The data are
ordered in different main sections (the first level of the hierarchy), like the
chapters of a book. You will always find the chapter “General Information”. It
contains general informations about the measurement. You have already seen
this information in the section List. Whether there are other chapters depend on
the presence of other data in the archive file. The chapter “Curves” for example
contains order (or other value) tracks over speed. The chapter “Report Values”
contains single values which are measured and evaluated seperately. And the
chapter “Report texts” contains the texts which the measurement program had
been generating, including defect data (if a defect had been found).
Within each chapter, you normally find other subchapters which arrange the
data for exaple respecting test modes (gears/ramps) and processing channels.
Click on the + symbol in front of an entry to open the subchapters. At the
bottom of the structure are the data entries. You can identify them by the fact
that no + symbol stands in front of them.
The basic method for evaluation is simple. You assign a data entry from the
contents tree to a graphic object (e.g. a curve plot) of a presentation window.
Then you press the button in the top left corner labeled Display Xyz (while
Xyz is replaced by the name of the current data object which you have selected
from the contents tree) and the graphic object will display the data. Further
details of this procedure will be focused in the following paragraphs. Erase
Xyz removes curves which have been assigned to a graphic object before. That
way you can clean a evaluation page for a new evaluation.
Below the buttons you can select additional options.
Rotas Archive Evaluation
Evaluation of acoustical measurements • 18
Assigning a graphic object
Before you can see the data of an data entry, you have to select which graphic
object on which layout window (on which graphic page) shall display the data.
Click through the contents tree until you found and selected the data entry you
want to display. Most of the time, the button Display Xyz will stay grayed. It
gets active only if you activate a data entry in the contents tree which has been
assigned to a graphic object or if you have just assigned it to a graphic object.
Press the button Show Xyz in... to open the dialog where you can assign data
to graphic objects.
In the text field above you see the name of the data object which you currently
assign to a graphic object (in the figure above it’s „Curves / 1-S / SK1 / GAn
H1“). On the left, you see the different available graphic objects. The objects
are ordered by pages (= layout windows). Depending on the type of data
(measurement curves, single values, text) which you want to assign, different
selections of graphic objects are offered.
You see two little help buttons over the tree of graphic modules. The right
button reduces the tree completely, making it easier to find a special page. The
left button re-opens the tree.
You can assign a data entry to more than one graphic object at the same time.
For this reason, you see a list of graphic objects on the right hand side, which
have currently been assigned to the data object. (You can also assign different
data objects to one graphic object but this is irrelevant concerning the
assignment procedure.) The list on the right shows in brackets the page number
first, then the name of the graphic object as shown in the list on the left.
You assign data to a graphic object by clicking on it in the list and pressing the
button >> afterwards. Alternatively, you can also make a double click on the
module in the list. If you want to remove an assignment, select the object in the
list on the right and press the red X.
In case of measurement curves and bar graphs you can also assign a color index
for the curves/ bars in the bottom right area Option. Each color index stands
for a curve color. You find further information about curve colors in the manual
about the presentation display.
If you select color index 0 (as shown above), the color of the curves depend on
the color you selected for a normal, marked or prominent measurement in the
tab section Graphics. If you select a different color index, this color is used
disregarding marking or making prominent.
Rotas Archive Evaluation
Evaluation of acoustical measurements • 19
Displaying data
After you assigned a data entry to one or more graphic objects, you can display
its data by pressing Display Xyz.... The name of the button always shows for
which data entry the action is carried out.
You can alternatively doubleclick on the entry in the contents tree instead of
pressing the button Display Xyz.... If no graphic object has been assigned to
this data entry, the dialog where you can assign a graphic object will open
automatically (see chapter above). Furthermore, you can right click on an object
in the contents tree. A context menu opens which contains the function
„Display“ and „Show in...“ either.
Remember that you may need to adjust scaling of the graphic module in order
to see a graphic. To do this, open the property dialog of the graphic module
with a right click on the graphic module and select Properties… from the
context menu. The tab section Scaling allows to adjust the data interval which
is being displayed. For further details, see the manual about the presentation
display.
Marked measurements
On the right side of the tab section Data, you can select what to do with the
marked measurements of the tab section List. If you select display all as
display option, all measurements are being displayd – marked and unmarked
as well. The marked measurements are drawn in their corresponding color. If
you select the option only marked, the unmarked measurements are excluded
from the display. If you select the option only unmarked, it’s vice versa: The
marked measurements are being excluded.
Recursively Displaying Measurements
In the tab section Data, you can find the option display recursively. If you
enable this option, you can display many data with one mouse click. Click on a
branch anywhere above a data entry in the contents tree, for example the entry
“Curves”. The display button is now labeled Display Curves. If you press the
button, all data entries below the selected brach in the contents tree are being
displayed. (This operation may take some time.)
Erase data
If you have already displayed data in graphic objects, you surely want to erase
them first, before displaying new data. If you want to do this, select the data
entry in the contents tree (or a branch above that entry) and press the button
Erase Xyz (where “Xyz“ replaces the current name of the data entry or
branch). That way all curves in the graphics are being removed.
The Pop-Up Menu of the Contents Tree
If you click on a branch in the contents tree with the right mouse button, a popup menu opens:
Rotas Archive Evaluation
Evaluation of acoustical measurements • 20
The first three entries Display, Erase and Show in... have the same function
as the three buttons mentioned above. The function Evaluate... is being
explained in the next chapter. The button Excel-Export... writes the data of
that branch to a file. The file has a format which can be read by the Excel
program (csv-Format). Data-Information shows you, how many data entries
are below that branch (how many curves, etc you get when you show the data of
that branch).
Displaying Limit Value and Mean Value
The limit value that has been valid for evaluation in the measurement program
is being stored in the archive files, too. If you enable the option Show limits,
the limits (in particular those of tracking curves and spectra) are being displayed
as well.
If you focus on the distibution of tracking curves and spectra, the mean value
and the standard deviation is also relevant. To evaluate these values, proceed as
follows:
Select the data entry of a tracking curve or a spectrum in the contents tree. First
of all, display the data. Then do a right click on the data entry to open the popup menu. You will find the menu entry Evaluate... there (see above).
Clicking on this menu item opens a dialog where you can select colors for the
mean value curve and the curve “mean value + factor x standard deviation”.
Furthermore, you can enter the factor for the formula. After that, the graphic
object displays the mean value curve and the curve „mean value + factor x
standard deviation“, also.
Further Display Options
Some details of the display can be influenced via several options dialogs. You
open these dialogs by right clicking on one of the „chapter“ branches of the
contents tree. Within the pop-up menu, you will find a menu item Display
options... (instead of Evaluate…). Selecting this entry opens the dialog with
the display options:
This dialog has different sections for the different types of data. In the section
Curves, you can select which information is used to form the automatic
captions of a curve plot. (For further details about captions, see the manual of
the presentation display). The Original identifier is the name of the curve
which has been stored in the data. Data-name refers to the name of the branch
in the contents tree.
Rotas Archive Evaluation
Evaluation of acoustical measurements • 21
The section Report values holds the options for the display of single report
values.
A text field can display the values, limit values, etc of all measurements in the
list. You can select which entries are being displayed with a set of check boxes.
A bar graph can display a single value only. This can either be the value of the
prominent measurement in the List (or the one of the first measurement, if no
selection has been made) or the mean value of all measurements.
For the display of General data, you can choose whether to have a leading
label (e.g. the word „Serial“) for each entry in the output.
If you order the labels, you can have them written on top of one another.
The result are two rows: the first one containing the label, the second one
containing the value.
In this section of the dialog, there is also an option controlling the form of
output for Report texts (long report text, short report text, defect report). If
you select Display all together, the report texts of all measurements are
written in one text field one after the other. If this option is disabled, you only
see the text of the prominent (the first) measurement.
The Active Item
If you click on an item in the contents tree of the tab section Data (e.g. to
display data), this item is marked with a small symbol in form of an eye in front
of it. This is the marking for the active item.
Rotas Archive Evaluation
Evaluation of acoustical measurements • 22
The name of this item is copied to the buttons Display Xyz…, Show Xyz
in… and Erase Xyz at the place of Xyz. The program remebers this active item
(as far as possible). If you click the eye button in the tab section List or change
the selection in the list, etc. the active item and all its sub-items are displayed
anew. If you mark entries of the list and no curve in the display changes its
color, check whether the right item of the contents tree has been selected as
active item.
Rotas Archive Evaluation
Evaluation of acoustical measurements • 23
Complete the Display
The presentation windows represent one printer page. The presentation display
has been designed and optimized for print-outs. You can print a presentation
window easily via the menu File:Print.
If you want to create a complete report that way, the printed page should
contain some general data like type of the tested candidate or serial number.
The entries in the contents tree for these general data are data entries as well:
You can assign these entries to graphic objects displaying texts in the same way
as you assign other data entries to a curve plot. If you press Display, you will
see for example the serial numbers listed in the text field.
But you can also assign a higher branch of the contents tree (e.g an item
representing a test mode) to a text field. It will then display the name of the
branch (e.g. the name of the test mode). If your layout page has a text field to
display a heading, you can assign the name of the branch to this text field and
data entries below that branch to other graphic elements. As a result, you can
fill the whole layout page with data including the heading while doing only one
mouse double-click on the branch item (e.g the name of the test mode).
See the manual of the presentation display for information about how to create
new graphic elements on a layout page or how to change position and size of
graphic elements. Furthermore, you find more detailed information about the
usage of a curve plot and of other graphic objects.
Colored Curves
If you want to compare data of different measurements, it is helpful to display
different curves with different colors:
For the display shown in the figure above, you need a curve plot and a legend
module. (See the manual of the presentation display for information about how
to create these graphic objects.
Rotas Archive Evaluation
Evaluation of acoustical measurements • 24
Now select the data entry holding the curves for the colored curves (see
“Displaying Measurements” on page 18). Open the dialog to assign the graphic
object (see. “Assigning a graphic object” on Page 19). Enter in the dialog
Assigning graphics the value –1 as color option. That way, you define
that the curves of this data entry shall not get the same color, but each one shall
get a different color. Display the contents of this data entry (see “Displaying
data” on page 20)and see the result.
You still need the colored captions to identify the curves. Double-click on the
curve plot to open its property dialog. Open the tab section Captions and refer
to the manual of the presentation display to connect the curve plot with the text
legend.
The text legend displays only the names of the curves at first. Open the context
menu of one of the chapter branches of the contents tree and select Display
options (siehe “Further Display Options” on page 21). The section Curves
defines which information identify the curves in the legend.
The colors for the curves and the captions are defined within the presentation
display. See that manual for details. You have to open the property dialog of
any curve plot and open the tab section Curves:
You can define the colors in the lower part of that dialog. Each color is assigned
to an index number. The colored display uses index 1 for the first curve, index 2
for the second curve,etc. If you display more curves than color indexes defined,
the last curves are drawn with color index No. 0.
Be aware: The colored curve display shows all curves of the selected data entry.
The element „Serial Number“ displays all serial numbers. If you don’t have a
curve for each measurement (= serial number) you may get an inconsistency
regarding color and caption. So, you should make sure that you have as much
captions as curves.
Rotas Archive Evaluation
Evaluation of acoustical measurements • 25
Printing Graphics
Activate a layout window (by clicking on it) and select the item File:Print...
from the application menu. The normal printer dialog opens and you can send
the layout page to a printer as usual.
As an alternative, you can click with the right mouse button on a layout window
and select Print window from the context menu. The printer dialog opens as
well.
For the other ways to a piece of printed paper, you have to define a standard
printer. If you have not defined a standard printer for the application via the
menu File:Printer Setup, the standard windows printer is used.
Open the tab section Graphics, select the page you want to print and press the
Print page. Then this page is sent to the standard printer – but
button
only if you enabaled automatic printing for this layout page. You can do this
via the context menu of the layout page by activating the item print
automatically.
If you have created a macro including a print command, you have to ensure
automatic printing either. Then the page is sent to the standard printer as well.
Managing Layout Pages
The tab section graphics of the control dialog shows the list of the currently
loaded graphic pages or „layouts“. A layout holds all information about the the
graphic objects (E.g. curve plots, titles or company symbols) of a (print) page,
especially their position and their hierarchy. Some of these objects are filled
with data later, others remain unchanged.
You can use a number of layouts at the same time. All these layouts are
included in the list of loaded graphic pages. That way, you can use a layout with
two curve plots, with six curve plots and one with a large text box at the same
time.
You can make some settings for the graphic objects of a layout page,
influencing their appearance. You can change colors, fonts and scaling settings
but you can also change the text of titles. All changes are saved automatically
when you end the presentation program.
Maybe you want to use a layout with 6 plots in two different scaling contexts:
The first context uses a scaling of 0 to 100, the other context uses a scaling of
500 to 4500 with a different title. You could invent two layouts in the list but
this may result in many layouts filling your list. As an alternative, you can use
layout variants.
Each variant of a layout is stored in a separate file (you could create
subdirectories, where you store all variants of a layout) but the program
identifies them as variants of the same layout. Use the function Change
variant to load a different variant for a loaded layout. That way, your list stays
easy to survey.
The advantage of layout variants compared to two „parallel“ layouts is that
graphic assignments remain unchanged. If you assigned data (e.g. the spectra of
the 1.gear) to a graphic object in a layout, this assignment works for all variants
Rotas Archive Evaluation
Evaluation of acoustical measurements • 26
of this layout. A disadvantage is that you can only use one variant at the same
time.
Next to the list of the loaded layout pages, you find the buttons to manage
layouts and their variants.
Load a layout file: This button loads another layout into the list. You
cannot add a variant of a layout already loaded. If you want to change the
variant of a layout, use the corresponding function (see below). If you want to
use a variant as a separate layout, you have to make a copy of the original first
(see above).
Change a layout-variant: Select a page in the list and press this
button to load another variant of the selected page. The textfield below the list
shows the file name of the currently loaded variant.
Save layout (variante) as: This function creates new layouts or new
layout variants. The current state of the selected layout will be stored in a new
file with a new filename. You can switch between the different variants
afterwards.
New (empty) layout: Pressing this button creates a new, completely
empty layout (a blank page). You have to place graphic objects on this page
then. You will be asked for the name of the new layout. The name must be
different to already loaded pages, obviously.
Copy a layout: Pressing this button creates a new layout as well. Here,
it will be a copy of the layout selected in the list.
Remove a layout from the list: The selected layout is being removed
from the list of loaded pages. The current state of the graphic objects will be
stored.
Hints to Manage Layouts
Classify layout files: If you create multiple variants of the same layout, you
should store all these files in a single subdirectory. You can rearrange the files
later still. Nevertheless, a file which is currently used by the program (a loaded
layout) cannot be moved.
Make a variant to an independent (parallel) layout: You have two variants of a
layout and want to use them simultaneously from now on. (That means that you
want to fill them both with data at the same time.) Then load one variant, make
a copy then change to the other variant.
Rotas Archive Evaluation
Evaluation of acoustical measurements • 27
Management of layouts in a macro: You can only record the command „Change
layout variant” in a macro. (Naturally, the commands “activate layout“, „erase
page“ and „print page” are available for macros as well.)
Names and Instance Names
Each layout and each graphic module within a layout has a name. You see these
names for example in the layout list of the tab section Graphic or in the dialog
where you assign a graphic. The names are called “User names”, since they are
meant to be shown to the user.
But each layout and each graphic module has a hidden “real name”, the so
called instance name. This name is used internally by the presentation program,
because it is guaranteed that this name is unique within a layout page. (You can
have for example two textboxes on a layout page having the (user) name “Plot
Title”, but behind the scenes their instance names are different.)
Sometimes, you need the instance name (e.g. to edit a macro, see page 33). You
can inquire the property dialog of a module for this name. Open the dialog and
move the mouse pointer near the button Export on the tab section
Position/Size:
A small info window will pop up, revealing the instance name.
Rotas Archive Evaluation
Evaluation of acoustical measurements • 28
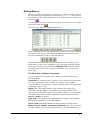
How to work with the list of measurements
In the tab section List, you can open a pop-up menu by richt clicking on an
entry in the list of the loaded measurements:
This menu gives access to a wide range of additional functions.
The menu entry at the bottom Item origin? reveals, from which archive file
the marked measurement has been loaded.
Marking of Measurements
The topmost four menu commands deal with the marking of measurements. (see
“Section „List“” on page 13 ff). Select Mark this item, to mark all currently
selected list entries. Add to marked items adds more measurements to the
currently marked measurements. Use filter… allows to mark all measurements
fulfilling certain requirements. (e.g. all measurements of a certain candidate
type). The possibilities of the filter are the same as those described below
“Filter-Functions for Loading Archive” on page 12. With the menu entry Mark
no items you can finally erase all markings
Further down, in the sub menu Marks/General (see figure), you find
additional commads for markings. Mark all items marks (surprise) all
measurements of the list. If you load more archives now, the measurements
from these archives will not be marked. Invert marking removes all markings
from the currently marked measurements and marks all currently unmarked
measurements. Markierungen 1 -> 2 switches all currently green marked
measurements to violet marked measurements.
In the tab section Archive in the bottom right corner, you find the button Mark
content. Select an entry in the archive list and press Mark content. That
way, all measurements from that archive are marked in the measurement list.
Rotas Archive Evaluation
Evaluation of acoustical measurements • 29
Excluding Measurements
You can exclude measurements from the list. These measurements become
“invisible”: They disappear from the list and the data are not displayed any
more. Select the menu command Hide marked items to remove the currently
selected measurement(s) from the list, including the measurement where you
opened the pop up menu.
The submenu Marks/General holds the command Hide marked items. You
exclude all marked measurements that way. In combination with the command
Use filter…, you can easily exclude measurements from the list which fulfil
certain criteria (e.g. all measurements from a certain test bench). In the same
submeu, you find the command Undo hide. This makes all exluded
measurements visible again.
In contrast to that, the menu command Remove from list excludes the
corresponding measurements completely from the list. If all measurements of a
certain archive have been removed, the corresponding archive will be removed
from the list of loaded archives as well.
Working with archives, edit „additional Information“
The submenu Archive features holds three important additional commands.
Archive export… creates a new archive file from the measurements that have
been selected in the list. That way you can extract certain single measurements
from a large archive or assemble selected measurements into one package.
Remove from archive(s) removes the selected measurement(s) from the
archive files. The data of deleted measurements are gone forever (in contrast to
the menu command Remove from list, which removes measurements from
the list only, but not from the archive files). Removing a measurement from an
archive does not make the archive smaller immediately, the archive file contains
holes instead. Select the corresponding archive file in the section Archive and
press Cleanup to reduce the archive to the data left.
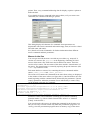
The command Edit “Additional infos” allows to edit the “aditional
information” section of the selected measurement. Clicking on the menu
command opens an edit dialog:
This dialog lists all additional information stored for the selected measurement.
If you click on an entry in the list, it appears in the text field below (like the
„Motornummer: 114“ in the figure). You can change the value (here: „114“)
there. After a change, a marking apperas in the list in front of the entry (like
with „Pruefer“ in the figure).
Rotas Archive Evaluation
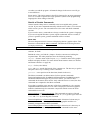
Evaluation of acoustical measurements • 30
Basically, there are two possible ways to change data: Either „in place“ or by
making a copy of the archive. „In place“ means, that the change will be done in
the current archive file. This is obly possible when you change an entry to a
shorter or at most as long value. (For example, you could change an entry of
114 to 115, but not to 1145.) If you want to add characters to an entry, you must
do this in a copy of the archive. In the top right corner, below Mode switch to
archive copy. In an archive copy, you can add new entries (further additional
information) either. If you leave the dialog by clicking OK, you will be asked
for the name of the archive copy to store the data.
Exporting Data
There are two possibilities to export data from the evaluation program: You can
export the presentation graphics (as a graphic) or the curve data (in excel
format).
Exporting Graphics
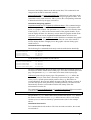
If you want to export a graphic, double-click on the graphic object that you
want to export. The property dialog of the graphic module will be opened:
In the tab section Position/Size of this dialog, you find the button Export...
Execute the graphic export by pressing this button.
The graphic will be stored in “WMF“-format. You can import these graphics
for example in a word document, or them send via email.
Further details about exporting graphic you will find in the manual about the
presentation display.
Excel-Export
If you want to export the curve data themselves, select the corresponding data
entry in the contents tree (see figure on page 18) and open the context menu.
You will find the menu item Excel-Export... there. If you select that item, you
will then be asked for a filename to store the exported data.
The data will be stored in an excel sheet (in the „csv“-Format), with the first
column containing the positions on the x-axis and all other columns containing
Rotas Archive Evaluation
Evaluation of acoustical measurements • 31
the corresponding values of the curves. We encourage to create a separate excel
worksheet for further processing. In that evaluation sheet you can place
additional fields, calculations or graphics and copy the exported data from the
excel sheet to the evaluation worksheet.
Rotas Archive Evaluation
Evaluation of acoustical measurements • 32
Macros
A macro allows to store actions you are executing while using the presentation
manually (selecting data entries, assigning graphics, etc.) and make them
repeatable by that. A macro is recorded and can be played back including
additional parameters. These actions are controlled in the section Macro of the
control dialog:
Make a Macro and Use It
Proceed as follows to record a macro:
1.
Enter a new name in the field below known macros and click on the
. (If you want to re-record an existing macro, this step is
button New
skipped.)
2.
. (If
Select the name of the new rapport in the list and press Record
you re-record an existing rapport, a warning message is being displayed.)
3.
Now execute the actions you want to record: Assign graphic modules to
data entries and let the data be displayed. At he end, you can print the
corresponding page(s) from the section graphic (see “Printing Graphics”
on page 26). You should also include „Erase“-commands at a suitable
moment.
4.
Return to the section Macro and press Stop
complete.
5.
If you select the macro in the list now and press Play
watch how the macro is being processed.
. The recording is
, you can
The macro executes exactly those operations you recorded. If you load another
archive file and process your macro, the new data will be displayed exactly in
the same way like that with which you recorded the macro.
Rotas Archive Evaluation
Evaluation of acoustical measurements • 33
Using Replacement Rules
In the lower part you can define replacement rules for the macro commands.
That way you use a macro which you recorded for SK1 for SK2 as well. Enter
the replacement rules in the form
“oldText1=newText1,oldText2=newText2,...“. Everything left of a sign of
equality is being replaced by that standing on the right. Avoid spaces, except
you want them to be part of the replacement text.
You can use several fields to enter replacement rules. Each field can contain
several replacements. You can enable or disable the four fields and the rules
defined within by clicking the control boxes.
You normally use the replacement rules as follows: After recording a macro
(either manually or using the macro editor, see below), replace all actual
references (e.g. referencing the test bench) by a symbolic name (maybe
„[TestBench]“). That way, the modified macro is not usable any more without
replacement rules. But afterwards, the replacement rules have a readable form
„[TestBench]=MyTestBench“.
Options when Processing a Macro
During the recording or the processing of a macro, you may not want that pages
are being sent to a printer. If you enable the check box Do not execute print
instructions, nothing will be printed. Nevertheless, the commands will be
recorded (during record), but not executed.
If you start recording or executing a macro, all existing graphic assignments are
removed at first. Then the assignments of the macro are recorded or made when
you process a macro. At the end, these assignments are removed and the
previously defined assignments re-installed. If you do not want the assignments
made by the macro be removed, enable Keep graphics allocations after
recording. You can continue to work with the assignments, then.
When executing a macro, errors can occur, for example if a requested data entry
is not present in the loaded archive. Think of a test bench where gearboxes are
tested which can have either 5 or 6 gears. Your macro is designed to display all
6 gears, when measured. Error messages naturally occur, when you measured a
gearbox having only 5 gears. Since these error messages are normally displayed
in message dialogs, they can be annoying in the context explained above.
Activate the check box Do not display error message boxes to disable
dialog messages. Still, the error messages are reported in the Stdout-window.
As mentioned above, all actions which have been carried out when recording
the macro, are executed when processing it. This includes selecting entries in
the contents tree and in the graphic assignment dialog, pressing buttons and
similar actions. These actions, which are originally designed for manual usage
take much time when processed in a macro. Enable When executing make
dialogs invisible to save skip these actions and save time.
Add Commands to a Macro
If you want to add new commands to an existing macro, proceed as follows:
. Execute the addional
Select the macro in the list and press the button
commands as if you were doing a normal macro recording. These commands
to end the recording.
are added at the end of the macro. Press Stop
Rotas Archive Evaluation
Evaluation of acoustical measurements • 34
Editing Macros
Macros are stored in a separate file (a resource sea) which is normally stored in
the same folder as the application sea and named Rapports.sea. You can have
several such sea files, containg different macros. Switch between sea files with
the button
.
You can easily edit a macro with the macro editor. Select the macro you want to
.
edit in the list and press
The macro editor lists all commands of the macro:
Select a command. Use the arrow buttons above the list to move the command
one position to the top or to the bottom. The buttons with the double arrows
move the command to the top or to the end of the list.
The buttons below the list allow to edit commands. You can change a command, delete it, insert a new command or copy an existing command. Furthermore, you can replace text with the button Replace Text. Be aware that the
text replacement is done for the whole macro (and not for the selected command, only).
The Structure of a Macro Command
As you can guess from the editor dialor, a macro command consists of the
following elemts:
Command: the command itself. In general, a colon separates the general part
from the particular part of the command. For example: The command
„Layouts:OnWipe“ shows that this command generally deals with layouts, and
in particular “wipes” a page.
Object: This is the main parameter of the command. The object of the
command „Layouts:OnWipe“, for example, is the (Instance-)Name of the
Layout-Page, which shall be wiped. The parameter ‚Objekt’ is a text parameter.
Commands which require numerical parameters use the command elements
num1 and num2 (see below).
Arg2, Arg3: The parameteres are additional text parameters. Their meaning
depend on the command as is with all parameters.
num1, num2 (labeled n1 and n2 in the dialog):numerical integer values.
Mode, channel, location, instrument, parameter: these five texts form a
so called „Quinter“. Every measurement data entry is identified definitely by a
Rotas Archive Evaluation
Evaluation of acoustical measurements • 35
quinter. Thus, every command addressing data for display, requires a quinter to
define the data.
If you double click on a command in the macro editor (or if you create a new
command), the command edit dialog is opened:
This dialog displays all elements of a command. Some parameters are
dispensable with certain commands and remain empty, then (or have the value 0
like with num1 and num2).
See „Details of Certain Commands“ for further information about different
macro commands and their parameters.
Macros in the Sea
You can open and edit the macro sea with any text editor (e.g. notepad). It
consists of a resource list „Rapports“ at the beginning, containing all valid
macros of this macro file. Each line in the list defines one macro. Each line
consists of two entries: The user name of the macro and the “internal name” of
the macro. The internal name is created by replacing all special characters (like
‘!’ or ‘-‘) by numerical codes.
Each name defines a resource list, containing the macro commands and the
entries „(Name)_Status“ and „(Name)_Optionen“.
The resource list contains the commands in the same form as they are displayed
in the window of the macro editor (see figure above). One line defines one command, beginning with the command itself, followed by the parameters. Unused
(empty) parameters within the parameter list are indicated by a comma. They
can be skipped at the end of a command:
Layouts:OnWipe Curves , , 0 0
Data:OnOptions , , , 3 0
Show:Curves Layout-Curves GSigCurvePlot5 0 4 8 1.M [Chan] N-Mon
Show:Curves Layout-Curves GSigCurvePlot6 0 4 8 1.M [Chan] M-Mon
"Show:General Information" Layout-Curves BottomText0 0 3 5
// "Dies ist ein Kommentar." , , 0 0
Call:MTest [Mode]=5.N , , 0 0
Layouts:DisplayText Layout-Curves TextArea0 "Channel: [Chan]" 0 0
Parameter-Values (and Commands) containing spaces must be framed by
quotation marks. (e.g. like in "Show:General Data" in line 5 or "Channel:
[Chan]" in the last line.)
You can obviously edit a macro by editing the command list in the macro sea.
But you can carry out such actions only when the presentation program is not
running, since the presentation program stores its memory copy of the macro
Rotas Archive Evaluation
Evaluation of acoustical measurements • 36
sea when you end the program. All manual changes in the macro sea will get
overwritten then.
Please notice: The single comma is the fill-in character for an empty parameter
text. It is not used to separate the single paramters (unlike some programming
languages do when calling a function).
Details of Certain Commands
General remark: Many macro commands exist in an english and a german
version. If you enter commands manually with the macro editor, it is irrelevant
which version you use. The executed action is the same with both command
versions.
If you record a macro, commands are always recorded in the system’s language.
If you use an english Windows system, english commands will be recoded; if
you use a german system, german commands will be recorded.
Show data
The most frequent action in a macro is displaying data in a graphic object. This
function is called with the Show-command, which has the following structure
(example parameters)
Show:Curves Layout-Curves GSigCurvePlot5 0 4 8 1.M [Chan] N-Mon
You create a show command when you record a macro. It has the following
structure, in detail:
Behind the colon, you find the „chapter“ from the contents tree holding the
requested data. The other parameters have the following meaning:
Objekt = Instance name of the Layout, Arg2 = Instance name of the graphic
module to display the data. (For more details about instance names see”Names
and Instance Names“ on page 28.)
Arg3 = Color (color-Index).
Num1 and Num2 encode the branch of the contents tree. The best way to get the
adequate values is by recording a show command.
Quinter = exact position of the data item (branch in the tree).
The Show-command is an abbreviation for four separate commands:
Daten:OnGraphAuswahl, GraphMod:OnHinzunehmen, GraphMod:OnApply
and Daten:OnDatenAnzeigen. If you record a macro, you will see these
commands in the macro editor at first. Only when the macro is stored, the four
commands are compated to the Show command.
If you don’t record the exact structure of the four commands (e.g. by pressing
GraphMod:OnHinzunehmen twice in order to display the data in two graphic
modules simultaneously) the automatic compaction which creates the showcommand does not work.
Data:OnOptions or Daten:OnOptionen: This command sets option of the tab
section data (Show Limits, show only marked, etc.). You get the right values for
num1 and num2 by recording this command.
Data:OnGraphSelect or Daten:OnGraphAuswahl: Selection of a data entry in
the contents tree. The following commands assing graphic modules to it.
Normally compacted to the Show command.
Data:OnDisplayData or Daten:OnDatenAnzeigen: Selection of a data entry in
the contents tree in order to display its data. (This command has the same
Rotas Archive Evaluation
Evaluation of acoustical measurements • 37
function as the Display button in the tab section data). This command is also
compacted to the Show command, normally.
Data:OnWipeTable or Daten:OnTafelWischen: Selection of a data entry in the
contents tree in order to delete its data from all assigned graphic modules. This
command is rarely used in macros. Mor e you use the corresponding command
to delete data from a layout page (see below).
Commands assigning graphics
GraphMod:OnShowIn or GraphMod:OnHinzunehmen: This command assigns
the data entry which you defined with the command Daten:OnGraphAuswahl
before to a graphic module. The parameter Objekt refers to the instance name
of the layout, Arg2 refers to the instance name of the graphic module. If you
want to display the data of a data entry in more than one graphic module at the
same time, you can execute GraphMod:OnHinzunehmen more than once.
GraphMod:OnApply and GraphMod:OnOK: With these commands, the graphic
assignmend is ended. The parameter Num1 defines the color index which is
used to display the data. OnApply leaves the graphic selection dialog open,
OnOK closes it.
Commands for the layout page
The following five commands need surely not be described more detailedly:
Layouts:OnForeground
Layouts:OnClose
Layouts:OnWipe
Layouts:OnPrint
Layouts:OnPrintAll
"6 Plots"
"6 Plots"
"6 Plots"
"6 Plots"
JobTitle
As an alternative, the german version follows:
Layouts:OnVordergrund
Layouts:OnSchliessen
Layouts:OnWischen
Layouts:OnDrucken
Layouts:OnAlleDrucken
"6 Plots"
"6 Plots"
"6 Plots"
"6 Plots"
Drucktitel
The first command brings the layout page to the front. the second one closes it.
The third one deletes all data from on that page. The fourth command prints that
page. The parameter Object is the name (user name) of the layout page.
OnPrintAll prints all open layout pages. The parameter object defines the
name of the print job. This name is normally irrelevant for the printer. Only
when you use a pseudo-printer which produces files (e.g. PDF-Writer or
Acrobat Distiller), the print job defines the name of the file which is created. If
you enter the special value [AutoTitle] (including brackets), the name is built
automatically from the serial number and the time stamp of the first
measurement from the list.
The command Layouts:DisplayText or Layouts:TextAnzeigen fills a text which
is defined in the macro into a textbox. See the following example:
Layouts:DisplayText Layout-6Plots TextArea0 "Measurement in [Chan]" 0 0
The parameter Objekt defines the instance name of the layout. Arg2 defines
the instance name of the text box. Arg3 defines the text. Since a text mostly
contains spaces, it must be framed by quotation marks (like in the example
above).
Commands for archives
Two commands deal with archives: The first one loads an archive, the second
one un-loads it.
Rotas Archive Evaluation
Evaluation of acoustical measurements • 38
Archive:LoadArchive or Archive:ArchivLaden loads an archive. Its parameter
Objekt defines the filename (including full path) of the archive to be loaded.
Arg2 defines an optional appendix which is described below.
Archive:RemoveArchive or Archive:ArchivEntfernen unloads an archive. The
paramter Objekt once again defines the file name (see above).
The optional appendix of Archive:ArchivLaden can only be entered via the
macro editor. It can not be recorded. If you load an archive with an optional
appendix, the data from this archive are stored in separate chapters in the
contents tree which are marked with the appendix either. As a result, you can
assign graphic objects to these data independantly from data loaded from other
archives (without this appendix specified). You can use this command to load
an archive containing a reference measurement and display it with a different
color than normal data.
Furhter commands
The following commands are not creatable via recording. They must be entered
manually with the macro editor.
Comments: You can enter comment lines in the macro. Each line beginning
with two dashes ‚//’ will be regarded as a comment:
// "This is a comment."
Please note: A comment line is still separated into its parameters. To be sure
that words of your comment are not treated as numerical parameters, frame the
command with quotation marks as shown in the example above.
Call:Macro-Name: This command executes another macro, defined by the name
behind the colon. All replacement rules which are valid when that macro is
called, are used for that macro either. You can define additional replacement
rules for that macro with the parameter object:
Call:MTest "[Mode]=5.N"
The called macro must be defined in the same macro sea like the calling one.
Conditional execution
Macros are not a programming language. Thus, they include not all constructs
of a real programming language. That means for conditional execution: If the
defined condition is not true, the following command will be skipped.
All Commands for conditional execution start with If: or with Wenn:. The
definition of the condition follows. If an exclamation mark ‘!’ follows the colon
directly, the condition is being negated. (See the examples below).
If:IsEqual Text1 Text2 or Wenn:IstGleich Text1 Text2
If Text1 equals Text2 literally, the condition is true and the following command
will be executed. This command makes only sense when you use it together
with replacements:
If:IsEqual [Channel]
Call:SpecReport3
If:!IsEqual [Channel]
Call:SpecReport1
SK3
SK3
The first two commands have the following function: The macro
„SpecReport3“ is called if and only if [Channel] has got the value „SK3” from a
replacement rule. The next two commands deal with the other case: If
[Channel] has not got the value „SK3” (Note the ‘!’ in the command) the macro
„SpecReport1“ is called.
Rotas Archive Evaluation
Evaluation of acoustical measurements • 39
If:Data ... or Wenn:Daten ...
The following parameters of this command are the same as in the show
command. The condition is true, when the defined data entry of the contents
tree actually contains data:
If:Data Spektra - - 0 4 3-Z [Chan]
Call:SpecReport3
These commands execute “SpecReport3” only if the requested data entry
contains data. The easiest way to get the parameter list of this command is by
recording the following action in a temporary macro: Select the requested data
entry in the contents tree, and press “Show in…”. Then stop the recording
(without assigning a graphic module). The macro now contains a
Data:OnGraphSelect-command having the desired parameter list. You can
rename it to „If:Data“, replace parameters by replacement rules, if necessary
and finally copy it to the macro where you need it.
Further Tricks
After having executed a macro, you probably want to have measurements
marked in the dialog section List, or want to execute similar operations where it
is relevant which item in the contents tree is currently active (see “The Active
Item” on page 22). You can set an item as the active item with the following
two commands added at the end of the macro (e.g. with the macro editor). In the
example the item “Curves“ is set active:
Data:OnGraphSelect “ Curves“ , , 2 21
GraphMod: OnOK
As usual, it is easier to create these commands by recording them in a
temporary macro.
Rotas Archive Evaluation
Evaluation of acoustical measurements • 40