1
PeakNet® IA Software
User’s Guide
© 2002 Dionex Corporation
Document No. 031736
Revision 02
April 2002
©2002 by Dionex Corporation
All rights reserved worldwide.
Printed in the United States of America.
This publication is protected by federal copyright law. No part of this publication
may be copied or distributed, transmitted, transcribed, stored in a retrieval
system, or transmitted into any human or computer language, in any form or by
any means, electronic, mechanical, magnetic, manual, or otherwise, or
disclosed to third parties without the express written permission of Dionex
Corporation, 1228 Titan Way, Sunnyvale, California 94088-3603 U.S.A.
DISCLAIMER OF WARRANTY AND LIMITED WARRANTY
THIS PUBLICATION IS PROVIDED “AS IS” WITHOUT WARRANTY OF ANY
KIND. DIONEX CORPORATION DOES NOT WARRANT, GUARANTEE, OR
MAKE ANY EXPRESS OR IMPLIED REPRESENTATIONS REGARDING THE
USE, OR THE RESULTS OF THE USE, OF THIS PUBLICATION IN TERMS
OF CORRECTNESS, ACCURACY, RELIABILITY, CURRENTNESS, OR
OTHERWISE. FURTHER, DIONEX CORPORATION RESERVES THE RIGHT
TO REVISE THIS PUBLICATION AND TO MAKE CHANGES FROM TIME TO
TIME IN THE CONTENT HEREINOF WITHOUT OBLIGATION OF DIONEX
CORPORATION TO NOTIFY ANY PERSON OR ORGANIZATION OF SUCH
REVISION OR CHANGES.
TRADEMARKS
PeakNet®, Self-Regenerating Suppressor®, and SRS® are registered
trademarks of Dionex Corporation.
Celeron is a trademark and Intel® is a registered trademark of Intel
Corporation.
Microsoft®, Windows® 95, Windows® 98, Windows® 2000, and Windows NT®
are registered trademarks of Microsoft Corporation.
PRINTING HISTORY
Revision 01, March 2001
Revision 02, April 2002
Contents
i
Contents
Introduction ............................................................................................. 1
Using the Online Help System and the Manual................................ 1
Overview: Online Help........................................................................ 1
Activating Online Help........................................................................ 2
Overview: User Manual ...................................................................... 3
Theory, Installation, Operation .....................................4
Hardware and Software Chromatography Components..................... 6
Chromatography Instruments............................................................ 6
Device Communication ...................................................................... 6
Device Communication: LAN............................................................. 6
Timebases............................................................................................ 7
PC ......................................................................................................... 7
Operating System ............................................................................... 8
Network ................................................................................................ 8
Local Client/Server Installation.................................................... 10
Network Installation..................................................................... 10
Overview: Chromatography Data System ...................................... 12
Dionex Data System Options ...................................................... 13
Device Drivers............................................................................. 14
Audit Trail .................................................................................... 14
Installation: Software............................................................................ 15
Tips for Software Installation........................................................... 15
Initial Installation and Update .......................................................... 15
The Dionex Data System Under Windows 98/NT/2000 .................. 17
Software Protection .......................................................................... 19
Server Configuration Program......................................................... 20
ii
Contents
Basic Operation..................................................................................... 22
Operation via the Keyboard ............................................................. 22
Operation via the Mouse .................................................................. 23
Undo / Redo Commands .................................................................. 23
Program Start .................................................................................... 24
The Client User Interface.................................................................. 25
Window Types ................................................................................... 26
Control Panel..................................................................................... 26
Function ...................................................................................... 26
Audit Trail .................................................................................... 27
Browser.............................................................................................. 28
Common Features with the Windows Explorer........................... 28
Differences from the Windows Explorer ..................................... 29
Function ...................................................................................... 30
Method Window ................................................................................ 31
Table Editor ....................................................................................... 31
User Profiles (Workspaces) ............................................................. 32
Report Definition ............................................................................... 33
Create/Open Files, Windows, and Templates ................................ 33
Printing............................................................................................... 35
Control ................................................................................................... 36
Control Concept ................................................................................ 36
Control (Direct).................................................................................. 36
System Commands..................................................................... 37
DX-80 Ion Analyzer Commands.................................................. 37
General Commands .................................................................... 37
PGM-File ..................................................................................... 38
Data ........................................................................................................ 39
Data: Overview .................................................................................. 39
Datasource......................................................................................... 40
Data Storage ...................................................................................... 42
Data Export ........................................................................................ 43
Backup ............................................................................................... 44
Raw Data ............................................................................................ 44
Contents
Raw Data Storage.............................................................................. 44
Raw Data Compression .................................................................... 45
Restoring a Chromatogram from Raw Data ................................... 45
Raw Data Export................................................................................ 46
Raw Data Import................................................................................ 46
Raw Data Storage in Power-Off Case ............................................. 47
Protocol Data (Audit Trail)................................................................ 47
Daily Protocol .............................................................................. 48
Sample Protocol.......................................................................... 48
Samples and Sequences ...................................................................... 49
Sample Preparation .......................................................................... 49
Sample Processing ........................................................................... 49
Sample Registration ......................................................................... 50
Sample List (Sequence Table) ......................................................... 51
Sequence Wizard .............................................................................. 52
Calibration Wizard............................................................................. 53
Automatic Batch Operation (Online Batch) .................................... 53
Sample Evaluation ............................................................................ 54
Validation ............................................................................................... 55
Validation ........................................................................................... 55
Installation Qualification Manager ............................................... 56
Log File CMSETUP.LOG ............................................................ 57
System Wellness................................................................................... 58
System Wellness Overview.............................................................. 58
Data Reprocessing................................................................................ 59
Definition: Data Reprocessing......................................................... 59
iii
iv
Contents
Integration.............................................................................................. 60
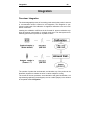
Overview: Integration ....................................................................... 60
Operation .................................................................................... 61
Integration Report ....................................................................... 62
Peak Summary Report................................................................ 62
Chromatogram Comparison........................................................ 63
Printer Layout ........................................................................................ 66
Printing ........................................................................................ 66
How to ...: .......................................................................67
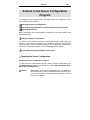
Actions in the Server Configuration Program.................................... 69
Changing the Server Configuration............................................. 69
Selecting the Copy Protection Location and
Entering the Key Code ................................................................ 73
Updating Moduleware ................................................................. 74
Adding Timebases / Instruments ................................................ 74
Enabling and Disabling System Wellness Functions .................. 75
Actions in the Control Panel ................................................................ 76
Loading a Control Panel.............................................................. 76
Connecting a Control Panel with a Timebase ............................. 77
Using/Recording Demo Data ...................................................... 79
Actions in the Browser ......................................................................... 80
Creating a Sample List (Sequence Table) ...................................... 80
How to ...: Setting Up a Datasource ................................................ 81
Connecting a Database............................................................... 82
Disconnecting a Database .......................................................... 83
Creating a New Database ........................................................... 83
Opening the ODBC Manager ...................................................... 84
Handling Files, Datasources, and the Network.............................. 84
Locking Datasources on Removable Media ............................... 85
Locking Datasources, Directories, and Sequences .................... 85
Opening Protocol Data (Audit Trails) .......................................... 86
Creating Backup Files ................................................................. 87
Restoring Backup Files ............................................................... 88
Contents
Performing a Query........................................................................... 89
Entering the Sample Query Using the Wizard ............................ 90
Selecting Search Criteria ............................................................ 91
Examples (Wizard)...................................................................... 94
Specifying the Sample Query Using the Dialog Box ................... 95
Editing SQL Statements.............................................................. 96
Examples (Dialog Box).................................................................... 97
Saving a Query............................................................................ 99
System Wellness............................................................................. 100
Opening a Wellness Control Panel ........................................... 100
Viewing and Restoring Calibration Data.................................... 101
Performing Device Calibrations................................................. 101
Calibrating the Pressure Transducer Offset.............................. 102
Calibrating the Conductivity Cell ............................................... 103
Actions in the Window Section "Chromatogram" ............................ 104
Manual Re-Integration .................................................................... 104
Moving Peak Delimiters ............................................................ 105
Modifying the Baseline .............................................................. 105
Inserting Peaks ............................................................................. 106
Manual Peak Assignment............................................................... 106
Performing a Chromatogram Comparison ................................... 108
Actions in the Window Section "Report" .......................................... 110
Displaying a Report ................................................................... 110
Peak Summary.......................................................................... 110
Audit Trail .................................................................................. 111
Actions in the Window Section "Calibration Plot" ........................... 112
Printing with a Report Template................................................ 112
Device Control..................................................................................... 114
Controlling the DX-80 Ion Analyzer ............................................... 114
Monitoring the DX-80 Ion Analyzer ........................................... 114
Using Keyboard Shortcuts............................................................. 115
Glossary ....................................................................... A-1
Index ..................................................................................i
v
vi
Contents
Introduction
1
Introduction
Using the Online Help System and the Manual
The online Help system and this user manual differ only slightly in content, but
are intended for different situations.
• Refer to the online Help system to look up terms or to find information on
how to use the software in a specific situation on the current screen. The
easiest and quickest way to receive help is by pressing the ¾F1 Key. For
further information, see
Activating Online Help.
• Look up information in the user manual to become familiar with the fundamental features and operation of the data system. We recommend that you
read the topics of the first two sections and look up unfamiliar terms in the
glossary.
Overview: Online Help
The PeakNet IA online Help features various windows and levels. These correspond, in general, to the sections of the user manual (the table of contents,
main section, appendix, and index). In addition, the online Help provides many
context-sensitive tips that can be opened only from a program window.
The overview displayed via the Contents button corresponds to the table of
contents in the user manual:
• Double-click a book symbol to view further levels ("branches").
• Double-click a question mark symbol to open the corresponding topic.
• Click the Index tab to search online Help for an index term.
• Click the Find tab to search online Help for any non-indexed string.
The selected topic appears in a separate Help window. This window has a
white background if the topic deals with questions regarding theory, installation,
or operation. The background color is yellow if practical tips are displayed
(How to ...:). Both windows can be displayed simultaneously.
Introduction
Note
2
Online Help is automatically displayed in the language of the
current
language
setting
(see
Windows
Control
Panel/International Settings). The English version is loaded
by default.
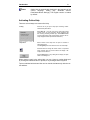
Activating Online Help
There are several ways to access online Help.
F1 Key
Press the F1 key to open a Help topic containing contextsensitive Help information.
Select How to ... from the menu of the right mouse button
(context menu) to view information about operations that
are currently possible (practical tips). Select What’s this?
to view a description of the corresponding control or the currently displayed window (theoretical information).
Help menu
Select ¾Index on the Help menu to open an overview of
online Help topics.
The Using Help menu item shows how to use online Help.
Click this button to change the mouse cursor to a question
mark, and then click any screen element to display a description of the element.
Click the Help button in any dialog box to display an explanation of the dialog box.
When viewing a topic in the online Help, you can ¾jump to another Help topic
by clicking the underlined term or phrase, or by clicking a shortcut symbol.
Topics underlined with a dotted line can be viewed simultaneously with the current window.
Introduction
3
Overview: User Manual
The PeakNet IA user manual contains sections on Theory, Installation, Operation, How to ...:, and a Glossary. Use Contents and Index to search for
specific terms and to get an overview of topics described in the manual.
"Theory, Installation, Operation"
This section describes the structure and the functions of the Dionex Data System, as well as basic chromatographic facts and methods. When appropriate,
the user is referred to related topics. These references are indicated as follows:
Jump term
Refers to technical terms in the glossary section. This type of reference corresponds to the green link terms in the online Help
system.
Shortcut symbol
Refers to topics in the Theory, Installation, Operation, or How
to .... sections.
"How to ...:"
This section contains answers to frequently asked questions, such as:
"How do I perform a query?"
"How do I open the Wellness control panel?"
"How do I add a timebase?"
Appendix: Glossary
The glossary contains an alphabetical list of chromatographic and programrelated terms. Refer to the glossary to view definitions of technical terms,
commands, and parameters.
Index
Refer to the index to locate information about a specific term. Page numbers
preceded by the letter A refer to the glossary section; for example:
Command
reconnect...............A-93
wait......................A-147
wash....................A-147
Introduction
4
Theory, Installation,
Operation
Introduction
5
Hardware and Software Chromatography Components
6
Hardware and Software Chromatography
Components
Chromatography Instruments
PeakNet IA is especially designed to control and monitor the Dionex DX-80 Ion
Analyzer. A system may include (at most) one anion DX-80 and one cation DX80. If desired, a Dionex AS40 Automated Sampler may be connected.
If you have any questions about product support, please contact your Dionex
Sales Representative.
Device Communication
To control the chromatography system and to record chromatograms, the
Dionex Data System constantly communicates with peripherals.
The data system sends control commands to the instruments. Depending on
the type of the exchanged data, various transmission methods are used.
For further information, see the topic below:
LAN
Device Communication: LAN
The LAN (local area network) consists of at least one DX-80 Ion Analyzer and
a PC; the PC contains a motherboard with a built-in LAN card.
Hardware and Software Chromatography Components
7
Timebases
If you intend to operate a single chromatographic system with the Dionex Data
System, you will work with a single timebase. All instruments are timedependent on each other and are synchronized during operation (i.e., they
have a common clock).
If you control several systems, the individual systems work independently
(asynchronously) from each other: the Dionex Data System must manage a
separate timebase for each system (i.e., the systems behave as if they were
controlled by separate PCs).
PC
These are the guidelines for personal computer (PC) specifications for the
Dionex Data System.
• IBM-compatible computer, Intel Celeron 400 MHz minimum
• 32-bit
Operating System (Microsoft Windows 98, Windows NT 4.0, or
Windows 2000)
• 64 MB RAM minimum
• Hard disk drive with minimum of 2 Gbyte free space
• 10BASE-T compatible PCI LAN card
• CD-ROM drive
• Windows-compatible monitor; resolution of 1024 x 768 pixels (minimum)
• Mouse supported by Windows
Hardware and Software Chromatography Components
8
Operating System
The Dionex Data System supports the following operating systems:
• Windows 98
• Windows NT 4.0
• Windows 2000
Because these are 32-bit ¾Multi-Tasking operating systems, several programs
can be executed simultaneously. This is especially important for instrument
control, data acquisition, and printer support.
Caution:
There are differences between the operation of the Dionex
Data System under Windows 98 and Windows NT/Windows
2000. For details, see the following topic in the chapter Installation:
The Dionex Data System under Windows 98
and Windows NT/2000.
Network
The network capability of the Dionex Data System allows operation of the data
system within local and global networks, also referred to as LAN (local area
network) or WAN (wide area network).
The Dionex Data System can not only be operated locally in a single-user installation, but also within a network. This includes data transfer and remote operation via ISDN. Dionex Data System stations can be linked around the world
(wide area network).
To enjoy the advantages of network operation (including centralized data storage, backup, and administration, shared access to methods and world-wide
availability), safe and fast data exchange is essential.
Even state-of-the-art networks sometimes have difficulty coping with the enormous amount of data. Therefore, client/server systems offer decisive advantages by specifically selecting transferred data.
Client/Server System
From a decentralized PC (client), sub-programs are started on a central computer (¾Server or Chromatography Server) via ¾RPC commands (Remote
Hardware and Software Chromatography Components
9
Procedure Calls). The server executes the actual "work" (searching for data in
a database, running an application, etc.). The client merely receives the search
results or the current status of the application. Basically, this means that the
client provides the user interface, while the actual operation is performed on
the server via "remote control." The Dionex Data System also uses this division
of labor.
The user starts the Dionex Data System on a local PC, the ¾Client. The user
can then perform all server-independent tasks, including reprocessing of raw
data and creating sequences.
If a Chromatography ¾Server is activated via the ¾Server Monitor Program, it
is possible to control and monitor the chromatography instruments connected
to the server. Theoretically, each client connected with a running server via a
¾Control Panel can perform this control. In practice, the first client using this
possibility also has control rights. From this point, all other Dionex Data System
users can only monitor the system status.
Via device drivers, the server converts the control commands entered on the
first client PC for the analytical instruments. Inversely, the server receives information from the system and forwards it to the appropriate locations. Thus,
status information appears on all client PCs connected with this chromatography system. Raw data is automatically stored in the directory of a ¾Datasource
and the underlying database.
Depending on whether the client and the server are located on the same PC or
on different PCs on a network, a distinction is made between local client/server
installation and network installation. For more details, see the topics below:
Local Client/Server Installation
Network Installation
Hardware and Software Chromatography Components
10
Local Client/Server Installation
The ¾Client and the (Chromatography) ¾Server are located on the same PC.
They must be started separately.
The controlled instruments in the chromatography system are connected to the
PC via the LAN (local area network). Each chromatography server can operate
a maximum of two ¾Timebases (chromatography systems).
Data are saved on the local PC. During the initial Dionex Data System installation, a local datasource is installed on each local computer.
If the PC is part of a local network (LAN = Local Area Network or WAN = Wide
Area Network), data can also be saved externally. In the same way, external
data can be used for data editing.
If the local PC is connected to a network, all network installation options are
available.
Network Installation
The ¾Client, the Chromatography ¾Server and the ¾Datasource can be installed on different computers. They are connected via the network and the corresponding network server (generally a Windows NT/2000 server). Each chromatography server can operate up to two systems (¾Timebases), one anion
system and one cation system.
The client, server, and datasource are independent units within the network.
A client, a server, and a local datasource are set up on each PC during the
Dionex Data System installation. Independently of this, each PC can act as
"client only" or "server only." Theoretically, each client can access each datasource and each server. However, in practice, this may not be desirable for
safety reasons. Therefore, there are various ways in which to restrict user access.
• The ¾Server Configuration program allows you to define the extent of network operation for each ¾Server and for each timebase. A server can be
made available for the entire network, or the server can be partly or completely locked. If the server is partly locked, monitoring the server is possible, but control of the connected instruments is disabled. In this case, control is reserved for the local client. This distinction also applies to the timebases. If three timebases (TIME1/2/3) are installed on a server, TIME1
could be completely shared, TIME2 could be excluded from network operation, and TIME3 could be shared for monitoring only.
Hardware and Software Chromatography Components
11
• Datasources and/or their subdirectories can also be protected from undesired access. Depending on the location of the corresponding database (on
the local hard disk or a network PC), the respective user or the network administrator decides (by "sharing" a directory) which data can be accessed
and by whom. In addition, datasources shared in Windows can be locked in
the Dionex Data System.
Important data are often stored on central data server PCs. If, during data acquisition, the network connection is interrupted or the data server PC crashes,
data acquisition should, of course, be continued. All data relevant for the
Dionex Data System server are stored locally on the server's hard disk to ensure that data acquisition is not interrupted in case of a network failure.
In addition to allowing data exchange within a local area on a Windows, Novell,
DEC, or UNIX network (LAN), data transfer across huge distances (WAN) via
ISDN is possible. The basic requirement for any type of network operation is
the availability of the corresponding network drivers for Windows 98 or Windows NT/2000.
Caution:
There are differences between the operation of the Dionex
Data System under Windows 98 and Windows NT/2000. See
Dionex
the following topic in the chapter Installation:
Data System under Windows 98 and Windows NT/2000.
Hardware and Software Chromatography Components
12
Overview: Chromatography Data System
The data system is the control center of the chromatography system. The data
system tasks are to:
• Monitor the state of the connected chromatography instruments.
• Log all user entries and modifications to the system.
• Save and archive all data.
• Graphically represent data and allow the user to check the system status
and system results.
• Allow the user to thoroughly check and evaluate data.
Components
• The basis for precise control is a real-time capable
Operating System.
• Installation and configuration is the task of the
Program.
Server Configuration
• Communication with different instruments and device types is enabled by
the chromatography BIOS and the
Device Drivers.
• Each operation (execution of a command, display of an error message, etc.)
Audit Trail.
is recorded in the
• Depending on the required scope of performance, various Dionex Data
System
Options are available.
Dionex Data System User Interface
• The Dionex Data System follows Windows conventions regarding the menu
Start Screen.
structure, screen elements, and operation (see
Hardware and Software Chromatography Components
13
Operation
• Before the
Program Start, the correct hardware configuration must be
ensured, as well as the connections between the PC and the system and
between the PC and a datasource.
• In
Network Operation, the client PC can control systems and datasources that are not directly connected to the PC.
• Operation of the data system is facilitated by various assistants, called
¾Wizards.
Dionex Data System Options
The Dionex Data System's scope of performance can be adjusted to the requirements of a specific application. In addition to the basic software package,
various options can be purchased.
The purchased scope of performance is coded in a copy protection chip or determined by the ¾License Server (see
Software Protection). The Dionex
Data System can be started with the full range of features only if a protection
device is detected (i.e., a ¾Dongle on the parallel PC interface) or if a license,
provided by the license server, is detected.
The following options are available for the Dionex Data System:
Basis:
The basis license (without additional features) includes signal acquisition
with one timebase.
Control:
Control allows controlling chromatography systems. The software module
must be purchased once to control any number of timebases.
RPC:
With the RPC option, the Dionex Data System can be controlled networkwide. For each installed Chromatography ¾Server, one RPC option is required.
Timebase:
Additional license for extending the Dionex Data System by one timebase. A maximum of 6 timebases per PC can be installed.
Client:
Additional single-user license for data reprocessing on a network PC, including control of any number of systems in the network.
Data:
Additional single-user license for data reprocessing on a network PC
without control.
Hardware and Software Chromatography Components
14
Device Drivers
The Dionex Data System is capable of operating analytical instruments via a
uniform, device-independent control language. The Dionex Data System uses
the driver concept, which means that the appropriate ¾Device Driver must be
loaded for each controlled device. This is done automatically when the data
system is started.
The device driver determines the instrument's scope of function. The driver is
responsible for all device-specific tasks, such as sending commands in the
command language of the device or deciphering the data sent by the device.
Thus, the control program of the data system does not have to deal with specifics, but prompts the driver to execute certain instrument functions.
All drivers are stored in the BIN directory. The version number assigned to a
driver can be viewed in the Explorer via the Properties context menu.
Audit Trail
The Dionex Data System device drivers send the parameters specified in the
control file to the corresponding devices. In addition, they constantly monitor
the device parameters and compare the nominal values with the actual values.
Deviations from the nominal values are either corrected or indicated by an error
message.
Each command, each correction, and each error message is not only recorded
and stored by the Dionex Data System with split-second accuracy, but is displayed in the Audit Trail window of the
Control Panel.
For further information on storing protocol data, refer to the following topic in
Protocol Data (Audit Trail).
the chapter Data:
Installation: Software
15
Installation: Software
Tips for Software Installation
For information about installation of the Dionex Data System, refer to
Installation and Update.
Initial
The software installation procedure is also documented in the PeakNet IA
System Installation Instructions (Document No. 031717).
After installation, refer to
Program Start.
Initial Installation and Update
Tip:
For additional information, also refer to
Dionex Data System Under Windows 98 and Windows NT/Windows 2000.
Dionex Data System Setup
Initial installation of the Dionex Data System is started by opening the Setup
program, SETUP.EXE. If CD Autostart is active on your PC, the installation is
started automatically when a CD is inserted into the drive.
Caution:
The ¾Server, the ¾Client, and the server monitor must not
be active during the Setup procedure. Make sure that there
are no minimized program buttons on the Windows taskbar
and that there is no server monitor icon.
Follow the installation steps to correctly install the Dionex Data System. Please
take note of the directory name in which the Dionex Data System is installed.
At the end of the installation process, a program group <NAME of DIRECTORY> is generated; the program group includes five links to start the different
program parts and to uninstall the Dionex Data System.
The programs on which the links are based are located in the BIN directory in
the directory structure created by the Dionex Data System.
Installation: Software
16
The DATA directory contains various subdirectories (PANELS, REPORTS,
PROGRAMS, PCNAME_1) that serve to save default templates. A default
¾Datasource is also created. The underlying database is located directly in the
DATA directory under the name CM_LOCAL.mdb.
Datasources are visible only in the Dionex Data System ¾Browser (see the
Data section). The environment created by the Setup program has the following structure:
The local datasource has the name <PCNAME_local>. It contains the
PCNAME_1 subdirectory, in which the ¾Sequence "manual" is located. The
sequence, which consists of a single default sample, enables manual data acquisition. To access default templates directly in the Dionex Data System, subdirectories of the DATA directory are mapped (PANELS, REPORT...).
Modifications to the described directory structure are realized by creating new:
• Datasources and sequences (in the Browser)
• Timebases (in the
Caution:
Server Configuration Program).
If the Dionex Data System is not started correctly, there may
be a version conflict between the system files in the Windows
system directory. In this case, install MDAC_TYP.EXE once
again. The
Installation Qualification Manager provides
an overview on the version numbers used.
Installation: Software
17
Dionex Data System Update
Updating the Dionex Data System is started by the SETUP.EXE file.
Note:
When updating the Dionex Data System version, uninstalling
a previous Dionex Data System version is not required and
not recommended, as this would delete all Dionex Data
System entries in the Registry (e.g., key code and datasources). Before updating the version, close the server, the
client, the Server Monitor Program, and all other applications.
If the Setup program detects "old" PAN- (control panel) or RDF- (report definition) files in the PANELS or REPORT directories, the user is prompted whether
to overwrite existing destination files. Therefore, it is highly recommended that
you save any personal PAN-Files and RDF-Files to prevent them from being
overwrittten.
Note:
Before performing an update, copy all PAN-Files and RDFFiles you created to a separate directory, to prevent the files
from being inadvertently overwriten.
The Dionex Data System Under Windows 98 and Windows NT/2000
The Dionex Data System supports the Windows 98 and Windows NT/Windows
2000 operating systems. Although Windows NT/Windows 2000 and Windows
98 have similar user interfaces, their cores differ considerably. Windows NT resembles "large" operating systems such as UNIX or VMS, while Windows 98
still contains traces of DOS. The main focus of Windows NT/Windows 2000 is
stability, safety, and security. These properties are responsible for the higher
storage capacity demands of Windows NT and Windows 2000.
When operating the Dionex Data System under Windows NT or Windows
2000, please note the following considerations:
Setup
Performance of the Dionex Data System Setup on a Windows NT computer requires PC administrator privileges. Otherwise, it is not possible to create datasources or to install various system programs. The Dionex Data System cannot
operate correctly without these settings.
Installation: Software
18
Under Windows NT/Windows 2000, SETUP creates the user group Chromeleon Operators. The user currently logged onto the system is immediately included in this group. All users wishing to work with the Dionex Data System
must also be members of this group. Under Windows NT, adding new users
and assigning them to various groups is via the User Manager. The User
Manager is accessed by clicking Start menu → Programs → Administrative
Tools. Registered users can be added to a group.
Datasources
When generating a new datasource or connecting to an existing datasource,
activate the Common Datasource check box for system-wide access sharing.
The datasource is recognized in the entire system as a system datasource.
Creating system datasources also requires administrator rights on the local PC.
All datasources that are accessed by the Dionex Data System server to process sequences must be system datasources.
Server Access to the Network
Users logging onto a PC have a personal Windows NT user account defining
the currently granted rights. Under Windows NT, the server is installed as a
system-inherent service. As long as the server only works on the local datasource, this will have no negative effects. In contrast, the server will continue
operation even if a user logs off the system.
Problems occur when the server is to perform operations via the network. If the
server should process sequences located on a network datasource, a special
procedure may be necessary under Windows NT. The server must be assigned
a user account for its network access. This is only possible if the user has administrator rights.
Proceed as follows:
• Click the Services icon on the Control Panel.
• Select the Chromeleon Server item from the list and click the "Start..."
button.
• Caution: do not modify the Chromeleon Driver entry!
• In the Services dialog box, activate This Account. Enter a user name and
password with access to the corresponding network directory. Use the button on the right of the edit field to choose a user name from the list.
Note:
The selected user must be a member of the CHROMELEON
Installation: Software
19
Operators group.
If users must change their passwords at regular intervals, it is recommended
that you establish a separate account for the server; this
eliminates the need to change the passwords for the Dionex
Data System server service at regular intervals.
After completion and restarting the system, the Dionex Data System server is
automatically logged on under the new user account.
Software Protection
Each Dionex Data System station (regardless of whether it is a server and/or a
client) is protected by a copy protection chip (¾Dongle). A dongle stores the licensed serial number for one Dionex Data System station.
For large installations, a Dionex Data System license server manages the
availability of licenses.
Each user of a dongle-protected station must enter a 12-digit ¾Key Code during Dionex Data System installation. The key code includes all functions and
options available to the user. A key code matches exactly one serial number.
Caution:
It is not possible to operate several Dionex Data System stations with the same key code or to expand the scope of functions on a different station. Unless the entered key code
matches the dongle, the Dionex Data System can be operated only in the one-hour demo mode.
If the Dionex Data System functions are upgraded by acquiring the corresponding license, the user receives a new key code. The extended scope of
functions becomes available when the new code is entered.
See also: How to ...:
Actions in the Server Configuration / Selecting the
Copy Protection Location and Entering the Key Code.
Installation: Software
20
Server Configuration Program
Function
The ¾Server Configuration program serves to install ¾Timebases on a
¾Server. It is required if you use the Dionex Data System to control a chromatography system and wish to change the current instrument configuration.
For users who perform data evaluation only, it is not absolutely necessary to be
familiar with the Server Configuration program.
Starting the Server Configuration Program
•
To start the Server Configuration program and modify the server configuration, select Server Configuration from the Start/Programs menu on the
Windows taskbar (i.e., select Start/Programs/PeakNet 6/Server Configuration).
Caution:
Modifications of the installation are only possible if the server
to be configured is started (see the following topic in the
Program Start) and if no sequences
chapter Installation:
or samples are currently processed on this server.
When opening the Server Configuration program for the first time or when
changing an existing server configuration, there are also changes in the directory structure.
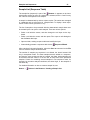
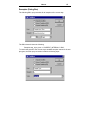
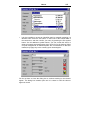
Description
The user interface of the Server Configuration program contains two partial
windows. The left-hand window lists the names of all currently active (started)
chromatography servers. The right-hand window logs the configuration process
(Audit Trail).
A running server is shown in the shape of a PC icon; an inactive server is
crossed out red. An active server (for example, one busy processing samples)
is indicated by a red prohibited sign (red circle with white line).
Click the + character next to any server name to see its timebases and hardware components (Timebase, Hardware). In the same way, the chromatography instruments assigned to a timebase (Devices) can be displayed. Information on the type and number of all installed components, as well as their configuration, is stored in the file CMSERVER.CFG.
Installation: Software
21
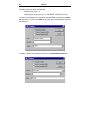
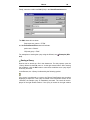
Installation/Configuration Procedure
Access to a server (and the ability to change its configuration) is only possible
after the server has been started, and if sequence and sample processing are
not in progress.
The Server Configuration program allows adding and removing timebases,
hardware, and instrument components. The configuration of each component
can be changed here. The changes are saved in the ¾Server Configuration.
• Select Connect Remote Computer on the Server menu to establish a
connection to a specific server. Enter the computer name of the server and
the protocol to use. As soon as there is a connection to the server, its name
and symbol appear in the left window of the Server Configuration program.
• Select Add Timebase / Add Device on the Edit menu to add new components to the system.
• Select a component in the file structure and double-click to change its configuration. Or, choose the Properties menu item via the right mouse button.
In both cases, a dialog box containing several tab dialog boxes is opened;
these contain all configuration options.
When opening the Server Configuration program for the first time or changing
an existing server configuration, the directory structure also changes.
• The Dionex Data
<PCNAME_local>.
System
creates
a
local
datasource
under
• For each timebase on the current server, the datasource receives a separate subdirectory for storing the corresponding raw data.
• Below each timebase, a sequence directory with a corresponding sequence
is created. The sequence contains a sample for manual data acquisition.
For detailed information on operating the Server Configuration program, refer
to How to ...:
Actions in the Server Configuration Program / Changing
the Server Configuration.
Basic Operation
22
Basic Operation
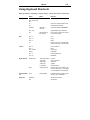
Operation via the Keyboard
All menu items can be reached via the keyboard. Open the desired pull-down
menu by simultaneously pressing the Alt key and the underlined letter (= hotkey). Enter another hotkey to select a menu item. You can also move to the
desired menu item via the arrow keys. Then, confirm your choice by pressing
the Enter key.
Example:
To execute the Align Left function on the Edit menu, subsequently press the keys E, A, and L while you press and hold
the Alt key. Alternatively, enter Alt+E and select a menu item
via the arrow keys Ð and Î.
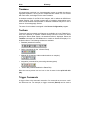
In addition, important commands have "shortcuts." Shortcuts are displayed on
the right-hand side of menu items and functions. Entering the key combination
directly executes the corresponding function.
Example:
Press the Control and C keys (Ctrl+C) to copy a selected
item.
For a list of available shortcuts, see:
How to ...:
Device Control / Using Keyboard Shortcuts.
Basic Operation
23
Operation via the Mouse
The Dionex Data System features the typical Windows properties and capabilities of a two-button mouse.
Use the left mouse button to point and select menus, menu items, and icon
buttons; to operate display and control elements; and to modify windows (increase or reduce the size of a window, zoom, modify display and control elements, etc.). Double-click the left-hand mouse button to execute the selected
function.
Press the left mouse button and the SHIFT key to simultaneously select several cells in a table. Select the first cell with the left mouse button, press the
SHIFT key, and select a new cell. All cells between the two will be selected.
Use the left mouse button and the CTRL key to select cells in a table that are
not adjacent. Select the first cell with the left mouse button, press the CTRL
key, and select a new cell. Keep the CTRL key depressed and repeat until all
required cells are selected.
Click an object with the left mouse button and drag it to the desired position
(Drag and Drop). Thus, you can move selected text items or entire samples.
Perform this operation while pressing the CTRL key to copy the corresponding
object.
The right mouse button is reserved for opening context-sensitive menus.
These menus contain functions that are required or allowed in the current
situation.
For further information, please refer to your Windows manual.
Undo / Redo Commands
The Dionex Data System "remembers" the user's last modification. The operation can be undone by selecting the Undo command on the Edit menu. Select
Redo to repeat the last operation.
Basic Operation
24
Program Start
The Dionex Data System is operated exclusively via a PC equipped with Windows 98 or Windows NT/Windows 2000. As of Windows NT 4.0, both operating
systems feature the same (Windows 95) user interface. A correctly installed
Dionex Data System is started as follows:
Start
• Click the Start button on the taskbar to open the Start menu. Move the
mouse cursor to the Programs menu item and wait until the submenus are
displayed.
• Move the mouse cursor to PeakNet. A submenu with several choices is
displayed.
Client
• Select PeakNet to start the data system and the data evaluation.
Note:
Users wishing to control a chromatography system via the
Dionex Data System must start the Dionex Data System
server.
Server (Server Monitor)
• Select Server Monitor to start the ¾Sever Monitor Program. On the Windows taskbar, the Dionex Data System icon will appear next to the Windows
system clock.
Note:
The Dionex Data System creates a link in the Autostart group
during installation, so that the program is started as soon as
the computer is started. You will see the corresponding icon.
• Move the mouse cursor over the icon. You will see a quick message,
PeakNet Server is not running.
• Press the right mouse button and choose the Start Server command (or
double-click the icon and then click Start). The icon will show various color
steps according to its status. The gray coloring indicates that the server is
running (and the following message is displayed: PeakNet Server is run-
Basic Operation
25
ning idle). From this point, you will have direct access (via control panels)
to the devices installed below a timebase. Provided the instruments are correctly installed, they can be operated online.
Note:
Any problems that occur when controlling single instruments
may be caused by an incorrect server configuration. Start the
Server Configuration Program to check the configuration.
The Client User Interface
The Dionex Data System user interface employs standard Windows elements,
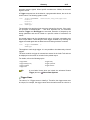
including the menu bar, ¾Toolbar and ¾Status Bar.
The toolbar display (see below) is enabled and disabled via the View menu.
Standard Toolbar for various
standard functions
Online Tools for
using the control
panel
Method Tools for
selecting a
method window
Integration Tools
for the most important operations
in the Chromatogram window
section
Move the mouse cursor over a button to view a description of the button.
The space between the taskbar and the status bar is called the workspace. The
workspace displays four different
Window Types.
Basic Operation
26
Window Types
In the Dionex Data System, there are four different window types with different
appearances and functions. For descriptions, see the topics below:
Control Panel
Browser
Method Window
Table Editor
Control Panel
A control panel (also referred to as an online window) controls and monitors the
chromatography instruments of a ¾Timebase.
For details, see the following topics:
Function
Audit Trail
Function
Control panels are used to control and monitor individual ¾Timebases. The
timebase to be controlled is specified when creating the control panel. As soon
as the control panel is opened, the software automatically attempts to establish
a connection with the specified timebase. If this is not possible (e.g., because
the corresponding timebase was renamed or because the corresponding
Chromatography ¾Server is not in operation), a message appears on-screen.
In this case, the assignment must be changed manually. Proceed as follows:
• Open the preferred control panel via File/Open.
• Select Connect to Timebase from the Control menu and specify the name
of the timebase to be connected with the control panel or select the name
from the available list.
The new assignment is valid until the window is closed. Store the window if you
want to have the current assignment available next time you open the window.
The currently selected timebase is displayed in the status bar.
Basic Operation
27
Audit Trail
The Audit Trail in a Control Panel logs all commands performed during sample
processing and saves information regarding the entire system. This includes
graphical and text information. The Dionex Data System classifies commands,
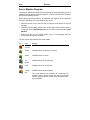
status information, and error messages as indicated below:
System Message
Warning
Error
Abort Error
Next command
(Symbol appears only during the batch and only if there is a connection to a datasource containing the ¾Sequence to process.)
Executed instruction. The color indicates the filter level. The message is displayed
from this level on:
Green: Normal
Yellow: Advanced
Red: Expert
This color code is not valid for manual commands.
Protocol; comments on program steps or descriptions of chromatographic conditions
Message on the screen that must be confirmed by the user
Fulfilled ¾Trigger condition
Triggered command
Manually executed command
LOG command (performed manually / by the device driver)
After starting data acquisition, the Audit Trail window shows the start time and
any subsequently performed commands (Acquisition on, Inject, etc.).
Even commands and status messages that are not automatically recorded
(e.g., the current system pressure) can be periodically retrieved and displayed,
using the Log command.
Basic Operation
28
Of course, each event included in the Audit Trail window is stored. This allows
you to determine later how a sample was processed and which events occurred during sample processing. For more information, see the following topic
in the chapter Data:
Protocol Data (Audit Trail).
For documentation purposes, single events can be included in a report. For
Audit
details, see How to ...: Actions in the Window Section "Report"
Trail.
Browser
The ¾Browser displays the directories in which chromatographic data are located. The Browser allows opening, moving, and deleting chromatographic
data, as well as searching for specific data in various databases. When a file is
selected, it can be opened and its contents can be viewed in a separate window.
Caution: The Browser functions and structure are similar to those of the
Windows Explorer. However, do not confuse the Browser and
Windows Explorer. Do not use the Windows Explorer for operations within Dionex Data System datasources.
For more details, see the topics below:
Common Features with the Windows Explorer
Differences from the Windows Explorer
Function
Common Features with the Windows Explorer
The Dionex Data System Browser window has two separate sections. As in the
Windows Explorer, the directory structure of all selectable directories is displayed on the left. Detailed information on files and ¾Sequences is shown on
the right. Operation is also identical to the Explorer:
• Click the + and - symbols next to each directory name to expand or collapse
the subdirectory structure.
• Select a directory to view its contents in the right-hand window section. Files
and single samples are displayed.
Basic Operation
29
• Double-click a file or sample in the right-hand window section to open the
appropriate editor for a file or the corresponding chromatogram for a sample.
For convenient identification, each file type, sample, or sequence has a typespecific icon. The Dionex Data System automatically recognizes the sample
type (calibration sample, integration sample, PGM-File) or the stored data format and displays the data in the corresponding chromatographic environment.
• Select a subdirectory, a sequence, or a file to drag it with the mouse to a
different directory.
Caution:
For safety reasons, the corresponding data are always copied. To move files, copy them and then delete the original
files. Directly moving files is not allowed.
Differences from the Windows Explorer
Structure
Only chromatographic data that are part of a ¾Datasource are presented in the
Dionex Data System Browser.
A datasource always represents the top level of the Browser hierarchy. The
datasource can be created exclusively with the Browser and cannot be compared to the "normal" subdirectory in the Windows Explorer. A small icon indicates the type of data on which it is based.
Below the datasource level is the familiar Explorer directory structure (yellow
file folder). The directory structure helps to manage different ¾Sequences in a
datasource. A sequence is represented by a blue file folder. It is not possible to
create a subdirectory below the sequence level.
Operation
• Select a datasource, any subdirectory, or a sequence to view its contents in
the right-hand window section of the Browser.
In the case of the datasource or subdirectory, you see the usual list of all directories and files. If you select a sequence, the right-hand window half is divided into two horizontal sections. These include the header (with general
Basic Operation
30
properties of the selected sequence) and a list of all analysis and standard
samples and their sample data (Sequence Editor).
Caution:
The sample data can be edited directly here. Additional samples can be included in the sequence, existing sample data
can be modified, or old samples can be removed. For a detailed description of the sequence editor, refer to the Sequences section.
• Press the right mouse button and choose the Query command to search for
specific sequences, data, or samples (also simultaneously in several datasources). This is a true ¾Query that can also search for specific properties.
Moving, deleting, or copying directories, data, and files is very similar to the
corresponding operations in the Windows Explorer (see ¾Common Features
with the Windows Explorer).
Caution:
Moving, deleting, or opening chromatographic files must be
performed exclusively in the Browser, as processes below
the surface are performed apart from the visible result.
Function
• Use the Browser to set up ¾Datasources and to create subdirectories, to
move files via Drag & Drop, or to delete files.
• Select a ¾Sequence in the left window (blue folder) to display a list of its
contents on the right.
• Double-click a sample name to view the corresponding chromatogram.
• Select a file and press the right mouse button for further functions.
• Select several files (as in the Windows Explorer) and press the right mouse
button to perform a function for several files simultaneously.
• Select a file, press the right mouse button, and start a ¾Query for several
sequences and/or datasources. The result of the query (different files or
samples with at least one common feature) is displayed in the right-hand
window section of the Browser.
Basic Operation
31
Method Window
Offline windows represent chromatographic results; they show chromatograms
and lists of results.
General
Method windows can be opened via any of the following:
• The View menu
• Toolbar icons
• Double-clicking a file
The appearance of method windows can vary considerably. A window can
have various window sections, whose borders can be moved. If the window
section is too small to show all information, the hidden area can be viewed via
the scroll arrows or bars.
The contents of the window section depend on the type of data represented. A
table editor can also be integrated as a window section in a method window.
Window sections with a graphical representation show the coordinates of the
mouse cursor in the status bar.
Table Editor
The table editor is used for representation and entry of various parameters and
variables. This includes creating sequences in the sequence table and the representation of all result variables.
• Appearance and use of all tables correspond to the Windows conventions.
Editing is by cell, column, or line.
• Selected columns can be moved, hidden, or made visible at the current cursor position. The column width is adjusted by moving the left or right delimiter or by applying the function Optimum column width.
• (Unknown samples only) Adding lines to the table.
• (Unknown samples only) Removing selected lines from the table.
• The described functions can be accessed via the right mouse button.
Basic Operation
32
• The font size can be changed. For example, to display more information on
the screen, select a smaller font.
• Press the F1 key to view online Help about a specific column.
• Press the F8 key to open an Edit dialog box for a specific field. This prevents the input of incorrect or invalid values and names.
• Press the F9 key to fill an entire column with the value of the current field.
Logical rows of numbers can also be extended with this method. If the input
is 2, 4, and 6 in the first three fields, the row is continued with 8, 10, 12, etc.
User Profiles (Workspaces)
It is possible to save any combination of windows in a workspace. This facilitates opening single files or windows, and allows the user to work with the
preferred work environment on the screen.
Information about which windows should be used is stored in a WSP-File. If
you want to start working with a specific workspace, open the corresponding
WSP-File or generate a new WSP-File by storing the current screen contents.
• Select the Open Workspace command from the Workspace menu to open
an existing workspace.
• Select the Save Workspace command to save the current workspace.
• Select the Save Workspace as command to save the current workspace
with a new name.
The appearance of each individual window is stored in the
tion.
There is no limit to the number of
workspace.
Notes:
Report Defini-
Windows that can be saved with each
When the Dionex Data System is started, the most recently
used workspace is loaded. Increasing the number of displayed windows and data in a workspace will increase the
loading time.
Basic Operation
33
Report Definition
The ¾Report Definition (RDF-File) contains current settings, such as the
names and scaling of axes, the representation of chromatograms, display of
additional information or auxiliary lines, settings for various font types and
sizes, and the arrangement of columns in a table. The report definition also
determines how the current screen contents (Hardcopy) or online batch results
are printed (see
Printing).
In contrast to the workspace, a report definition can be used for individual windows. The report definition is required whenever a window is not opened via
the workspace. The most recent report definition will be opened. If no RDFFiles have been saved, the default report definition supplied with the Dionex
Data System (DEFAULT.RDF) is used. It is located in the REPORT directory.
• Select Save Report Definition from the context or View menu to save the
current settings.
• Select Load Report Definition from the context or View menu to open a
previously saved report definition.
Create/Open Files, Windows, and Templates
There are several ways to open or create files, windows, and templates. Frequently, other information is required for this.
For example, each time it is opened, the control panel searches "its" ¾Timebase (i.e., the correct link between the client PC and a certain chromatography
system) and each method window searches data from a specific ¾Datasource.
Notes:
If a problem arises in this context, it may be because a correctly installed timebase or datasource is later renamed by a
user.
Similar problems may occur if a database is located on a
network PC to which no link can be currently established, or
for which the user has no share authorization.
In this case, refer to How to ...:
Actions in the Browser /
Setting Up a Datasource / Connecting a Database.
Basic Operation
34
Automatically Loading the Most Recent User Profile
The Dionex Data System automatically loads the most recently used workspace. If this is not possible, the Browser is started.
Opening Existing File Types or Windows
Select the Open command on the File menu, select the datasource and the directory containing the file to open, and select the file type to represent.
Alternatively, open a file by selecting it in the ¾Browser (File menu) and double-clicking it.
Open Most Recent Files and Templates
On the File and Workspace menus, the lower section lists the most recently
used templates and files. Click a template or file to open it. This is the fastest,
easiest way to continue an interrupted task.
New
Select the New command from the File menu to display a list of possible file
types and chromatographic operations.
Sequence Wizard for cre• Select Sequence (using Wizard) to start the
ating a ¾Sequence. The samples to be analyzed are entered in the sequence.
• Select Query (using Wizard) to start the Query Wizard and perform a
¾Query Wizard.
Basic Operation
35
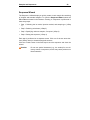
Printing
The Dionex Data System features numerous options for presenting results.
You can print the screen contents, or print using defined templates.
Printing the Screen Contents
To print the contents of the currently active window, select the corresponding
Print ... command. Via Print Sequence, you can print in the Browser the current sample list with either the corresponding PGM-File or QNT-File.
Printing with Report Templates
If one or more samples or sequences are selected in the Browser, Batch Report starts the printed output. The user specifies the report template (¾Report
Definition) to be used, as well as which pages are printed for which sample
type from the selected report template.
Printing in an Online Batch
If several samples are processed in an automatic sample batch (¾Batch Processing), it is possible to define whether to output results after completing the
process and how the results are output.
Printing can be started after processing a single sample or a complete sequence.
Tip:
The report template used for printing is stored with other settings (e.g., screen settings) in the Report Definition (RDFFile).
Control
36
Control
Control Concept
Controlling a system makes high demands on the adaptability of the chromatography data system, as operation of individual components must be easy and
thus device-independent. That is, input and representation of a specific control command is always performed in the same way.
The Dionex Data System enables this by the chromatography BIOS and
Device Drivers.
For details about control of the chromatography system, see the topic below:
Control (Direct)
Control (Direct)
Direct control means the immediate and interactive operation of individual inControl Panel. Please note the folstruments and device functions via a
lowing requirements:
• The data system must be extended by one of the
Options.
Dionex Data System
• Correct installation and configuration of the controlled instrument(s) and device driver(s) via the
Server Configuration Program.
• Establishment of an intact connection between the PC and the chromatography server.
• Establishment of an intact connection between the chromatography server
and the chromatography system via the
LAN.
For an overview of the executable system and instrument commands, refer to
the following topic:
System Commands
Control
37
System Commands
System control comprises all commands relating to the entire chromatographic
process or the entire system. The commands are available via Command on
the Control menu. Some commands are available on the toolbar, also.
Abort Sample
Abort Batch:
¾Stop Flow:
¾Hold:
¾Continue:
¾Acquisition On/Off:
Stops data acquisition and sample; continues the ¾Batch with the next
sample.
Stops data acquisition and batch processing.
Stops the pump flow, interrupts data acquisition, stops batch processing.
Interrupts data acquisition, holds batch processing.
Continues all functions in hold mode.
Starts and terminates data acquisition.
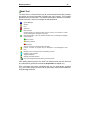
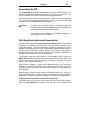
DX-80 Ion Analyzer Commands
The following commands are available for direct control of the DX-80 Ion Analyzer operating functions:
Pump
Turns the pump on and off.
Load/Inject
Switches the injection valve between the load and inject positions.
Offset
PeakNet IA subtracts the value in the Offset field from the total signal value sent by the DX-80. To display the total conductivity, enter
zero.
General Commands
The following general commands are available.
Branch
¾Log:
Starts another program and terminates the currently active program.
Message
Displays a message to the user; suspends the program until the message is clicked.
Logs any message in the ¾Audit Trail.
¾Protocol:
¾Wait:
Delay
Logs device variable values in the Audit Trail (
Protocol Data).
Interrupts the program until a certain condition is fulfilled.
Delays execution of the next program command for the specified
time period.
¾Trigger:
Stops data acquisition and sample processing.
EndTrigger:
Continues all processes in hold mode.
End:
Starts and stops data acquisition.
Control
38
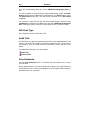
PGM-File
The program file, or PGM-File, is a list of time-precise control commands. The
aim is the automatic and repeated execution of specific routine tasks (for example, automated sample processing or conditioning of a column by rinsing
with solvent). Monitoring of certain parameters or limits can also be performed
via a PGM-File.
The user cannot edit the PGM-File.
Data
39
Data
Data: Overview
Input Data
Various types of input data are required for sample analysis, as well as for
documentation and archiving purposes. The user must determine or enter the
data before starting the analysis. These include the chromatographic conditions
(connected devices, etc.), as well as the run time. A distinction is made among
the following types of data:
• Data that describes a sample (¾Sample Data).
• Data that describes a sequence (¾Sequence Data (usually entered automatically).
• Data that describes the chromatographic treatment of a sample (¾Chromatographic Methods).
The user input data serves as the basis for the analytical process.
Output Data
The data recorded during analysis are referred to as output data. Output data
includes the following:
• Data provided by the analysis process itself (analysis and ¾Raw Data).
• Protocol data on the analysis (¾Audit Trail).
Because of the variety of data types, systematic data organization and
Storage are very important.
Data
Data
40
Datasource
The term ¾Datasource is used for the top level of the directory structure displayed in the ¾Browser. The Browser is also the tool for handling datasources.
Each datasource is based on a separate database. When setting up a datasource, the user must enter a path to an existing database or create a new
database.
• Select the Datasources command from the File menu to set up a datasource. For detailed information on the required steps, see How to ...:
Actions in the Browser / Setting Up a Datasource.
The Browser indicates only the name of the datasource, not the name of the
underlying database. The type and number of the datasources visible to the
user determine the data that can be accessed. This simplified representation
offers the following advantages:
• Data are always accessed in the same way. The user does not have to
worry about the data’s actual storage location in the network. It is not necessary to enter the path because the location is specified when the datasource is created.
• Each user can take advantage of a database without having to deal with
special database programs.
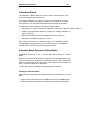
Database Formats of a Datasource
The Dionex Data System supports several database formats. In addition to the
most frequently used Access database format (mdb-container), the data system’s ¾ODBC Capability supports SQL ("Structured Query Language") or database formats such as ORACLE and SQL servers.
When installing the Dionex Data System, a default datasource is created automatically on each client PC. Its name is derived from the computer name (assigned during the installation under Windows installation) and the addition Local. This guarantees that each user has a separate datasource in which "personal" results and data are stored. For single systems, this is the only possibility for data storage. Raw data of each manually performed analysis is stored
here. Therefore, do not delete the datasource <PCNAME_LOCAL>!
Data
41
Directory Structure of a Datasource
Each datasource can be equipped with any number of hierarchically organized
subdirectories via the command File / New Directory.
Caution:
Do not use special characters (e.g., the umlaut) for new directory names or sequences, as this may cause problems on
Novell networks.
Caution:
Actions performed in the Browser, such as creating datasources or directories, require complex operations below the
user interface and cannot be compared to or performed by
the Windows Explorer. The representation of directories and
data also differs considerably from the Explorer.
Subdirectories, sequences, and chromatographic methods can be moved via
Drag & Drop within a datasource, but also between datasources of different
types. This is a copy process that can also change the underlying database. If
you want to actually move a sample, delete the original sample in the Browser
after the copy process.
Caution:
Drag & Drop operations can be executed exclusively via the
¾Browser. Actions outside of the Dionex Data System (e.g.,
in the Windows Explorer) will result in loss of data.
Locking Datasources, Directories, and Sequences
To protect data and results, the Dionex Data System allows the user to lock
datasources, directories, or sequences. If the Locked status is enabled, it is
not possible to modify the corresponding object. This also applies to all objects
below the locked object. If, for example, a datasource is locked, all directories
and sequences in the datasource are also locked. Locked items can be recog).
nized in the Browser by the red lock on the icon (
To lock an object:
• Select the object in the Browser.
• Select the Properties command via the context menu and activate the
Locked check box in the edit box.
Repeat these steps to undo the operation.
Data
42
Data Storage
In order to ensure fast and efficient access to specific data, intelligent storage
and organization of the complete data are very important. The Dionex Data
System solves this problem by storing data and files in different locations. Databases and sequence directories are available for this purpose. Both are part
Datasource.
of the
Storage in a Database
Data that can be compared across sequences are stored and managed in a
relational, ¾ODBC-capable database. This applies to the entire ¾Sample and
¾Sequence Data. The advantage of this type of data management is not only
easy integration into applications such as Excel, Access, or dBASE, but efficient searching and sorting capabilities.
A ¾Query allows you to find all samples processed on a certain day, created
by a certain user, and/or with a certain name.
Storage with the Sequence
All data describing the chromatographic treatment of a sample or data recorded
during the analysis are stored in a ¾Sequence. This includes all protocol data
Raw Data Storage).
and raw data (see
File History
• Select a datasource in the Browser and activate the Enable Modification
History option for the context command Properties.
When the File History Mode is activated, the Dionex Data System prompts the
user for a comment on the modification or operation prior to saving any modified object. This allows you to document all performed modifications, together
with the user name and the object name. In combination with the Copy, Create, and Save as commands, the comment is entered automatically.
Objects can be samples, sequences, or datasources, control ¾Panel, ¾RDF,
¾PGM, and/or ¾QNT files and modified chromatograms.
• Select a datasource or a single directory and select the Show History
context command to see all objects that were modified and for which a
comment was entered.
Data
43
Depending on the filter you use, the Dionex Data System will show a list of all
objects that were modified within a certain period and/or by a certain operator.
• Select an object from the list and click the Details button to view information
about an object.
Data Export
The Dionex Data System offers various data export options that enable communication with other programs:
1.
2.
You can export report pages from the ¾Browser with the Batch Report
command on the File menu. Clicking the Export check box opens the
Batch Setup dialog box, where you can export report pages in five different
formats:
a)
ANDI/Chromatography - AIA (*.cdf)
b)
ASCII text format (*.txt)
c)
Excel file format (*.xls)
d)
Windows metafile format (*.wmf)
e)
Adobe Acrobat file format (*.pdf)
f)
Dionex Data System archive format (*.cmb)
In addition, raw data can be exported in the AIA format from the Browser via
the Export/Backup command under ANDI/Chromatography (AIA). (Also
Raw Data Export).
see
If you wish to send Dionex Data System data to another laboratory (e.g., by eBackup first and transmit the
mail), we recommend that you perform a
compressed data in the Dionex Data System archive format.
Data
44
Backup
To avoid unforeseen data losses, such as may occur due to a defective hard
disk, Dionex strongly recommends a regular backup on a different storage meCreating Backup Files is available in the
dium. For this purpose,
¾Browser.
Backup data are compressed and stored in a different location. Because GLP
does not allow modification of backup data, this data cannot be accessed diRestoring Backup Files function.
rectly. It must be "unpacked" using the
The backup logs each single file that is copied and issues warnings if errors
occur. In the backup process, the complete directory structure is maintained.
Raw Data
All analog or digital values measured by a detector and stored digitally on the
PC are referred to as raw data. Raw data exists only for those signals that were
selected by the user before the analysis.
Raw Data Storage
Raw data storage refers to saving the signals received from a detector in digital
form. Other important data are also stored: analysis time, signal unit, number of
data points, etc.
Storage Procedure
With conventional data systems, an analog value is digitized at a fixed time interval (e.g., a digital value of defined accuracy is stored every second). The
number of stored values per second is normally referred to as the ¾Sampling
Rate. The DX-80 Ion Analyzer sampling rate is 10 Hz.
The higher the sampling rate, the more data points are stored, and the more
exactly the original signal can be restored from the stored data. However, a
higher sampling rate requires more memory.
Data
45
Storage Location
Raw data are stored in the directory of the current sequence. In addition, a
protocol data directory is created. The directories are not visible in the Browser,
because all raw data are managed automatically by the Dionex Data System.
At no time can the user directly access the raw data.
The only way to view raw data is via the Windows Explorer, provided that the
datasources are not locked. However, as the datasource names are not displayed in the Browser, you must follow the path to the corresponding sequence
directory.
A separate raw data file is created for each sample in a sequence for
which raw data were recorded.
Caution:
Do not modify these directories. Operations outside of the
Dionex Data System will result in a loss of data. Therefore,
we recommend that you protect your datasources to prevent
them from being accessed via the Windows Explorer. In the
file or context menus of the Browser, activate the Protect
Data Set Directory option on the Properties tab of the corresponding datasource.
Raw Data Compression
Storing raw data automatically compresses the data. For the signal value, this
is achieved by storing the difference from the next data point, instead of storing
each data point. The actual value is stored only periodically. This increases the
compression by 50%.
Tip:
The compression procedure is not destructive; complete data
are stored and can be restored at any time.
Restoring a Chromatogram from Raw Data
When restoring a chromatogram from the raw data, equidistant data points are
joined with straight lines. Thus, a diagram "resembling" the recorded analog
signal is created.
Data
46
Raw Data Export
The Dionex Data System supports the export of raw data by conversion into
the ¾AIA and ASCII formats. In addition, raw data can be exported as a Dionex
Data System backup file (*.cmb). Use the Export / Backup command on the
File menu to export as an AIA or backup file.
Format
AIA Cat.
Description
2
Samples and peak variables are stored in the AIA format.
AIA Cat. 1+2
In addition to samples and peak variables, the raw data of a chromatogram (all stored data points) are stored in the AIA format.
Dionex data
system backup
(*.cmb):
All data from a sequence are stored in the .cmb format.
ASCII
Raw data are exported in the ASCII format. Use the Batch Report command on the File or context menu. Click Export in the dialog box and
then select the ASCII export format. All raw data for the actual sequence
are stored in the ASCII format.
It is also possible to export data sheets of a report in different formats (see
Data Export).
Raw Data Import
It is possible to import the following raw data formats:
• ¾AIA data (*.txt)
• Dionex data system archive (*.cmb)
From the File menu, select the Import / Restore command and then the corresponding command. Use ¾Restore to import Dionex Data System backup
data.
Data
47
Raw Data Storage in Power-Off Case
The raw data of a sample interrupted by a power failure are not lost, as raw
data are automatically saved ("autosaved") continuously during sample processing. The autosave ensures that raw data are stored on the hard disk in short
intervals. The user can reduce the time interval to approximately 30 seconds.
In the case of a power failure, the maximum data loss would thus be 30 seconds.
If a power failure interrupts the automatic sample batch, the ¾Power-Failure
Protection and the ¾Power-Off Handling ensure that processing resumes at
the same point when the system is restarted.
Protocol Data (Audit Trail)
In addition to raw data, the Dionex Data System also records the data of the
Audit Trail (protocol data storage). The following information is included:
• Commands from a control file
• Manually-executed commands
• Commands activated by a trigger condition
• Error messages
• Start of sample processing
• New start of the Dionex Data System after booting the computer
Each item is stored with the current time. Furthermore, the current program
time is added to information whenever data are recorded or a sample batch is
processed.
Storage is continuous over an entire workday, as well as for the duration of
processing of a single file. Therefore, the following distinction is made:
Daily Protocol
Sample Protocol
Audit Trails can be displayed from the Browser (as daily or sample protocols)
or as Audit Trail control in the control panel. To select the extent and type of
the display, a display filter (Normal, Advanced, Expert, and Error or Warning) can be chosen from the context menu (right mouse click).
Data
48
Daily Protocol
The daily protocol stores all GLP-relevant data related to the status of a specific timebase. This information is displayed in the Audit Trail Control of the
control panel.
When starting the Dionex Data System ¾Server, the 'AUDIT' directory is created in the server datasource below the timebase. The server saves the daily
protocol in this directory. The daily protocol is given the current date as the file
name (e.g., ‘20000926.slg’ for the daily protocol of Sept. 26, 2000). A new file
will be created for each day.
On the right section of the Browser window, the daily protocols are displayed,
together with their names and the time of their last change. A double-click
opens the file and displays its contents in a separate window. The display corresponds to the Audit Trail control of the control panels and can also be
printed.
In the Browser, you can copy and delete daily Audit Trails.
Tip:
The daily protocol is not overwritten by the protocol of the following day. Because the Dionex Data System generates a new
file for each daily protocol, old protocols that are no longer required should be deleted from time to time.
Sample Protocol
The sample protocol contains all Audit Trail data for the corresponding sample.
The sample protocol is part of each default report.
• Display a report in any method window and select the Audit Trail worksheet to view the Audit Trail data of the current sample.
The sample protocol can be activated via the Browser. Open the context menu
of the sample in the Browser. You can open a box via Open and view the sample protocol via Audit Trail.
Samples and Sequences
49
Samples and Sequences
Sample Preparation
Sample preparation is a major part of a chromatographic analysis. It can include simple procedures such as weighing, solving, and diluting a sample, as
well as more complicated physical (filtration, centrifugation, etc.) and chemical
separation procedures (liquid-liquid-extraction or fixed phase extraction). As a
general rule, careful sample preparation contributes substantially to the quality
and reproducibility of a chromatographic separation.
Furthermore, the ¾Dilution Factor) allows the user to define dilution steps, and
can thus be used to consider the sample preparation when evaluating the data.
Sample Processing
Sample processing includes three major steps:
• Sample definition (single samples and sample series)
• Analytical procedure (manual or automatic control)
• Evaluation (methods and reports)
The performance of each step depends primarily on the methods used and the
instruments available. The working environment could range from a fully automatic sample laboratory with large quantities of samples to single-user applications in a research lab. Easy and quick analysis procedures may be the focus
in the first case, while special methods and parameters for peak recognition
may have priority in the latter case. Thus, functions crucial to one group of users may be irrelevant to others.
Please take these facts into account when information is presented from different viewpoints in Help topics.
Sample Registration
In the Dionex Data System, the term sample has a more specific meaning than
in colloquial use.
Samples and Sequences
50
Each injection is defined as an individual "sample."
Multiple injections from the same sample vial under similar conditions are considered several samples.
Defining a sample means the process of determining how much of a substance
is injected from which vial and under which conditions, and which evaluation
parameters are used. A distinction is made between a single sample and a
sample series.
Single Sample
A sample can be analyzed individually by entering all required information and
user commands via the keyboard or the mouse.
The user selects the Inject command, enters the volume to inject, and performs the injection via a hand-operated valve. If an autosampler is available,
the user determines the sample location with the Inject command. Then,
¾Data Acquisition is started (via the Acquisition On command). When the end
of the sample is reached, the user terminates data acquisition (Acquisition Off
command) and specifies where to save the acquired data.
The recorded data are temporarily saved to the manual sequence of the default datasource of the system. In network operation, this datasource is designated with the computer name of the user in the network.
As soon as the user terminates data acquisition, the user is prompted to select
the final storage location for the temporarily saved data.
Sample Series
If several samples are to be processed successively, they are included in a
sample list (sequence table), together with the instrument control and evaluation information.
Then, the samples are processed by starting automatic ¾Batch Processing,
the online batch.
For details how to create a sample list, see
Sample List.
Samples and Sequences
51
Sample List (Sequence Table)
The sample list (sequence) is part of the
Browser. It appears on the lower
right window section as soon as a sequence is selected, and it is "read" line by
line. One line corresponds to one sample.
A sample is characterized by various column entries. The entries are managed
in a database and are referred to as ¾Sample Data. To display a short explanation of each column, press the F1 key.
The list of samples to be processed with the characteristic sample data must
be created by the user prior to each analysis. There are various options:
• Select a cell with the mouse, and then change the cell input via the keyboard.
• Select a cell with the mouse, and then press F8 to open an edit dialog box
that facilitates data input.
• Open a similar, existing sequence table and modify the input.
• Automatically generate a sequence table via the
Sequence Wizard.
After entering all relevant information, select the Save as command on the File
menu to save the sample list with a name.
The number of samples per sequence is not limited, but should exceed 100
only in exceptional cases. The fewer samples that are added to a sequence,
and thus the more sequences that are created, the faster single samples can
be accessed and the easier it is for the user to keep track of the processed
samples. Criteria for combining several samples in one sequence could, for
example, be the same analysis conditions, the same origin, or the samples of
the same day.
For detailed information on how to create a sample list, see:
How to ...:
Actions in the Browser / Creating a Sample List
Samples and Sequences
52
Sequence Wizard
The Sequence ¾Wizard helps you quickly create a basic sample list consisting
of analysis and standard samples. To open the Sequence Wizard, select the
File > New command in the Browser. Creating a ¾Sequence is performed in
these easy steps:
• Step 1: Selecting the ion mode, injection method, and sample type (¾Step
1)
• Step 2: Selecting a timebase (¾Step 2)
• Step 3: Specifying unknown samples, if required (¾Step 3)
• Step 4: Saving the sequence (¾Step 4)
Each step is performed on a separate screen. Click one of the two arrow buttons (<Back, Next>) to browse through the screens.
Click the <Finish> button in the final step to save the sequence and close the
wizard.
Caution:
Do not use special characters (e.g., the umlaut) for new directory names or sequences, as this may cause problems on
Novell networks.
Samples and Sequences
53
Calibration Wizard
The Calibration ¾Wizard helps you quickly create a new calibration ¾Sequence and calibrate the retention time.
If the system shipped to you does not include a preconfigured computer,
the Calibration Wizard automatically appears when PeakNet IA is loaded
for the first time. You must calibrate the DX-80 before beginning operation.
The Calibration Wizard guides you through the following steps:
•
Selecting the ion mode, the number of calibration levels, and the injection method (¾Step 1).
•
Creating a new calibration sequence or copying an existing calibration sequence (¾Step 2).
•
Selecting a timebase for the new calibration sequence ((¾Step 3).
•
Saving the new calibration sequence ¾Step 4.
Each step is performed on a separate page of the Calibration Wizard.
Clicking Next on any page takes you to the following page. Click Finish on
the final step to save the sequence and close the wizard.
Automatic Batch Operation (Online Batch)
Independent processing of one or several sequences is known as ¾Online
Batch.
When the actual sample preparation is completed, the chromatographic conditions of processing, the samples to be processed, and the order of processing
must be communicated to the data system. This is performed in the sequence
table. The result is stored as a ¾Sequence.
To start online batch processing, the following steps are required:
Starting the Automatic Batch
After data input is completed, the analytical process can be started in an online
batch.
• Open a control panel and choose the Edit command from the Batch menu.
• Enter the names of the sequences containing the samples to be analyzed.
Samples and Sequences
54
• Perform a ¾Ready Check.
• Start the analysis process by clicking the Start button.
Processing the Automatic Batch
As soon as the online batch is started, all samples of the sequence with the
status single are analyzed successively. If a sequence contains a sufficient
number of samples, sample processing "around the clock" is possible.
Instead of including all samples in one sequence, they can be distributed in
several sequences. Accordingly, more sequences (a maximum of 16) are then
entered in the batch dialog box.
This list can be considered a batch; it is also referred to as online sample batch
or online batch. The order of the sequences determines the order of processing: when starting the batch process, samples 1 to n of the first sequence are
analyzed, then samples 1 to n of the second sequence, and so on.
Saving the Results
The results of the online batch are saved with the individual samples.
Sample Evaluation
In spite of largely automated work processes and intelligent pre-settings, it is
the responsibility of each user to determine the framework conditions of sample
evaluation.
Result Output
The result of sample processing can be represented in graphics and tables,
either on the screen or as printed output. The Dionex Data System provides
method windows for generating this output.
For a list and detailed description of available method windows, see
Reprocessing
Data
Validation
55
Validation
Validation
Analytical data from various workstations or laboratories can be compared only
if it is possible to determine the quality of the results that were produced.
Validation (Definition)
The process of ensuring that a system and its analysis procedures supply reproducible and reliable results is referred to as validation. This includes procedures guaranteeing the optimum technical condition of instruments (hardware
and firmware) and of computers (hardware and software), especially regarding
planning, implementing, and documenting a method. Validation is thus an integral part of ¾Good Laboratory Practice (GLP).
When is validation necessary?
Instruments should be validated prior to bringing them into service and thereafter at regular intervals. This especially applies after exchanging worn parts,
performing repairs, or replacing an instrument. The system must be validated
after installing a software update, also.
Quantification methods should be validated before they are used in daily laboratory procedure. As the quantification method changes when modifying single
parameters, validation is also necessary in the daily routine.
How is validation performed?
At startup, many instruments perform an automatic self-test to ensure optimum
operation. It is important to check precision, detection limits, the dynamic work
range, and the robustness of a procedure and the involved components. Important issues in this context are validation sample averaging, normal distribution, statistical, and systematic errors, blank reading, selectivity, etc.
The Dionex Data System offers numerous options for meeting GLP and validation requirements. See the topics below for details:
Installation Qualification Manager
Log File CMSetup.log
Validation
56
Installation Qualification Manager
The CMIQ.EXE program, located in the Dionex Data System IQ directory, is
referred to as the Installation Qualification Manager. Following each Dionex
Data System update, this program automatically checks the current installation.
This check can be started manually, as well.
Activating CMIQ.EXE Automatically
After copying all files and completing the Setup, the program is automatically
activated. CMIQ.EXE generates an ASCII report in a file named
CHKSETUP.log. The file can be read using Windows Notepad or a word processor. The file contains information on:
• The system (time, computer name, user name, operating system, processor).
• The Dionex Data System (version, Setup date, Setup operator, key code,
serial number, number of installed timebases, status of installed software
modules).
• All copied files (file name and path, file version, date of last modification
date, file size in bytes, product version, 32-bit check sum).
The data are compared to the data in a write-protected list (IQDATA.dat) supplied with the Setup. If the lists are identical, successful Dionex Data System
installation is confirmed. As soon as there are differences, the Dionex Data
System issues a warning or error.
If a warning is displayed, the functionality of the Dionex Data System should
not be affected. You can start the Dionex Data System as usual.
If any problems occur, please contact Dionex Service. The same applies if the
Dionex Data System reports an error.
Activating CMIQ.EXE Manually
Especially after installing or updating other software packages, specific system
files (DLL) used by several programs may be overwritten. If this occurs, it may
impair the functionality of the Dionex Data System.
In this case, it can be useful to open the program outside the Setup routine via
the Installation Qualification command on the Qualification menu.
Note:
For a correct system check of all files, you must close all ap-
Validation
57
plications (not just Dionex Data System modules). Do not
forget to close the Dionex Data System ¾Server and the
¾Monitor Program.
There are three options:
Check Installation:
Checks the files of the current Dionex Data System version and the
required Windows system files. The type and scope are freely selectable.
Normal:
Checks the Setup.
Extended:
Compares the installation with the stored status
(see Save System Status, below). The scope of
the report is freely selectable.
Full:
Checks and reports all files.
Short:
Checks all files. The report includes only errors and
warnings.
System Information:
Generates the system information of your Dionex Data System.
Save System Status:
Saves the current system status.
Use this option to save the names and the versions of all files contained in the Windows System directory and in the BIN directory of
an operable Dionex Data System version.
If you performed this option once, the saved system status can be
used as the basis for the file check (see Check Installation / Extended, above) instead of the IQDATA list.
Log File CMSETUP.LOG
Complete information about the system and the operations performed by the
Setup is logged in the CmSetup.log file. The file is first saved to the Windows
installation root directory; it is moved to the Dionex Data System main directory
after successful completion of the Setup.
This file includes the following information: who performed the installation,
when the installation was performed, which files were copied, and which files
were replaced by other files with the same names. The latter is especially important, as it indicates which default reports or control panels were replaced.
System Wellness
58
System Wellness
System Wellness Overview
What is System Wellness?
System Wellness monitors the overall "health" of the chromatographic system.
It provides built-in diagnostic and calibration features that help prevent unscheduled system shutdowns and ensure reliable operation. Calibration and
diagnostic commands are available from the Wellness control panel.
System Wellness Features
• The System Wellness control panel, which allows easy access to diagnostic
and calibration commands and data
•
Download of current, previous, or factory calibration data
•
Pressure transducer calibration
•
Conductivity cell calibration
•
Pump and cell diagnostics
For instructions on setting up and using System Wellness features, see How
to...:
System Wellness
Data Reprocessing
59
Data Reprocessing
Definition: Data Reprocessing
Data reprocessing is the presentation of raw data under various aspects.
Each operation is displayed in a separate window. Each partial method is intended for one specific task and has its own window arrangement and menu
structure. The Dionex Data System currently features the following partial
method, which is described in a separate topic:
Integration
Integration
60
Integration
Overview: Integration
The chromatographic process of converting peak areas below peaks in amount
or concentration values is referred to as integration. The integration is performed on the basis of the calibration. It supplies a calibration curve and a calibration coefficient.
Inserting the calibration coefficients in the formula for amount calculation supplies the amount concentration in a single peak area. The data system automatically performs this process for all peaks it "finds."
The number of peaks that are detected, and whether any of the peaks can be
identified, depends on whether an anion or cation analysis is running.
The results of the two processes, area calculation and peak identification, are
represented graphically (chromatogram) and as a table (Report) in the window
of the partial method Integration.
Integration
61
For more information, see the topics below:
Operation
Integration Report
Peak Summary Report
Chromatogram Comparison
Operation
Opening
Opening a sample automatically opens the integration method window and displays the sample chromatogram. There are three options:
• Double-click a sample of a specific sequence in the Browser, or
• Select a sample in the Browser and double-click, or
• Select File > Open, and then select Sample in the Object of type list box.
Modifying the Appearance
Each displayed chromatogram can be changed by enabling and/or disabling
the display of various elements and by modifying them.
• Double-click a peak to see the Peak Properties.
• Draw a frame around the section of the chromatogram that you want to enlarge.
• Select the Decoration ... command on the context menu (right mouse button) to modify the window background, the different axes, the layout of individual peaks and the color, shape, and size of their captions.
Opening Additional Window Sections
Use the following commands to display further window sections:
• Select the Split Zoom command from the View menu to split the window.
By drawing a frame, you can zoom a section of the window. The upper half
of the window shows the entire chromatogram and the frame, the lower half
displays the zoomed section. Use the mouse to move and position the
frame in the upper window section. This mode is recognized by the shape of
the mouse cursor ( ). Of course, a new frame can be drawn at any time.
Integration
62
• Select the Report command from the View menu to display the integration
Integration/Integration Report).
report (see
• Compare two chromatograms by enabling the display of an additional
chromatogram (see
Integration/Chromatogram Comparison).
Integration Report
The integration report is opened via the Report command on the View menu. It
is displayed as a table in the window of the partial method Integration.
Contents
• The table contains numeric data relating to retention time, peak area and
height, amount, peak type, and other peak variables.
• If the chromatogram is modified, this is reflected immediately by the
changed report data.
• Via the Windows Clipboard, data from the report can be directly integrated
into other Windows applications.
• The chromatogram and the integration report can be printed at any time via
the Print command.
Peak Summary Report
Commonly used ¾Reports, such as integration reports and calibration reports,
contain data for just one sample. In the case of a chromatogram comparison,
only the data of the currently selected chromatogram is displayed.
It is possible to compare peak data from different samples via the Peak Summary partial report.
Sample Selection
• If one sample is selected and opened from the Browser, the Peak Summary is based on the corresponding ¾Sequence.
• If several samples are selected in the Browser, only these selected samples are part of the Peak Summary.
Integration
63
• If a ¾Query is started in the Browser, the search result forms the basis for
the Summary. In this way, it is possible to compare peaks from different sequences.
Peak Selection
• Normally, no peak is selected in the chromatogram of the sample. The
Peak Summary Report therefore contains no entries. All fields are marked
n.a. (not available) or Div/0 (Division/0). Only when a peak is selected
manually within a chromatogram does the Peak Summary Table contain
entries. As soon as this is performed, this peak is searched in all previously
selected samples. The search result is displayed in the Summary Report.
• If the currently selected peak is an identified peak (i.e., a peak labeled with
its name in the peak table), all involved samples are searched for this peak
name. The corresponding values of all found peaks are displayed in the
Summary.
• If the currently selected peak is a non-identified peak (i.e., a peak not labeled with its name in the peak table), a "fixed time window" (± 5% of the
detected retention time) is calculated for this peak. All peaks within this time
window will be included in the summary. If two or more peaks are detected
in the time window, the peak that is nearest to the specified retention time
will be selected. If the peak is an identified peak, this will be indicated by
Ambiguous? in the Summary header.
Creating a Summary
• Double-click one of the samples to open the Integration window.
• Display the Report and select the default Peak Summary worksheet, which
contains a selection of the most important default peak variables. A separate line in the report is reserved for each sample that is part of the Summary.
As in all reports, the currently selected sample in the chromatogram window is
highlighted in the Summary Table.
Chromatogram Comparison
When comparing two or more samples or chromatograms, a comparison of
their numerical results would be the most exact method. However, overlaying
Integration
64
the chromatograms is often sufficient. This is performed via the chromatogram
comparison.
What can be compared?
Multiple injections can be overlaid. The number of simultaneously displayed
chromatograms in the Dionex Data System is theoretically unlimited. However,
when numerous chromatograms are displayed, the presentation becomes
confusing. Therefore, the Dionex Data System prompts the user to confirm
whether to display more than 20 chromatograms. This prevents the display of
chromatograms due to an operator error and a resulting decrease in system
performance.
How are chromatograms compared and displayed?
Chromatograms can be displayed in the integration window and compared.
One chromatogram represents the currently active chromatogram. It is selected
with the mouse. It can be recognized by the additional information displayed
(decoration, etc.). The names of all represented chromatograms are listed
above the window. The currently active chromatogram is marked by a different
color. Clicking the name of any chromatogram selects it as the active chromatogram.
The presentation of the window and the active chromatogram is controlled via
the Decoration command on the context menu.
How do I select the chromatograms to be compared?
There are various ways to select chromatograms:
• Select one or several samples in the Browser, and drag them into an open
integration window.
• Select the Add Overlay ... command from the File menu to display a specific channel of any sample in an opened integration window.
• Select the Compare command to compare a specific channel in several
selected samples.
• Perform a query to specifically compare samples with certain properties.
• Click the Next Chromatogram icon ( ) while holding down the CTRL key
to also display the chromatogram of the next sample.
• Click the Previous Chromatogram icon ( ) while pressing the CTRL key
to also display the chromatogram of the previous sample.
Integration
65
For details on selecting chromatograms to compare, see How to ...:
Actions in the Window Section "Chromatogram" / Performing a Chromatogram Comparison.
Placing chromatograms in relation to each other
In general, the appearance of a chromatogram is affected considerably by such
factors as solvent, column quality, etc. As these conditions cannot be modified
later, other possibilities must be found to perform as exact a comparison as
possible. This is achieved by adapting the position and the size of a chromatogram to match another. There are several ways to achieve this:
• Chromatograms can be assigned an offset in the x- and y-direction.
• Chromatograms can be time-normalized (i.e., they can be overlaid at a specific retention time).
• Peak height can be normalized (i.e., the height of a specific peak can be
adjusted).
• Chromatograms can be stretched and compressed.
• Chromatograms can be subtracted from each other.
For the active chromatogram, Decoration is chosen via the context menu.
Enter the settings in the Comparison tab dialog box.
For further details, see How to ...:
Actions in the Window Section "Chromatogram" / Performing a Chromatogram Comparison.
Printer Layout
66
Printer Layout
Printing
From the Printer Layout
The Printer Layout allows you to print the report template at any time.
• Select Print from the File menu to start printing.
• Click Preview in the Print dialog box to preview the layout of the printed
output.
The printed output uses the data of the current sample with the layout of the
currently opened sheet.
From the Browser
The Browser allows printing single samples and entire sample series.
• Use the mouse to select the samples to print. If you want to print all samples of one or several sequences, just select the corresponding sequence(s).
• Perform a ¾Query to use samples from several sequences.
• Select Batch Report ... from the context menu and select the Report Definition to be used for the printed output. Also specify the printer.
In addition to the results, it is possible to print sample data (the information in
the sample list).
• Open a sample list and choose Print Table ... from the context menu.
How to
How to ...:
67
68
How to
How to
69
Actions in the Server Configuration
Program
The following topics contain useful information about the installation of the
Dionex Data System software.
Changing the Server Configuration
Selecting the Copy Protection Location and Entering the Key Code
Updating Moduleware
Before connecting new chromatography components to the data system, read
the following topic:
Adding Timebases / Instruments
If a device is connected to the Dionex Data System via the LAN (local area
network), certain built-in diagnostic and calibration functions are provided.
These functions, known as System Wellness, are enabled and disabled from
the Server Configuration program. See the following topic for details:
Enabling/Disabling System Wellness Functions
Changing the Server Configuration
Starting the Server Configuration Program
To start the Server Configuration program, select ¾Server Configuration from
the Start/Programs menu on the taskbar (i.e., select Start/ Programs/ PeakNet 6/ Server Configuration).
Caution:
Modifications to the server configuration are only possible if
the corresponding ¾Server was started before. Normally, this
is done automatically when starting the computer on which
the server is installed.
70
How to
Configuring the Server
Select the name of the server on which you want to extend or change the configuration, and double-click. Then, enter the ¾Key Code and the type of
Software Protection.
Adding Components
Select the name of the server of which you want to extend the configuration.
Click the + character in front of the server name to view its current configuration.
Select the following commands via the Edit menu or the right mouse button:
•
Add Timebase to install a ¾Timebase on the server. Enter the name of
the timebase in the Edit box.
•
Add Device to add more chromatography instruments to a timebase. Select the instrument from the list. Only one instrument can be added at a
time.
Tip:
When the timebase is created, a corresponding folder is also
created in the Browser. This folder has the same name as
the timebase and contains a default Sequence table and a
folder for
Protocol Data files for the timebase.
Configuring Components
Click the component to configure and select the item Properties from the right
mouse button menu. Each configurable component has one or more tab dialog
boxes for alternative settings. Refer to context-sensitive online Help for information on possible settings.
Deleting Components
Click the component to delete and select the item Delete from the right mouse
button menu.
Tip:
When deleting a timebase, all instruments installed below
this timebase are also deleted. The same applies to deleting
single hardware components or the complete hardware. If
you select a server and choose Delete, the components and
the installation file CMSERVER.CFG are deleted.
How to
71
Copying or Moving Components
Each selected component can be copied to the Clipboard via the Copy command, and then inserted in a different place via Paste. It is also possible to Cut
single components. Alternatively, both actions can be performed via Drag &
Drop.
Saving the Server Configuration
Each modification to the Server Configuration (adding, moving, deleting, or
configuring single components) can be saved. There are two possibilities:
•
Save Installation (Name) saves the current server configuration as a new
configuration directly on the server.
•
Save as saves the current server configuration with a freely selectable
name (and the extension .CFG) in any directory. The file CMSERVER.CFG
is not overwritten and is still valid. Configuration files saved with this
method are "personal" server configuration files. These enable the user to
quickly change from one installation environment to another by simply
loading the file.
Loading the Personal Server Configuration to a Server ("Import")
To use a personal server configuration as the valid server configuration
CMSERVER.CFG, perform the following steps:
•
Start the Server Configuration program.
•
Activate the server for which the personal server configuration is to be
valid.
•
Select the Import... command from the File menu and specify the name
and the directory of the personal server configuration. The configuration is
loaded to the server.
•
Select Save to save the personal server configuration under the name
CMSERVER.CFG. The previous file with this name is overwritten with the
contents of the personal configuration. All changes are indicated in the file
tree of the Server Configuration program, or when opening the corresponding tab dialog boxes.
72
How to
Check Configuration
After installing and configuring new components, the current server configuration should be checked.
Select the Check Configuration command from the Server menu to start the
check.
The Dionex Data System shows the result in a separate dialog box. If no errors
or conflicts occur, the current server configuration can be saved.
If the system issues one or several warnings, the user must decide whether to
change the current configuration.
If the system issues an error message, the cause must be found and remedied
before optimal operation be ensured.
Installation Configuration Report
The configuration report contains information about the server itself (e.g.,
name, key code, copy protection) as well as the name of the connected timebase(s). In addition, the report lists the settings of the instruments assigned to
the timebase.
•
Select the Create Report command from the Server menu to generate a
report.
•
Click the Save button to store the report in the CMINST.LOG file. The old
file is then renamed CMINST.OLD. Caution: The report is always saved to
the BIN directory of the server!
•
Click the Print button to copy the report to Windows Notepad and to print it
from there. After creating the report, it is also on the Windows Clipboard
and can be inserted in other applications.
How to
73
Selecting the Copy Protection Location and Entering the
Key Code
You may enter the software protection location and the ¾Key Code for either a
server PC or a client PC:
•
In the case of the client PC, select Preferences on the File menu of the
Dionex Data System client. The License tab of the Preferences dialog box
allows you to select the copy protection location and to enter the key code
as described below.
•
In the case of a server PC, open the Server Configuration program by
clicking Server Configuration. Double-click the appropriate server name
to access the General tab. The options described below are possible only
if the corresponding ¾Chromatography Server was previously started.
Generally, this is performed automatically when starting the computer on
which the server was installed. If this is not the case, start the Dionex Data
System via the ¾Monitor Program.
Selecting the Software Protection Location
Specify whether your system is protected by a ¾Dongle or a ¾License Server.
•
Select Dongle if your system is protected by a dongle on the parallel PC
interface.
•
Select License Server if your license was generated by a license server.
(This disables the edit field for the key code.) Clicking the Browse button
"..." to the right of the License Server opens a dialog box where you specify the computer on which the license server of your Dionex Data System is
running.
Entering the Key Code
The key code is also entered via the Properties or License dialog box. Enter
the 12-digit key code in the corresponding field.
74
How to
Updating Moduleware
Follow the steps below to install a new version of ¾Moduleware in the DX-80
Ion Analyzer.
1 Insert the CD containing the new Moduleware version into the CD drive.
2 Start the ¾Server Configuration program by selecting Server Configuration from the Start/Programs menu on the taskbar (i.e., select Start/ Programs/ PeakNet 6/ Server Configuration).
3 Select Dionex UDP Interface under Sharable Devices and select Properties from the Edit or context menu.
4 Select the Update Moduleware tab. The names of the currently connected
modules, their serial numbers, and current Moduleware versions are displayed.
5 Click the Select button.
6 Select the file containing the new Moduleware version and click OK. The
selected file appears in the Moduleware File box.
7 From the list of modules, select the DX-80 Ion Analyzer to be updated and
click the Update button. Repeat this step to update any additional modules.
Important: Make certain the Moduleware matches the module type before updating. Downloading the wrong type of Moduleware
can corrupt the module's memory.
8 The new Moduleware version is downloaded to the selected DX-80. To display the new version number in the list, click the Rescan button.
Adding Timebases / Instruments
The Dionex Data System can control two DX-80 Ion Analyzers via a LAN. Each
instrument, as well as the PC on which the Dionex Data System is installed,
must be equipped with a 10BASE-T compatible PCI LAN card (the DX-80
motherboard contains a built-in LAN card), connected with 10BASE-T LAN cables, and have the appropriate device driver installed.
After PeakNet IA is installed, start the ¾Server Configuration program and assign each DX-80 to a timebase. Refer to Installing the PeakNet IA System
(Document No. 031717) for details.
How to
75
Enabling and Disabling System Wellness Functions
The Properties dialog box for the DX-80 Ion Analyzer includes two tab pages,
Calibration and Diagnostics, that allow you to enable or disable individual calibration and/or diagnostic functions. By default, all DX-80 calibration and diagnostic functions are enabled.
Follow the steps below to disable calibration and/or diagnostic functions for the
DX-80 or to enable functions that are currently disabled.
1. Start the Server Configuration program.
2. Under the ¾Timebase, select the DX-80 for which you want to disable or
enable the calibration and/or diagnostic functions.
3. Select Properties from the Edit or context menu and select the Calibration
or Diagnostics tab.
4. Enable or disable individual calibration or diagnostics functions by clicking
the Activate box next to each function in the list. To enable or disable all
calibration or diagnostics functions, right-click and select the Activate All or
Deactivate All command from the context menu.
76
How to
Actions in the Control Panel
See the following topics for details on how to load a
to modify the timebase assignment:
Control Panel and how
Loading a Control Panel
Connecting a Control Panel with a Timebase
See the following topic for details on how data acquisition can be simulated in a
control panel:
Using/Recording Demo Data
Loading a Control Panel
Before processing a new unknown sample or beginning operation, the DX-80
Ion Analyzer control panel (¾Panels) must be loaded, either manually or automatically:
Manually
The DX-80 control panel is named DIONEX_DX80_SYSTEM.PAN. Search for
the file directly in the ¾Browser, in the Panels directory of the local ¾Datasource. Select the control panel and double-click the name to open it.
Each window must be connected with a ¾Timebase. When opening the window, the Dionex Data System automatically establishes a connection to the
most recently used timebase. This is usually the timebase that was assigned
during installation. Naturally, each window can be connected with any other
Connecting a Control Panel with a Timebase).
timebase (see How to ...:
Automatically
When starting the Dionex Data System, the most recent ¾Workspace is
loaded. If this view contains a control panel, it will also be loaded.
If it is not possible to load a workspace (for example, because no such view
was arranged by the user), the control panel must be opened manually.
How to
77
Connecting a Control Panel with a Timebase
When loading the DX-80 Ion Analyzer control panel (= ¾Panel), it is automatically connected with the previously stored ¾Timebase. This timebase assignment can be modified at any time.
•
Open the DX-80 Ion Analyzer control panel (DIONEX_DX80.PAN) and select the Connect to Timebase command from the Control menu.
On the left, the input dialog box displays the name of the current timebase, the
computer name of the corresponding ¾Server, and the communications protocol. On the right is the icon for the local computer (My Computer). If the computer is connected to a network, an icon for the network neighborhood is displayed, also.
•
Open the directory tree by clicking the + character.
•
If the server is started, all timebases of the local server are listed below My
Computer. If the server is not active, or if no server is installed, the message The server is not running is displayed.
•
Below Network Neighborhood is a list of all PCs currently connected to
the network. Open the directory tree below a computer name to see
whether a Dionex Data System server is installed on this computer. If the
server is active, the names of the corresponding timebases are visible;
otherwise, the message The server is not running is displayed.
•
Select the name of a timebase and complete the input by clicking OK.
The Dionex Data System now connects the DX-80 control panel with the corresponding timebase. If the action is successfully completed, the connected instrument(s) can be controlled via the controls in various colors.
Problems with Establishing a Connection
Whether a non-local server is visible or can be accessed depends on which
network protocol is selected. The system requires several
seconds to determine whether the selected protocol can be
used. If no connection is established to a specific timebase,
there are several possible reasons:
•
First, check whether the corresponding server is running.
•
If the corresponding server is running, try another network protocol. The
Dionex Data System can communicate via various network protocols (e.g.,
IPX, TCP/IP, or NetBEUI).
78
How to
Caution:
Communication between two stations is possible only if the
same network protocol is installed and selected. Generally, it
is sufficient to install the corresponding Microsoft (IPX/SPXcompatible protocol, NetBEUI, TCP/IP) or Novell (Novell
IPX ODI Protocol) network protocol via Settings/Control
Panel/Network/Configuration. The protocol that is actually
used depends on the current network installation. Please
contact your network administrator. If a connection is to be
established to a Windows NT/Windows 2000 computer, this
is usually possible via the Named Pipes protocol.
•
Sometimes, the required timebase exists (Server is running) but is not displayed. Or, this can also occur when linking two computers via an ISDN
connection. The cause is usually a slightly incorrect network installation. In
this case, open the Connect to Timebase dialog box again.
•
If the IPX/SPX compatible protocol is used, select the Activate NetBIOS
with IPX/SPX option under Settings/Control Panel/Network/
Configuration/Properties/NetBIOS.
If it is still not possible to establish a connection, contact Dionex for assistance.
Problems with Controlling Instruments
In addition to the control mode, the Dionex Data System offers the Monitor
Only mode. If a user establishes a connection to a timebase via a network, the
user receives the monitor only status on this timebase.
The monitor only status is also assigned when a user attempts to access a local timebase that is currently in use by an external user.
•
Deactivate the Monitor Only command on the Control menu to enable
complete control of the timebase.
How to
79
Using/Recording Demo Data
Simulating Data Acquisition
Demo Mode lets you simulate data acquisition by loading a pre-recorded demo
file and then displaying the data from the demo file in the ¾Panel's signal window. The demo file is "read back" as though the data were being acquired in
real time.
1. To select Demo Mode, start the ¾Server Configuration program and select
the DX-80 Ion Analyzer under the timebase.
2. Select Properties from the Edit or context menu.
3. Activate the Demo Mode for the DX-80 on the General tab page.
4. Select the demo file from the list.
5. Open the DX-80 control panel (DIONEX_DX80.PAN), connect to the timebase, and then turn on data acquisition. The Data Acquisition dialog box
appears.
6. The demo file begins running, and will run continuously until data acquisition
is turned off.
Recording Demo Data
1. To create a demo file for the DX-80, open the Properties dialog box in the
Server Configuration program and select Write under Demo Mode on the
General tab page.
2. Enter a name for the demo file. Select the Device ID under Communication.
3. To write the demo file, open the DX-80 control panel (DIONEX_DX80.PAN)
and turn on data acquisition. The data acquired from the DX-80 is recorded
in the demo file.
4. To stop recording data, turn off data acquisition. The demo file is then complete.
80
How to
Actions in the Browser
Use the
and files.
Browser to manage, copy, move, and delete chromatographic data
Warning:
The Browser functions are similar to those of the Windows Explorer. However, do not confuse the Browser and Windows
Explorer. Renaming or moving files in the Windows Explorer
makes them invisible to the Dionex Data System. Thus, the
files could be unintentionally deleted.
In addition, the Browser allows creating a sample list, setting up datasources,
searching, and selecting data in a database. For further details, see the topics
below:
Creating a Sample List (Sequence Table)
Setting Up a Datasource
Handling Files, Datasources and the Network
Performing a Query
System Wellness
Creating a Sample List (Sequence Table)
There are two ways to create a
Sample List: manually or automatically.
Manually
•
Select a sequence in the left window section of the
•
Enter the name and the properties of the standard and unknown samples,
line by line, in the lower partial window on the right.
Browser.
Proceed as follows:
•
Click the cell in the table and enter the new value or the name via the keyboard.
•
Enter a name for each sample to analyze in the column ¾Name.
•
Input in the remaining columns (¾Dilution Factor and Comment) is optional.
How to
81
•
If you are not sure which values or names to enter, select the cell and
press the F8 key. This opens an edit dialog box, in which all valid values
and options are listed. Select the desired value. The cell input is then
automatically updated.
•
Press the F1 key to view further information about individual columns.
•
Press the F9 key to fill all subsequent cells of a column with the same input.
•
Save the sequence with a new name (Save as).
•
Check the sequence properties by clicking Alt + Enter.
Tip:
It is possible to edit an existing sequence. However, the currently running sample cannot be edited (the corresponding
line in the sample list is indicated by a different color).
Automatically
•
Select the New command on the File menu and select Sequence (using
Wizard).
•
Click OK to start the
•
Follow the instructions in the Wizard to create a basic sequence.
•
Press the F1 key for more help.
Wizard.
How to ...: Setting Up a Datasource
All steps connected with the
Datasource setup are initiated using the Datasources command on the File menu.
•
Open the ¾Browser and select the Datasources command on the File
menu.
The datasource manager lists all ¾Datasources that can be accessed by the
¾Client.
82
How to
Tip:
As
a
minimum,
the
default
datasource
(<PCNAME_LOCAL>) created during the Dionex Data System installation should be visible here. If a local station is not integrated on a network, the name entered in the operating system under Control Panel / Network / Identification is used
instead of the computer name. If no identification was entered, the datasource is named DEFAULT_LOCAL.
For information about the possible actions at this point, see the following topics:
Connecting a Database ("Connect")
Disconnecting a Database ("Disconnect")
Creating a New Database ("New")
Opening the ODBC Manager ("ODBC Mgr.")
Connecting a Database
In order to access data in an existing ¾Database, there must be a connection
between the ¾Client and the database.
•
Open the ¾Browser and select the Datasources command.
•
Select the Connect button in the datasource manager to establish a connection to a datasource.
•
Select the type of the underlying datasource.
It is possible to connect to Dionex Data System databases ("Native Dionex
Data System Datasource"), default Microsoft Access databases ("mdb containers"), and to SQL and Oracle databases ("SQL servers").
Different input is required, depending on the datasource type:
•
For Access datasources, the mdb container must be specified.
•
For SQL datasources, the dialog box for the ODBC driver will be opened.
Tip:
If you want to include databases in the ¾SQL or ¾ORACLE
formats, refer to the corresponding topic.
How to
83
Disconnecting a Database
The ¾Datasource can be disconnected at any time, if necessary. Once this is
done, the client is denied access to the disconnected datasource.
•
Open the ¾Browser and select the Datasources command.
•
Select the datasource in the datasource manager and click the Disconnect
button.
Tip:
The connection to a datasource can also be terminated via
the Dismount Datasource command on the context menu.
For details about the Mount/Dismount Datasource comDatasources on Removable
mands, see How to ...:
Media.
Creating a New Database
The Dionex Data System enables setting up a ¾Datasource with a new database. The new database is always in the Microsoft Access database format
(mdb container).
•
Open the ¾Browser and select the Datasources command from the File
menu.
•
Select New to create a new database.
•
Enter the name of the new datasource; this name will be displayed in the
Browser.
•
Enter the path of an empty subdirectory in which to store the database for
the new datasource. Use the Browse button to search for an empty directory.
Caution:
•
Creating a database is possible only if the selected directory
is absolutely empty.
If Common Data Source is activated, the Dionex Data System ¾Server
can access this datasource. Processing sequences is possible only on datasources with this setting.
84
How to
Tip:
The local datasource is always selected as Common Data
Source. If a datasource is not defined as Common Data
Source under Windows NT/Windows 2000, the datasource
must be set up for each potential user.
Upon completing the procedure (OK), the Dionex Data System generates a
database named cm_local.mdb in the selected directory. Databases with different formats cannot be generated in the Dionex Data System; they must be
created with the appropriate database software.
Opening the ODBC Manager
Caution: Modifications to the ODBC configuration should be performed only
by experienced users. Otherwise, loss of data may result and re-installation of
the Dionex Data System may be necessary.
Normally, no modifications are required here. If a modification is required (for
example, to repair a damaged database in a Microsoft Access datasource),
proceed as follows.
•
Click the ODBC Manager button in the ¾Datasource Manager to open the
Windows ¾ODBC dialog box of the control panel.
Handling Files, Datasources, and the Network
To handle, store, and save data in the best possible way, the Dionex Data
System offers several options:
Locking Datasources on Removable Media
Locking Datasources, Directories, and Sequences
Opening Protocol Data (Audit Trails)
Creating Backup Files
Restoring Backup Files
How to
85
Locking Datasources on Removable Media
¾Datasources can be installed on removable media (a floppy disk, Zip disk,
CD-ROM, etc.), in addition to the hard disk of either the local PC or network
PC.
•
Select the Mount Datasource command on the File menu and select a
drive, or search for the datasource via the Browse command.
The Dionex Data System will automatically show the Windows drive letters of
all currently available removable media.
•
If the Dionex Data System finds an existing datasource on the selected
media, this datasource is automatically "connected" and is displayed in the
Browser.
•
If the Dionex Data System does not find a datasource on the selected media, the user can install a new datasource on this drive. The datasource will
be given the name of the drive.
Tip:
Datasources in the Microsoft Access database format can be
copied to the removable medium. Simply copy the DATA directory of the local datasource of the corresponding subdirectory of a network datasource to the removable medium.
Caution:
If a connection is established to a datasource on a removable
medium via the Mount Datasource command, do not remove the medium until the connection is correctly terminated
via the Dismount Datasource context command. Otherwise, the operating system will crash!
Locking Datasources, Directories, and Sequences
To protect data and results, the Dionex Data System allows you to lock ¾Datasources, directories, or sequences. When the "Locked" status is enabled, it is
not possible to modify the corresponding object. This also applies to all objects
below the locked object. If, for example, a datasource is locked, all directories
and sequences contained in the datasource are also locked. Locked items can
be recognized in the ¾Browser by their icon (a red lock).
86
How to
Proceed as follows to lock an object:
•
Select the object in the Browser.
•
Select the Properties command via the context menu and select the
Locked check box in the edit box.
Proceed as follows to unlock an object:
•
Select the object in the Browser.
•
Select the Properties command via the context menu and clear the
Locked check box in the edit box.
Opening Protocol Data (Audit Trails)
From the Browser, protocol data (either
Protocol Data (Audit Trails) for a
single day (
Daily Protocols) or for a single sample (
Sample Protocols)) can be activated.
In the server datasource, daily protocols are located in the AUDIT directory under the corresponding ¾Timebase. Daily protocols can be opened by doubleclicking.
To view a sample protocol, the corresponding sample must be selected. Select
Open via the context menu (right mouse click) and open the sample protocol
via Audit Trail. Alternatively, you can view sample protocols in the Report. To
open the sample, double-click and select the Audit Trail tab.
How to
87
Creating Backup Files
The Dionex Data System includes a program that allows you to create backup
files.
Before starting the ¾Backup, the objects to archive must be selected in the
¾Browser. All selection options of the Browser are supported. Select the Export/Backup command on the File menu to open the Backup dialog box.
Backup copies of the following objects can be created:
When selecting...
... a backup copy is created of:
a directory
All subdirectories and the included files, sequences, etc.
a sequence
All samples, as well as files included in the sequence (QNT-File
and PGM-File).
individual samples
The sequence information (name, directory, title, etc.), the selected samples, and the ¾PGM and ¾QNT files used by the selected samples.
other files
The corresponding files.
When using the ¾Query function in the Browser, these are the selection options:
When selecting...
... a backup copy is created of:
individual samples
The sequence information (name, directory, title, etc.), the selected samples, and the PGM-File and QNT-File used by these
samples.
sequences
All samples contained in the query of the corresponding sequence.
The following linked objects are also copied when creating the backup:
Object
Link
sequence
Preferred ¾RDF file
peak table
Calibration list for the calibration mode "fixed".
Query
Preferred RDF file
samples
QNT-File
PGM-File
Select Backup to open the Backup dialog box. For a description of the individual fields, see ¾Backup.
Before starting the backup, the required storage space is determined. In the
case of hard disks and network drives, the Dionex Data System checks
whether there is sufficient storage capacity. If there is not enough space, an error message appears to allow the user to cancel the backup procedure.
88
How to
If using removable media, the expected number of media is displayed. The
user is prompted to keep the media ready. If using data compression, the number of actually required media may differ from the displayed number.
After that, the selected objects are stored. A dialog box appears to allow the
user to monitor the procedure. A progress bar indicates the current status. The
bar corresponds to the percentage of stored data already copied to the medium.
If the destination is a removable medium, the user is prompted to change the
medium, as necessary.
The backup is indicated in the ¾File History. The backup can be interrupted at
any time by clicking the Cancel button. In this case, the backup contains all
objects stored up to this point.
If the original objects should be deleted after the backup, a dialog box appears
asking the user to confirm the action. If the history mode is active, a dialog box
for entering a history comment will be opened.
Backup files have the extension .cmb. For information about how to open and
restore backup files, see the topic below:
Restoring Backup Files
Backup files created via the ¾Backup function can be opened via the Import /
¾Restore command on the File menu. Also see How to ...:
Creating
Backup Files.
Note:
The easiest way to open archive files is to double-click the
files in the Windows Explorer. Archive files have the extension .cmb.
After opening the dialog box, select the backup file to be restored. The Dionex
Data System recognizes whether the file is stored on a removable medium, a
hard disk, or a network.
If the backup file is stored on removable media, insert the first medium (which
includes a list of the contents). The Dionex Data System displays the contents
list of the backup file. For a description of the individual fields, see ¾Restore.
Following this dialog box, the selected objects are restored, together with the
raw data files of the Audit Trails and the history. A new dialog box, similar to
the Backup dialog box, appears. If the backup is located on several removable
media, the user is prompted to insert the next medium, as necessary.
How to
89
If the directory of an object to restore does not exist, it will be created. The corresponding sequence and datasource must exist. Missing directories will be
created, as necessary.
If the destination object already exists, the user is prompted whether to overwrite it. The following options are available: Yes, Yes to all, No, No to all, and
Cancel. Each restored object will receive a corresponding history entry.
The restoration can be interrupted at any time by clicking the Cancel button.
Performing a Query
The term ¾Query refers to the search for data on the basis of specific search
criteria. In the Dionex Data System, you can search for samples and the corresponding sequences with user-selected parameters. You can either use very
detailed criteria to search for one specific sample, or more general criteria to
search for a specific series of samples with the same properties.
Follow these steps to start a query:
•
Change to the ¾Browser and select the Query command via the right
mouse button or select New / Query (using the Wizard) on the File menu.
In either case, a ¾Wizard opens to make it easier to enter the required
conditions.
•
On the first Wizard page, define the ¾Data Source in which to perform the
query. In addition, specify whether to find certain ¾Sequence properties
(Sequences), sample properties (Samples), and/or other conditions (Results).
•
Define the individual conditions on the following Wizard pages. All pages
that refer to the properties selected on the first page will open.
Clicking Finish opens another dialog box, which offers another four tabs:
•
Select General to specify the datasource where the search will be performed.
•
Select Native SQL to enter the SQL statement directly in the SQL syntax
of the corresponding ¾ODBC driver (contains translated Dionex Data
System statements).
•
Select SQL to define the search statement in an entry dialog box.
•
Select Result Restrictions to limit the resulting sample list via further result queries.
90
How to
For details, refer to the following topics:
Entering the Sample Query Using a Wizard
Selecting Search Criteria
Examples (Wizard)
Specifying the Sample Query Using the Dialog Box
Editing SQL Statements
Examples (Dialog Box)
Saving a Query
Entering the Sample Query Using the Wizard
On the first Wizard page, specify whether the ¾Query will be performed in the
currently open ¾Data Source (Selected Datasource) or in a different one.
Click the corresponding option to open the combo box and select the desired
data source from the list.
In addition, you can define the criteria types for the query:
•
¾Sequences
•
Samples
•
Results (variables from the different report categories)
On the following Wizard pages, use Data Field to choose the variable whose
property you want to find. Enter an operator and define the value (also
Selecting Search Criteria).
see
The combo box to the right of the respective line allows you to enter a logic
connective with another search property. Only after you enter AND or OR can
you enter a second search property.
Click Finish to complete the Wizard and to open the New Query Properties
Specifying
dialog box, where you can further specify your query (also see
the Sample Query Using the Dialog Box).
How to
91
Selecting Search Criteria
The ¾Query allows you to search for samples and sequences, using a variety
of properties. Enter the search criteria (see below) on either the Query Wizard:
Sequences page or Samples page. To further restrict the query, double-click
the SQL dialog box and enter the appropriate criteria in the Field of the Edit
Conditions sheet.
Search Criteria
Sample Name
Sample Number
Sample Type
Sample Status
Sample Comment
Sample Inject Position
Sample Inject Volume
Sample Replicate ID
Sample Inject Time
Sample Dilution Factor
Sample Weight
Sample Amount
Sample Raw ID
Sample User ID
Sample Program Name
Sample Method Name
Sequence Name
Sequence Description
Sequence Preferred Channel
Sequence Preferred Report
Sequence Directory
Sequence Timebase
Sequence Creation Date
Sequence Creation Operator
Sequence Last Update
Sequence Last Update Operator
92
How to
The search criteria can be divided into four different groups (1 - 4); see the table below for available groups:
•
Text variables (e.g., Sample or Sequence Name, ...) (1),
•
Numerical variables (e.g., Sample Number, ...) (2),
•
Variables with specific values (Sample Type or Sample Status) (3), and
•
Time variables (Sample Inject Time, Sequence Creation Date, ...) (4).
These search parameters must be further specified. Depending on the type,
the search criterion can be linked with a value via various operators. The following operators are available:
Operator:
Searches all samples...
Group no.
=
That are equal to the specified character string.
1, 2, 3, 4
<>
That are not equal to the specified character string.
1, 2, 3, 4
>
That are larger than the specified character string.
1, 2, 4
<
That are smaller than the specified character string.
1, 2, 4
>=
That are larger than or equal to the specified character string
1, 2, 4
<=
That are smaller than or equal to the specified character string
1, 2, 4
contains:
That contain the specified character string.
1
does not contain:
That do not contain the specified character string.
1
starts with:
That start with the specified character string.
1
does not start with:
That do not start with the specified character string.
1
ends with:
That end with the specified character string.
1
does not end with:
That do not end with the specified character string.
1
is like:
That fulfill the specified wildcard condition.
1
is not like:
That do not fulfill the specified wildcard condition.
1
is between:
That are between two values.
1, 2, 4
is not between:
That are not between two values.
1, 2, 4
during the previous: That were created during a selectable time before the
query.
is null
In which the variable does not exist.
4
is not null
1, 2, 3, 4
In which the variable exists.
1, 2, 3, 4
If the operators >, <, >=, or <= are used for text variables, the alphabetical order is considered (e.g., A<B).
Tip:
All SQL time queries containing a relative reference (operator
during the previous in the Edit Condition window) are recalculated for each query.
How to
93
Wildcards ("placeholders") represent character strings. The following wildcards
are valid for text variables with the operator "is (not) like":
Wildcard
Significance
%
Any character string with 0 or more characters.
_(underscore)
Any single character.
[]
A single character within a specified range (e.g., [a-f]).
[^]
Any character with the exception of the specified range.
As soon as the search conditions have been completed, you click the Apply
button to start the query.
Further conditions can be entered on the Result Restrictions page of the
Wizard or in the Properties dialog box via the Edit Conditions page of the
Result Restrictions.
Tip:
Depending on the number of samples resulting from the SQL
query, the execution of the result restriction may take some
time. After about 3 seconds, a window will indicate the status
of the result restriction (in % of the samples to test). The user
can cancel the query. Only the samples of the SQL query
that have "successfully passed" the result restrictions so far
will be listed as query results.
94
How to
Examples (Wizard)
The following SQL query searches for all samples:
•
with the sample type Matrix Blank and
•
whose comment starts with Charge 123456 or
•
an injection date between 2/2/2000 and 3/2/2000:
.
Use the following settings to restrict the query to samples
•
containing an Anthracen peak or
•
containing more than 10 calibration points:
How to
95
.
For further examples on restricting the query, see
Examples (Dialog Box).
Specifying the Sample Query Using the Dialog Box
You can edit the properties of a ¾Query that has already been performed in
the dialog box named Properties of Query "xyz". To access this dialog box,
click the query and select Properties on the context menu or File menu.
The dialog box contains the following four tabs:
•
General tab: In addition to entering a query title, it is possible to specify the
datasource where the query is performed. If this field remains empty (default), the datasource used is the one where the query is saved. The Preferred RDF-File setting is used for opening a sample or for starting a batch
report.
•
SQL tab: This tab allows you to edit the SQL condition(s) the samples must
fulfill. You can open an Edit Condition dialog box via the Edit/Insert button, by double-clicking the left mouse button, or via the context menu. This
box allows you to add (Restrict/Expand Condition) or change SQL conditions (Change Condition).
96
•
•
How to
Via Field, you can select a search criterion. To restrict the criterion, SQL
Selecting Search Criteria). The
operators are available (see How to ...:
corresponding comparison value can be defined in the Value edit field.
When editing a search criterion, all sequence and sample variables can be
used.
Native SQL tab: This tab dialog box translates the SQL statement into the
SQL syntax of the corresponding ODBC driver. As the default, this sheet is
"read only" and informs you about the SQL statement sent to the ODBC
driver. Select the Always use native SQL option if you want to edit the
SQL statement manually.
Caution:
If SQL conditions were edited, this "translated" SQL statement will be used to perform the query.
•
Result Restrictions tab: The list of samples found via the SQL query can
be further limited by result restrictions. Open the Edit Conditions dialog
box by double-clicking the left mouse button or via the context menu, and
then edit the result conditions. Specifying result restrictions generally limits
the query to samples that contain raw data.
•
As soon as the search conditions have been completed, you can start the
search by clicking the Apply button.
Editing SQL Statements
The Native SQL tab dialog box shows the SQL statement the Dionex Data
System created from the database query specified via the SQL tab dialog box.
Users who are knowledgeable about the SQL database language can specify
further conditions for their ¾Query. Be sure to select the Always use native
SQL option if you want to edit the SQL statement manually.
Caution:
If you edit the SQL statement via the Native SQL tab, this
"translated" SQL statement will be executed whenever the
query is performed, as long as this box is checked.
How to
97
Examples (Dialog Box)
The following SQL query searches for all samples of the current day:
The SQL sheet will show the following:
Samples.smp_inject_time >= CURRENT_INTERVAL '0' DAY.
To restrict the search to the current day's standard samples instead of all sample types, the SQL query must also include the following input:
98
How to
The SQL sheet now shows the following:
Samples.smp_type = 'S'
AND Samples.smp_inject_time >= CURRENT_INTERVAL '0' DAY
To search for all samples in a sequence named S7709, in which the peak Benzol (benzene) or a peak of the PAK (PAH) peak group was identified, first enter
the following:
In addition, specify the following conditions in the Result Restrictions box:
How to
99
Finally, enter the condition or PAK (PAH) in the Result Restrictions box:
The SQL sheet will now show:
Sequences.seq_name = 'S7709'
and the Result Restrictions sheet will indicate:
peak.name = 'Benzol'
OR peak.group = 'PAK'.
For examples on entering the query using the Wizard, see
ard).
Examples (Wiz-
Saving a Query
Queries can be saved as a file in the datasource. For this purpose, open the
¾Query Wizard via the File menu or via the right mouse button. After entering
the conditions, click the OK button to save these conditions as a query object
under any file name.
In the Browser, the ¾Query is indicated by the following symbol:
.
If the cursor is positioned on a query, the Dionex Data System acts as when
displaying a sequence: If the query is located in the left window section of the
¾Browser, the sample query is immediately executed. The result will be displayed in the right window section. If the query is located in the right window
100
How to
section of the Browser, pressing Return or double-clicking the file with the left
mouse button will execute the query.
A previously saved query can be edited via the Properties command on the
File menu (or via the context menu).
System Wellness
System Wellness provides built-in diagnostic and calibration features that help
prevent unscheduled system shutdowns and ensure reliable operation of the
DX-80 Ion Analyzer. For an introduction to System Wellness features, see
System Wellness Overview.
System Wellness tasks are performed from the Browser. See the following
topics for details:
Opening a Wellness Control Panel
Viewing and Restoring Calibration Data
Performing Device Calibrations
Also see the following topic:
Enabling/Disabling System Wellness Functions
Opening a Wellness Control Panel
1. In the ¾Browser under the local ¾datasource, open the Panels folder and
then open the Wellness sub-folder.
2. Double-click DIONEX_DX80_WELLNESS.PAN, the Wellness control panel
for the DX-80 Ion Analyzer.
3. The control panel opens. The Dionex Data System then attempts to connect
to the timebase assigned to the panel.
4. If an error message appears stating that the timebase was not found, close
the message and then select Connect to Timebase from the Control
menu. Select the timebase to be connected to the panel.
5. After communication is established with the timebase, the calibration and
diagnostic controls on the panel are enabled.
How to
101
Viewing and Restoring Calibration Data
Calibration data for the DX-80 Ion Analyzer is displayed on the Wellness conOpening a Wellness Control Panel).
trol panel (see How to...:
The Dionex Data System stores three sets of calibration data for the DX-80 Ion
Analyzer:
•
Current is the data most recently sent (uploaded) from the DX-80. It is the
data currently stored in the DX-80 memory.
•
Previous is the data from the previous time calibration data was uploaded
from the DX-80.
•
Factory is the data obtained (uploaded) from the DX-80 when it was initially configured in the System Configuration program (see How to...:
Enabling and Disabling System Wellness Functions).
The Wellness control panel displays the current data and the date the current
calibration function was performed. If the factory value is the current data, the
date field displays "---."
•
To view previous or factory data, or to download calibration data from the
Dionex Data System to the DX-80, click the Details button.
A Calibration Details dialog box appears that displays the three sets of calibration data values and their corresponding dates. The dates indicate
when the values were uploaded from the DX-80 to the Dionex Data System.
•
To download calibration data to the DX-80, select Current, Previous, or
Factory from the list to the right of the Download button. Then, select
Download.
Performing Device Calibrations
The Wellness control panel displays calibration data and provides command
buttons for calibrating the DX-80 Ion Analyzer. After a calibration is performed,
the DX-80 uploads the new calibration data to the Dionex Data System.
Note:
You may need to complete preliminary setup steps before
the calibration procedure begins. Before selecting a calibration command from the control panel, see the topics below
for details about the particular calibration task you plan to
perform.
102
How to
Calibration Procedures
Pressure Transducer Offset
Conductivity Cell
Calibrating the Pressure Transducer Offset
When to Calibrate:
As required
1. Turn off the pump flow.
2. Open the waste valve on the front of the pump head.
3. Open the System Wellness control panel for the DX-80 Ion Analyzer (see
How to...:
Opening a Wellness Control Panel).
4. Click the calibrate offset command button under pressure transducer.
The pump calibrates the offset and uploads the new value to the Dionex
Data System. The Dionex Data System stores this new offset as the current
value.
5. Close the waste valve.
6. Connect a pressure gauge between the pump outlet and the pressure
transducer. Turn on the pump and let the system stabilize. Note the average
pressure reading on the gauge, and then enter this reading on the line labeled Measured.
7. Click the calibrate slope command button under pressure transducer.
The pump calibrates the slope and uploads the new value to the Dionex
Data System. The Dionex Data System stores this new slope as the current
value.
8. Turn off the pump.
9. Disconnect the pressure gauge. Reconnect the pressure transducer to the
pump.
How to
103
Calibrating the Conductivity Cell
When to Calibrate:
After installing a new cell
Every 6 months
Items Needed:
1.0 mM KCl solution: Prepare by dissolving 0.07456 g of reagentgrade KCl in one liter of 18-megohm deionized water.
Backpressure tubing to provide at least 7 MPa (1000 psi). Use
0.076 mm (0.003 in) ID yellow PEEK tubing (P/N 049715).
1. Open the System Wellness control panel for the DX-80 Ion Analyzer (see
How to...:
Opening a Wellness Control Panel).
2. Remove the two screws securing the cell to the DX-80 component mounting
panel. Let the cell hang by the tubing.
3. Allow the conductivity to stabilize for 5-10 minutes.
4. Click the calibrate offset command button under conductivity cell.
5. Reconnect the cell to the DX-80 component mounting panel.
6. Disconnect the pump outlet line from the injection valve; connect the line directly to the cell inlet.
7. Verify that there is a minimum of 7 MPa (1000 psi) of backpressure.
8. Pump 1.0 mM KCl through the cell.
9. Allow the conductivity to stabilize for 5-10 minutes.
10.Click the calibrate slope command button under conductivity cell. The
cell is calibrated and a new cell calibration constant is uploaded to the
Dionex Data System. The Dionex Data System stores this value as the current cell calibration constant.
After calibration, the conductivity reading should be 147.00 ± 2 µS/cm and
the cell calibration constant should be between 130 and 190. If this is not
the case, refer to the troubleshooting section of the DX-80 operator's manual.
11.Flush the KCl solution from the system by pumping deionized water through
the cell. When the conductivity drops to near zero, stop the pump flow.
12.Reconnect the pump to the injection valve and reconnect the line from the
suppressor to the cell inlet.
104
How to
Actions in the Window Section
"Chromatogram"
This window shows the integrated chromatogram of a sample. Normally, the
software automatically determines and integrates peak areas. However, the
user may manually modify the peak delimiters and baseline, assign peaks
manually, and display other chromatograms for comparison. For details, refer
to the following topics:
Manual Re-Integration
Manual Peak Assignment
Performing a Chromatogram Comparison
For details on how to display a ¾Report, refer to the following topic under How
to ...:
Actions in the Window Section "Report"
Manual Re-Integration
Manual Re-Integration includes all actions performed directly in the chromatogram via mouse-click by means of the Automatic Tool on the Integration
¾Toolbar. This includes the actions described in the topics below:
Moving Peak Delimiters
Modifying the Baseline
Inserting a Peak
Prerequisite
An integrated chromatogram can be recognized by the red baseline below the
peaks and by the peak delimiters on the left and right of the baseline
(=integration limit).
Caution:
These elements must be displayed in the chromatogram
(see: Context menu (right mouse button) / Decoration / Peak
Decoration).
Before performing any manual re-integration, it is helpful to zoom the area in
which you want to perform a modification. Select the Automatic Tool on the
How to
105
Integration toolbar to mark each place in the chromatogram that you plan to
modify manually. The shape of the mouse cursor indicates which action is currently possible.
All modifications to the chromatogram can be undone, provided that they have
not been stored. On the Edit menu, select the Delete Manipulations command.
Moving Peak Delimiters
When the Automatic Tool is selected, the mouse cursor changes its appearance near the blue peak delimiters. The cursor shape becomes peak start ( )
or peak end ( ).
Press the left mouse button and move the mouse cursor to the new peak start
or peak end.
It is not possible to "run over" a peak delimiter; the peak delimiter would be
moved in the same direction. After positioning, the Dionex Data System draws
a new baseline. The modified peak properties (area, width, amount, etc.) are
immediately updated and displayed in the integration report.
Peak delimiters of negative peaks can also be moved. In this case, the presentation of the mouse cursor is mirrored.
Modifying the Baseline
Two peaks that are not completely separated in a chromatogram can be integrated individually by dropping a perpendicular line from the minimum between
the two peaks to the baseline. The intersection with the baseline is referred to
as the "baseline node."
When the Automatic Tool is selected, each baseline node can be moved
along the perpendicular line and positioned at any point; the node is then referred to as a "freely floating baseline node." Freely floating baseline nodes can
be generated at the end point of a baseline, if desired.
If the mouse cursor approaches either a baseline node or a freely floating
baseline node, the cursor automatically clicks into place and the shape ( , )
indicates which action is currently being performed.
The system automatically makes a distinction between moving a peak delimiter
horizontally and a baseline node vertically, depending on the direction in which
the mouse cursor is drawn.
106
How to
Between two baseline nodes, the entire baseline can be moved vertically. The
shape of the mouse cursor ( ) indicates whether the action is possible.
Inserting Peaks
In each free position in the chromatogram, as well as on the ascending and descending flanks of a peak, a new peak (i.e., a baseline and two peak delimiters)
can be inserted. Places where this is possible are indicated by a small peak
( ) on the right side of the mouse cursor.
When you select the Automatic Tool, the mouse cursor indicates the places
where a peak can or cannot be inserted. Other actions (edit modes) are not
possible at this point.
Manual Peak Assignment
(Dialog box "Properties of Peak No. x")
If you have inserted a new peak, wish to name existing or unidentified peaks,
or wish to rename incorrectly identified peaks, you can do this in the chromatogram in a report.
•
Click the peak and then select the Peak Properties command on the context menu to open the Properties of Peak No. x dialog box, or simply
double-click the peak.
•
Enter the corresponding name under Component or select one of the
names listed in the combo box. Pressing <Return> or the lowest symbol
bottom inserts the peak into the peak table of the QNT method, using the
retention time of the current chromatogram and the settings of the previous
peak
How to
•
107
It is also possible to rename an identified peak by manually assigning it a
different name. Enter the new name, or select one of the names listed in
the combo box, and then confirm your entry by pressing the first symbol
button. Via the additional symbol buttons, you can cancel this action or
delete all manual peak assignments (see quick info for the buttons). Manual peak assignments of identified peaks are not transferred to the QNT
method; they apply only to the currently open chromatogram.
You do not have to close the dialog box to continue working in the chromatogram. The dialog box remains open until it is closed or until the chromatogram is closed.
108
How to
Performing a Chromatogram Comparison
Comparison is always between one or several channels of one or several samples. The channels must be selected and placed in relation to each other (i.e.,
they must be overlaid).
Selecting channels
• Display the chromatogram of a sample in an integration window by opening
the sample (e.g., double-click its name in the ¾Browser).
• Select one or several samples of one sequence in the Browser and drag the
sample(s) into an open integration window while pressing the left mouse
button. The action is indicated by a + sign on the mouse cursor. After releasing the mouse button, the chromatogram of the sample(s) is displayed.
The same channel is used as for the reference sample.
or:
• Select a sample in the Browser, press the right mouse button and select
Compare. The submenu of this command includes a total list of all recorded
channel types. After selecting a channel, the chromatograms of all samples
that have raw data for this channel are compared.
or:
• Select a sample in the Browser, press the right mouse button and select All
Channels to compare all channels of a sample in a separate window. If you
press the F4 key or the Shift+F4 key combination, the channels of all samples in a sequence can be displayed successively.
• If several samples are selected, all channels of the first selected sample are
displayed. If you press the F4 key or the Shift+F4 key combination, you can
browse through the selected samples.
or:
• Click the Next/Previous Chromatogram icons ( / ) while holding down
the Ctrl key to insert the chromatogram of the next or previous sample.
or:
• Perform a ¾Query over several sequences or datasources. Press the right
mouse button and select the Compare command. The submenu of this
command contains a complete list of all recorded channel types. After you
select a channel, the chromatograms of all samples that have raw data for
this channel are compared.
How to
109
Relating channels to each other
For a sensible comparison of different chromatograms, a common reference
point is generally chosen. The chromatograms are normalized. As the default,
the retention time is used for the normalization; thus, all chromatograms are arranged so that their start points match (t = 0).
Alternatively, chromatograms can use a common peak as their reference point.
• Select the Decoration command on the context menu and open the Comparison tab dialog box.
• Select the reference peak from the At Peak list box.
• Select the Off option to overlay the peak selected below At Peak in all
chromatograms.
• Select the Shift option if this is to be performed independently from the
length of the chromatogram.
• Select the Stretch option if the chromatograms are to be stretched or compressed in x-direction, so that there is a time scaling in all chromatograms.
The stretch 0 to 1 min (or n min) has the same length for all chromatograms.
• Activate the Normalize Signal check box if the peak height should match.
Depending on how much the reference peak must be stretched or compressed, all other peaks in the chromatogram are also stretched or compressed. This enables an estimation of the amount for the same peaks from
different chromatograms.
If you want to offset the chromatograms in x- and/or y-direction, this is performed via the signal or time offset.
• Activate the Time check box to move the current chromatogram in the xdirection.
• Activate the Signal check box to move the current chromatogram in the ydirection.
The offset is specified as a percentage of the signal or time axis. A signal offset
of 5% shifts each following chromatogram upward by 5%. Accordingly, a time
offset causes a percentage alteration in the x-direction. This results in a
"pseudo 3D" presentation.
110
How to
Actions in the Window Section "Report"
The Dionex Data System offers numerous options for working with ¾Reports.
For details, refer to the topics below:
Displaying a Report
Peak Summary
Audit Trail
Displaying a Report
Each of the method windows (integration or calibration plot) can include a numerical ¾Report.
• Select the Report command from the View menu.
If you have not generated a report before, a default report will be opened. The
default report contains several worksheets (or report types): Integration, Calibration, Peak Analysis, Summary, and Audit Trail.
• Use the tab in the lower left corner of the report to change from one worksheet (or report type) to another.
Each worksheet includes a number of default variables that are an integral part
of the corresponding report type. For example, in an integration report, these
include the Ret. Time, Area, and Amount columns. A calibration report contains columns named Offset (c0), Slope (c1), Curve (c2), etc.
Without requiring additional input, these predefined report sheets are available
for various purposes.
Peak Summary
To generate a
Peak Summary, use the worksheet by this name in the window section Report.
The required steps are described under How to ...:
Displaying a Report.
In contrast to a "normal" ¾Report, which lists the data of various peaks in one
sample, the Peak Summary represents data of a specific peak from several
samples (generally a sequence). A line therefore contains not only the informa-
How to
111
tion on one peak, but information on one specific peak in a sample. The user
decides which peak to represent by selecting the peak in the chromatogram.
The default Summary report contains several columns. In addition to the sample name and the retention time, it also includes columns for Area, Height,
Amount, Types, and Plates. As soon as a user selects a peak in the chromatogram, the values of this peak are included in the Summary report. If the selected peak is not contained in a sample, this line remains empty (n.a. = not
available).
Below the sample list are lines for the Average and Relative Standard Deviation. The average value of a column is calculated and displayed. The relative
standard deviation from this value is indicated in percent.
The user can modify the default Summary report at any time. However, this is
not advisable; if you need another report, create an additional Peak Summary
report sheet with new column assignments.
Tip:
Instead of a single sequence, a Summary report sheet can
also be created on the basis of various samples and sequences. In this case, a ¾Query must be started in the
Browser.
Audit Trail
The
Audit Trail can be included in a ¾Report Template via a worksheet.
The sheet always shows the Audit Trail for the currently selected sample
Sample Protocol).
(=
• The Day Time column indicates the time of a command or message.
• The Ret.Time column indicates the corresponding retention time.
• The Command/Message column shows the command itself, a message
text, or an event.
The contents of the worksheet can be included in other documents via Copy &
Paste. It is also possible to print the entire Audit Trail via the method Printer
Layout.
112
How to
Actions in the Window Section
"Calibration Plot"
The Calibration Plot window section includes two sub-windows. The Calibration Curve section displays the calibration curve calculated from the calibration
points. The Calibration Function Data section lists the most important calibration data of the current peak.
In addition, the following options are available:
• From the menu of the right mouse button, select Next Peak / Prev.Peak to
view the calibration curve of the next/previous peak.
• Select Decoration to change the caption, color, and axes.
Printing with a Report Template
If you want to print one or several samples, you will be prompted for the name
of a ¾Report Template or a worksheet.
The results of a sample are then printed in the defined form. However, report
templates or worksheets only refer to the presentation of results.
The Print Setup and Page Setup settings are stored separately for each
worksheet in a report template (Integration, Calibration, Peak Analysis, etc.).
Select the desired settings for each worksheet separately.
• Select the Print Setup command on the File menu to determine the printer,
the paper size, and the format (portrait or landscape).
Note:
The Print Setup settings selected here apply only to the report definition file of the current sequence. They do not affect
the default settings for Windows. Similarly, changing the default printer, paper size, and format in Windows will not affect
the settings selected here.
• Select the Page Setup command on the File menu to determine the appearance of the headers and footers, the size of the margins, the alignment,
etc. You can also set a grid, determine whether column headers are displayed, and specify whether the printout is in black and white or in color.
• Select the Batch Setup command on the File menu to determine how to
print or to export. Specify which worksheets of a report template are printed,
How to
113
and for which type of samples this is performed. Also, define the export format and specify where to store the data to export.
114
How to
Device Control
Controlling the DX-80 Ion Analyzer
The following operating functions can be controlled from the DX-80 control
panel:
Pump
Turns the pump on and off. During a running batch, ¾Batch Processing is stopped.
Connect/Disconnect Connects and disconnects the DX-80 from the ¾Timebase.
Autozero
Resets the signal to zero.
Monitoring the DX-80 Ion Analyzer
The following operating functions can be monitored (but not controlled) from
the DX-80 control panel:
Function
Meaning
System Status
Checking: Indicates that the signal is being checked to ensure
that Ready conditions are met before the sample is loaded.
Ready: Indicates that the system passed the check and is
ready to load the sample.
Running: Indicates that data acquisition is in progress.
AS40
Indicates whether the AS40 Automated Sampler (if installed)
is idle or loading.
Valve
Indicates whether the injection valve is in the load or inject position.
Manual Override
Manually toggles the injection valve between the load and inject positions.
Signal
The offset or total signal value.
Autozero
Resets the signal to zero.
Show Plot
Displays the signal window.
Pump
The pressure reading.
Program Time
The elapsed time and the total run time.
Audit Trail
The ¾Audit Trail.
How to
115
Using Keyboard Shortcuts
Many operations, especially in online control, can be performed via shortcuts.
Action
General
Where
Esc or
Reaction
aborts Drag/Move
right mouse button
F1
opens the context-sensitive Help
F2
Alt+Enter
activates the Edit mode
¾Browser +
¾Panels
Ctrl + Tab
Ctrl
Edit
Control
Signal window
opens the respective Properties
toggle between open windows
signal window in
the ¾Report
for zooming (changes the cursors
to the zoom cursor)
Ctrl. + X
Cut
Ctrl. + C
Copy
Ctrl. + V
Paste
F9
Fills the column / selected cell(s)
with the first value of the selection
Ctrl. + F
Flow Command
Ctrl. + I
Inject
Ctrl. + Break
Pump Stop
Pause
Hold Mode
Ctrl. + A
Data Acquisition On
Ctrl. + B
Edit Batch
Double-click...
- Overview window
Unzoom
- Time axis
Auto Plot Speed
- Signal axis
Autoscale
- Plot range
Signals...
(- otherwise:...)
Axis/Decoration
Shift
- when Zooming
Retains scale ratio between signal and value axis (i.e., the shape
of chromatograms is maintained)
Command Button
Click
pressed button
Indicates running program. Stops
program upon confirmation.
Edit Field
Tab/Enter
Sends the new value
Esc
Aborts entry
116
How to
Glossary
Glossary
A-1
A-2
Glossary
Glossary
A-3
Acquisition On/Off
The Acquisition on command activates data recording (¾Raw Data) from all
selected ¾Signals of a timebase. Each signal is stored in a separate file. The
type of data from each signal is determined via signal parameters.
Raw data acquisition may be interrupted via the ¾Hold and ¾Stop commands.
The ¾Continue command is used to resume acquisition. To terminate raw data
acquisition, select the Acquisition off command.
Notes:
To reduce the raw data storage requirements, Acq. on
should be activated after the Inject command, but at least 30
seconds before the elution of the first peak.
The command can be selected from the Menu command, or
automatically via the ¾PGM File.
AIA (Analytical Instrument Association)
AIA is the abbreviation for Analytical Instrument Association, an association
comprised of companies that manufacture and sell chemical analysis instruments and software. The AIA is dedicated to developing guidelines for a standardized chromatography file format; a standardized format facilitates data exchange between laboratory systems produced by different manufacturers.
Standardization efforts also involve operation, documentation, maintenance,
and GLP (Good Laboratory Practice) requirements.
The generally valid AIA export format for chromatography data is known as
ANDI (ANalytical Data Interchange/Chromatography). Since 1992, there have
been five data format categories (Category 1 through 5). However, only Categories 1 and 2 are widely accepted.
Data formats of Category 1 comply with standard raw data, unit, and scaling
guidelines, and include information about where the original data and corresponding methods are stored. This allows exact restoration of a chromatogram
from raw data.
Data formats of Category 2 also transmit all calculated results (e.g., on the basis of a chromatogram), in addition to amount values and names for substance
identification. The data can thus be managed in a database or a LIMS system.
Using the AIA format (ANDI) in the Dionex Data System
The ANDI format can be used to export data from the Dionex Data System.
Select the Export/Backup command on the File menu of the Browser and
A-4
Glossary
open the corresponding dialog box via the ANDI/Chromatography (AIA) option.
It is also possible to export and print data simultaneously. Select the Batch
Report command on the File menu of the Browser. The Export option opens
the Batch Setup dialog box. The AIA format is defined on the AIA format
(*.cdf) tab.
You can also import AIA files into the Dionex Data System. Select the Import/Restore command on the File menu and select ANDI/Chromatography
AIA. A dialog box opens, in which you may select the file you want to import.
AIA Peak Type
See ¾Detection Code at Peak Start / End.
Audit Trail
An Audit Trail is a daily and sample protocol that is kept independently by the
system. The Audit Trail contains all operations relevant to GLP (Good Laboratory Practice), such as current and future commands, events, and error messages.
For additional information, refer to the topics:
Audit Trail
Protocol Data
Auto Autoscale
Use the Auto Autoscale option to automate the performance of the ¾Autoscale function.
During data acquisition, this option adjusts the scaling of the signal window to
exactly the size of the current chromatogram when the signal window border is
exceeded in the x or y direction.
Glossary
A-5
Autosampler
Autosamplers allow automation of routine analyses. A number of samples can
be prepared and then processed (injected) in automatic ¾Batch Processing.
A distinction is made between the following two states:
Loading the Sample
The fluidic input and output are directly connected. The solvent flow delivered
by the pump is via the sampler to the column. In a second cycle, the volume to
be injected is drawn from a sample vial into the sample loop, using a syringe.
Injecting the Sample
To inject the sample, the needle is lowered into the autosampler inject port. A
valve directs solvent flow from the pump to the column, via the sample loop
and the needle seat or inject port. Sample residue in the syringe is discarded to
waste.
Autoscale
The Autoscale option adjusts the scaling of the signal window exactly to the
displayed window section (e.g., the height of a peak).
The difference between the maximum and minimum values of the largest peak
fills 80% of the signal axis in the online mode.
Select the ¾Auto Autoscale option to perform Autoscale automatically.
Autozero
The Autozero command resets signals to zero. The subsequently measured
data is interpreted and displayed in relation to the new zero point.
Notes:
The ¾Acquisition On command automatically performs the
Autozero function.
A-6
Glossary
Backup
The Backup command allows storing data for data security. The procedure is
described in the section How to ...:
Actions in the Browser Creating
Backup Files.
The Dionex Data System stores data in databases and other files organized in
a hierarchical directory structure. There are many links among the included
objects.
For problem-oriented data archiving, it is necessary to know how individual
objects are linked with each other. Because conventional backup and archiving
programs do not offer this support, the Dionex Data System has its own backup
program. This integrated backup program offers the following functions:
• • Archiving of all objects displayed in the Browser (samples, sequences,
files, entire directory trees, etc.), together with all linked files (¾Raw Data,
Audit Trail (
Protocol Data), history, preferred RDF file, etc.)
• • Selective restoration of objects stored via backup
• • Compression of the stored data
• • Division of the backup files onto several media (e.g., diskettes or ZIP
drives)
• • Optional deletion of original files after the successful backup
• • Generation of corresponding entries in the file history
Backup files are located outside the datasources. Therefore, backup files cannot be stored within the directory structure of the datasources and they have no
file history.
Use the ¾Restore command (see How to ...:
Actions in the Browser /
Restoring Backup Files) to restore backup files that were created via the
Backup function.
Baseline
The line drawn from peak start to peak end for calculating the peak area is
called the Baseline.
Tip:
In colloquial language, the chromatogram section between
two peaks is also referred to as the baseline.
Glossary
A-7
Batch Processing
Repeating a processing step several times is referred to as batch processing
(also called batch or online batch). In chromatography, this means automatically processing or analyzing several samples in a defined order.
For details, see:
Samples and Sequences / Online Batch.
Browser
The Dionex Data System Browser enables you to set up, delete, and move
¾Datasources, subordinate directories, and files.
The Browser displays samples, methods, and programs, as well as additional
details about a ¾Sequence. The functions and the structure are similar to the
Windows Explorer. Open the individual files by double-clicking.
Caution:
The Browser functions and structure are similar to those of
the Windows Explorer. However, do not confuse the Browser
and Windows Explorer. Do not use the Windows Explorer for
operations within Dionex Data System datasources.
For further details, refer to:
Browser
Chromatogram Overlay
Select Chromatogram Overlay to display an earlier chromatogram in an online signal window of a control panel. The Add Overlay command on the File
menu can be used to overlay the current chromatogram with an earlier one.
The comparison chromatogram can be taken from an already processed sample of the current sequence, or from any other sequence.
Also refer to:
Chromatogram Comparison.
A-8
Glossary
Chromatographic Methods
All instructions and parameters regarding sample analysis and processing are
referred to as chromatographic methods. Depending on the included information, the following distinction is made:
Chromatographic method
Description
Program files (PGM-Files)
Commands and instructions enabling automation of the
analysis.
Quantification
Files)
methods
(QNT- All parameters required for qualitative peak identification
and for quantitative area determination.
The data are stored in the ¾Sequence Directory or are copied there by the
data system.
Chromatography Server
See ¾Server.
Client
Workstations that can start the Dionex Data System are called clients. The client provides a user interface that allows access to chromatography data and
databases, as well as appropriate representation of their contents.
To control or monitor a chromatography system from a client PC, the client
must be connected to the chromatography ¾Server Normally, this connection
is established when opening a ¾Control Panel. As soon as there is a connection, the user has access to the timebase(s) installed on the server.
To manage database access, the Dionex Data System uses the capability of
modern
Operating Systems to share resources. Thus, a client can access
all files or databases for which sharing was issued on a different workstation.
It is only possible to monitor and control a system via the client. To do this, the
client must establish a connection to a (chromatography) ¾Server.
In combination with a
Network, this allows operation of a system, as well as
online representation of the system status and the current chromatogram
course, from any client. Synchronous control of a system via several clients is
not possible.
Glossary
A-9
Comment
In addition to the sample name, further comments can be entered here.
Press the F8 key or double-click to access the enlarged edit field.
Connect
Execute the Connect to Timebase command to connect a user PC (¾Client)
with a timebase (¾Chromatography Server). In a network installation, a connection can thus be established between the current client and any server
within the network.
Select the Connect Device command to connect a device with the server to
enable remote control. The command verifies that the specified device is actually connected and then activates the instrument. For all installed instruments,
the Connect command is automatically executed when the program is started.
Contents (Button)
The Contents tab dialog box in the online Help shows the contents list. Click a
book icon to see further topics of a chapter. Click a document icon to open a
specific Help topic.
Continue
The Continue command cancels the ¾Hold and ¾Stop Flow commands. If a
sample batch was interrupted, it will resume. If pump flow was interrupted, it
will resume.
Control Panel
See ¾Panel.
Data Collection Rate
The data collection rate (or sampling rate) is the rate at which the data system
collects digital data points from the detector, expressed as points per second or
hertz (Hz).
A-10
Glossary
Datasource and Database
The term datasource is used for a database that is registered on a Dionex Data
System server. Setting up (registering) a datasource is performed in the
¾Browser. The user specifies the format and the location of the database. For
details, see How to ...:
Actions in the Browser / Setting up a Datasource.
During the initial Dionex Data System installation, a local default datasource is
created on each Client PC. In network operation, the datasource name is composed of the computer name and the addendum LOCAL (<PCNAME_LOCAL>). In a local station not included on a network, the name stated
in the operating system below Control Panel / Network / Identification is
used. If no identification is entered, the datasource is named DEFAULT_LOCAL.
Normally, Dionex Data System data is stored in an Access database (i. e., in
an MDB (Microsoft Data Base) container). The default datasource is also
based on an Access database. The ¾ODBC Capability of the data system also
allows using various other formats (dBASE, SQL, Oracle, etc.). Independently
of the chosen format, data of single samples (¾Sample Data) are saved, as
well as data of sequences (¾Sequence Data).
Databases can be saved on a local hard disk or any other mass storage device.
The Directory command allows the creation of individual subdirectories below
a datasource. The directories are used for saving ¾Sequences and corresponding data and programs.
Network Database
If the datasource is located on a centralized network PC, the database is accessible by all clients that are granted the appropriate access rights by the
system administrator. If the datasource is stored on a local hard disk, it is up to
the corresponding client to decide whether the database can be accessed via
the Windows File Sharing. The Dionex Data System also offers the option of
locking datasources, directories, or sequences.
For further details on datasources, see the chapter Data:
Datasource.
Non-Availability of the Network Database
In many companies and organizations, the database server is shut down during
the daily backup. As with a network breakdown, the database will not be available during this time. In this case, it is known, however, when the database will
Glossary
A-11
not be available. The Dionex Data System should be disconnected before the
backup to ensure data integrity. When the database is available again, the
Dionex Data System automatically connects to the database and writes back
any data that were acquired during the breakdown.
DELTA (Signal Property)
The Dionex Data System is capable of recording and evaluating signals or output variables supplied by a detector. Instead of the actual value, the changes of
a variable in a specific period of time can be calculated. This is possible via the
DELTA signal property. For more information, see ¾Trigger Condition.
Demo Mode
Demo Mode lets you simulate data acquisition by loading a pre-recorded demo
file and then displaying the data from the demo file in the ¾Panel's signal window. The demo file is "read back" as though the data were being acquired in
real time.
For information on how to simulate data acquisition, see How to ...:
in the Control Panel / Using/Recording Demo Data.
Actions
Detection Code at Peak Start / End (AIA Peak Type)
This peak result variable indicates how the peak start is classified. In principle,
this corresponds to the peak type classification used in the Dionex Data System. The classification described below complies with the ¾AIA convention.
The following AIA peak types are evaluated:
AIA Peak Type
Description
B (baseline peak)
The peak starts on the base- BM, bM
line.
Dionex Data System Peak Type
VD (vertical drop)
The peak starts with a perpen- MB, M
dicular line dropped to the
baseline.
PT (pretangent skim)
The peak is interpreted as a Ru or Rd
rider.
A-12
Glossary
Device Driver
Each controllable instrument has its own device driver. The driver is activated
when the Dionex Data System is started. The device driver translates the
user's PC instructions (via "mouse click") into device-specific digital commands
that are converted into "real control commands" after the data are transferred
to the instrument. Similarly, the signals of all instruments (readings, status information, etc.) are converted so that they can be read by the Dionex Data
System and can be displayed on the screen.
Device drivers are also capable of monitoring regularly inquired or automatically given device parameters in a target/actual value comparison. Unexpected
events can be corrected or displayed (in an error message). If the functionality
of the driver can be modified via parameters, this is performed in the
Server
Configuration Program.
The names of the device drivers are derived from the corresponding instrument. The extension CDD means "Chromatographic Device Driver." The device driver for the DX-80 Ion Analyzer is DX_DX80.CDD.
During the Dionex Data System installation, all device drivers are saved in the
BIN directory and receive a version ID that can be viewed via the Properties
command on the context menu (e.g., in the Explorer).
Dilution Factor
The ¾Sample Variable Dilution Factor is a correction factor for the amount
calculation formulas.
As the injection volume, it can be used in multiple-point calibrations to define
the dilution of subsequent calibration samples. For integration samples, it
serves to account for any dilution that was made before injection.
The calculated result is corrected by the appropriate dilution factor for all peaks
of a sample.
Caution:
The effect is reciprocal to the injection volume (i.e., if the dilution factor of a sample is larger than that of the previous
sample, the sample contains less of the component than the
previous one).
Glossary
A-13
Disconnect
Select the Disconnect command to separate a user PC (client) from a timebase. The specified instrument is no longer monitored by the data system, nor
can it be operated via the data system.
Tip:
Select the Connect command to undo the operation.
Dongle
A dongle is an adapter that is placed on the parallel PC interface. The free end
of the adapter is designed as a parallel interface connector and thus provides
the parallel interface functions. The dongle stores the serial number of a
Dionex Data System station. Each station has its own serial number.
The Dionex Data System be operated correctly only if the serial number of the
dongle and the ¾Key Code stored in the Dionex Data System match.
If there is no dongle or license server (or if the key code is incorrect), the
Dionex Data System can be operated only in demo mode.
For further details, refer to the chapters Installation
Software Protection
Actions in the Server Configuration Program / Selecting
and How to ...:
the Copy Protection Location and Entering the Key Code.
Drag & Drop
The Drag & Drop function is a way to copy, move, and print any element, instead of selecting the corresponding menu commands.
The Drag & Drop function is available in both the online and offline modules,
and is most useful when editing lists. Press the mouse button and keep it
pressed to move the selected element to its new position. To move an object,
use the left mouse button. To copy an object, use the right mouse button.
F1 Key
Press the F1 key to open context-sensitive online Help; this is the displayed
help text that refers to the current cursor position.
A-14
Glossary
File History
The File History mode allows complete documentation of any changes and operations performed in specific objects and files. Objects include samples, ¾Sequences or datasources, ¾Control Panels, report templates, RDF-, ¾PGMFiles, and/or ¾QNT-Files, and, of course, modified chromatograms.
The File History mode can be activated (or deactivated) individually for each
datasource (see Properties of a datasource / Enable Modification History).
When this mode is activated, each user is prompted to enter a comment before
saving the changed object.
To view the changes documented so far, select a datasource, a directory, or a
single object, and then select the Show History command.
Find (Button)
The Find tab in the online Help window allows you to find specific words,
terms, or text included anywhere in the online Help.
Full Size
The Full Size function undoes all previous Zoom operations. To undo only the
last operation, use the Unzoom function.
In the signal window, double-click in the ¾Overview Window to implement the
Full Size function.
GLP ("Good Laboratory Practice")
Good Laboratory Practice means the adherence to regulations pertaining to the
organization and conditions of planning, performing, and monitoring laboratory
work. GLP contributes to enhancing the quality of test data.
A special focus is the complete and clear listing of the complete data in an
analysis process. Also, regular checks of the instruments and the software are
required.
Help
See ¾Online Help.
Glossary
A-15
Hold
The Hold command stops ¾Data Acquisition and automatic ¾Batch Processing.
In the Hold mode, no more data is acquired, the pump continues delivery, and
processing of the batch samples is stopped before the next sample.
All processes can be completely aborted via the ¾Stop (Flow) command, or
can be continued with the ¾Continue command.
Index (Button)
The Index tab dialog box contains an alphabetical list of online Help topics.
Enter the initial letter of the topic and select Display to view Help information
on this topic.
Industry Minute
An industry minute (also referred to as decimal minute) has 100 units, instead
of 60 seconds.
"2.500" (industry minutes) therefore means "2 minutes, 30 seconds" and
"2.100" means "2 minutes, 6 seconds", etc.
Injection Time
The column Inj. Time/Date shows the day, month, year, hour, minute, and
second when the sample was injected (please also see ¾Time). This column
cannot be edited. The Dionex Data System enters the injection time of the
sample in the corresponding column of the sample list.
The kind of entry (empty or time value) indicates whether and when the sample
was processed.
Caution:
The time difference between successive samples is generally
the analysis time plus the time required for injecting the following sample. As the injection time is generally minimal, the
time value provides a reliable indication as to whether the
sample batch was processed without incident.
A-16
Glossary
Isocratic
A solvent flow of constant composition is called isocratic. This may be either a
pure solvent or a solvent mixture of constant composition. The DX-80 Ion Analyzer delivers only pure solvent.
Jump to Another Help Topic
As soon as the mouse cursor is positioned on a link term, it changes into a
pointing hand. All link terms are displayed in green.
Terms underlined by a dotted line (e.g., ¾Dongle) are links to additional information in a pop-up. Terms underlined by a single line are links to a new Help
topic.
Key Code
The range of functions available for an individual Dionex Data System station is
determined during installation by a key code. Each Dionex Data System station
is fitted with a ¾Dongle; the station can be operated only if the serial number
coded in the dongle matches the 12-digit key code.
Each user who expands the Dionex Data System scope of functions by acquiring the corresponding licenses receives a new key code. The extended
scope of functions becomes available as soon as the new code is entered.
Enter the key code via the About box on the Help menu or via the ¾Server
Configuration program. Valid characters are numbers and letters. The input is
not case-sensitive.
For further details, refer to the sections Installation
Software Protection
Actions in the Server Configuration Program / Selecting
and How to ...:
the Copy Protection Location and Entering the Key Code.
License Server
If a site includes a large number of computers, the Dionex Data System licenses can be managed by the optional Dionex Data System License Server.
With this type of installation, it would not make sense to equip all client PCs
with ¾Dongles and to enter the corresponding ¾Key Codes.
If no dongle or License Server is specified, the Dionex Data System can be operated in the demo mode only.
Glossary
A-17
For further information, refer to the following:
Installation
Software Protection and
How to ...:
Actions in the Server Configuration Program / Selecting the
Copy Protection Location and Entering the Key Code.
LOG
The LOG command allows the user to document the values of variables in the
Audit Trail at any time. This option is especially useful for logging information
that is not periodically retrieved.
The function is available by selecting Command on the Control menu.
Moduleware
The instrument control firmware installed in each DX-80 Ion Analyzer. The DX80 Moduleware sends status information and data to the Dionex Data System
and receives control parameters from the Dionex Data System.
"Monitor Only" Mode
If a connection is established to the local server via a control panel, you can
control the instruments connected to a timebase via the controls on the control
panel (control mode). The purpose of monitor only mode is to prevent multiple
users from simultaneously controlling a timebase.
For example, assume that user A has control of the local timebase. If user B
accesses the same timebase, this user is automatically assigned monitor only
status. This means that user B can view all current values and states in the
control panel, but cannot change any of them.
Changing from Monitor Mode to Control Mode
To change between the two modes, activate or deactivate the Monitor Only
command on the Control menu.
Multi-Tasking
Multitasking refers to the simultaneous operation of several programs on a PC.
Allocation of processing time under Windows 98 and Windows NT/2000 is
A-18
Glossary
monitored and controlled externally (pre-emptive). This guarantees that each
application (process) is automatically continued after a specific time. A single
process cannot claim all processing time at the expense of other processes.
Caution:
Pressing the key combination Alt-Ctrl-Del interrupts multitasking in Windows 98 and stops all running processes. It
also interrupts the Dionex Data System device control. Do
not press the key combination Alt-Ctrl-Del in Windows 98 during a running batch or during data acquisition. This will cause data overrun and communication
problems with the controlled instruments. This does not
apply to the Windows NT operating system.
(Signal) Noise
The Signal Noise parameter indicates the signal noise within a chromatogram,
as calculated by the Dionex Data System. The value serves as the basis for the
¾Signal-to-Noise Ratio determined from the raw data at the start of data acquisition.
Determining the Signal Noise (according to the default)
All data points recorded during the first 10 seconds of a chromatogram form the
basis for determining the noise value. The Dionex Data System calculates a
regression line using the method of least squares, and then determines the
maximum distance of a data point above and below the line. (When calculating
the regression line, all data points are weighted with their corresponding step
unless the step is equidistant.) Adding both values supplies the first noise
value.
The same procedure is used for the last 10 seconds of a chromatogram and
supplies a further noise value.
ODBC (Open DataBase Connectivity)
ODBC is the name of a standard database interface that allows access to various databases (e.g., SQL server, dBASE, or ORACLE) via an ODBC driver.
Glossary
A-19
Online Help
The Dionex Data System
tion on the screen.
Online Help offers help information for any situa-
• Press the Help button on the toolbar
cific item on the screen.
to view help information for a spe-
• Press the F1 key to see context-sensitive help information for a specific
situation. A description of the selected menu bar, (tab) dialog box, or activated control will appear.
• Select Index on the Help menu to view the table of contents for online Help.
Select Using Help to see more details about using online Help.
Operational Qualification (OQ)
According to the definition formulated together with EUROACHEM, Operational
Qualification is "the process of demonstrating that an instrument will function
according to its operational specification in the selected environment" [P. Bedson and M. Sargent, Accred. Qual. Assur. (1996) 1, 265-274]
The purpose of OQ is to prove and document that your analytical system functions according to its operating specifications, while taking into account your
specific environmental conditions. Normally, OQ is performed following the installation of a new device or following a repair or system service.
The Qualification menu of the Dionex Data System Browser includes the Instruments OQ and ¾OQ-Setup commands. Select Instruments OQ to perform the operational qualification. Select OQ Setup to generate the templates
required for performing the operational qualification. Normally, this is only necessary after a new installation or when the configuration has been modified.
The individual report pages of the Instrument OQ correspond to the ¾Performance Qualification pages for instruments. However, the limits valid for OQ
are stricter than those used for PQ.
OQ
See ¾Operational Qualification (OQ).
A-20
Glossary
Original Size
See ¾Full Size.
Overlay
See ¾Chromatogram Overlay.
Overview Window
When zooming, an overview window is displayed in the upper right corner of
the signal window. The overview window shows the entire chromatogram and
indicates the currently enlarged section.
Panel
In online control, the control and display elements combined in one window are
referred to as a Control Panel. The control and display elements allow controlling and/or monitoring a ¾Timebase. The DX-80 Ion Analyzer timebase is
Dionex_DX80.PAN.
Also see:
How to ...:
Actions in the Control Panel.
Peak Summary
A Peak Summary lists peak and sample variables of any required samples in a
table. Generally, it includes samples of one sequence. A Summary can also be
created on the basis of a ¾Query.
For details, see:
Peak Summary Report
Glossary
A-21
Performance Qualification (PQ)
As defined in cooperation with EURACHEM, Performance Qualification is "the
process of demonstrating that an instrument consistently performs according to
a specification appropriate for its routine use" [P. Bedson and M. Sargent, Accred. Qual. Assur. (1996) 1, 265-274].
The task of PQ is to prove and to document that your system functions as required by your special (routine) operation. The frequency and the scope of the
Performance Qualification depend on the special requirements in your laboratory. This can be specified in internal instructions or in an SOP. The parameters should be similar to those of routine operation. In addition to the Performance Qualification, the ¾Operational Qualification is an important factor for
validating instruments and software.
The Qualification menu of the Dionex Data System Browser includes the Instruments PQ and ¾PQ-Setup commands. Select Instruments PQ to perform
the performance qualification. Select PQ Setup to generate the templates required for performing the performance qualification. This is usually necessary
only after a new installation or when the configuration was modified.
The Dionex Data System CD supplies a datasource with a master template in
the directory named PQ\Templates\PQ. This template is designed for the Performance Qualification in a standard HPLC configuration. In addition to various
sequences, the template contains a PQ report template with the following
sheets:
SPECIFICATION:
The SPECIFICATION sheet lets you enter the system specifications (instruments, fluidics, and limits).
INJ_FLO_PREC_AN and INJ_FLO_PREC_CAT:
The INJ_FLO_PREC_AN and INJ_FLO_PREC_CAT sheets let you check the
reproducibility of the injector and the retention time for an anion system and
cation system, respectively. If the result is within the specified limits, the ‘Result’ column indicates OK.
INJ_CARRY_OVER_AN and INJ_CARRY_OVER_CAT:
The INJ_CARRY_OVER_AN and INJ_CARRY_OVER_CAT sheets supply a
measure for the carryover in the anion system and cation system, respectively.
If the result is within the specified limits, the ‘Result’ column indicates OK.
A-22
Glossary
DET_LINEARITY_AN and DET_LINEARITY_CAT:
The DET_LINEARITY_AN and DET_LINEARITY_CAT sheets supply a measure for the linearity of detector response and peak height for the anion system
and cation system, respectively.
DET_NOISE_DRIFT_AN and DET_NOISE_DRIFT_CAT:
The DET_NOISE_DRIFT_AN and DET_NOISE_DRIFT_CAT sheets supply a
measure for baseline noise and drift for the anion system and cation system,
respectively.
Audit Trail: The Audit Trail sheet shows the protocol data (Audit Trail) for the
analyzed sample.
Several additional Data sheets are available for calculating further values.
Caution:
Do not edit report sheets, even if editing is possible! The
Dionex Data System automatically reads the corresponding
values. Within the report, individual data sheets are very often accessed via references. If you insert or delete lines and
columns, these references will be lost. Thus, the calculations
will be wrong!
The report must be printed as a Batch Report from the Browser to ensure
that, in the report, the data are read in and processed correctly. Select the sequence for which the report will be printed. Make sure that no sample is selected. Select Batch Report on the File menu and start printing by clicking
OK.
PGM-File
See ¾Program File.
Power-Failure Protection
The Dionex Data System recognizes during the load sequence of the data
system whether online ¾Batch Processing was interrupted by a power failure,
etc.
This is possible because the date and the time are entered in the sequence
editor whenever processing of a new sample is started. The Dionex Data System checks whether all "started" samples (labeled with date and time) were
completed (i.e., whether they reached the status F, for finished). If this is not
Glossary
A-23
the case, the ¾Power-Off Handling offers various options to continue processing.
Power-Off Handling
The ¾Power-Failure Protection ensures that online batch processing continues, even after a power failure. This protection is determined via the Power-off
handling. The following options are available:
• Continue with the interrupted sample
• Continue with the next sample
• Reprocess the entire online batch
• Abort the entire online batch
• User-defined selection of the four options
PQ
See ¾Performance Qualification (PQ).
Pressure Limits
The Dionex Data System is capable of monitoring the pressure value provided
by the pump. When a pressure limit is exceeded, the DX-80 Ion Analyzer
¾Moduleware reports this to the Dionex Data System. The Data System then
stops the flow, displays an error message, and stops the sample batch, as
necessary.
Notes:
Exceeding the upper pressure limit can be due to a blocked
column or a defective injection valve.
If the pressure is below the lower limit, it is probably due to a
leak in the flow system.
Program File (PGM-File)
The program file (PGM-File) can be considered a "schedule" for the execution
of different control commands. The file contains all commands to be executed
before, during, and after the sample analysis. This enables complete automa-
A-24
Glossary
tion of the analysis, including routine procedures before and after the analysis
(e.g., column conditioning). It is also possible to monitor parameters or limits
via the PGM-File. The PGM-File cannot be edited.
Protocol Command
The Protocol command enables the user to log specific events in the Audit
Trail. The command syntax is as follows:
0.000 Protocol
"Text"
The Protocol text is included in the Audit Trail and is thus directly linked with
the corresponding sample. The Protocol text can thus be used for commenting
individual samples.
Quantification Method (QNT-Method)
A Quantification Method (also known as "working instructions") includes all
parameters that are used for evaluation of a chromatogram. Thus, the QNTMethod serves as the basis of calculation for evaluating a sample. QNTMethods cannot be edited.
Query
The Dionex Data System allows the user to efficiently search directories, sequences, samples, or comment lines for specific names or character strings:
• In the ¾Browser, choose the Query command via the right mouse button or
select New / Query (using Wizard) on the File menu. A wizard opens to
facilitate entering the desired conditions.
• On the first page, define whether the query is performed in the currently
open ¾Datasource or in a different one. In addition, define whether to find
certain sequence properties and/or sample properties, and/or other result
properties.
• After clicking Finish, you can enter additional conditions to limit the query.
Based on the entered information, the Dionex Data System generates an SQL
statement that can start a query within all ¾ODBC-capable databases.
For more details, see How to ...:
Query.
Actions in the Browser / Performing a
Glossary
A-25
The result of a query can be saved as a new sequence via the Save as command. QNT-Files and PGM-Files are copied, raw data is copied optionally. File
names occurring more than once receive a consecutive number. The following
symbol indicates the query sequence:
QNT-Method
See: ¾Quantification Method (QNT-Method).
Raw Data
Raw data refers to all analog and digital data points that are stored digitally on
a PC. Therefore, raw data exists only for signals that were selected by the user
prior to data acquisition.
For further details, see the following topics in the Data chapter:
Raw Data Storage
Raw Data Compression
Ready Check
The ¾Ready Check allows the user to verify that the connected instruments
are ready to operate (i.e., to process a sample batch). The following items are
checked:
• Are all instruments switched on?
• Are all instruments connected correctly?
• Are all required files available?
• Is there sufficient storage capacity?
You can perform a ready check via the Ready Check button in the Batch dialog
box. Also, a ready check is automatically performed for each online command.
If there is a problem, an error message or warning will be displayed.
A-26
Glossary
Reconnect
Use the Reconnect command to check the connection between the PC and
the timebase, or between the instrument and the data system. If there is no
connection, the ¾Connect command will be issued automatically.
Replot from Beginning
Enable the Replot from beginning option to automatically replot when the
signal leaves the right-hand border of the signal window. The current chromatogram is then replotted from the beginning. The time axis is scaled by one
unit, so as to fit the chromatogram into the window.
For example,. if the first time axis is 2 minutes, after 2 minutes the window is
enlarged by 2 minutes to show 4 minutes; after 4 minutes, the window is enlarged by another 2 minutes to show 6 minutes; and so on.
Report Definition
Report Definition Files (RDF-Files) have two functions: They serve to display
and reprocess your results on the screen (Report) and to prepare the printout
(Printer Layout).
All settings regarding user-specific representation of chromatographic data in
different windows are stored in the Report Template (= Report Definition). In
conjunction with the ¾Workspace, this enables the user to arrange the screen
according to personal preference.
If no workspace is loaded, each new window is opened on the basis of the
most recently used RDF-File. If no Report Definitions were stored, the default
RDF-File included in the Dionex Data System (DEFAULT-RDF) is used. It is
located in the Report directory.
Each RDF-File contains specific information on window sections and views,
window presentations, and captions, color, size of individual elements, and the
presentation of reports. This requires the user to make decisions about the following features:
•
Are the window contents (e.g., the chromatogram) shown in the zoomed
view or full-scale view?
• Which type of axis scaling is used?
• Which additional objects (grid, comparison chromatogram, units, etc.) are
displayed?
Glossary
A-27
• Which colors are used for comparison chromatograms, captions, etc.?
• Are other window sections displayed (Calibration Curve, Report, etc.)?
• Which worksheet makes up the report and how is the report formatted?
• Which columns does the worksheet include?
Restore (File)
The Restore command allows you to restore files previously stored via the
¾Backup function. The procedure is described in the section How to ...:
Actions in the Browser / Restoring Backup Files.
To implement the Restore command, select Import/Restore on the Browser
File menu.
Note:
The easiest way to open these archive files, which have the
extension *.cmb, is to double-click them in the Windows Explorer.
Right Mouse Button
The most common commands and functions are available via the right mouse
button. The choice is context-sensitive (i.e., the commands most likely to be
used in the current situation are available).
RPC (Remote Procedure Calls)
The RPC technology introduced with Windows 95/NT makes it possible to run
a program on a different computer.
Unlike true full-control programs, such as PC-DUO or PC-ANYWHERE, the
amount of transferred data is considerably lower with this type of control. Processes started from a remote computer run almost without any time delay and it
is not possible to determine whether the process is performed on the local or
on a remote PC.
RPC requires a functioning network connection between the involved computers. The computers may be part of the same network or may be linked via a
modem connection. Communication also functions between different networks
(such as Novell or Windows), provided the networks communicate via a common protocol.
A-28
Glossary
The Dionex Data System generally communicates via the network protocols
IPX/SPX, TCP/IP, or NetBEUI. Under Windows NT/2000, the protocol Named
Pipes is also valid.
Sample Data
Data that contribute to characterize a single sample are stored in a database
by the Dionex Data System. These data include not only the entered data
(name, etc.), but all results calculated from the ¾Raw Data and the chromatographic conditions under which the sample was analyzed (column, solvent,
etc.).
Sample Name
The ¾Sample Variable Sample identifies a sample and is used to label graphics and result reports.
When creating a sample list with the
name generation is possible.
Sequence Wizard, automatic sample
Sample Number (Nr.)
The ¾Sample Variable Nr. indicates the sample number for a particular sample
row and is used to label graphics and result reports.
Sample-Oriented Operation
Due to the object-oriented concept of the Dionex Data System, emphasis is on
samples and ¾Sequences, not on methods or activities.
The user selects the sample or sequence to process and automatically receives the corresponding view (e.g., integration samples are displayed in the
integration window and sequences are displayed in the sample editor). For
each sample or sequence, only the selectable or expected views, methods, or
functions are available to the user. This saves time and reduces the number of
simultaneously active windows.
This context-sensitive procedure is also valid for options selectable with the
right mouse button. The selection depends on the position and the time of the
mouse click.
Glossary
A-29
Sample Type
The ¾Sample Variable Type specifies which type of sample is used.
Unknown indicates an unknown analysis sample. This sample type is indicated by the symbol: .
Standard indicates a standard sample with a known concentration. This sample type is indicated by the symbol: .
Sample Variables (Overview)
The variables in the
Sample List (Sequence Table) columns are referred to
as sample variables. They characterize a sample and are stored in a database
as part of the ¾Sample Data. The following sample variables are available:
Columns that can be edited
¾Comment
¾Sample Name (Name)
¾Dilution Factor
Columns that cannot be edited
Compound names
Nr. (Sample Number)
Sample Type (Type)
Sampling Rate
The number of stored signal values per second is referred to as sampling rate
(or data collection rate). The maximum of stored values corresponds to the
number of values generated per second.
Sensitivity (Signal Parameter)
The Sensitivity parameter adjusts the data system to the sensitivity of the detector.
A-30
Glossary
Sequence, Sequence Table, Sample List
A sequence combines samples that belong together due to their origin or processing. The names of all samples that belong to one sequence are entered in
the sample list (also called sequence table). A sequence is thus a container for
various samples.
To create a sequence, use the
Caution:
Sequence Wizard.
Do not use special characters (e.g., the umlaut) for new directory names or sequences, as this may cause problems on
Novell networks.
The sequence table also defines how to process a sample. Sequences are
usually started from a control ¾Panel. However, they can be started directly in
the ¾Browser as well, provided the sequence has already been assigned to
the appropriate ¾Timebase. Either press Start on the ¾Batch menu or the corresponding button of the online ¾Toolbar.
All data collected in connection with creating and processing a sequence, including raw data and protocol data recorded during the analysis, are saved in
the sequence directory of a datasource or in the underlying database. Of
course, this includes the raw and protocol data recorded during the analysis.
Similar to datasources, sequences can be "locked." When a sequence is
locked, data and results can be read, but they cannot be modified or extended.
For details on locking datasources, directories, and sequences, see
Data:
Datasource.
Sequence Data
Data that serve to characterize a ¾Sequence, instead of a single sample (see
¾Sample Data), are referred to as sequence data.
This includes, for example, the date of the last change or the corresponding
timebase. As with the sample data, this information is stored in a database.
(Chromatography) Server
PCs connected to the components of an IC or HPLC system via a serial interface can be used as chromatography servers.
A chromatography server is automatically installed on the PC during the Dionex
Data System installation. The chromatography server controls the data ex-
Glossary
A-31
change between the system and the PC. Upon starting, each server is capable
of serving up to 6 controlled or 16 non-controlled systems (timebases). The
server receives the commands entered by a ¾Client PC in a ¾Panel and executes them at the specified time ( by transmitting them to the corresponding
device driver of the system). In the opposite direction, the server also assumes
this buffer function. Thus, the raw data of each system are stored at the location specified by the client and all system-relevant data are forwarded to the
client.
Starting (loading) the server can be performed manually or automatically. Use
the ¾Server Monitor Program to select the required options. For optimum functionality, the server must be configured. This is performed with the Dionex Data
System Server Configuration program from any client PC.
If the server and the client software of the data system are located on the same
PC, the installation is local; if not, it is a network installation (see:
Network).
Notes:
In the case of manual data acquisition, the ¾Raw Data from
the system are always stored in the server directory
PCNAME_LOCAL. In the case of a ¾Batch, each user can
choose where to store the data. To minimize the risk of losing
data, raw data should always be stored temporarily on the
server. In the course of archiving, it can be transferred to a
different computer.
Server Configuration
The Server Configuration includes information on which device is assigned to
which timebase, to which server a timebase is connected, and the configuration
of individual devices. The server configuration is defined in the Server Configuration program.
The information is saved in an installation file (*.CFG file). The current configuration is always saved in the file CMSERVER.CFG on the chromatography
server.
If a user creates several installation files with the
Server Configuration
Program, these files can be transferred to any server (via the Import function)
and used there.
Executing the Save command saves this configuration as the new
CSERVER.CFG file on the server.
Actions in the Server Configuration
For more information, see: How to ..:
Program / Changing the Server Configuration.
A-32
Glossary
Server Monitor Program
The program required for starting and monitoring the chromatography server is
called the Server Monitor. During installation, it can be included in the Autostart
group of the operating system.
When starting the Server Monitor, an additional icon appears on the Windows
status bar indicating the current status of the server.
• Move the mouse cursor over the icon to view the server status via a quick
info field.
• Open the corresponding context menu via the right mouse button to start or
to stop the server (Start/Stop Server) or to exit the monitor program (Quit
Monitor).
• Double-click the icon for further options (e.g., to automatically start the
server when booting the computer).
The icon's color also indicates the server status:
Icon
Color
Message
Crossed
out red
PeakNet Server is not running.
Yellow
PeakNet Server is starting / is closing.
Green
PeakNet Server is active.
Turquoise
PeakNet Server is reconfiguring.
Gray
PeakNet Server is running idle.
Yellow/
red
PeakNet Server needs attention.
The server waits for the response to a message. For
example, after a power failure, the user must decide
how the program should continue the interrupted sample processing.
Glossary
A-33
Signal
The data (either analog or digital) transferred directly from an instrument to the
data system are referred to as physical signals.
The measuring data of the different signals is stored in uniform raw data files.
Signal Noise
See ¾Noise.
Signal-to-Noise Ratio
The signal-to-noise ratio serves to characterize electronic components. The
lower the noise, the smaller the possible signal variations that can be recorded.
As a general rule, the average of a signal should be at least twice the standard
deviation of the signal value.
Status Bar
In the status bar on the lower window margin, messages regarding the current
system status are shown on the left and the current timebase and the currently
executed command are shown on the right.
The display of the status bar can be enabled and disabled via the View menu.
Stop Flow
The Stop Flow command switches off the pump flow and interrupts data acquisition. A running batch is stopped, as in the hold mode. The Stop Flow
command is executed via the Control/Stop Flow menu command.
Use the ¾Continue command to undo this command.
Suppressor
A suppressor is a patented electrolytic device from Dionex which reduces
background signals and enhances analyte signals in conductivity detection.
Conductivity detection requires eluents that contain strong electrolytes. These
electrolytes can interfere with detection of the ionic analytes of interest. The
suppressor uses ion exchange to neutralize (suppress) the electrolytes in the
A-34
Glossary
eluent, thus reducing the background conductivity. In addition, the ion exchange mechanism replaces a less conductive counterion with one that is
highly conductive (hydrogen in anion exchange and hydroxide in cation exchange). Since both the analyte and the counterion produce the detector response, the analyte signals are increased.
The anion version of the DX-80 Ion Analyzer contains an AMMS III. The cation
version of the DX-80 contains a CMMS III. For more information, refer to the
suppressor manual.
Glossary
A-35
System Check
PeakNet IA monitors the status of certain system parameters. If a parameter
does not meet specification, the software displays an error message. All error
messages are logged in the ¾Audit Trail.
Parameter
Specification
Total Back- < 35
ground
(anion
mode)
<
3
(cation
mode)
Comments
µS The total background is checked (for up to 10
minutes) before each sample injection. While
the system is equilibrating, the Ready LED on
µS the DX-80 front panel flashes. When the background meets the specification for 30 consecutive seconds, the Ready LED remains on continuously. If the background fails to meet the
specification within 10 minutes, the Ready LED
flashes. The default severity for the error message is abort.
Drift
-100 µS < x The first and last points during data acquisition
< 100 µS
are used to calculate the difference.
Noise
< 10 nS
The final minute of data during data acquisition
is used to calculate the difference.
Template
Templates facilitate entering data. The Dionex Data System offers various predefined templates; the report template is DEFAULT.RDF.
Time
The Dionex Data System stores time stamps as universal time (Greenwich
time). However, the date notation is displayed according to the local settings
chosen in the Windows Control Panel.
A-36
Glossary
Timebase
All components combined in a chromatography system to enable the chromatographic separation, as long as the components are related in a time context
with each other, are assigned to the same timebase.
A timebase consists of one DX-80 Ion Analyzer, with or without an AS40 Automated Sampler. Only a further system that is completely independent represents a new timebase. Administration of different timebases may be on one or
several ¾Chromatography Servers.
The name for a timebase is assigned in the Server Configuration program.
Toolbars
Frequently used commands and features are available as icons. Related functions are combined on toolbars located directly below the menu bar. When
starting the Dionex Data System, the standard toolbar is displayed. Select the
Toolbars command from the View menu to enable or disable the display of individual toolbars. The following toolbars are available:
• Standard (standard functions)
• Online (commands for the ¾Control Panel)
• Method (for changing to other method sections or samples)
• Integration (commands for processing chromatograms)
• ¾Status Bar (enables/disables the Status Bar)
Move the mouse pointer over an icon to view its name in the quick info display.
Trigger Commands
A trigger refers to the automatic execution of a command as soon as a condition becomes true. For example, a trigger command (Sound) can be used to
Glossary
A-37
generate acoustic signals. When specific conditions are fulfilled, the acoustic
signal is issued.
A Trigger command can be included in a programmable button, but not in the
online control. The following syntax is valid:
Time
Time
Trigger TRIGGERNAME
Reaction 1
Reaction 2
Reaction ...
EndTrigger
Condition,True,Delay,Limit,Hysteresis
The activation time and the trigger name are selected by the user. If the condition specified via Condition=... and True becomes true, all commands
between Trigger and EndTrigger are executed. Execution is delayed by the
Delay parameter and can be limited to a specific number of executions via
Limit.
As several triggers can be simultaneously active, all trigger commands must
have unique names. Terminating an active trigger condition is by entering the
trigger command again with an added zero and closing it without a reaction.
Time
Trigger TRIGGERNAME
EndTrigger
0
This applies to each single trigger. It is not possible to simultaneously close all
triggers.
The times at which a trigger is actuated are entered in the Audit Trail and can
be displayed on the screen or included in the printed output.
For details, refer to the following topics:
¾Trigger Name
¾Trigger Validity (True)
¾Trigger Condition
¾Trigger Limit
Tip:
¾Trigger Delay
¾Trigger Hysteresis
¾Trigger Reaction
A pure basis license does not include the advanced feature
Trigger (also see
Dionex Data Systems.
Trigger Name
The name of a ¾Trigger serves to identify it. Therefore, the trigger name must
be unique; for example, the trigger cannot have the same name as a device or
A-38
Glossary
another command. This allows simultaneous activation of several trigger commands with different names.
Please note that the trigger command and the trigger name are separated. For
example:
2.500
Trigger TRIGGERNAME
.....
To quickly locate the trigger in an Audit Trail or a Report, it is recommended
that you enter the trigger name in capital letters.
Trigger Condition
A ¾Trigger condition is entered as follows:
Condition=
<Parameter>
<Operator>
<Value>
The expressions Parameter, Operator, and Value have the following significance:
Expression
Description
<Parameter>
All installed channels, but also parameters such as Pressure (system pressure) and System Status can be used.
Instead of the actual value, the first derivative of the signal can be evaluated. This is achieved by adding the signal property ¾DELTA.
<Operator>
<, >, =, <=, >= and <>
<Value>
Fixed point number. The dimension of the <Value> corresponds to the signal dimension. Parameters that are combined with DELTA have the dimension [signal dimension / sec].
If several parameters are to be linked, this can be realized via mathematical (+,
-, *, / , **) or logical (AND, OR, NOT, XOR) operators. Round brackets show
combinations and hierarchy.
Glossary
A-39
Logical links of entire conditions are also possible. Adding Condition = is optional.
Caution:
A trigger is executed whenever the condition changes from
false to true (flank triggering). If a condition is true at the
beginning, the trigger cannot be changed from false to true.
This applies as long as the condition is set to false again
(e.g., manually or via another trigger). We therefore recommend determining specific start conditions at the beginning of
a trigger command.
Trigger Validity (True)
The parameter True indicates for how long the condition must be fulfilled before the ¾Trigger command is executed.
The parameter True is used as a criterion for the truth of signals (e.g., to differentiate between true signals and spikes). If the parameter TRUE is used in
combination with the parameter DELAY, the command is only executed
<TRUE> + <DELAY> seconds after the condition is fulfilled.
Trigger Delay
The parameter Delay refers to the delay in seconds. This is the interval between the fulfillment of a ¾Trigger condition and triggering a reaction.
If the parameter DELAY is used in combination with the parameter TRUE, the
command is only executed <TRUE> + <DELAY> seconds after the condition is
true.
Trigger Limit
Normally, a ¾Trigger command is repeated any number of times (each time
the corresponding trigger condition is fulfilled). This only changes if the trigger
is terminated.
The parameter Limit enables you to define the maximum number of times the
trigger is executed. As soon as this number is reached, the trigger automatically ends.
A-40
Glossary
Trigger Hysteresis
To prevent multiple trigger execution with very noisy signals, each ¾Trigger receives the Hysteresis parameter in addition to the True parameter.
In contrast to the True parameter, hysteresis is signal-dependent, not timedependent. The parameter can vary between 0 and 100%. The default value is
5%.
Trigger Reaction
As a response to a ¾Trigger condition becoming true, virtually any instruction
can be performed. Even trigger commands can be triggered!
TTL
TTL (Transistor-Transistor Logic) inputs and outputs are electronic switching
devices for controlling instruments.
Unzoom
The command undoes the last zoom operation.
In the signal window, the Unzoom command can be implemented by doubleclicking in the ¾Overview Window.
Wait
The Wait command interrupts program execution until the specified remote input signal arrives. During this time, program time and data acquisition are
stopped and the pump is kept in the Hold mode.
Wizard
Various input procedures, such as creating a ¾Sequence or defining ¾Query
conditions, are facilitated by the use of Wizards. The system prompts the user
to define conditions and to enter the required information. The Wizard then
adds default elements to complete a basic structure.
Glossary
A-41
Workspace
The area between the menu bar or ¾Toolbar and the ¾Status Bar is called the
Workspace. The workspace displays the currently open windows of the various "window types."
The workspace allows you to open a specific set of windows. This is usually the
most recently used workspace, but you may save or open any view with a
separate name. The Dionex Data System stores this information in WSP-Files.
To save settings of an individual window without changing the workspace, you
can use a ¾Report Definition (RDF-File). The RDF-File is used whenever a
sample or a window is opened individually, not in connection with a workspace.
Combining RDF-Files and a workspace allows the user to have a personal representation of the screen. For a detailed description, refer to the
User Profiles chapter.
Year 2000 Conformity
According to the document PD2000-1:1998, published by the British Standards
Institution (BSI), "year 2000 conformity shall mean that neither performance nor
functionality is affected by dates prior to, during and after the year 2000."
In particular, this means that the following rules are adhered to:
1. General Integrity: No value for current date will cause any interruption in operation.
2. Data Integrity: Date-based functionality must behave consistently for dates
prior to, during, and after the year 2000.
3. Explicit/Implicit Indication of the Century: In all interfaces and data storage,
the century in any date must be specified either explicitly or by unambiguous
algorithms or inferencing rules.
4. Leap Year: The year 2000 must be recognized as a leap year. (According to
the Gregorian calendar, the year 1900 was not a leap year.)
The Dionex Data System and all Dionex instruments are in compliance with the
BSI rules. Contact Dionex if a Year 2000 Certificate is required for any Dionex
product.
A-42
Glossary
Zoom
Press the left mouse button and draw a frame around a section of a signal window that you wish to zoom. Select ¾Unzoom to undo the last zoom operation.
Select Full size to return to the original display (100% representation).
Notes:
In the online signal window, an ¾Overview Window is displayed in the upper right corner in addition to the enlarged
section.
While drawing a zoom frame, the operation can be canceled
by pressing the ESC key or the right mouse button. Use this
function to prevent redrawing the window when the wrong
frame was selected.
Index
i
Index
A
Acquisition On/Off ....................A-3, A-5
Administrator Privileges......................17
AIA................................43, 46, A-3, A-4
AIA Peak Type ................................A-11
ALT+CTRL+DEL ...........................A-17
Amount Calculation.............................60
Analytical Instrument Association A-3,
A-4
ANDI ...................................................43
Archiving Data ....................................44
ASCII.............................................43, 46
Audit Trail ..................14, 27, 28, 47, 48,
86, 111, A-4, A-17, A-21, A-24
AutoAutoscale ...................................A-4
Autosampler ......................................A-5
Autoscale ...................................A-4, A-5
Autozero ............................................A-5
B
Back.....................................................23
Background .....................................A-35
Backup.............................44, 87, 88, A-6
Baseline .............................105, 106, A-6
Baseline Tool.....................................105
Basis License .......................................13
Batch..............................................53, 54
Batch Processing ...................35, 53, A-7
Browser
Actions............................................80
Browser.........................................A-7
Common Features with the
Windows Explorer .....................28
Differences from the
Windows Explorer .....................29
Function..........................................30
Selecting Data.................................28
C
Calibrating .........................101, 102, 103
Calibration ...........................................53
Displaying a Report ......................110
Function Data ...............................112
Information ...................................112
Calibration Curve ..............................112
Calibration Data.................................101
Calibration Information .....................112
Calibration Plot..................................112
Calibration Report .............................110
Calibration Wizard ..............................53
Cell Calibration .................................103
Century Compliance ........................A-41
Changing ...........................................A-6
Baseline ........................................105
Configuration (Hardware)...............20
Server Configuration...........69, 71, 72
Check.................................... A-26, A-35
Connection..................................A-26
System.........................................A-35
Check Command .............................A-25
CHKSETUP ........................................56
CHKVERS ..........................................56
Chromatogram ...........................104, 105
Chromatogram Comparison...............108
Perform .........................................108
Chromatogram Overlay .....................A-7
Chromatographic Methods ................A-8
Chromatography Instruments.................6
Chromatography Server.... 8, A-31, A-32
Client .................................................A-8
Client User Interface............................25
Client/Server................................8, 9, 10
ii
CMSERVER.CFG...........................A-31
CMSETUP.LOG..................................57
Command
Acquisition On/Off .......................A-3
General............................................37
Hold ............................................A-15
Protocol Command .....................A-24
System ............................................37
Trigger Commands .....................A-37
Undo / Redo Command ..................23
Comment ...........................................A-9
Communication .....................................6
Compare ........................................64, 65
Chromatogram Overlay.................A-7
Chromatograms...................63, 64, 65
Perform a Chromatogram
Comparison..............................108
Compression ........................................45
Raw Data ........................................45
Computer ...............................................7
Condition...............................A-38, A-39
Trigger ........................................A-39
Trigger Commands .....................A-36
Conductivity Detection......................103
Conformity ......................................A-41
Year 2000 ...................................A-41
Connect........................................82, A-9
Connect to Timebase ...........................77
Connectivity ....................................A-18
Open Database ............................A-18
Contents.............................................A-9
Online Help ..................................A-9
Context-Sensitive Help....................A-13
Continue (Flow) ................................A-9
Control.................................................37
Concept...........................................36
Device Driver..............................A-12
Direct ..............................................36
DX-80 .....................................37, 114
General Commands.........................37
PGM-File........................................38
System Commands..........................37
Index
Control File......................................A-23
Control Panel.............................26, A-20
Actions............................................76
Connect with Timebase...................77
Function..........................................26
Load................................................76
Operation ........................................76
Copy Protection Location....................73
Correction Factor
Sample Preparation.........................49
Create
Sample List .....................................81
Sequence Table...............................80
CTRL+ ALT+DEL ..........................A-17
D
Daily Protocol........................14, 48, A-4
Data ................................ 39, A-28, A-30
Data Acquisition ................................A-9
Simulate ..........................................79
Data Collection Rate..........................A-9
Data Compression................................45
Data Export..........................................43
Data HPG.........................................A-21
Data LPG .........................................A-21
Data Prec. ........................................A-21
Data Reprocessing ...............................59
Data Security .........................44, 87, A-6
Data Storage ..............42, 44, 47, 87, A-6
Data Structure......................................40
Data System.........................................12
Components ....................................12
Tasks...............................................12
Data Transfer .........................................6
Data Wave .......................................A-21
Database ............................... A-10, A-11
Connect...........................................82
Create..............................................83
Data Storage....................................42
Datasource ................................40, 41
Disconnect ......................................83
Index
Datasource ...........................................40
Connect...........................................82
Create..............................................83
Database......................................A-10
Disconnect ......................................83
Handling .........................................84
Lock................................................85
ODBC Manager ..............................84
Removable Media ...........................85
Set up ..............................................81
Date .......................................A-15, A-35
DEC.....................................................11
Decimal Minute ...............................A-15
Delay
Trigger Commands .....................A-36
Trigger Delay..............................A-39
Delimiter Tool ...................................105
DELTA ............................................A-11
Demo Data...........................................79
Demo Mode .....................................A-11
Det. Linearity...................................A-21
Det. Noise and Drift.........................A-21
Det. Wavelength ..............................A-21
Detection Code at Peak End ............A-11
Detection Code at Peak Start ...........A-11
Detector
Sensitivity ...................................A-30
Device Communication .........................6
Device Driver ............................14, A-12
Dilution Factor ....................49, 80, A-12
Sample Variable..........................A-12
Dionex Data System ............................24
Client User Interface.......................25
License Server ............................A-16
Program Start..................................24
Server Monitor Program .............A-32
Dionex .................................................36
Direct Control......................................36
System Commands..........................37
Directory..............................................85
Lock................................................85
Disconnect .......................................A-13
iii
Database..........................................83
Timebase.....................................A-13
Display.................................................25
Dongle ...........................13, 19, 73, A-13
Download ....................................74, 101
Calibration Data............................101
Drag & Drop....................................A-13
Drift .................................................A-35
Driver
Device Driver..............................A-12
Device Drivers (Overview) .............14
E
Error Message
Audit Trail ....................................A-4
Excel....................................................43
Explorer ...........................28, 29, 30, A-7
Export ............................................43, 46
F
F1 Key .............................................A-13
File.......................................................34
Create..............................................33
Handling .........................................84
Open ...............................................33
Restore ........................................A-27
File History................................42, A-14
Find..................................................A-14
Firmware..........................................A-17
Flow
Continue .......................................A-9
Hold ............................................A-15
Stop.............................................A-34
Full Size...........................................A-14
G
General Commands..............................37
Generating a Report...........................110
iv
Index
GLP ...... 55, A-4, A-9, A-13, A-14, A-26
Good Laboratory Practice ........55, A-14
Graphic Card .........................................7
H
Hard Disk ..............................................7
Help .................... 1, 2, A-13, A-16, A-19
History .......................................42, A-14
Hold............................ A-15, A-34, A-40
Hysteresis ........................................A-40
Trigger ........................................A-40
Trigger Commands .....................A-36
I
Import ..................................................46
Index (Online Help).........................A-15
Industry Minute ...............................A-15
Initial Installation and Update .............15
Inj. Carry Over.................................A-21
Inj. Linearity ....................................A-21
Inj. Prec. and Ret. Repro .................A-21
Inject
Autosampler..................................A-5
Injection Time .................................A-15
Insert Peak Tool.................................106
Installation
Actions in the Control Panel...........76
Actions in the Server
Configuration Program ...................69
Adding Instruments ........................74
Adding Timebases ..........................74
Changing the Server
Configuration .............................69
Client/Server Installation ................10
Dionex Data System Options..........13
Entering the Key Code....................73
Local ...............................................10
Network Installation .......................10
Selecting the Copy Protection
Location .....................................73
Server Configuration Program..20, 21
Software Protection ........................19
Timebase.....................................A-36
Tips for Software Installation .........15
Installation Qualification Manager ......56
Installation ...........................................69
Integration ...........................................60
Actions in the Window Section
"Chromatogram" ......................104
Actions in the Window Section
"Report" ...................................110
Chromatogram Comparison............64
Integration Report...........................62
Manual Re-Integration..................104
Operation ........................................61
Overview.........................................60
Peak Summary Report ....................63
Performing a Chromatogram
Comparison..............................108
Integration Report..............................110
Display..........................................110
Interface
Server Configuration...................A-31
IPX/SPX ..............................................78
IQDATA..............................................57
ISDN......................................................8
Isocratic ...........................................A-16
K
Key Code .............................19, 73, A-16
Keyboard ...........................................115
Operation ........................................22
Shortcuts .......................................115
L
LAN.............................................6, 8, 10
Updating Moduleware ....................74
Layout Mode ...................................A-20
License Server .................................A-16
License Types ......................................13
Index
v
Limit ................................................A-23
Pressure.......................................A-23
Trigger ........................................A-39
Trigger Commands .....................A-36
Load
Autosampler..................................A-5
Lock...............................................85, 86
Log ......................................................27
Log Command .................................A-17
Log File (CMSETUP.LOG) ................57
Log Files..............................................56
Lower Limit (Pressure)....................A-23
M
Manual (User Manual)...........................3
Manual Peak Assignment ..................106
Manual Re-Integration.......................104
Method ......................................59, A-24
Method Window..................................31
Microsoft Network ..............................77
Millennium Compliance ..................A-41
Mode
Monitor Only ..............................A-17
Moduleware...............................74, A-17
Monitor Only...................................A-17
Monitor Program .............................A-32
Mount Datasource ...............................85
Mouse ..................................................22
Operation ........................................23
Right Button ...............................A-27
Move
Peak Delimiter ..............................105
Multi-Tasking ..............................8, A-17
Multi-Threading ..............................A-17
My Computer.......................................77
N
Name
Sample Variable..........................A-28
Trigger ..............................A-37, A-38
Named Pipes........................................77
NETBEUI ............................................77
Netware................................................77
Network .................................................8
Client ............................................A-8
Handling .........................................84
Installation ......................................10
Local Client/Server Installation ......10
Overview...........................................8
Server..........................................A-31
Server Configuration........ A-31, A-32
Network Neighborhood .......................77
Noise........................... A-18, A-33, A-35
Signal-to-Noise Ratio .................A-33
Novell ............................................11, 78
O
ODBC Interface ...............................A-18
ODBC Manager...................................84
Online Batch..................................53, 54
Print ................................................35
Online Help
1, 2, A-9, A-14, A-15,
A-16, A-19
Online Window ...................................26
Function..........................................26
Operating System...................................8
Operation .......................................12, 13
Data System ..............................12, 13
Keyboard ........................................22
Mouse .............................................23
Sample-Oriented .........................A-28
Using Shortcuts.............................115
Operational Qualification ................A-19
Options ................................................13
Dionex Data System .......................13
OQ ...................................................A-19
Original Size....................................A-14
Overlay ..............................................A-7
Chromatogram ..............................A-7
Overview
vi
Index
Chromatography Data System ........12
Data.................................................39
Integration.................................60, 61
Online Help ..................................1, 2
User Manual .....................................3
Overview Window.................A-20, A-40
P
Page Setup
Printing with a Report Template...112
PAL .....................................................73
PAN File..............................................26
Panel ....................................................26
Control Panel ..............................A-20
Function..........................................26
PC..........................................................7
Peak ...................................................106
Insert .............................................106
Manual Assignment ......................106
Rename .................................106, 107
Peak Assignment ...............................106
Peak Delimiter ...................................105
Move.............................................105
Peak End..........................................A-11
Peak Properties ..................................106
Peak Start.........................................A-11
Peak Summary.................................A-20
Generate........................................110
Report .......................................62, 63
Performance Qualification...............A-21
PGM-File.........................................A-24
Definition........................................38
Power-Failure Protection...........47, A-22
Power-Off Case (Raw Data Storage) ...47
Power-Off Handling ..................47, A-23
PQ....................................................A-21
Pressure Limits ................................A-23
Pressure Transducer Offset................102
Printing ................................................35
Program File ....................................A-23
Program Start.......................................24
Programming .............................38, A-23
Protection (Power Failure)...............A-22
Protocol .........................48, 77, 78, A-24
Protocol Data.................................47, 86
Pump
Continue .......................................A-9
Gradient ......................................A-21
Hold ............................................A-15
Stop.............................................A-34
Pump Calibration...............................102
Q
QNT-Method ...................................A-24
Qualification ......................... A-19, A-21
Quantification Method.....................A-24
Query ........................ 89, 90, A-24, A-25
Criteria ......................................91, 92
Editing SQL Statements..................96
Enter ...............................................95
Examples (Dialog Box)...................97
Examples (Wizard) .........................94
Perform ...........................................89
Saving a Query File ........................99
Search .............................................90
Specify ............................................95
Wizard ............................................90
R
RAM......................................................7
Raw Data .........................................A-25
Acquisition....................................A-3
Compression ...................................45
Definition........................................44
Export .............................................46
Import .............................................46
Restoring.........................................45
Storage ......................................44, 45
Storage (Power-Off Case)...............47
RDF File ....................................33, A-26
Reaction (Trigger) ...........................A-40
Index
vii
Ready Check....................................A-25
Reconnect ........................................A-26
Redo ....................................................23
Redraw.............................................A-26
Registration .........................................50
Sample ............................................50
Re-Integration....................................104
Manual..........................................104
Remote Input ...................................A-40
Remote Procedure Call....................A-27
Removable Media................................85
Replot from Beginning ....................A-26
Report ................................................110
Audit Trail ....................................111
Display..........................................110
Overview.......................................110
Peak Summary ..............................110
Report Definition.......................33, A-26
Report Template
Printing ...........................................66
Printing with a Template...............112
Reproducibility....................................49
Restore.........................................89, 101
Backup Files ...................................88
Calibration Data............................101
File..............................................A-27
Raw Data ........................................45
Right Mouse Button ........................A-27
RPC ...............................10, 13, 15, A-27
S
Sample
Comment ......................................A-9
Data.............................................A-28
Dilution Factor............................A-12
Evaluation.......................................54
Injection Time.............................A-15
List..................................51, 80, A-30
Name...........................................A-28
Preparation......................................49
Processing...........................49, 53, 54
Protocol ..........................................48
Registration.....................................50
Status ..............................................80
Type ............................................A-29
Sample Number (Nr.) ......................A-28
Sample Type ..............................80, A-29
Sample Variable ..............................A-29
Comment.......................................A-9
Dilution Factor............................A-12
Injection Time.............................A-15
Name...........................................A-28
Type ............................................A-29
Sample-Oriented Operation .............A-28
Sampling Rate......................... A-9, A-29
Scaling ...................................... A-4, A-5
Search (Query).....................................89
Sensitivity
Detector ......................................A-30
Signal Parameter .........................A-30
Separation Procedures .........................49
Sequence..........................................A-30
Data.............................................A-30
Lock................................................85
Sample Data................................A-28
Sample List .................................A-30
Sequence Table...........................A-30
Table .........................................51, 80
Sequence Wizard ...........................52, 80
Serial Number................................13, 19
Server...............................................A-31
Changing the Configuration............69
Chromatography Server ..............A-31
Client ............................................A-8
Configuration................... A-31, A-32
Monitor Program ........................A-32
Network ........................................8, 9
Server Configuration
Program ..............................69, 71, 73
Setup..................................15, 16, 17, 18
Shortcuts............................................115
Signal...............................................A-33
Acquisition On/Off .......................A-3
viii
Index
Noise...........................................A-18
Physical.......................................A-33
Signal-to-Noise Ratio .................A-33
Signal Noise ....................................A-18
Signal Parameters
Sensitivity ...................................A-30
Signal..........................................A-33
Signal Plot
Autoscale ......................................A-5
Signal Property ................................A-11
Signal Window ..........................A-4, A-5
Simulation .................................79, A-11
Single-User System .............................10
Software Protection ...19, 73, A-13, A-16
Solvent Mixture ...............................A-16
Specification ....................................A-21
SQL Statements ...................................96
Edit .................................................96
Standard
Sample Type ...............................A-29
Start ...............................................24, 25
Status Bar ........................................A-33
Step
Sampling Rate.............................A-29
Stop Flow ........................................A-34
Storage Requirement ...........................45
Suppressor .......................................A-34
System Check ..................................A-35
System Control ....................................37
System Wellness............58, 75, 100, 101
Control Panel ................................100
Device Calibrations ......................101
Enabling and Disabling...................75
Overview.........................................58
Viewing/Restoring Calibration Data 101
T
Table Editor.........................................31
TCP/IP.................................................77
Template ..........................................A-35
Create..............................................33
Open .........................................33, 34
Time...................................... A-15, A-35
Timebase......................................7, A-36
Toolbar ......................................25, A-36
Transducer .........................................102
Transistor-Transistor Logic .............A-40
Trigger .................................. A-36, A-37
Commands ..................................A-37
Condition ....................................A-38
Delay...........................................A-39
Hysteresis....................................A-40
Limit ...........................................A-39
Name................................ A-37, A-38
Reaction ......................................A-40
Upper Limit ................................A-39
Validity (True) ............................A-39
True ...................................... A-36, A-37
TTL..................................................A-40
Type
Sample Type ...............................A-29
Sample Variable..........................A-29
U
Undo ....................................................23
Unit..................................................A-36
Unix.....................................................11
Unknown .........................................A-29
Unzoom ...................... A-20, A-40, A-42
Update ...........................................17, 74
Upper Limit (Pressure) ....................A-23
User Interface ................................12, 25
User Manual ..........................................3
Using Manual and Online Help ........1
User Profiles (Workspace)...................32
V
Validate ...........................................A-29
Validation ............................................55
Version ................................................74
Index
ix
W
Wait .................................................A-40
WAN ...............................................8, 10
Wellness ........................58, 75, 100, 101
Control Panel ................................100
Device Calibrations ......................101
Enabling and Disabling...................75
Overview.........................................58
Viewing/Restoring Calibration
Data..........................................101
Window
Create..............................................33
Open ...............................................33
Window Types.....................................26
Browser...........................................28
Control Panel ..................................26
Different..........................................26
Method Window .............................31
Table Editor ....................................31
Windows 2000...........................17, A-17
Windows 98................ 8, 17, A-17, A-18
Windows Network ...............................10
Windows NT..................15, 17, 18, A-18
Windows NT/2000 ................................8
Wizard ...........................53, 90, 94, A-40
Working Rules...................................A-8
Workspace .................................32, A-41
Y
Year 2000 ........................................A-41
Z
ZIP Drive.............................................85
Zoom .................................... A-20, A-42
x
Index