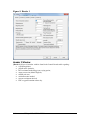
1
Interactive APEX (i_APEX) USERS GUIDE USING APEX2110 and APEX0806 March 2014 Technical Report 13-TR 50 by Mark Siemers1, Steve Plotkin2, Phil Gassman1 Center for Agricultural and Rural Development Iowa State University Ames, Iowa 50011-1070 www.card.iastate.edu 1 Center for Agricultural and Rural Development, Iowa State University, Ames, Iowa; (email: [email protected] or [email protected]) 2 University of Massachusetts Extension/USDA Natural Resources Conservation Service, Amherst, MA Iowa State University does not discriminate on the basis of race, color, age, ethnicity, religion, national origin, pregnancy, sexual orientation, gender identity, genetic information, sex, marital status, disability, or status as a U.S. veteran. Inquiries can be directed to the Interim Assistant Director of Equal Opportunity and Compliance, 3280 Beardshear Hall, (515) 294-7612. Contents List of Figures ................................................................................................................................. ii List of Tables ................................................................................................................................... ii Interactive APEX (i_APEX) .......................................................................................................... iii Introduction ...................................................................................................................................... 1 I_APEX Methods ........................................................................................................................ 2 ACCESS Database Links ............................................................................................................ 5 Getting Started: i_APEX Graphical User Interface .......................................................................... 7 Menu............................................................................................................................................ 8 Toolbar ...................................................................................................................................... 10 Configuration............................................................................................................................. 11 Control Record List ................................................................................................................... 12 Edit Area.................................................................................................................................... 12 Record IDs ................................................................................................................................. 13 Run Header ............................................................................................................................ 13 Header 1 Window ...................................................................................................................... 13 Header 2 Window ...................................................................................................................... 14 Header 3 Window ...................................................................................................................... 15 Header 4 Window ...................................................................................................................... 16 Header 5 Window ...................................................................................................................... 17 Parameter Windows .................................................................................................................. 18 Parameters 1 Window................................................................................................................ 18 Parameters 2 Window................................................................................................................ 19 Parameters 3 Window................................................................................................................ 20 Parameters 4 Window................................................................................................................ 21 Parameters 5 Window................................................................................................................ 22 Parameters 6 Window................................................................................................................ 23 Parameters 7 Window................................................................................................................ 24 Parameters 8 Window................................................................................................................ 25 Weather ..................................................................................................................................... 26 Soils ........................................................................................................................................... 27 Erosion/Sediment ...................................................................................................................... 27 Hydrology .................................................................................................................................. 28 Runoff........................................................................................................................................ 28 Irrigation .................................................................................................................................... 28 Evapotranspiration..................................................................................................................... 28 Fertilization ............................................................................................................................... 29 Pesticides ................................................................................................................................... 30 Subareas..................................................................................................................................... 30 Subareas: Routing...................................................................................................................... 31 Subareas: Floodplains and Filter Strips ..................................................................................... 32 Subarea Field Operations .......................................................................................................... 33 Calibration and Validation of APEX Using i_APEX ................................................................ 34 References ...................................................................................................................................... 37 Appendix A – ACCESS i_APEX Input Tables .............................................................................. 39 Appendix B – ACCESS I_APEX Output Tables ........................................................................... 55 Appendix C - APEX0604 and APEX0806 Miscellaneous Parameter Table Definitions............... 64 List of Figures Figure 1: i_APEX Flow Chart .......................................................................................................... 4 Figure 2: Database Layout................................................................................................................ 6 Figure 3: Graphical User Interface Window .................................................................................... 7 Figure 4: Configuration Window ................................................................................................... 12 Figure 5: Header 1 .......................................................................................................................... 14 Figure 6: Header 2 .......................................................................................................................... 15 Figure 7: Header 3 .......................................................................................................................... 16 Figure 8: Header 4 .......................................................................................................................... 17 Figure 9: Header 5 .......................................................................................................................... 18 Figure 10: Parameters 1 .................................................................................................................. 19 Figure 11: Parameters 2 .................................................................................................................. 20 Figure 12: Parameters 3 .................................................................................................................. 21 Figure 13: Parameters 4 .................................................................................................................. 22 Figure 14: Parameters 5 .................................................................................................................. 23 Figure 15: Parameters 6 .................................................................................................................. 24 Figure 16: Parameters 7 .................................................................................................................. 25 Figure 17: Parameters 8 .................................................................................................................. 26 Figure 18: Subarea Edit Window ................................................................................................... 31 Figure 20: Subarea Field Operation Addition/Edit......................................................................... 34 List of Tables Table 1: ACCESS Database Input Tables ....................................................................................... 3 Table 2: ACCESS Database Output Tables .................................................................................. 11 Table A.1: Control Records ............................................................................................................ 39 Table A.2: Livestock ...................................................................................................................... 41 Table A.3: Subarea ......................................................................................................................... 41 Table A.4: Management ................................................................................................................. 43 Table A.5: Field Operations ........................................................................................................... 44 Table A.6: Soils .............................................................................................................................. 45 Table A.7: Soil Layers.................................................................................................................... 45 Table A.8: Weather ........................................................................................................................ 46 Table A.9: Weather by Month ........................................................................................................ 46 Table A.10: Crops .......................................................................................................................... 47 Table A.11: Fertilizer ..................................................................................................................... 48 Table A.12: Pesticide ..................................................................................................................... 49 Table A.13: Operations .................................................................................................................. 49 Table A.14: Miscellaneous Parameters (for APEX2110; ............................................................... 50 Table A.15: Selected Variables ...................................................................................................... 53 Table B.1: Average Output............................................................................................................. 55 Table B.2: Yearly Output ............................................................................................................... 58 Table B.3: Crop Yield Output ........................................................................................................ 62 Table B.4: Monthly SWAT Output ................................................................................................ 62 Table B.5: Organic C and N Output ............................................................................................... 62 Table B.6: Watershed Output ......................................................................................................... 63 ii Interactive APEX (i_APEX) Program Objective: To provide a tool for managing large numbers of APEX runs, handling data input and output. Program Components: • ACCESS Database: Contains input tables used by I_APEX to construct APEX runs and output tables to organize APEX output. • Graphical User Interface: Allows for single runs and ranges of runs and permits editing of input data as well as selection of output variables and output files. Program Operation: • Fill the ACCESS database with the necessary data. • Execute I_APEX and bring up the interface. • Select output variables and output files using the interface. • Make any necessary edits in the interface. • Select and execute the runs using the interface. • Examine the relevant output tables in the ACCESS database. Output Capabilities: • General output by APEX run and subarea. • General output by run, subarea and year. • Output to the SWAT model. • Pesticide output by year. • Yield output by year. • Organic carbon and nitrogen output by year and soil layer. • Watershed output by year and month. Users: • CEAP National Assessment. iii iv Introduction The interactive APEX (i_APEX) is a user friendly interface for the physical process and environmental fate model, Agricultural Policy/Environmental eXtender (APEX) (Williams et al., 2006, 2008; Williams and Izaurralde, 2006; Gassman et al., 2010). I_APEX is programmed in C++ and performs automatic management of the input data, execution of each APEX run, and data storage of selected model outputs using a single Microsoft ACCESS database to manage both the input and output data required for APEX simulations. The model provides a well organized easily understood interface with definitions and help assistance for most variables. The greatest advantage of i_APEX is in its ability to perform multiple model runs (over 100,000 runs in a run-set) in “batch” mode for each record selected in the Control Records Table. This provides a tremendous advantage when attempting to model multiple scenario permutations for a single field or small watershed, or in modeling thousands of agricultural fields and other landuses over a large area such as a river basin or region. I_APEX is being used by CEAP in a national effort to assess the effectiveness of agricultural conservation practices (Kellogg et al., 2011, 2012a, 2012b, and 2012c). Agricultural regions (based on river basins) of the United States are being modeled that simulate nutrient, pesticide and sediment losses under conditions of agricultural practices based on national farmers’ surveys from 2003-2006, and 2011-2013 at over 40,000 selected National Resources Inventory (NRI) sample points. The software has also been used in other studies such as by Yin et al. (2009) in simulations of runoff and sediment yield from field plots in the Upland Huaihe River Watershed, China. APEX was designed to simulate agricultural management strategies for single field farms containing multiple contiguous fields, grassed waterways, filter strips and buffers, and small watersheds. It can also simulate non-agricultural landscapes including urban settings. The model operates with continuous simulations using a daily time-step with as many years as desired. Weather conditions (precipitation, air temperature, solar radiation , humidity and wind speed and direction), soil conditions, hydrology, erosion/sedimentation, crop growth, weed competition, grazing, irrigation, tillage operations, agricultural management and nutrient and pesticide dynamics are included in the simulations. Hydrology aspects include overland and channel runoff, subsurface flow, deep percolation, field sediment losses and evapotranspiration. APEX and its field scale model predecessor, the Environmental Policy Impact Climate (EPIC) model (Williams, 1990) have been extensively used to simulate nutrient, pesticide and sediment movement. EPIC has been used under numerous conditions in the U.S. and other countries (Gassman et al., 2005) and even at a global level (Liu at al., 2007). Since its inception in 1996, APEX modeling has been applied in multiple studies to evaluate the impact of agricultural practices (e.g., Ramanarayanan et al., 1997; Gassman et al., 2002; and Williams et al., 2006). APEX has been used as a Best Management Practice (BMP) model by simulating land management scenarios (Borah et al., 2006). The model has been calibrated and validated for hydrology and nutrient and sediment losses (Wang et al., 2006; Ramanarayanan et al., 1998; and Wang et al., 2008) and for pesticide losses (Mudgal et al., 2010; Plotkin et al., 2013). This user manual provides explanations for i_APEX interface structure, navigating through the i_APEX screens, input and output tables and instruction on how to set up scenarios and perform model Runs. Guidance is provided on design and construction of scenarios and sample set-ups to perform desired simulations of nutrient, pesticide and sediment movement through contiguous fields, channels that drain the fields, field run-on/run-off, and reservoir input-output. A thorough explanation of APEX concepts and equations is provided by Williams et al. (2008) and will only be addressed in this manual in a general manner to explain i_APEX methods for employing these concepts. Comprehensive variable definitions can be found in the APEX user’s manual (Steglich and Williams, 2008). Definitions are also provided for most variables at the bottom of each i_APEX interface screen. I_APEX Methods I_APEX ACCESS tables contain the input data that APEX reads and uses to build a complete set of APEX input files. The program executes APEX, reads the APEX output files and fills the appropriate output tables in the ACCESS database (Figure 1). ACCESS input tables are organized by field operations management, soil properties, weather, pesticide properties and fertilizers for each subarea (Table 1). Each input table may be edited directly in ACCESS or edited within the i_APEX editing respective screens. Output tables consist of monthly and annual crop yields, watershed output (except for pesticides) and annual pesticide output (Table 2). ACCESS input table formats are presented in Appendix 1 tables and output table formats are shown in Appendix 2 tables. Each i_APEX graphical interface screen is organized by aspects of farming categories and correlate with multiple ACCESS tables. i_APEX interface screens, tabs and buttons are organized in the following schema (i_APEX buttons are bracketed and bolded): Graphical User Interface Menu selections File – Configuration Edit – View – Window – Select – Run – Record – Help – Tool Bar [Run Header] [Header 1] [Header 2] [Header 3] [Header 4] [Header 5] [Parameters] [Parameters 1] [Parameters 2] [Parameters 3] [Parameters 4] [Parameters 5] [Parameters 6] [Parameters 7] [Parameters 8] Weather Station – [Select] [Edit] Subareas – 1, 2, 3… 2/ Interactive APEX (i_APEX) USERS GUIDE Soil – [Select] [Edit] Tillage (suggestion: change name to “Field Operations”) – [Change Operation] [Add Operation] [Delete Operation] [Miscellaneous] [Channel] [Reservoir] [Lagoon] [Grazing] [Routing Reach] [Auto Fertilization] [Auto Irrigation] Table 1: ACCESS Database Input Tables Crops Fertilizer Field Operations Livestock Corresponding Apex Input Files apexcont.dat iasite.dat iacrop.dat iafert.dat nnnn.ops iasite.dat Management Operations Parameters Pesticide Point Source iasub.dat iatill.dat iaparm.dat iapest.dat iasub.dat Selected Variables Soil Layers Soils Subareas iaprnt.dat nnnn.sol nnnn.sol iasub.dat nnnn.ops iaweath.dat Table Name Control Records Weather Weather by Month iaweath.dat iawind.dat Table Contents Data general to the run. Crop parameters Fertilizer parameters Operation schedule data Herd data Management data Tillage operation parameters Coefficients internal to APEX pesticide parameters Point source pollution file names User selected output variables Soil layer data General soil data General subarea data Weather station data Monthly wind and weather data Table Structure One record per execution of APEX One record per crop One record per fertilizer One record per operation One record for each of ten possible herds per run One record per subarea One record per operation One record per control record One record per pesticide One record per file name One record per variable One record per layer per soil One record per soil One record per subarea One record per weather station One record per weather station per month Interactive APEX (i_APEX) USERS GUIDE /3 Figure 1: i_APEX Flow Chart 4/ Interactive APEX (i_APEX) USERS GUIDE Table 2: ACCESS Database Output Tables Table Name Annual Pesticide Output Annual Pesticide Output 2 Corresponding Apex Output File apex.APS apex.OUT apex.SUS Pesticide losses apex.ACY Crop yield data Table Structure One record per subarea per year One record per subarea per year One record per run per subarea One record per subarea per year Monthly SWAT Output apex.MSW Monthly output to SWAT model One record per subarea per month Organic C and N Output apex.ACN Soil layer C and N data Residue Output apex.OUT SWAT Output apex.SWT SWAT Output 2 apex.SWT Crop residue Annual hydrology and dissolved nutrient output to SWAT model Annual sediment and nutrient associated with sediment output to SWAT model Annual pesticide dissolved and sedimentsorbed output to SWAT model Average Output Crop Yield Output SWAT Pesticide Output Watershed Output Yearly Output apex.APS apex.SWT apex.OUT apex.OUT apex.SUS Table Contents Hydrology data pertinent to pesticide losses General run data Watershed data General run data by year One record per subarea per year One record per subarea per month One record per subarea per day of loss One record per subarea per day of loss One record per subarea per day of loss One record per run per month One record per subarea per year ACCESS Database Links The i_APEX ACCESS database consists of a series of linked tables that contain input and output data (Figure 2). Four support tables, Crops, Fertilizer, Operations and Pesticide are linked to the Field Operations table and the Selected Variables table which is linked to the Average Output and Yearly Output tables. All other tables are linked to either the Control Records table or the Subarea table which is also linked to the Control Records table. (Note: Selection and data changes to any ACCESS table will not be shown in i_APEX until ACCESS and i_APEX is exited followed by re-executing i_APEX.) Interactive APEX (i_APEX) USERS GUIDE /5 Figure 2: Database Layout 6/ Interactive APEX (i_APEX) USERS GUIDE Getting Started: i_APEX Graphical User Interface 1. Executing i_APEX can be achieved by clicking on the i_APEX icon or i_APEX.exe. This will bring up the graphic interface (Figure 3). Figure 3: Graphical User Interface Window 2. Select “File” after the i_APEX window appears. The user may select a file from the menu and can either create an empty database by selecting “New” or select “Open”, and go to the subdirectory containing your i_APEX files and click on the desired i_APEX file such as the example file, new_watersheds.mdb, provided when downloading i_APEX. Interactive APEX (i_APEX) USERS GUIDE /7 Note: If instead of selecting “Open” the user clicks on “File” and selects one of the files from the list of previously used files, a window may appear with the message, “ERROR, unable to open help file “iApexHelp.csv”. This will result in definitions of variables not appearing at the bottom of each i_APEX screen. The execution interface consists of the following four discrete sections: 1) Menu; 2) Tool bar; 3) Control record list on the left below the menu and toolbar; and 4) Edit area to the right of the control record list. Menu 1) File New – create an empty database. Open – open an already existing database. Close – close the resident database. Import APEX files – import APEX files into the current database. The user may import APEX input file records and add, delete or edit existing records. APEXFILE.DAT – imports a complete set of APEX files into the current database. i_APEX determines the file names from the apexfile.dat file. Pesticide File – imports the APEX pesticide file into the Pesticide table of the current database. Fertilizer File – imports the APEX fertilizer file into the Fertilizer table of the current database. Crop File – imports the APEX crop file into the Crop table of the current database. Operations File – imports the APEX operations file into the Operations table of the current database. Parameter File-imports the APEX parameter file into the parameter table of the current database. Import (Area Studies Files) – used to import more APEX files. Operations File – imports an APEX operations schedule file into the Field Operations table of the current database. Soil – imports an APEX soil file into the Soil and Soil Layer tables of the current database. Weather File – imports an APEX weather file into the Weather table and Weather by Month table of the current database. Wind File – imports an APEX wind file into the Weather by Month table of the current database. Export Output – not presently functioning. 8/ Interactive APEX (i_APEX) USERS GUIDE Configuration – used to set i_APEX program settings. See Configuration Section. 2) Edit command provides the user with an interface to edit i_APEX ACCESS input tables. Edit Header Information – edit Control Record information. Edit Parameters – edit parameters for this control record. All Crops – edit crops. All Operations – edit operations. All Fertilizers – edit fertilizer entries. All Pesticides – edit pesticide entries. 3) View Toolbar – displays toolbar. Status Bar – displays status bar. Chart Output – not yet implemented. Table Output – not yet implemented. Chart All Samples – not yet implemented. 4) Window – window options 5) Select – inoperative 6) Run (Executes i_APEX runs. Output appends to existing ACCESS output tables. Deleting of records may be performed in ACCESS) This record – run current control record. All records – execute multiple runs of APEX Run …through… - allows user to set a range of control records to be run. Stop if any precheck errors – if precheck indicates errors in data do not run control records. Stop if any run errors – stop multiple runs if APEX error is encountered. Realtime priority – gives APEX absolute priority over all other processes. Save input files – saves the files apexcont.dat, iasub.dat, nnnn.ops, iaparm.dat, and apex.OUT for all runs using the names nn_ia.ext where nn is the control record number and ext is the extension cont, sub, ops, parm, and out respectively. Save SWAT files – saves apex.SWAT output files for all runs as swnnnnnn.swat where nnnnnn is the control record number. Create Yearly table – fills Yearly table for each APEX run. Create Watershed table – fills Watershed table for each APEX run. Create Residue Output table – fills Residue Output table. Pre-Check All Records – checks all control records for data errors Pre-Check This Record – checks the current control record for data errors 7) Record New – creates new dummy control record. Delete – deletes current control record. First – makes the first control record the current control record. Previous – moves the current control record up one record. Next – makes the next control record the current control record. Last – makes the last control record the current control record. Go To – goes to specified record number Search – finds specified record ID Interactive APEX (i_APEX) USERS GUIDE /9 8) Help Help Contents – not yet implemented Help Search – not yet implemented About i_APEX Toolbar 1) Print tool – inoperative 2) Select beginning record 3) Select previous record 4) Select next record 5) Select last record 6) Create new record 7) Go to specified record 8) Search for record 9) Edit database Fertilizer table 10) Edit database Pesticide table 11) Edit database Crop table 12) Edit database Operations table 13) Inoperative 14) Run current record 15) Run all records 10/ Interactive APEX (i_APEX) USERS GUIDE Configuration The configuration window is used to set the i_APEX executable location on your computer, choose the version of APEX to run, select output variables and files and indicate the number of years of output to be saved (Figure 4). These settings are automatically saved when exiting i_APEX. The top line indicates the location and name of the APEX executable. Located to the right is the [change] button that allows the user to browse to another APEX executable. The executable name must be apex2110v3.exe or apex0806.exe as applicable, to match the name internal to the i_APEX code. By default, the directory containing the APEX executable becomes the run directory for i_APEX and APEX. Placing a check in the Prebuild Control Record List check box tells i_APEX to fill the control record list at the right of the interface based on the Control Record table in the database. Otherwise, the control record list is filled as each control record is run. A check beside Prebuild soil list will tell i_APEX to list soils by name when clicking the soil [select] button in the Subareas Window. The next line selects the version of APEX to run. Each version of APEX requires a different set of parameters in the database parameter table. When the version is changed the Parameter table must also be changed. Output variables are located in the Selected Output Variables box. Thirty-three of these output variables have been preselected in the i_APEX Selected box and are always presented in the i_APEX ACCESS output tables. The user is allowed to select an additional 10 output variables from Selected Output Variables by clicking the [Select Variable] button. To change a user selected variable, highlight a variable in the User Selected box and click the Remove button to delete it. Then go to the Selected Output Variables box and highlight a variable not already present in the i_APEX Selected box and click the Select Variable box to add it to the User Selected box. A complete list of APEX output variables is presented in the file output variables.csv. This file along with the file IApexHelp.csv must be present in the run directory for i_APEX to function. A check beside the Run APEX in visible console box allows the user to see APEX output to the screen. Otherwise APEX runs will not be shown. To the right is the box that invokes the [Start with final soil] button. This button causes i_APEX to rename previously created .SOT soil files present in the run directory as the soil file input to APEX runs. The [Select Output Files] button brings up a screen containing check boxes for each possible APEX output file. When a file’s box is checked, that file is selected for output by APEX. Output for only six of these files is captured in the database – OUT, ACY, MSW, SUS, APS and ACN. These files must be checked to receive output in their respective database tables. All output is expressed in metric units by default. Output may be generated in English units by checking the Convert output to English Unit box. The number of years of output can be designated in the last line of Configuration by typing the beginning and ending years in Save output for [first year] through [last year]. Finally, selecting the [OK] button saves all variable designations. Interactive APEX (i_APEX) USERS GUIDE /11 Figure 4: Configuration Window Control Record List The control record list from the Control Records table is sequenced starting with the control record # “1”which may or may not be control record ID 1 (Table 3). A Control Record can be created by clicking on an existing sample record and modifying it as desired or generating a new record by using the tool bar controls. A record from the list must be selected before that record in the Control Records table and the linked records in associated tables can be edited. Edit Area Edit area fields allow editing of all variables in the current control record. These include: Record IDs Run Header 12/ Interactive APEX (i_APEX) USERS GUIDE Parameters Erosion Equation Weather Station Subarea variables Record IDs Record identifier fields (state, county, etc.) are provided to the right of the control record list. Identifiers are optional and may be left blank. Run Header Selecting the [Run Header] button brings up the five Header buttons that account for variables contained in the Control Records table (see Appendix 1, Table 1). These variables are written to the iasite.dat and the apexcont.dat files. Placing the cursor on each variable field will display helpful information at the bottom of the Header screens. Header 1 Window [Header 1] (Figure 5) includes variables regarding: rain duration; simulation timing/print criteria; random number generator cycles; weather input code/day weather generator stops; grazing mode/seed initialization; field dimensions and angle; wind speed (power parameter) and erosion; soil particle diameter; number of times generator seeds initialized. Interactive APEX (i_APEX) USERS GUIDE /13 Figure 5: Header 1 Header 2 Window [Header 2] (Figure 6) includes variables found in the Control Records table regarding: evapotranspiration; plant N and P dynamics; RCN estimator/methodology/non-varying option; output conversion (Metric/English); rainfall peak rate; enrichment ratio method; auto mow minimum interval. EPIC oxygen/Kemanian carbon clay. 14/ Interactive APEX (i_APEX) USERS GUIDE Figure 6: Header 2 Header 3 Window [Header 3] (Figure 7) includes variables found in the Control Records table regarding: slope length/steepness; C, N, P and manure dynamics; lagoon pumping day; grazing effects; cultivation years at start of run; field capacity/wilting point estimation method; MUSI erosion parameters; peak runoff rate-rainfall energy adjustment factor. Interactive APEX (i_APEX) USERS GUIDE /15 Figure 7: Header 3 Header 4 Window [Header 4] (Figure 8) includes miscellaneous variables found in the Control Records table that effect: air quality/atmospheric CO2; pest damage; direction from which precipitation is advancing; watershed flow rate exponent; groundwater flushing rate/return flow; channel dimensions/C factor/pond presence; upland slope; groundwater storage/floodplain infiltration rate and width used in characterizing field buffers. return flow; Irrigation water nitrate. 16/ Interactive APEX (i_APEX) USERS GUIDE Figure 8: Header 4 Header 5 Window [Header 5] (Figure 9) includes variables found in the Control Records table regarding: field dimensions and direction; soil particle diameter; wind erosion control factor/water erosion equation; grazing limit/herds; routing parameters; soil field capacity fraction; irrigation salt concentration; nitrogen in rainfall. Interactive APEX (i_APEX) USERS GUIDE /17 Figure 9: Header 5 Parameter Windows Eight parameter windows display supporting variables and coefficients relative to hydrology, crops, soils, nutrients, field operations, erosion and pesticides. All variables have been assigned preexisting defaults. Generally, these defaults may be used in performing runs unless the expert user has more accurate information that is specific to a field, watershed or region. Some of the variables and coefficients are particularly sensitive and are useful during calibration and validation of the model. This will be addressed in the calibration/validation section. The box at the bottom of each parameters window contains the parameter definition for APEX2110. Definitions for APEX0806 may be slightly different (APEX2110 definitions are located in Appendix 1, Table 14; APEX0806 definitions are in Appendix 3). Parameters 1 Window See Appendix 1, Table 14 for APEX2110 parameters; Appendix 3 for APEX0806; [Parameters 1] in Figure 10 includes variables regarding 1st and 2nd S point curve values used estimating Runoff Curve Number. 18/ Interactive APEX (i_APEX) USERS GUIDE Figure 10: Parameters 1 Parameters 2 Window See Appendix 1, Table 14 for APEX2110 parameters; Appendix 3 for APEX0806; [Parameters 2] in Figure 11 includes variables regarding 1st and 2nd S point curve values used estimating Runoff Curve Number. Interactive APEX (i_APEX) USERS GUIDE /19 Figure 11: Parameters 2 Parameters 3 Window See Appendix 1, Table 14 for APEX2110 parameters; Appendix 3 for APEX0806 [Parameters 3] in Figure 12 includes variables regarding: crop and soil effects on hydrologic cycle crop winter dormancy; root growth soil strength; crop uptake of nitrogen and phosphorus; pest effects on crops; seed germination moisture; wind erodibility coefficient; runoff curve number factors/soil water lower limit/water stress harvest index; sediment routing exponent/coefficient. 20/ Interactive APEX (i_APEX) USERS GUIDE Figure 12: Parameters 3 Parameters 4 Window See Appendix 1, Table 14 for APEX2110 parameters; Appendix 3 for APEX0806; [Parameters 4] in Figure 13 includes variables regarding: crop carbon uptake/ crop growth variables/water stress/root decay rate; frozen soil effect on runoff curve number; Hargreaves coefficient/exponent; partitioning of pesticides between runoff and leaching; mineralization effects; biological mixing; phosphorus and nitrogen dynamics; MUST sediment yield coefficient; delivery ratio at edge of field or watershed to SWAT modeling; groundwater storage. Interactive APEX (i_APEX) USERS GUIDE /21 Figure 13: Parameters 4 Parameters 5 Window See Appendix 1, Table 14 for APEX2110 parameters; Appendix 3 for APEX0806; [Parameters 5] in Figure 14 includes variables regarding: root temperature stress variable; runoff curve number variables/flow layer depth; sediment routing time; C factor variables used in RUSLE erosion calculations; rainfall interception and climate stress factors; water storage of residue coefficient; tillage effect on microbial factors/oxygen equation of microbial activity; nitrogen and phosphorus factors; fraction burned; maximum grazing before rotation. 22/ Interactive APEX (i_APEX) USERS GUIDE Figure 14: Parameters 5 Parameters 6 Window See Appendix 1, Table 14 for APEX2110 parameters; Appendix 3 for APEX0806; [Parameters 6] in Figure 15 includes variables regarding: soil water variables/puddling; nitrogen and phosphorus dynamics/manure erosion/enrichment ratios to SWAT inputs; pesticide loss coefficient and delay of application due to soil saturation; dust variables; microbial activity; furrow irrigation variables; standing dead fall rate conversion to flat residue coefficient; runoff delay pest applicate; technology coefficient (harvest index adjustment to year 2000); rainfall intensity and lateral hydraulics. Interactive APEX (i_APEX) USERS GUIDE /23 Figure 15: Parameters 6 Parameters 7 Window See Appendix 1, Table 14 for APEX2110 parameters; Appendix 3 for APEX0806; [Parameters 7] in Figure 16 includes parameters 86 to 96 regarding: nitrogen upward movement from evapotranspiration; water table including return flow; channel and floodplain evaporation; runoff volume adjustment; cost parameters. 24/ Interactive APEX (i_APEX) USERS GUIDE Figure 16: Parameters 7 Parameters 8 Window See Appendix 1, Table 14 for APEX2110 parameters; Appendix 3 for APEX0806 [Parameters 8] in Figure 17 only includes the two remaining curve number variables that affect soil water content and calculation of the runoff curve number. All other runoff curve number S Point Curve variables are addressed in the [Parameters 1] and [Parameters 2] windows in Figure 10 and 11, respectively. Interactive APEX (i_APEX) USERS GUIDE /25 Figure 17: Parameters 8 Weather A weather station may be selected from the list that is resident in the ACCESS Weather and Weather by Month tables (Graphical User Interface Window, Figure 3). Measured daily weather data can be used in the simulations including: 1. 2. 3. 4. 5. Precipitation; Maximum and minimum temperatures; Solar radiation; Average wind speed; Average relative humidity. If none of the daily weather parameters are available, the Weather input code = [0] (Header 1, Figure 5), and all five weather parameters will be simulated by the APEX climate generator based on the selected weather station (Header 1, Figure 5). Parameters that are used by the climate generator may be edited by selecting the [Edit] button in the Graphical user interface window 26/ Interactive APEX (i_APEX) USERS GUIDE (Figure 3). Availability of other measured parameters can be assigned to the Weather input code based on the designations above. For example, if only precipitation is available and the user needs other daily parameters to be generated, the Weather input code = [1]. Measured precipitation must be available if daily temperatures and other measured parameters are to be used in the simulations. When other measured data are available, a “1” designation does not need to be input. For example, if all 5 parameters have measured values available the Weather input code = [2345]. In all simulations, mean monthly weather data must be input into the ACCESS table, Weather by Month (Appendix 1, Table 9). Soils A soil may be selected by clicking [Select] in the upper right section of the Subarea window (Figure 18). Selecting the Soil [Edit] button brings up the soil edit window, and double clicking on the entries in the soil layer list box brings up an edit window for a particular soil layer. A layer may be added by selecting the [Add Layer] button and editing values using the [Edit Layer] button. To delete a layer, click on the layer in the list box and select the [Delete Layer] button. Alternatively, soil may be added or altered using the Soils (Appendix 1, Table 6) and Soil Layers (Appendix 1, Table 7) ACCESS tables. The USDA Natural Resources Conservation Service has sampling data for many of the soil inputs. Soil water holding capacity parameters required by the model including bulk density, field capacity, wilting point and saturated conductivity. When measured field capacity and wilting point are unavailable the values may be estimated from bulk density texture, organic carbon content and soil fragments using soil equations calculated by the model and designated in of the Control Records Table (Appendix 1, Table 1) for the Field Capacity Method (variable ISW): 0 Field capacity/wilting point estimated using the Rawls method (dynamic); 1 Field capacity/wilting point inputted using Rawls method (dynamic); 2 Field capacity/wilting point estimated using Rawls method (static); 3 Field capacity/wilting pointed inputted (static); Alternatively, these soil parameters and saturated conductivity may be calculated external to the model (e.g., Saxton and Rawls, 2006) and input into the soils tables by the user. Erosion/Sediment APEX allows six different methods that can be used to estimate soil erosion depending upon availability of field soil, crop and rainfall intensity information (Graphical user interface, Figure 3) as defined by Steglich and Williams (2011). These include: MUST - Modified MUSLE theoretical based equation; AOF - Onstad-Foster; USLE - Universal Soil loss Equation; MUSS - Small Watershed MUSLE; MUSLE - Modified USLE; MUSI - Modified MUSLE with input parameters (see BUS(1)); RUSLE - Revised Universal Soil Loss Equation; and RUSLE2 - Modified RUSLE. Interactive APEX (i_APEX) USERS GUIDE /27 Hydrology Components of APEX that most affect hydrology include simulation of: Runoff, percolation and subsurface flow; Irrigation; Evapotranspiration. Runoff There are four methods that can be used to model runoff and percolation by selecting the Runoff Estimation Methodology options (Header 2, Figure 6): Curve number estimate of Q Runoff Curve Number estimator – select either Stochastic or Rigid; Green and Ampt Q: Exponential rainfall simulation – Peak rainfall rate simulated; Green and Ampt Q: Exponential rainfall, Input peak – Peak rain input; Green and Ampt Q: Uniform rainfall – Uniformly distributed, peak rainfall input. Using sensitivity analysis of APEX hydrologic variables, Wang et al. (2006) determined that the NRCS Runoff Curve Number index coefficient (CNIC) and CN2 variables were particularly influential in the effects of runoff and percolation. Curve number may be input manually in field operations or the model can automatically determine the values over the simulation period as crops, cover crops, tillage and hydrologic soil conditions change. Manual input of CN2 will remain unchanged throughout the model run unless a new value is input in a subsequent field operation. Irrigation Two irrigation modes are available: Automatic – Specifications of automatic irrigation may be input by selecting the [Auto Irrigation] button in the Subarea Edit Window (Figure 18); Manual – Irrigation is applied as a field operation with depth and date applied input in the Subarea Edit Window in the Operations section (Figure 18). Six irrigation types are available by assigning the Irrigation code (IRR) in the Auto Irrigation window one of the following options: 0: Dryland; 1: Sprinkler irrigation; 2: Furrow/flood irrigation; 3: Fertigation; 4: Lagoon; and 5: Drip irrigation. Irrigation may be partitioned between runoff and infiltration using the Irrigation Runoff Ratio (EFI) in the Auto irrigation window to designate the volume fraction that may run off (Figure 18). The manual irrigation type and EFI can be assigned in the field operations section of the Subarea window. Evapotranspiration 28/ Interactive APEX (i_APEX) USERS GUIDE Evapotranspiration can be modeled in APEX using one of five alternative methods (Header 2, Figure 6): Penman (1948) – requires daily recorded values for maximum and minimum air temperatures, precipitation, solar radiation, average wind speed and relative humidity; Penman-Monteith (Monteith, 1965) - requires daily recorded values for maximum and minimum air temperatures, precipitation, solar radiation, average wind speed and relative humidity; Priestly-Taylor (1972) - requires daily recorded values for maximum and minimum air temperatures, precipitation and solar radiation; Hargreaves and Samani (1985) - requires daily recorded values for maximum and minimum air temperatures, precipitation; Baier-Robertson (1965) - requires daily recorded values for maximum and minimum air temperatures and precipitation (appropriate for cold climates). APEX computes evaporation from plants and soils separately (Ritchie, 1972). Additional variables associated with these methods can be found in [Parameters 3] (Figure 12) and [Parameters 4] (Figure 13). The Hargreaves PET equation exponent is particularly influential in its effect on evapotranspiration (Wang et al., 2006). Fertilization Like irrigation, fertilization may be applied in two ways: Automatic – Specifications of automatic fertilization may be input by selecting the [Auto Fertilization] button in the Subarea Edit Window (Figure 18); Manual – Fertilization is applied as a field operation with depth and date applied input in the Subarea Edit Window in the Operations section (Figure 18) by selecting an ID from the ACCESS Fertilizer table. Fertilizer may be applied in many different forms such as: Poultry manure; Cattle manure; Mineral phosphorus Anhydrous ammonia; Mineral nitrogen; N-P-K 28-10-10. Carbon, nitrogen, phosphorus and other nutrients enable the crop to grow. Rate of crop growth is dependent upon nutrient availability, chemical form and application method. Initial soil nutrient levels should be input in the ACCESS Soils table (Appendix 1, Table 6). The model performs chemical and biochemical reactions that affect the nutrient bioavailability as well as nutrients runoff and infiltration. Carbon dynamics and level of soil organic carbon are simulated throughout a model run. Nitrification and denitrification dynamics are estimated by the model as well as nitrogen forms such as ammonium, nitrate, nitrite and labile and nonlabile forms of organic nitrogen. Phosphorus chemistry is also determined by the model to estimate inorganic and organic forms utilized by the crop and leaving the field in runoff and percolation. The user can manipulate nutrient chemistry and budgets by altering numerous variables found in [Header 2] (Figure 6), [Header 3] (Figure 7), [Header 4] (Figure 8) and [Header 5] (Figure 9), as well as Interactive APEX (i_APEX) USERS GUIDE /29 [Parameter 1] (Figure 10), [Parameter 3] (Figure 12), [Parameter 4] (Figure 13), [Parameter 5] (Figure 14) and [Parameter 6] (Figure 15). Runoff Curve Number greatly influences the partitioning of nitrogen and phosphorus between runoff (soluble and associated with detritus and sediment losses) and subsurface flow. Pesticides Application of pesticides may result in losses in runoff, percolation (including subsurface lateral flow) and absorbed to sediment particles. Pesticides and their properties are found in the Pesticides ACCESS table. Formatting for this table is shown in Appendix 1, Table 12. Pesticides may be applied by any method desired that have a populated record in the ACCESS Operations table (e.g., spraying, incorporation and knifing). Incorporation and knifing can be indicated in the Operations table by providing a depth in millimeters to the variable labeled “Tillage Depth”. Pesticide properties and application method affect pesticide losses as does application timing and are all indicated in the subarea operations (Figure 18). Greater water runoff will enable increased pesticide runoff (soluble and associated with sediment) and is inversely proportional to soluble pesticide infiltration. Pesticides with a Koc > 5000 will have little or no infiltration when there is significant organic matter present except through macropores, cracks and holes. An APEX variable that impacts pesticide losses is the Pesticide Leaching Ratio in the [Parameters 4] window (Figure 13) which affects partitioning of the pesticide runoff to leaching ratio. The Pesticide Leaching Ratio is typically set at 0.1 unless more specific information is available. Another APEX variable that affects losses, the Pesticide Loss Coefficient in the i_APEX [Parameters 6] Window (Figure 15), represents the fraction of porosity that interacts with a pesticide as it leaches through the soil layer (typically set at 0.1 unless more field specific information is available). Pesticide drift losses during application can be estimated by the user by providing an application fraction to the variable, Harvest Pesticide Efficiency Ratio (Appendix 1, Table 13). When performing modeling studies, the USEPA assumes a default value of 5% drift and 95% reaching soil and plant surfaces (Harvest Pesticide Efficiency Ratio = 0.95). Pesticide applications have a “Code” variable value of 7, unless the application is by chemigation in which case the “Code” would be 8. Subareas The subarea edit window can be shown by double clicking on a subarea number entry in the Subarea list box (Figure 18). It is used to edit variables found in the Subareas and Management tables of the database. Variable fields in the upper left quadrant include subarea size, conservation practice (also known as P factor which indicates direction of tilling and cropping relative to field slope), slope (decimal fraction), slope length (distance in meters of subarea slope), feeding area (if pasture land being used by livestock) and manure type (manure application option as Non Manure Application Area, Liquid Manure Application Area or Solid Manure Application Area. In the lower left quadrant of this window, are six buttons that describe aspects of the subarea being addressed including: [Miscellaneous] - various subarea variables that don’t fit in with the other seven categories; [Grazing] – number of animals and grazing limit for up to ten herds; [Channel] – characteristics of channel (see routing); [Routing Reach] – characteristics of routing reach (see routing); [Reservoir] – design characteristics of reservoir (all zeroes if no reservoir); [Auto Fertilization] – variables for the automatic application of fertilizer; 30/ Interactive APEX (i_APEX) USERS GUIDE [Lagoon] – variables describing lagoon characteristics; [Auto Irrigation] – variables for automatic irrigation. Figure 18: Subarea Edit Window Note: None of the edit changes are written to the database until another control record is selected from the control record list. Subareas: Routing APEX allows up to four contiguous homogenous land use units or subareas. Each subarea represents a landuse partitioning and runs off to the watershed channel (stream). Ultimately, subsurface lateral return flow combines with runoff at the watershed outlet. A complete set of input variables must be independently populated for each subarea including Field operations (Subarea edit window, Figure 18). Buffers may be simulated by treating them as floodplains. Floodplain modeling enables run-on of runoff from the upslope subarea that borders on the floodplain. Water and associated nutrients, pesticides and sediment are drained onto the buffer (floodplain) soil surface. Channel length (CHL) ([Channel] window in the Subarea window, Figure 18), Channel length of routing reach (RCHL) ([Routing Reach] window in the Subarea window, Figure 18) and Watershed area (WSA) (WSA = Drainage area for each Subarea; Figure18) must be specified in order to lay out the routing schema for the watershed. Extreme areas in a watershed (furthest from the watershed outlet), should make CHL = RCHL. A CHL > RCHL indicates to the model that it is a downstream subarea. A negative watershed area (-WSA) indicates that the area of the subarea is added to another subarea(s) before reaching the downstream subarea. Figure 19 shows routing for a watershed with four subareas from Steglich and Williams (2008): Subarea 1 (extreme area, cotton peanut rotation); WSA = 50 ha; Subarea 2 (extreme area, Pasture); WSA = - 45 ha; Subarea 3 (downstream area, Corn-soy rotation); WSA = 70 ha; Subarea 4 (downstream area); WSA = 30 ha. CHL = RCHL Interactive APEX (i_APEX) USERS GUIDE /31 Extreme area (headwaters); CHL = distance from subarea outlet to farthest point in subarea. The distance is equal to the RCHL if the length of the routing reach is the same as the CHL length. As shown in the diagram, an extreme subarea drains to the headwaters of the water reach. Therefore, a true routing reach has not yet been established in these subareas. In subarea 3, a routing reach has been defined since water moves through the subarea from the upper end of the subarea (point at which water from the upstream subarea(s) enter the subarea) to the subarea outlet. CHL > RCHL In subarea 3, the distance from subarea outlet to the farthest point in the subarea is greater than the routing reach length through the subarea. –WSA A negative watershed area (WSA) causes summation of subarea areas. In Figure 19, subarea 2 is added to subarea 1 before being routed through 3). Figure 19: Example of Watershed and APEX Routing Method Subareas: Floodplains and Filter Strips Floodplains and filter strips must be set up as a routing subarea that routes runoff from the upslope subarea to the floodplain or filter strip. If the Subarea is a filter strip (buffer), the Filter Strip variable should be checked off in the [Channel] window located in the Subarea edit window (Figure 18). The Filter Strip Flow Fraction in the [Channel] window must be input that determined the partitioning of flow through the filter strip or floodplain. Typical values for the Filter Strip Flow Fraction are in the range from 0.87 to 0.98 (Wang, personal communication, January, 2013). Other physical values that characterize the filter strip or floodplain are located in the [Channel] window. The Floodplain Saturated Conductivity and Floodplain Width in Header 32/ Interactive APEX (i_APEX) USERS GUIDE 4, Figure 8, can be adjusted to determine the extent of filtration that occurs in the filter strip or floodplain. Subarea Field Operations The Field operations edit window is located in the lower right section of the Subarea window. This area has three buttons, [Change Operation], [Add Operation] and [Delete Operation] and a list box below of the operations. Field operations are the “drivers” of APEX modeling that includes all aspects of field management: Conservation Practices; Tillage; Planting; Fertilization; Chemical Applications (e.g., liming and ammonium); Pesticide application; Irrigation; Harvest; Killing the Crop; Cover Crop. All subareas where a crop is grown must have a planting record, a harvest record and a kill record to end the crop. A crop will continue to grow even after harvest, mowing and being turned under if a “Kill” record is not used to end the crop. Pasture land of course does need to be killed. A field operation record consists of sixteen variable fields, nine integer fields followed by seven real fields called parameter fields. The first eight integer fields include ID, Subarea Id, Year, Month, Day, Type, Tractor, and Crop Id. The last integer field and the seven parameter fields change their definition depending on the type of the field operation indicated by the Type field (Figure 20). The Type field links to the entries in the ACCESS Operations table which contains the operation name among other variables. A set of field operations make up a crop rotation for each subarea within a run. The field operations within the rotation are ordered by date with the Year, Month, and Day. To edit an operation, click on the field operation in the list box and select [Change Operation]. To add a field operation, select [Add Operation] and to delete a field operation, click on the field operation in the list box and select [Delete Operation]. Adding or editing a field operation can be performed using the Subarea Field Operation Addition/Edit Change window (Figure 20). To edit an existing field operation record, click directly on the record to be changed in the Field operations window. The operation shown in Figure 20 is for planting. The field operation name will appear in the upper left section of the window after identifying the Type ID number from the ACCESS Field Operations table, identifying Year, Month and DAY, selecting [OK] (which saves a field operation and exits the window) followed by clicking on the new field operation to re-invoke the window. Other variables pertinent to the particular field operation may then be input. Selecting [Cancel] in the Subarea Edit Window cancels all previous field operation edits. Interactive APEX (i_APEX) USERS GUIDE /33 Figure 20: Subarea Field Operation Addition/Edit Calibration and Validation of APEX Using i_APEX Calibration and validation of APEX with measured data can significantly increase the accuracy of modeling results. Methods for performing model calibration and validation are described in the APEX manual (Steglich and Williams, 2008), APEX documentation (Williams et al., 2008) and the conservation modeling guidance report by Waidler et al. (2011). Calibration adjustments of i_APEX variables are typically based on time periods (days, months or years) that encompass several years of measured data. Variable adjustments are made until model results optimally correlate with measured results based on statistical performance. Adjustments of variables during the validation period are based on calibration results. Model calibrations and validations are most often performed by adjusting parameters that effect: Hydrology: Runoff Curve number CNIC and CN2; Irrigation partitioning; 34/ Interactive APEX (i_APEX) USERS GUIDE Evapotranspiration; Erosion and sedimentation: RUSLE C Factor; Soils: Soil water holding capacity parameters; Nutrients: Hydrology parameters; Application timing; Application method; Fertilizer type; Nitrogen and phosphorus chemical and biological dynamic variables; Pesticides: Hydrology parameters; Application timing; Application method; Pesticide properties; Pesticide loss coefficient; Pesticide Leaching Ratio; Crop yield and heat units: Simulated crop yields should be within 10% of measured yields (Steglich and Williams, 2008). Interactive APEX (i_APEX) USERS GUIDE /35 36/ Interactive APEX (i_APEX) USERS GUIDE References Baier, W. and G. W. Robertson. 1965. Estimation of latent evaporation from simple weather observations. Canadian J. Plant Sci. 45: 276‐284. Borah, D. K., G. Yagow, A. Saleh, P. L. Barnes, W. Rosenthal, E. C. Krug, and L. M. Hauck. 2006. Sediment and nutrient modeling for TMDL development and implementation. Trans. ASABE 49 (4): 967–986. Gassman, P. W., E. Osei, A. Saleh, and L. M. Hauck. 2002. Application of an environmental and economic modeling system for watershed assessments. J. American Water Resour. Assoc. 38(2): 423-438. Gassman P. W., J. R. Williams, V. W. Benson, R. C. Izaurralde, L. M. Hauck, C. A. Jones, J. D. Atwood, J. Kiniry, and J. D. Flowers. 2005. Historical development and applications of the EPIC and APEX models. Working Paper 05 WP-397. Center for Agricultural and Rural Development, Iowa State University, Ames, Iowa. Available at: http://www. Card. Iastate. Edu/publications/synopsis. Aspx?id=763. Gassman, P. W., J. R. Williams, X. Wang, A. Saleh, E. Osei, L. M. Hauck, R. C. Izaurralde, J. D. Flowers. 2010. The agricultural policy/environmental extender (APEX) model: an emerging tool for landscape and watershed environmental analyses. Trans. ASABE 53(3): 711-740. Hargreaves, G. H., and Z. A. Samani. 1985. Reference crop evapotranspiration from temperature. Applied Engr. Agric. 1: 96-99. Kellogg, R. L., et al. 2011. Assessment of the effects of conservation practices on cultivated cropland in the Chesapeake Bay Region. Released February, 2011. Conservation Effects Assessment Project. USDA, Natural Resources Conservation Service. Washington D. C. Website: http://www.nrcs.usda.gov/technical/nri/ceap/. Kellogg, R. L., et al. 2012a. Assessment of the Effects of Conservation Practices on Cultivated Cropland in the Ohio-Tennessee River Basin. Released February 09, 2012. Conservation Effects Assessment Project. USDA, Natural Resources Conservation Service. Washington D. C. Website: http://www.nrcs.usda.gov/technical/nri/ceap/. Kellogg, R. L., et al. 2012b. Assessment of the effects of conservation practices on cultivated cropland in the Upper Mississippi River Basin. Revised July, 2012. Conservation Effects Assessment Project. USDA, Natural Resources Conservation Service. Washington D. C. Website: http://www.nrcs.usda.gov/technical/nri/ceap/. Kellogg, R. L., et al. 2012c. Assessment of the Effects of Conservation Practices on Cultivated Cropland in the Missouri River Basin. Released August 30, 2012. Conservation Effects Assessment Project. USDA, Natural Resources Conservation Service. Washington D. C. Website: http://www.nrcs.usda.gov/technical/nri/ceap/. Monteith, J. L. 1965. Evaporation and environment. Symp. Soc. Exp. Biol. 19: 205‐234. Mudgal, A., C. Baffaut, S. H. Anderson, E. J. Sadler, and A. L. Thompson. 2010. APEX model assessment of variable landscapes on runoff and dissolved herbicides. Trans. ASABE 53(4): 1047-1058. Penman, H. L. 1948. Natural evaporation from open, bare soil and grass. Proc. Soc. London Ser. A193: 120-145. Plotkin, S., X. Wang, T. L. Potter, D. D. Bosch, J. R. Williams, E. S. Hesketh and J. K. Bagdon. 2013. APEX Calibration and Validation of Water and Herbicide Transport under Southern Atlantic Coastal Plain (USA) Conditions. Anticipated publication in: Trans.ASABE 56(1): Not yet available. Priestley, C. H. B. and R. J. Taylor. 1972. On the assessment of surface heat flux and evaporation using large-scale parameters. Mon. Weather Rev. 100: 81-92. Interactive APEX (i_APEX) USERS GUIDE /37 Ramanarayanan, Tharacad S., M. V. Padmanabhan, G. N. Gajanan, Jimmy Williams. 1998. “Comparison of simulated and observed runoff and soil loss on three small United States watersheds.” NATO ASI Series 1(55):76-88. Ramanarayanan, T. S., J. R. Williams, W. A. Dugas, L. M. Hauck, and A. M. S. McFarland. 1997. Using APEX to identify alternative practices for animal waste management. Presented at the ASAE International Meeting, Minneapolis, MN, August 10-14. Ritchie, J. T. 1972. Model for predicting evaporation from a row crop with incomplete cover. Water Resour. Res. 8(5): 1204‐1213. Saxton, K. E. and W. J. Rawls. 2006. Soil water characteristic estimates by texture and organic matter for hydrologic solutions. Soil Sci. Soc. Am. J. 70: 1569–1578. Steglich, E. M. and J.W. Williams. 2008. Agricultural Policy/Environmental eXtender Model User’s Manual. Version 0604. BREC Report # 2008-16. AgriLIFE Research, Blackland Research and Extension Center, 720 East Blackland Road, Temple, Texas. Steglich, E. M. and J.W. Williams. Draft 2011. Agricultural Policy/Environmental eXtender Model User’s Manual. Version 0806. BREC Report. AgriLIFE Research, Blackland Research and Extension Center, 720 East Blackland Road, Temple, Texas. Waidler, D., M. White, E. M. Steglich, X. Wang, J.W. Williams, C.A. Jones and R.Srinivasan. June, 2011. Conservation Practice Modeling Guide for SWAT and APEX. AgriLIFE Research & Extension, Texas A&M System. Texas Water Resources Institute Technical Report No. 399, Texas A&M University System, College Station, Texas. Wang, X. January 2013. Personal communication. AgriLIFE Research & Extension, Texas A&M System. Temple, Texas. Wang, X., P. W. Gassman, J. R. Williams, S. Potter, and A. R. Kemanian. 2008. Modeling the impacts of soil management practices on runoff, sediment yield, maize productivity, and soil organic carbon using APEX. Soil Tillage Res. 101: 78-88. Wang, X., S. R. Potter, J. R. Williams, J. D. Atwood, and T. Pitts. 2006. Sensitivity analysis of APEX for national assessment. Trans. ASABE 49(3): 679‐688. Williams, J. R. 1990. The erosion−productivity impact calculator (EPIC) model: A case history. Philosophical Trans.: BiologicalScience 329(1255): 421−428. Williams, J. R., W. L. Harman, M. Magre, U. Kizil, J. A. Lindley, G. Padmanabhan and E. Wang. 2006. APEX feedlot water quality simulation. Trans. ASABE 49(1): 61-73. Williams, J.W., R.C. Izauralde, and E.M. Steglich, 2008. Agricultural Policy/Environment eXtender Model Theoretical Documentation. Version 0604, BREC Report # 2008-17 Williams, J. R., E. Wang, A. Meinardus, W. L. Harman, M. Siemers, and J. D. Atwood. 2006. APEX users guide. V.2110. Temple, TX: Texas A&M University, Texas Agricultural Extension Service, Texas Agricultural Experiment Station, Blackland Research Center. Yin, L., X. Wang, J. Pan, and P. W. Gassman. 2009. Evaluation of APEX for daily runoff and sediment yield from three plots in the Upland Huaihe River watershed, China. Trans. ASABE 52(6):1833‐1845. 38/ Interactive APEX (i_APEX) USERS GUIDE Appendix A – ACCESS i_APEX Input Tables Table A.1: Control Records ID Description State FIPS County FIPS SWAT Subbasin NRIPTR PSU Point HUC MLRA Application Category Nutrient Rate Category Application Timing Number Subareas Weather Station Id Simulation Length Beginning Year Beginning Month Beginning Dat Printout Interval Print Code Weather Input Code Weather Random Cycles Weather Generator Stop Day Leap Year Considered Potential ET Stochastic Curve Number Peak Rate Estimate Soil Profile Automatic Heat Unit Scheduling Non Varying Curve Number Runoff Estimation Methodology Pesticide Mass and Concentration Daily Output to SWAT Enrichment Method Soluble P Runoff Approach NP Uptake Code Manure Application Code Lagoon Pump Trigger Manure Scrapping Interval Steepness Factor Code Long Integer Text Long Integer Long Integer Long Integer Long Integer Long Integer Integer Long Integer Text Integer Integer Integer Long Integer Long Integer Long Integer Long Integer Long Integer Long Integer Byte Byte Integer Byte Byte Integer Long Integer Long Integer Long Integer Long Integer Long Integer Integer Long Integer Integer Integer Integer Byte Integer Integer Long Integer Long Integer Integer None none none none none none none none none none none none none none none none none none none none none none none none none none none none none none none none none none none none none none none none none none none none none none none none none none none none none none none none nybr iyr imo ida idp ngn ign igsd lpyr iet iscn ityp ista ihus nvcn0 infl masp iswt iert ibp nupc mnul ipd mscp islf apexcont.dat apexcont.dat apexcont.dat apexcont.dat apexcont.dat apexcont.dat apexcont.dat apexcont.dat apexcont.dat apexcont.dat apexcont.dat apexcont.dat apexcont.dat apexcont.dat apexcont.dat apexcont.dat apexcont.dat apexcont.dat apexcont.dat apexcont.dat apexcont.dat apexcont.dat apexcont.dat apexcont.dat apexcont.dat apexcont.dat apexcont.dat iasite.dat apexcont.dat apexcont.dat apexcont.dat apexcont.dat apexcont.dat apexcont.dat apexcont.dat apexcont.dat apexcont.dat apexcont.dat apexcont.dat apexcont.dat apexcont.dat Interactive APEX (i_APEX) USERS GUIDE /39 Air Quality Analysis Flood Routing Atmospheric CO2 Code Field Capacity Method Subarea Print Code Peak Runoff Rainfall Nitrogen Concentration CO2 Concentration Irrigation NO3 Concentration Pest Damage Factor Grazing Limit Years Cultivation at Start Erosion Equation MUSI Parameter 1 MUSI Parameter 2 MUSI Parameter 3 MUSI Parameter 4 Manure Rate for P Uptake Manure Rate for N Uptake Channel Cap Flow Rate Exponent in Flow Rate Eq Ave Upland Slope Channel Bottom Width Floodplain Width Floodplain Saturated Conductivity Maximum Groundwater Storage Return Flow Days Return Flow Ratio Saturated Conductivity Adjustment Field Width Field Length Field Angle Power Parameter Soil Particle Diameter Wind Erosion Control Factor Rainfall Change E to W Rainfall Change S to N Flood Routing Time Routing Threshold Routing when Reach Storage Basin Channel Length Basin Channel Slope Atmospheric CO2 Table A.1 continued Integer none Integer none Integer none Integer none Integer none Single none Single none Single none Single none Single none Single none Single none Single none Single none Single none Single none Single none Single none Single none Single none Single none Single none Single none Single none Single none Single none Single none Single none Single none Single none Single none Single none Single none Single none Single none Single none Single none Single none Single none Single none Single none Single none Single none 40/ Interactive APEX (i_APEX) USERS GUIDE naq ihy ico2 isw isap apm rfnc co2 cqni pstx gzl0 rtn0 drv bus(1) bus(2) bus(3) bus(4) upr unr qg qcf chs0 bwd fcw fpsc gws0 rft0 rfp0 sat0 fw fl ang uxp diam acw bxct byct dthy qth stnd bchl bchs co2x apexcont.dat apexcont.dat apexcont.dat apexcont.dat apexcont.dat apexcont.dat apexcont.dat apexcont.dat apexcont.dat apexcont.dat apexcont.dat apexcont.dat apexcont.dat apexcont.dat apexcont.dat apexcont.dat apexcont.dat iasite.dat iasite.dat apexcont.dat apexcont.dat apexcont.dat apexcont.dat apexcont.dat apexcont.dat apexcont.dat apexcont.dat apexcont.dat apexcont.dat apexcont.dat apexcont.dat apexcont.dat apexcont.dat apexcont.dat apexcont.dat apexcont.dat apexcont.dat apexcont.dat apexcont.dat apexcont.dat iasite.dat iasite.dat iasite.dat Table A.1 continued Irrigation Water NO3 N in Rainfall Weather 1 Weather 2 Weather 3 Weather 4 Weather 5 Weather 6 Weather 7 Weather 8 Weather 9 Fraction of Area by Weather 1 Fraction of Area by Weather 2 Fraction of Area by Weather 3 Fraction of Area by Weather 4 Fraction of Area by Weather 5 Fraction of Area by Weather 6 Fraction of Area by Weather 7 Fraction of Area by Weather 8 Fraction of Area by Weather 9 Weather Input File Name Single Single Integer Integer Integer Integer Integer Integer Integer Integer Integer Single Single Single Single Single Single Single Single Single Single none none none none none none none none none none none none none none none none none none none none none cqnx rfnx impw(2) impw(3) impw(4) impw(5) impw(6) impw(7) impw(8) impw(9) impw(10) fwxp(1) fwxp(2) fwxp(3) fwxp(4) fwxp(5) fwxp(6) fwxp(7) fwxp(8) fwxp(9) fwth iasite.dat iasite.dat iasite.dat iasite.dat iasite.dat iasite.dat iasite.dat iasite.dat iasite.dat iasite.dat iasite.dat iasite.dat iasite.dat iasite.dat iasite.dat iasite.dat iasite.dat iasite.dat iasite.dat iasite.dat iasite.dat Table A.2: Livestock ID Owner Id Herd Id Number of Animals Fraction Herd in Feeding Area Grazing Rate Daily Manure Dump Manure Id Urine Volume Long Integer Long Integer Integer Integer Single Single Single Integer Single none none none none none kg/hd/d kg/hd/d none l/hd/d ncow ffed gzrt dump idmu vurn iasite.dat iasite.dat iasite.dat iasite.dat iasite.dat iasite.dat iasite.dat iasite.dat iasite.dat inps iops iow ii iapl nvcn iasub.dat iasub.dat iasub.dat iasub.dat iasub.dat iasub.dat iasub.dat iasub.dat Table A.3: Subarea ID Subarea Id Soil Id Operation Schedule Id Owner Id Feeding Area Manure App Area Curve Number Type Long Integer Long Integer Long Integer Lone Integer Long Integer Long Integer Long Integer Integer none none none none none none none none Interactive APEX (i_APEX) USERS GUIDE /41 Table A.3 continued Daily Weather Station Number Integer Point Source Number Integer Water Content of Snow Cover Single Standing Dead Crop Residue Single Subarea X Centroid Single Subarea Y Centroid Single Drainage Area Single Channel Length Single Channel Depth Single Manning N for Channel Single Slope Single Slope Length Single Manning N for Upland Single Filter Strip Flow Fraction Single RR Channel Length of Routing Single RR Routing Reach Channel Depth Single RR Bottom Width of Channel Single RR Top Width of Channel Single RR Slope Single RR Mannings N for Channel Single RR USLE C for Channel Single RR USLE K for Channel Single RR Floodplain Width Single RR Floodplain Length Single RS Surface Area at Emergency Single Spillway RS Volume at Emergency Single Spillway Elev RS Initital Volume Single RS Principle Spillway Release Rate Single RS Initial Sediment Concentration Single RS Normal Sediment Concentration Single RS Bottom Hydraulic Conductivity Single RS Time Required to Return to Single Normal Sediment Conc RS Bulk Density Single Land Use Number Integer Hydraulic Condition Integer Autoirrigation Number Long Integer *used to calculate curve number for plant operation 42/ Interactive APEX (i_APEX) USERS GUIDE none none mm t/ha none none ha km m none m/m m none none km m m m m/m none none none m km ha iwth ipts sno stdo xct yct wsa chl chd chn stp splg upn ffpq rchl rchd rcbw rctw rchs rchn rchc rchk rfpw rfpl rsae iasub.dat iasub.dat iasub.dat iasub.dat iasub.dat iasub.dat iasub.dat iasub.dat iasub.dat iasub.dat iasub.dat iasub.dat iasub.dat iasub.dat iasub.dat iasub.dat iasub.dat iasub.dat iasub.dat iasub.dat iasub.dat iasub.dat iasub.dat iasub.dat iasub.dat mm rsve iasub.dat mm mm/h ppm ppm mm/h days rsv rsrr rsys rsyn rshc rsdp iasub.dat iasub.dat iasub.dat iasub.dat iasub.dat iasub.dat t/m^3 none none none rsbd lun iasub.dat nnnn.ops nnnn.ops* iasub.dat iaua Table A.4: Management ID Subarea Id Irrigation Rigidity Irrigation Minimum Auto Irrigation Interval Minimum Auto Fertilizer Interval Liming Code Furrow Dike Code Drainage Code Lagoon Fertigation Code Feeding Area Manure Code Daily Manure Application Code Auto Commercial N Code Auto Solid Manure Code Irrigation Trigger Irrigation Runoff Ratio Maximum Annual Irrigation Volume Minimum Single Irrigation Volume Maximum Single Irrigation Volume Auto Fertilizer Trigger Fertilizer Auto Rate Depth Maximum Annual N Drainage End Stress Furrow Dike Safety Factor Conservation Practice Factor Lagoon Control Fraction Lagoon Volume Ratio Lagoon Input from Wash Lagoon Time from Max Liquid to Total Manure Ratio Auto Manure Application Rate Lagoon Safety Factor Herd 1 Id Herd 2 Id Herd 3 Id Herd 4 Id Herd 5 Id Herd 6 Id Herd 7 Id Herd 8 Id Long Integer Long Integer Integer Long Integer Long Integer Long Integer Long Integer Long Integer Long Integer Integer Integer Integer Integer Integer Single Single Single none none none none days days none none none none none none none none none Variable mm irr irr iri ifa lm ifd idr idf1 idf2 idf3 idf4 idf5 bir efi vimx iasub.dat iasub.dat iasub.dat iasub.dat iasub.dat iasub.dat nnnn.ops nnnn.ops* iasub.dat iasub.dat iasub.dat iasub.dat iasub.dat iasub.dat iasub.dat iasub.dat iasub.dat Single mm armn iasub.dat Single mm armx iasub.dat Single Single Single Single Single Single Single Single Single Single Single Single Single Integer Integer Integer Integer Integer Integer Integer Integer Variable Variable kg/ha days none none none none m^3/cow/dat days none kg/ha none none none none none none none none none bft fnp4 fmx drt fdsf pec dalg vglm coww ddlg solq fnp5 sflg ny(1) ny(2) ny(3) ny(4) ny(5) ny(6) ny(7) ny(8) iasub.dat iasub.dat iasub.dat iasub.dat iasub.dat iasub.dat iasub.dat iasub.dat iasub.dat iasub.dat iasub.dat iasub.dat iasub.dat iasub.dat iasub.dat iasub.dat iasub.dat iasub.dat iasub.dat iasub.dat iasub.dat Interactive APEX (i_APEX) USERS GUIDE /43 Table A.4 continued Herd 9 Id Herd 10 Id Grazing Limit for Herd 1 Grazing Limit for Herd 2 Grazing Limit for Herd 3 Grazing Limit for Herd 4 Grazing Limit for Herd 5 Grazing Limit for Herd 6 Grazing Limit for Herd 7 Grazing Limit for Herd 8 Grazing Limit for Herd 9 Grazing Limit for Herd 10 Integer Integer Single Single Single Single Single Single Single Single Single Single none none t/ha t/ha t/ha t/ha t/ha t/ha t/ha t/ha t/ha t/ha Long Integer Long Integer Long Integer Integer Integer Integer Long Integer Integer Integer Single Single Single Single Single Single Single none none none none none none none none none Variable Variable Variable Variable Variable Variable Variable ny(9) ny(10) xtp(1) xtp(2) xtp(3) xtp(4) xtp(5) xtp(6) xtp(7) xtp(8) xtp(9) xtp(10) iasub.dat iasub.dat iasub.dat iasub.dat iasub.dat iasub.dat iasub.dat iasub.dat iasub.dat iasub.dat iasub.dat iasub.dat jx(1) jx(2) jx(3) jx(4) jx(5) jx(6) jx(7) opv1 opv2 opv3 opv4 opv5 opv6 opv7 nnnn.ops nnnn.ops nnnn.ops nnnn.ops nnnn.ops nnnn.ops nnnn.ops nnnn.ops nnnn.ops nnnn.ops nnnn.ops nnnn.ops nnnn.ops nnnn.ops nnnn.ops nnnn.ops Table A.5: Field Operations ID Subarea Id Year Month Day Type Tractor Crop Id Int Variable Parameter 1 Parameter 2 Parameter 3 Parameter 4 Parameter 5 Parameter 6 Parameter 7 44/ Interactive APEX (i_APEX) USERS GUIDE Table A.6: Soils Soil Id Name Soils 5 Id Hydrologic Group Number of Layers Weathering Code Albedo Initial Water Content Minimum Water Table Depth Maximum Water Table Depth Initial Water Table Depth Subsurface Flow Travel Time Initial Groundwater Storage Maximum Groundwater Storage Return Flow Root Zone Maximum Layers Previous Years Cultivation Soil Group Type Minimum Thickness of Maximum Layer Minimum Profile Thickness Minimum Beginning Layer Thickness Fraction of Org C in Biomass Fraction of Humus in Passive Long Integer Text Text Single Integer Integer Single Single Single Single Single Single Single Single Single Single Single Single Single none none none none none none none none m m m days mm mm none years none m none afx none hsg none xids salb ffc wtmn wtmx wtbl rftt gwst gwmx rfpk tsla rtn1 xids zqt nnnn.sol nnnn.sol nnnn.sol nnnn.sol nnnn.sol nnnn.sol nnnn.sol nnnn.sol nnnn.sol nnnn.sol nnnn.sol nnnn.sol nnnn.sol nnnn.sol nnnn.sol nnnn.sol nnnn.sol nnnn.sol nnnn.sol Single Single m m zf ztk nnnn.sol nnnn.sol Single Single none none fbm fhp nnnn.sol nnnn.sol none none m t/m^3 none none none none m m m days mm mm none none z bd none xids salb ffc wtmn wtmx wtbl rftt gwst gwmx rfpk Table A.7: Soil Layers Soil Id Layer Number Layer Depth Bulk Density Wilting Point Field Capacity Albedo Initial Water Content Minimum Water Table Depth Maximum Water Table Depth Initial Water Table Depth Subsurface Flow Travel Time Initial Groundwater Storage Maximum Groundwater Storage Return Flow Root Zone Long Integer Integer Single Single Single Integer Single Single Single Single Single Single Single Single Single nnnn.sol nnnn.sol nnnn.sol nnnn.sol nnnn.sol nnnn.sol nnnn.sol nnnn.sol nnnn.sol nnnn.sol nnnn.sol nnnn.sol nnnn.sol nnnn.sol nnnn.sol Interactive APEX (i_APEX) USERS GUIDE /45 Table A.7 continued Maximum Layers Previous Years Cultivation Soil Group Type Minimum Thickness of Maximum Layer Minimum Profile Thickness Minimum Beginning Layer Thickness Fraction of Org C in Biomass Fraction of Humus in Passive Single Single Single Single none years none m tsla rtn1 xids zqt nnnn.sol nnnn.sol nnnn.sol nnnn.sol Single Single m m zf ztk nnnn.sol nnnn.sol Single Single none none fbm fhp nnnn.sol nnnn.sol Table A.8: Weather ID Name Latitude Longitude Elevation Years Max Month Records Wet Dry Probability Coefficient Rain Distribution Two Year 24 Hour Rainfall Long Integer Text Single Single Single Single Single Single Single none none degrees degrees m years none none mm xlat xlog elev ywi bta expk qg iaweath.dat iaweath.dat iaweath.dat iaweath.dat iaweath.dat iaweath.dat iaweath.dat iaweath.dat iaweath.dat Table A.9: Weather by Month ID Month Air Temperature Average Max Air Temperature Average Min Air Temperature Std Max Air Temperature Std Min Precipitation Average Precipitation Std Precipitation Skew Coefficient Probability Dry Wet Probability Wet Wet Rain Days Average Rain Half Max Solar Radiation Relative Humidity Average Velocity Wind Velocity N Wind Velocity NNE Long Integer Integer Single Single Single Single Single Single Single Single Single Single Single Single Single Single Single Single 46/ Interactive APEX (i_APEX) USERS GUIDE none none c c c c mm mm none none none days none mj/ly none m/s none none obmx obmn stmx stmn rmo rst(2) rst(3) prw(1) prw(2) uavm wi obsl rh uavm dir(1) dir(2) iaweath.dat iaweath.dat iaweath.dat iaweath.dat iaweath.dat iaweath.dat iaweath.dat iaweath.dat iaweath.dat iaweath.dat iaweath.dat iaweath.dat iaweath.dat iaweath.dat iaweath.dat iaweath.dat iaweath.dat iaweath.dat Table A.9 continued Wind Velocity NE Wind Velocity ENE Wind Velocity E Wind Velocity SE Wind Velocity ESE Wind Velocity SSE Wind Velocity S Wind Velocity SSW Wind Velocity SW Wind Velocity WSW Wind Velocity W Wind Velocity WNW Wind Velocity NW Wind Velocity NNW Single Single Single Single Single Single Single Single Single Single Single Single Single Single none none none none none none none none none none none none none none Long Integer Text Integer Single Single Single Single Single Single Single Single Single Single Single Single Single Single Single Single Single Single Single Single Single Single Single none none none none none c c none none none none none none none none none none m m ppm none none none none none $/kg dir(3) dir(4) dir(5) dir(6) dir(7) dir(8) dir(9) dir(10) dir(11) dir(12) dir(13) dir(14) dir(15) dir(16) iaweath.dat iaweath.dat iaweath.dat iaweath.dat iaweath.dat iaweath.dat iaweath.dat iaweath.dat iaweath.dat iaweath.dat iaweath.dat iaweath.dat iaweath.dat iaweath.dat cpnm idc wa hi tb tg dmla dlai dlap1 dlap2 rlad rbmd alt gsi caf sdw hmx rdmx wac2 cny cpy cky wsyf pst cosd iacrop.dat iacrop.dat iacrop.dat iacrop.dat iacrop.dat iacrop.dat iacrop.dat iacrop.dat iacrop.dat iacrop.dat iacrop.dat iacrop.dat iacrop.dat iacrop.dat iacrop.dat iacrop.dat iacrop.dat iacrop.dat iacrop.dat iacrop.dat iacrop.dat iacrop.dat iacrop.dat iacrop.dat iacrop.dat iacrop.dat Table A.10: Crops ID Name Category Biomass Energy Ratio Harvest Index Optimal Temperature Minimum Temperature Maximum Leaf Area Index Growing Season Leaf Decline Leaf Development First Point Leaf Development Second Point Leaf Area Decline Rate Biomass Energy Decline Rate Aluminum Tolerance Maximum Stomatal Conductance Critical Aeration Factor Seeding Rate Maximum Crop Height Maximum Root Depth CO2 Concentration Nitrogen in Yield Phosphorus in Yield Cky Minimum Harvest Index Pest Factor Seed Cost Interactive APEX (i_APEX) USERS GUIDE /47 Table A.10 continued Price for Yield Water in Yield Nitrogen Uptake Emergence Nitrogen Uptake Midseason Nitrogen Uptake Maturity Phosphorus Uptake Emergence Phosphorus Uptake Midseason Phosphorus Uptake Maturity Wind Erosion Factor Live Wind Erosion Factor Dead Wind Erosion Factor Flat Frost Damage First Point Frost Damage Second Point Vapor Pressure Deficit VPD Threshold VPD Root Weight Emergence Root Weight Maturity Germination Heat Units Price for Yield Forage Plant Population Point 1 Plant Population Point 2 Lignin at Half Maturity Lignin at Full Maturity Bk1 Bk2 Bk3 Stx1 Stx2 Wub Fto Flt Single Single Single Single Single Single Single Single Single Single Single Single Single Single Single Single Single Single Single Single Single Single Single Single Single Single Single Single Single Single Single Single $/t none none none none none none none none none none none none none none none none none none $/t none none none none none none none none none none none none Long Integer Text Single Single Single Single Single Single Single none none none none none none none none none pryg wcy bn1 bn2 bn3 bp1 bp2 bp3 bw1 bw2 bw3 frst1 frst2 vpth vpd1 vdp2 rwpc1 rwpc2 gmhu pryf smr1 smr2 blg1 blg2 bk1 bk2 bk3 stx1 stx2 wub fto flt iacrop.dat iacrop.dat iacrop.dat iacrop.dat iacrop.dat iacrop.dat iacrop.dat iacrop.dat iacrop.dat iacrop.dat iacrop.dat iacrop.dat iacrop.dat iacrop.dat iacrop.dat iacrop.dat iacrop.dat iacrop.dat iacrop.dat iacrop.dat iacrop.dat iacrop.dat iacrop.dat iacrop.dat iacrop.dat iacrop.dat iacrop.dat iacrop.dat iacrop.dat iacrop.dat iacrop.dat iacrop.dat ftnm fn fp fk fno fpo fnh3 foc iafert.dat iafert.dat iafert.dat iafert.dat iafert.dat iafert.dat iafert.dat iafert.dat iafert.dat Table A.11: Fertilizer ID Name Mineral Nitrogen Mineral Phosphorus Mineral Potassium Organic Nitrogen Organic Phosphorus Ammonium Nitrogen Organic Carbon 48/ Interactive APEX (i_APEX) USERS GUIDE Table A.12: Pesticide ID Name Solubility Half Life Soil Half Life Foliage Wash Off Fraction Organic Carbon Absorption Cost Long Integer Text Single Single Single Single Single Single none none none none none none none none pstn psol phls phlf pwof pkoc pcst iapest.dat iapest.dat iapest.dat iapest.dat iapest.dat iapest.dat iapest.dat iapest.dat Long Integer Text Integer Single Single Single Single Single Single Single Single Single Single Single Single Single Single Single Single Single Single Single Single Single Single Single Single Single Single Single Single none none none none None none none none none none none none none none none none none none none none none none none none none none none none none none none til ihc colt emx rr tld rht rin dkh dki he orhi frcp fpop pcd pric plst hry hrl pwr wdt spd rcl rc2 xlb fcm vrl vr2 efm rti iatill.dat iatill.dat iatill.dat iatill.dat iatill.dat iatill.dat iatill.dat iatill.dat iatill.dat iatill.dat iatill.dat iatill.dat iatill.dat iatill.dat iatill.dat iatill.dat iatill.dat iatill.dat iatill.dat iatill.dat iatill.dat iatill.dat iatill.dat iatill.dat iatill.dat iatill.dat iatill.dat iatill.dat iatill.dat iatill.dat iatill.dat Table A.13: Operations ID Name Code Cost Mixing Efficiency Surface Random Roughness Tillage Depth Ridge Height Ridge Interval Furrow Dike Height Furrow Dike Interval Harvest Pesticide Efficiency Ratio Override Harvest Index Fraction of Soil Compacted Fraction of Population Reduced Pcd Pric Plst Hry Hrl Pwr Wdt Spd Rc1 Rc2 Xlb Fcm Vr1 Vr2 Efm Rti Interactive APEX (i_APEX) USERS GUIDE /49 Table A.14: Miscellaneous Parameters (for APEX2110; see Appendix 3 for APEX0604 and APEX0806) ID S Curve 1 1 S Curve 1 2 S Curve 2 1 S Curve 2 2 S Curve 3 1 S Curve 3 2 S Curve 4 1 S Curve 4 2 S Curve 5 1 S Curve 5 2 S Curve 6 1 S Curve 6 2 S Curve 7 1 S Curve 7 2 S Curve 8 1 S Curve 8 2 S Curve 9 1 S Curve 9 2 S Curve 10 1 S Curve 10 2 S Curve 11 1 S Curve 11 2 S Curve 12 1 S Curve 12 2 S Curve 13 1 S Curve 13 2 S Curve 14 1 S Curve 14 2 S Curve 15 1 S Curve 15 2 S Curve 16 1 S Curve 16 2 S Curve 17 1 S Curve 17 2 S Curve 18 1 S Curve 18 2 S Curve 19 1 S Curve 19 2 S Curve 20 1 S Curve 20 2 S Curve 21 1 Long Integer Single Single Single Single Single Single Single Single Single Single Single Single Single Single Single Single Single Single Single Single Single Single Single Single Single Single Single Single Single Single Single Single Single Single Single Single Single Single Single Single Single none none none none none none none none none none none none none none none none none none none none none none none none none none none none none none none none none none none none none none none none none none none Coarse fragment root growth 1 Coarse fragment root growth 2 Soil evaporation soil depth 1 Soil evaporation soil depth 2 Harvest index crop maturity 1 Harvest index crop maturity 2 Curve number soil water 1 Curve number soil water 2 Water table ground water storage 1 Water table ground water storage 2 Tillage Bulk Density 1 Tillage Bulk Density 2 Aeration Stress Soil Water 1 Aeration Stress Soil Water 2 N P plant stress 1 N P plant stress 2 Pest damage erature 1 Pest damage erature 2 Water stress harvest index 1 Water stress harvest index2 P use soil P concentration 1 P use soil P concentration 2 N volatilization soil depth 1 N volatilization soil depth 2 Wind erosion vegetative cover 1 Wind erosion vegetative cover 2 Soil temperature factor 1 Soil temperature factor 2 Snow melt from snow fall 1 Snow melt from snow fall 2 Soil cover soil erature 1 Soil cover soil erature 1 Water stress water content 1 Water stress water content 2 CN2 upland slope steepness 1 CN2 upland slope steepness 2 Feedlot dust moisture of filter 1 Feedlot dust moisture of filter 2 Soil oxygen content 1 Soil oxygen content 2 Distance in spatial rainfall generator 1 50/ Interactive APEX (i_APEX) USERS GUIDE iaparm.dat iaparm.dat iaparm.dat iaparm.dat iaparm.dat iaparm.dat iaparm.dat iaparm.dat iaparm.dat iaparm.dat iaparm.dat iaparm.dat iaparm.dat iaparm.dat iaparm.dat iaparm.dat iaparm.dat iaparm.dat iaparm.dat iaparm.dat iaparm.dat iaparm.dat iaparm.dat iaparm.dat iaparm.dat iaparm.dat iaparm.dat iaparm.dat iaparm.dat iaparm.dat iaparm.dat iaparm.dat iaparm.dat iaparm.dat iaparm.dat iaparm.dat iaparm.dat iaparm.dat iaparm.dat iaparm.dat iaparm.dat iaparm.dat Table A.14 continued S Curve 21 2 Single S Curve 22 1 Single S Curve 22 2 Single S Curve 23 1 Single S Curve 23 2 Single S Curve 24 1 Single S Curve 24 2 Single S Curve 25 1 Single S Curve 25 2 Single Parm1 Single Parm2 Single Parm3 Single Parm4 Single Parm5 Single Parm6 Single Parm7 Single Parm8 Single Parm9 Single Parm10 Single Parm11 Single Parm12 Single Parm13 Single Parm14 Single Parm15 Single Parm16 Single Parm17 Single Parm18 Single Parm19 Single Parm20 Single Parm21 Single Parm22 Single Parm23 Single Parm24 Single Parm25 Single Parm26 Single Parm27 Single Parm28 Single Parm29 Single Parm30 Single Parm31 Single Parm32 Single Parm33 Single Parm34 Single none none none none none none none none none none none none none none none none none none none none none none none none none none none none none none none none none none none none none none none none none none none Distance in spatial rainfall generator 2 Not used Not used ground cover standing live biomass 1 ground cover standing live biomass 2 Not used Not used Water content CN2 CN3 1 Water content CN2 CN3 2 Crop canopy Monteith PET Root growth soil strength Water stress harvest index Water storage N leaching Soil water lower limit Winter dormancy N fixation Soluble P adsorption coefficient Pest damage moisture Pest damage cover Seed germination Soil evaporation coefficient Wind erodibility coefficient Nitrate leaching ratio Runoff CN weighting factor CN retention parameter Soil evaporation plant cover Sediment routing exponent Sediment routing coefficient Runoff curve number initial Soluble C adsorption Not used Hargreaves PET equation coefficient Pesticide leaching ratio Not used Maturity at spring growth CEC effect on nitrification Not used Biological mixing efficiency Soluble P runoff exponent Maximum depth of mixing Organic P loss exponent Not used Hargreaves PET equation exponent iaparm.dat iaparm.dat iaparm.dat iaparm.dat iaparm.dat iaparm.dat iaparm.dat iaparm.dat iaparm.dat iaparm.dat iaparm.dat iaparm.dat iaparm.dat iaparm.dat iaparm.dat iaparm.dat iaparm.dat iaparm.dat iaparm.dat iaparm.dat iaparm.dat iaparm.dat iaparm.dat iaparm.dat iaparm.dat iaparm.dat iaparm.dat iaparm.dat iaparm.dat iaparm.dat iaparm.dat iaparm.dat iaparm.dat iaparm.dat iaparm.dat iaparm.dat iaparm.dat iaparm.dat iaparm.dat iaparm.dat iaparm.dat iaparm.dat iaparm.dat Interactive APEX (i_APEX) USERS GUIDE /51 Table A.14 continued Parm35 Single Parm36 Single Parm37 Single Parm38 Single Parm39 Single Parm40 Single Parm41 Single Parm42 Single Parm43 Single Parm44 Single Parm45 Single none none none none none none none none none none none Parm46 Parm47 Parm48 Parm49 Parm50 Parm51 Parm52 Parm53 Parm54 Parm55 Parm56 Parm57 Parm58 Parm59 Parm60 Parm61 Parm62 Parm63 Parm64 Parm65 Parm66 Parm67 Parm68 Parm69 Parm70 Parm71 Parm72 Parm73 Parm74 Parm75 Parm76 none none none none none none none none none none none none none none none none none none none none none none none none none none none none none none none Single Single Single Single Single Single Single Single Single Single Single Single Single Single Single Single Single Single Single Single Single Single Single Single Single Single Single Single Single Single Single Denitrification soil water Denitrification rate constant Not used Water stress weighting Ground water storage Root temperature stress SCS curve number coefficient Plow layer depth Not used Sediment routing travel time coefficient RUSLE C factor coefficient residue RUSLE C factor coefficient biomass Adjust climate stress factor Canopy rainfall interception Rainfall interception coefficient Water storage of residue coefficient Till effect on decay rate Oxygen coefficient microbial activity Routing N enrichment coefficient Routing N enrichment exponent Fraction destroyed by burn Routing P enrichment ratio coefficient Routing P enrichment ratio exponent P upward by evaporation Maximum grazing before rotation Soil water tension weighting Manure erosion equation coefficient Pesticide loss coefficient Dust distribution coefficient Not used Not used Dust distribution dispersion exponent Manure erosion exponent Adjust microbial activity function Microbial decay rate coefficient Manure erosion coefficient Volatilization nitrification coefficient Hydrograph development parameter Not used Furrow irrigation erosion coefficient Furrow irrigation sediment 52/ Interactive APEX (i_APEX) USERS GUIDE iaparm.dat iaparm.dat iaparm.dat iaparm.dat iaparm.dat iaparm.dat iaparm.dat iaparm.dat iaparm.dat iaparm.dat iaparm.dat iaparm.dat iaparm.dat iaparm.dat iaparm.dat iaparm.dat iaparm.dat iaparm.dat iaparm.dat iaparm.dat iaparm.dat iaparm.dat iaparm.dat iaparm.dat iaparm.dat iaparm.dat iaparm.dat iaparm.dat iaparm.dat iaparm.dat iaparm.dat iaparm.dat iaparm.dat iaparm.dat iaparm.dat iaparm.dat iaparm.dat iaparm.dat iaparm.dat iaparm.dat iaparm.dat iaparm.dat Table A.14 continued Parm77 Single Parm78 Single Parm79 Single Parm80 Single Parm81 Single Parm82 Single none none none none none none Parm83 Single none Parm84 Single none Parm85 Single none Parm86 Parm87 Parm88 Parm89 Parm90 Parm91 Parm92 Parm93 Parm94 Parm95 Parm96 Single Single Single Single Single Single Single Single Single Single Single none none none none none none none none none none none Runoff delay pest application Soil water delay tillage Standing dead fall rate coefficient Puddling saturated conductivity Technology coefficient Runoff CN rainfall intensity coefficient Regulates lateral hydrologic conductivity P flux between labile & active pool coef P flux between active & stable pool coef N upward by evaporation coefficient Not used Not used Not used Not used Cost 1 Cost 2 Cost 3 Cost 4 Cost 5 Not used iaparm.dat iaparm.dat iaparm.dat iaparm.dat iaparm.dat iaparm.dat iaparm.dat iaparm.dat iaparm.dat iaparm.dat iaparm.dat iaparm.dat iaparm.dat iaparm.dat iaparm.dat iaparm.dat iaparm.dat iaparm.dat iaparm.dat iaparm.dat Table A.15: Selected Variables Select Id Selected Variable Variable Definition Long Integer Text Text none none none none none none iaprnt.dat iaprnt.dat iaprnt.dat Interactive APEX (i_APEX) USERS GUIDE /53 54/ Interactive APEX (i_APEX) USERS GUIDE Appendix B – ACCESS I_APEX Output Tables Table B.1: Average Output Select Id Farm Id Subarea Area by Field Tmx Prcp Q Prk Yp Ssf Rssf Long Integer Long Integer Integer Single Single Single Single Single Single Single Single none none none ha mm mm mm mm kg/ha mm mm Yn Single kg/ha Qn Ssfn Single Single kg/ha kg/ha Prkn Single kg/ha Gmn Dn Dprk Nfix Single Single Single Single kg/ha kg/ha mm kg/ha Et Qp Single Single mm kg/ha Mnp Avol Nitr Single Single Single kg/ha kg/ha kg/ha Musl Single t/ha Fnmn Fnma Single Single kg/ha kg/ha Fno Single kg/ha Fpo Single kg/ha none none none Maximum Temperature Precipitation Runoff Percolation Phosphorus loss with sediment Subsurface flow Subsurface flow that returns to surface stream Organic nitrogen loss with sediment NO3 loss in runoff Mineral nitrogen loss in subsurface flow Mineral nitrogen loss in percolate Gross nitrogen mineralized Nitrogen loss by denitification Deep percolation Nitrogen fixed by leguminous crops Evapotransporation Soluble phosphorus loss in runoff Phosphorus mineralized NH3 nitrogen volatilization Nitrification NH3 conversion to NO3 Soil loss from water erosion using modified MUSLE equation Fertilizer application of nitrate Fertilizer application of anhydrous ammonia Fertilizer application of organic nitrogen Fertilizer application of organic phosphorus apex.OUT apex.OUT apex.OUT apex.OUT apex.OUT apex.OUT apex.OUT apex.OUT apex.OUT apex.OUT apex.OUT apex.OUT apex.OUT apex.OUT apex.OUT apex.OUT apex.OUT apex.OUT apex.OUT apex.OUT apex.OUT apex.OUT apex.OUT apex.OUT apex.OUT apex.OUT apex.OUT apex.OUT apex.OUT Interactive APEX (i_APEX) USERS GUIDE /55 Table B.1 continued Fpl Soil Depth Soil Water Soil Bd Soil Sand Soil Clay Soil Ph Selected Variable 1 Selected Variable 2 Selected Variable 3 Selected Variable 4 Selected Variable 5 Selected Variable 6 Selected Variable 7 Selected Variable 8 Selected Variable 9 Selected Variable 10 Number Crops Crop 1 Id Crop 1 Yield Crop 1 Biomass Crop 1 Yln Crop 1 Ylp Crop 1 Fn Crop 1 Fp Crop 1 Water Stress Crop 1 Nitrogen Stress Crop 1 Phosphorus Stress Crop 1 Temperature Stress Crop 1 Curve Number Crop 2 Id Crop 2 Yield Crop 2 Biomass Crop 2 Yln Crop 2 Ylp Crop 2 Fn Crop 2 Fp Crop 2 Water Stress Single kg/ha Single Single Single Single Single Single Single Single Single Single Single Single Single Single Single Single Integer Text Single Single Single Single Single Single Single Single m none t/m^3 % % none various various various various various various various various various various none none t/ha t/ha kg/ha kg/ha t/ha t/ha days days Single days apex.OUT Single days apex.OUT Single none apex.OUT Text Single Single Single Single Single Single Single none t/ha t/ha kg/ha kg/ha t/ha t/ha days apex.OUT apex.OUT apex.OUT apex.OUT apex.OUT apex.SUS apex.SUS apex.OUT 56/ Interactive APEX (i_APEX) USERS GUIDE Fertilizer applied labile phosphorus Nitrogen in crop yield Phosphorus in crop yield Nitrogen applied Phosphorus applied Nitrogen in crop yield Phosphorus in crop yield Nitrogen applied Phosphorus applied apex.OUT apex.OUT apex.OUT apex.OUT apex.OUT apex.OUT apex.OUT apex.OUT apex.OUT apex.OUT apex.OUT apex.OUT apex.OUT apex.OUT apex.OUT apex.OUT apex.OUT apex.OUT apex.OUT apex.OUT apex.OUT apex.OUT apex.OUT apex.SUS apex.SUS apex.OUT apex.OUT Table B.1 continued Crop 2 Nitrogen Stress Crop 2 Phosphorus Stress Crop 2 Temperature Stress Crop 2 Curve Number Crop 3 Id Crop 3 Yield Crop 3 Biomass Crop 3 Yln Crop 3 Ylp Crop 3 Fn Crop 3 Fp Crop 3 Water Stress Crop 3 Nitrogen Stress Crop 3 Phosphorus Stress Crop 3 Temperature Stress Crop 3 Curve Number Crop 4 Id Crop 4 Yield Crop 4 Biomass Crop 4 Yln Crop 4 Ylp Crop 4 Fn Crop 4 Fp Crop 4 Water Stress Crop 4 Nitrogen Stress Crop 4 Phosphorus Stress Crop 4 Temperature Stress Crop 4 Curve Number Crop 5 Id Crop 5 Yield Crop 5 Biomass Crop 5 Yln Single days apex.OUT Single days apex.OUT Single days apex.OUT Single none apex.OUT Text Single Single Single Single Single Single Single Single none t/ha t/ha kg/ha kg/ha t/ha t/ha days days apex.OUT apex.OUT apex.OUT apex.OUT apex.OUT apex.SUS apex.SUS apex.OUT apex.OUT Single days apex.OUT Single days apex.OUT Single none apex.OUT Text Single Single Single Single Single Single Single Single none t/ha t/ha kg/ha kg/ha t/ha t/ha days days apex.OUT apex.OUT apex.OUT apex.OUT apex.OUT apex.SUS apex.SUS apex.OUT apex.OUT Single days apex.OUT Single days apex.OUT Single none apex.OUT Text Single Single Single none t/ha t/ha kg/ha apex.OUT apex.OUT apex.OUT apex.OUT Nitrogen in crop yield Phosphorus in crop yield Nitrogen applied Phosphorus applied Nitrogen in crop yield Phosphorus in crop yield Nitrogen applied Phosphorus applied Nitrogen in crop yield Interactive APEX (i_APEX) USERS GUIDE /57 Table B.1 continued Crop 5 Ylp Crop 5 Fn Crop 5 Fp Crop 5 Water Stress Crop 5 Nitrogen Stress Crop 5 Phosphorus Stress Crop 5 Temperature Stress Crop 5 Curve Number Single Single Single Single Single kg/ha t/ha t/ha days days Phosphorus in crop yield Nitrogen applied Phosphorus applied apex.OUT apex.SUS apex.SUS apex.OUT apex.OUT Single days apex.OUT Single days apex.OUT Single none apex.OUT Table B.2: Yearly Output Select Id Farm Id Yearly Subarea Area by Field Tmx Prcp Q Prk Yp Ssf Rssf Long Integer Long Integer Integer Integer Single Single Single Single Single Single Single Single none none none none ha c mm mm mm kg/ha mm mm Yn Single kg/ha Qn Ssfn Single Single kg/ha kg/ha Prkn Gmn Dn Dprk Nfix Single Single Single Single Single kg/ha kg/ha kg/ha mm kg/ha Et Qp Mnp Avol Single Single Single Single mm kg/ha kg/ha kg/ha none none none none Maximum Temperature Precipitation Runoff Percolation Phosphorus loss with sediment Subsurface flow Subsurface flow that returns to surface stream Organic nitrogen loss with sediment NO3 loss in runoff Mineral nitrogen loss in subsurface flow Mineral nitrogen loss in percolate Gross nitrogen mineralized Nitrogen loss by denitification Deep percolation Nitrogen fixed by leguminous crops Evapotransporation Soluble phosphorus loss in runoff Phosphorus mineralized NH3 nitrogen volatilization 58/ Interactive APEX (i_APEX) USERS GUIDE apex.OUT apex.OUT apex.OUT apex.OUT apex.OUT apex.OUT apex.OUT apex.OUT apex.OUT apex.OUT apex.OUT apex.OUT apex.OUT apex.OUT apex.OUT apex.OUT apex.OUT apex.OUT apex.OUT apex.OUT apex.OUT apex.OUT apex.OUT apex.OUT Table B.2 continued Nitr Single kg/ha Musl Single t/ha Fnmn Fnma Single Single kg/ha kg/ha Fno Single kg/ha Fpo Single kg/ha Fpl Single kg/ha Soil Depth Soil Water Soil Bd Soil Sand Soil Clay Soil Ph Selected Variable 1 Selected Variable 2 Selected Variable 3 Selected Variable 4 Selected Variable 5 Selected Variable 6 Selected Variable 7 Selected Variable 8 Selected Variable 9 Selected Variable 10 Number Crops Crop 1 Id Crop 1 Yield Crop 1 Biomass Crop 1 Yln Crop 1 Ylp Crop 1 Fn Crop 1 Fp Crop 1 Water Stress Crop 1 Nitrogen Stress Crop 1 Phosphorus Stress Crop 1 Temperature Stress Single Single Single Single Single Single Single Single Single Single Single Single Single Single Single Single Integer Text Single Single Single Single Single Single Single Single Single m none t/m^3 % % none various various various various various various various various various various none none t/ha t/ha kg/ha kg/ha t/ha t/ha days days days Single days Nitrification NH3 conversion to NO3 Soil loss from water erosion using modified MUSLE equation Fertilizer application of nitrate Fertilizer application of anhydrous ammonia Fertilizer application of organic nitrogen Fertilizer application of organic phosphorus Fertilizer applied labile phosphorus Nitrogen in crop yield Phosphorus in crop yield Nitrogen applied Phosphorus applied apex.OUT apex.OUT apex.OUT apex.OUT apex.OUT apex.OUT apex.OUT apex.OUT apex.OUT apex.OUT apex.OUT apex.OUT apex.OUT apex.OUT apex.OUT apex.OUT apex.OUT apex.OUT apex.OUT apex.OUT apex.OUT apex.OUT apex.OUT apex.OUT apex.OUT apex.OUT apex.OUT apex.OUT apex.OUT apex.SUS apex.SUS apex.OUT apex.OUT apex.OUT apex.OUT Interactive APEX (i_APEX) USERS GUIDE /59 Table B.2 continued Crop 1 Curve Number Crop 2 Id Crop 2 Yield Crop 2 Biomass Crop 2 Yln Crop 2 Ylp Crop 2 Fn Crop 2 Fp Crop 2 Water Stress Crop 2 Nitrogen Stress Crop 2 Phosphorus Stress Crop 2 Temperature Stress Crop 2 Curve Number Crop 3 Id Crop 3 Yield Crop 3 Biomass Crop 3 Yln Crop 3 Ylp Crop 3 Fn Crop 3 Fp Crop 3 Water Stress Crop 3 Nitrogen Stress Crop 3 Phosphorus Stress Crop 3 Temperature Stress Crop 3 Curve Number Crop 4 Id Crop 4 Yield Crop 4 Biomass Crop 4 Yln Crop 4 Ylp Crop 4 Fn Crop 4 Fp Crop 4 Water Stress Single none apex.OUT Text Single Single Single Single Single Single Single Single none t/ha t/ha kg/ha kg/ha t/ha t/ha days days apex.OUT apex.OUT apex.OUT apex.OUT apex.OUT apex.SUS apex.SUS apex.OUT apex.OUT Single days apex.OUT Single days apex.OUT Single none apex.OUT Text Single Single Single Single Single Single Single Single none t/ha t/ha kg/ha kg/ha t/ha t/ha days days apex.OUT apex.OUT apex.OUT apex.OUT apex.OUT apex.SUS apex.SUS apex.OUT apex.OUT Single days apex.OUT Single days apex.OUT Single none apex.OUT Text Single Single Single Single Single Single Single none t/ha t/ha kg/ha kg/ha t/ha t/ha days apex.OUT apex.OUT apex.OUT apex.OUT apex.OUT apex.SUS apex.SUS apex.OUT 60/ Interactive APEX (i_APEX) USERS GUIDE Nitrogen in crop yield Phosphorus in crop yield Nitrogen applied Phosphorus applied Nitrogen in crop yield Phosphorus in crop yield Nitrogen applied Phosphorus applied Nitrogen in crop yield Phosphorus in crop yield Nitrogen applied Phosphorus applied Table B.2 continued Crop 4 Nitrogen Stress Crop 4 Phosphorus Stress Crop 4 Temperature Stress Crop 4 Curve Number Crop 5 Id Crop 5 Yield Crop 5 Biomass Crop 5 Yln Crop 5 Ylp Crop 5 Fn Crop 5 Fp Crop 5 Water Stress Crop 5 Nitrogen Stress Crop 5 Phosphorus Stress Crop 5 Temperature Stress Crop 5 Curve Number Single days apex.OUT Single days apex.OUT Single days apex.OUT Single none apex.OUT Text Single Single Single Single Single Single Single none t/ha t/ha kg/ha kg/ha t/ha t/ha days apex.OUT apex.OUT apex.OUT apex.OUT apex.OUT apex.SUS apex.SUS apex.OUT Single days apex.OUT Single days apex.OUT Single days apex.OUT Single none apex.OUT Nitrogen in crop yield Phosphorus in crop yield Nitrogen applied Phosphorus applied Interactive APEX (i_APEX) USERS GUIDE /61 Table B.3: Crop Yield Output ID Subarea Id Year Crop Name Grain Yield Forage Yield Biomass Nitrogen Applied Phosphorus Applied Nitrogen Stress Water Stress Long Integer Integer Integer Text Single Single Single Single Single Single Single none none none none t/ha t/ha t/ha kg/ha kg/ha days days none none none none none none none fn fp none none apex.ACY apex.ACY apex.ACY apex.ACY apex.ACY apex.ACY apex.ACY apex.ACY apex.ACY apex.ACY apex.ACY none none none mm t/ha kg/ha kg/ha kg/ha kg/ha none none none none q y yn yp qn qp none none none apex.MSW apex.MSW apex.MSW apex.MSW apex.MSW apex.MSW apex.MSW apex.MSW apex.MSW apex.MSW apex.MSW apex.MSW none none none mm t/ha none none none q y apex.ACN apex.ACN apex.ACN apex.ACN apex.ACN apex.ACN apex.ACN apex.ACN apex.ACN apex.ACN apex.ACN apex.ACN apex.ACN apex.ACN Table B.4: Monthly SWAT Output ID Year Month Runoff Sediment N in Sediment P in Sediment N in Runoff P in Runoff Pesticide Name Qpst Ypst Long Integer Integer Integer Single Single Single Single Single Single Text Single Single Table B.5: Organic C and N Output ID Subarea Id Year Total Organic N Total Organic C Organic N Layer 1 Organic N Layer 2 Organic N Layer 3 Organic N Layer 4 Organic N Layer 5 Organic N Layer 6 Organic N Layer 7 Organic N Layer 8 Organic N Layer 9 Long Integer Integer Integer Single Single Single Single Single Single Single Single Single Single Single 62/ Interactive APEX (i_APEX) USERS GUIDE Table B.5 continued Organic N Layer 10 Organic C Layer 1 Organic C Layer 2 Organic C Layer 3 Organic C Layer 4 Organic C Layer 5 Organic C Layer 6 Organic C Layer 7 Organic C Layer 8 Organic C Layer 9 Organic C Layer 10 Single Single Single Single Single Single Single Single Single Single Single apex.ACN apex.ACN apex.ACN apex.ACN apex.ACN apex.ACN apex.ACN apex.ACN apex.ACN apex.ACN apex.ACN Table B.6: Watershed Output ID Year Month Prcp Qss Qsw Qts Qtw Ys Yw Yns Ynw Yps Ypw Qns Qnw Qps Qpw Ymus Ymuw Long Integer Integer Integer Single Single Single Single Single Single Single Single Single Single Single Single Single Single Single Single Single none none none mm none none none apex.OUT apex.OUT apex.OUT apex.OUT apex.OUT apex.OUT apex.OUT apex.OUT apex.OUT apex.OUT apex.OUT apex.OUT apex.OUT apex.OUT apex.OUT apex.OUT apex.OUT apex.OUT apex.OUT apex.OUT Interactive APEX (i_APEX) USERS GUIDE /63 Appendix C - APEX0604 and APEX0806 Miscellaneous Parameter Table Definitions THIS FILE CONTAINS DEFINITIONS OF S-CURVE AND MISCELLANEOUS PARAMETERS USED IN APEX0604 20090630 S-CURVE PARAMETERS AN S SHAPED CURVE IS USED TO DESCRIBE THE BEHAVIOR OF MANY PROCESSES IN APEX. THE Y AXIS IS SCALED FROM 0-1 TO EXPRESS THE EFFECT OF A RANGE IN THE X AXIS VARIABLE ON THE PROCESS BEING SIMULATED. THECURVE MAY BE DESCRIBED ADEQUATELY BY TWO POINTS CONTAINED IN THIS FILE. IT IS CONVENIENT TO REPRESENT THE X AND Y COORDINATES OF THE TWO POINTS WITH TWO NUMBERS CONTAINED IN THIS FILE. THE NUMBERS ARE SPLIT BY APEX(THE X VALUE IS LEFT OF THE DECIMAL AND THE Y VALUE IS RIGHT OF THE DECIMAL). THE TWO POINTS ARE CONTAINED IN AN ARRAY CALLED SCRP. TO ILLUSTRATE THE PROCEDURE CONSIDER THE TWO SCRP VALUES IN THE FIRST LINE OF THE PARM1310.DAT FILE(90.05,99.95). SCRP(1,1)=90.05 , SCRP(1,2)=99.95. WHEN SPLIT WE HAVE X1=90. Y1=0.05; X2=99. Y2=0.95. APEX USES THESE TWO POINTS TO SOLVE THE EXPONENTIAL EQ FOR TWO PARAMETERS THAT GUARANTEE THE CURVE ORIGINATES AT ZERO, PASSES THROUGH THE TWO GIVEN POINTS, AND Y APPROACHES 1.0 AS X INCREASES BEYOND THE SECOND POINT. THE FORM OF THE EQ IS Y=X/(X+EXP(B1-B2*X)) WHERE B1 AND B2 ARE THE APEX DETERMINED PARAMETERS. ----S-CURVE PARAMETER DEFINITIONS----SCRP(1,N) = EXPRESSES THE EFFECT OF SOIL COURSE FRAGMENT CONTENT ON PLANT ROOT GROWTH RESTRICTION. X = % COURSE FRAGMENT. (N=1,2) SCRP(2,N) = GOVERNS SOIL EVAPORATION AS A FUNCTION OF SOIL DEPTH. X = SOIL DEPTH (MM) SCRP(3,N) = DRIVES HARVEST INDEX DEVELOPMENT AS A FUNCTION OF CROP MATURITY. X = % OF GROWING SEASON. SCRP(4,N) = NRCS RUNOFF CURVE NUMBER SOIL WATER RELATIONSHIP. EXCEPTION TO NORMAL S-CURVE PROCEDURE--SOIL WATER FRACTIONS TAKEN FROM SCRP(25,N) TO MATCH WITH CN2 AND CN3(AVERAGE AND WET CONDITION RUNOFF CURVE NUMBERS). SCRP(5,N) = ESTIMATES SOIL COVER FACTOR USED IN SIMULATING SOIL TEMPERATURE. X = TOTAL ABOVE GROUND PLANT MATERIAL DEAD AND LIVE. SCRP(6,N) = SETTLES AFTER TILLAGE SOIL BULK DENSITY TO NORMAL VALUE AS A FUNCTION OF RAINFALL AMOUNT, SOIL TEXTURE, AND SOIL DEPTH. X = RAINFALL(MM) ADJUSTED FOR SOIL TEXTURE AND DEPTH. 64/ Interactive APEX (i_APEX) USERS GUIDE SCRP(7,N) = DETERMINES THE ROOT GROWTH AERATION STRESS FACTOR AS A FUNCTION OF SOIL WATER CONTENT AND THE CRITICAL AERATION FACTOR FOR THE CROP. X = SOIL WATER-CRITICAL AERATION FACTOR. SCRP(8,N) = DETERMINES THE PLANT STRESS CAUSED BY N OR P DEFICIENCY. X = % OF OPTIMAL N OR P CONTENT PRESENT IN PLANT. SCRP(9,N) = CALCULATES THE PEST DAMAGE FACTOR AS A FUNCTION OF TEMPERATURE, CONSIDERING THRESHOLDS FOR 30-DAY RAINFALL AND ABOVE GROUND PLANT MATERIAL. X = SUM OF DAILY MINIMUM TEMPERATURE WITH RAINFALL ADJUSTMENT. SCRP(10,N)= CALCULATES THE EFFECT OF WATER STRESS ON HARVEST INDEX AS A FUNCTION OF PLANT WATER USE. X = PLANT WATER USE DURING CRITICAL PERIOD. SCRP(11,N)= GOVERNS P USE BY PLANTS AS A FUNCTION OF SOIL P CONCENTRATION. X = SOIL LABILE P CONCENTRATION. SCRP(12,N)= GOVERNS N VOLATILIZATION AS A FUNCTION OF SOIL DEPTH. X = DEPTH AT THE CENTER OF A SOIL LAYER(MM). SCRP(13,N)= CALCULATES WIND EROSION VEGETATIVE COVER FACTOR AS A FUNCTION OF ABOVE GROUND PLANT MATERIAL. X = VEGETATIVE EQUIVALENT(C1*BIOM+C2*STD+C3*RSD). WHERE C1, C2, AND C3 ARE COEFFICIENTS, BIOM IS ABOVE GROUND BIOMASS, STD IS STANDING DEAD PLANT RESIDUE, AND RSD IS FLAT RESIDUE. SCRP(14,N)= CALCULATES SOIL TEMPERATURE FACTOR USED IN REGULATING MICROBIAL PROCESSES. X = SOIL TEMPERATURE(C). SCRP(15,N)= ESTIMATES PLANT POPULATION EFFECT ON USLE C FACTOR. X = PLANT POPULATION (P/M^2) SCRP(16,N)= INCREASES SNOW MELT AS A FUNCTION OF TIME SINCE THE LAST SNOWFALL. X = TIME SINCE THE LAST SNOWFALL(D) SCRP(17,N)= COMPONENT OF THE PLANT WATER STRESS FACTOR BASED ON SOIL WATER CONTENT. X = RATIO OF ROOT ZONE SOIL WATER CONTENT TO PLANT AVAILABLE WATER STORAGE VOLUME. SCRP(18,N)= ADJUSTS CN2 AS A FUNCTION OF UPLAND SLOPE STEEPNESS. X = UPLAND SLOPE (%). SCRP(19,N)= REGULATES FEEDLOT DUST EMISSION BASED ON MOISTURE CONTENT OF LITTER. X = WATER IN LITTER/WEIGHT OF LITTER. SCRP(20,N)= SIMULATES OXYGEN CONTENT OF SOIL AS A FUNCTION OF DEPTH.USED IN MICROBIAL PROCESSES OF RESIDUE DECAY. X = DEPTH TO CENTER OF EACH SOIL LAYER(M) Interactive APEX (i_APEX) USERS GUIDE /65 SCRP(21,N)= DISTANCE FACTOR IN SPATIAL RAINFALL GENERATOR. X = DISTANCE FROM STORM CENTER TO SUBAREA CENTROID(KM). SCRP(22,N)= GOVERNS PLANT WATER STRESS AS A FUNCTION OF SOIL WATER TENSION. X = GRAVIMETRIC + OSMOTIC TENSION. SCRP(23,N)= ESTIMATES PLANT GROUND COVER AS A FUNCTION OF LAI. X = TOTAL LAI OF ALL GROWING PLANTS. SCRP(24,N)= ESTIMATES PLANT GROUND COVER AS A FUNCTION OF STANDING LIVE BIOMASS. X = STANDING LIVE BIOMASS(T/HA). SCRP(25,N)= SIMULATES O2 CONTENT OF SOIL AS A FUNCTION OF C AND CLAY. USED IN MICROBIAL PROCESSES OF RESIDUE DECAY. X = F(C/CLAY) SCRP(30,N)= EXCEPTION TO NORMAL S-CURVE PROCEDURE--SETS SOIL WATER CONTENTS COINCIDING WITH CN2 AND CN3. X1 = SOIL WATER CONTENT AS % OF FIELD CAPACITY - WILTING POINT; X2 = SOIL WATER CONTENT AS % OF POROSITY - FIELD CAPACITY. -----MISCELLANEOUS PARAMETERS----PRMT(1) = CROP CANOPY-PET(1_2) FACTOR USED TO ADJUST CROP CANOPY RESISTANCE IN THE PENMAN-MONTEITH PET EQ. PRMT(2) = ROOT GROWTH-SOIL STRENGTH(1_2) NORMALLY 1.15<PRMT(2)<1.2. SET TO 1.5 TO MINIMIZE SOIL STRENGTH CONSTRAINT ON ROOT GROWTH. PRMT(2)>2. ELIMINATES ALL ROOT GROWTH STRESS. PRMT(3) = WATER STRESS-HARVEST INDEX(0_1) SETS FRACTION OF GROWING SEASON WHEN WATER STRESS STARTS REDUCING HARVEST INDEX. PRMT(4) = WATER STORAGE-N LEACHING(0_1) FRACTION OF SOIL POROSITY THAT INTERACTS WITH PERCOLATING WATER AS N LEACHING OCCURS. PRMT(5) = SOIL WATER LOWER LIMIT(0_1) LOWER LIMIT OF WATER CONTENT IN THE TOP 0.5 M SOIL DEPTH EXPRESSED AS A FRACTION OF THE WILTING POINT WATER CONTENT. PRMT(6) = WINTER DORMANCY(H)(0_1) CAUSES DORMANCY IN WINTER GROWN CROPS. GROWTH DOES NOT OCCUR WHEN DAY LENGTH IS LESS THAN ANNUAL MINIMUM DAY LENGTH + PRMT(6). PRMT(7) = N FIXATION(0_1) AT 1. FIXATION IS LIMITED BY SOIL WATER OR NITRATE CONTENT OR BY CROP GROWTH STAGE. At 0 FIXATION MEETS CROP N UPTAKE DEMAND. A COMBINATION OF THE 2 FIXATION ESTIMATES IS OBTAINED BY SETTING 0 < PRMT(7)< 1. PRMT(8) = SOLUBLE P ADSORPTION COEF(.1*M^3/T)(10_20) P CONCENTRATION IN SEDIMENT DIVIDED BY THAT OF THE WATER. 66/ Interactive APEX (i_APEX) USERS GUIDE PRMT(9) = PEST DAMAGE MOISTURE THRESHOLD(MM)(25_150) PREVIOUS 30-DAY RAINFALL MINUS RUNOFF. PRMT(10) = PEST DAMAGE COVER THRESHOLD(T/HA)(1_10) CROP RESIDUE + ABOVE GROUND BIOMASS. PRMT(11) = MOISTURE REQUIRED FOR SEED GERMINATION(MM)(10_30) SOIL WATER STORED MINUS WILTING POINT STORAGE IN THE PLOW DEPTH (PMX = PRMT(43). PRMT(12) = SOIL EVAPORATION COEF(1.5_2.5) GOVERNS RATE OF SOIL EVAPORATION FROM TOP 0.2 M OF SOIL. PRMT(13) = WIND ERODIBILITY COEF(0_3) ADJUSTS WIND SOIL ERODIBILITY FACTOR DOWNWARD AS LOOSE MATERIAL IS ERODED. PRMT(14) = NITRATE LEACHING RATIO(0.1_1) NITRATE CONCENTRATION IN SURFACE RUNOFF TO NITRATE CONCENTRATION IN PERCOLATE. PRMT(15) = RUNOFF CN RESIDUE ADJUSTMENT PARAMETER(0.0_0.3) INCREASES RUNOFF FOR RSD<1.0 T/HA; DECREASES FOR RSD>1.0 PRMT(16) = EXPANDS CN RETENTION PARAMETER(1.0_1.5) VALUES > 1.0 EXPAND CN RETENTION PARAMETER AND REDUCE RUNOFF. PRMT(17) = SOIL EVAPORATION-PLANT COVER FACTOR(0.0_0.5) REDUCES EFFECT OF PLANT COVER AS RELATED TO LAI IN REGULATING SOIL EVAPORATION. PRMT(18) = SEDIMENT ROUTING EXPONENT(1_1.5) EXPONENT OF WATER VELOCITY FUNCTION FOR ESTIMATING POTENTIAL SEDIMENT CONCENTRATION. PRMT(19) = SEDIMENT ROUTING COEF(T/M^3)(0.01_0.05) POTENTIAL SEDIMENT CONC WHEN FLOW VELOCITY = 1. M/S. PRMT(20) = RUNOFF CURVE NUMBER INITIAL ABSTRACTION(0.05_0.4) PRMT(21) = SOLUBLE C ADSORPTION COEF(.1*M^3/T)(10_20) C CONCENTRATION IN SEDIMENT DIVIDED BY THAT IN WATER. PRMT(22) = REDUCES NRCS RUNOFF CN RETENTION PARM FOR FROZEN SOIL. FRACTION OF S FROZEN SOIL(0.05_0.5) PRMT(23) = HARGREAVES PET EQ COEF(0.0023_0.0032) ORIGINAL VALUE = 0.0023. PRMT(24) = PESTICIDE LEACHING RATIO(0.1_1) PESTICIDE CONCENTRATION IN SURFACE RUNOFF TO PESTICIDE CONCENTRATION IN PERCOLATE. PRMT(25) = RAINFALL INTENSITY ADJUSTMENT FOR CN(0.O_2.0) SCN=SCN*EXP(PRMT(25)*(.2-AL5)) Interactive APEX (i_APEX) USERS GUIDE /67 PRMT(26) = FRACTION OF MATURITY AT SPRING GROWTH INITIATION(0_1) ALLOWS FALL GROWING CROPS TO RESET HEAT UNIT INDEX TO A VALUE GREATER THAN 0 WHEN PASSING THROUGH THE MINIMUM TEMP MONTH. PRMT(27) = CEC EFFECT ON NITRIFICATION & VOLATILIZATION(0_1) SETS LOWER LIMIT OF CEC CORRECTION FACTOR IN NIT/VOL FUNCTION. AT 0 CEC SHOULD PREVENT NIT/VOL PROCESS. AT 1 CEC HAS NO EFFECT ON NIT/VOL. PRMT(28) = UPPER LIMIT OF N FIXATION(KG/HA) (0.1_20.) PRMT(29) = BIOLOGICAL MIXING EFFICIENCY(0.1_0.5) SIMULATES MIXING IN TOP SOIL BY EARTH WORMS ETC. PRMT(31) SETS DEPTH. PRMT(30) = SOLUBLE P RUNOFF EXPONENT(1_1.5) PROVIDES NONLINEAR EFFECT FOR SOLUBLE P/RUNOFF EQ. PRMT(31) = MAXIMUM DEPTH FOR BIOLOGICAL MIXING(M)(0.1_0.3) PRMT(32) = ORGANIC P LOSS EXPONENT(1_1.2) PROVIDES NONLINEAR EFFECT FOR ORGANIC P LOSS EQ. PRMT(33) = COEFFICIENT IN MUST EQ(2.0_3.0) ORIGINAL VALUE = 2.5. PRMT(34) = HARGREAVES PET EQ EXP(0.5_0.6) ORIGINAL VALUE=0.5. MODIFIED TO 0.6 TO INCREASE PET. PRMT(35) = DENITRIFICATION SOIL-WATER THRESHOLD(.9_1.1) FRACTION OF FIELD CAPACITY SOIL WATER STORAGE TO TRIGGER DENITRIFICATION. PRMT(36) = UPPER LIMIT OF DAILY DENITRIFICATION RATE(0.0001_0.5) MAXIMUM FRACTION OF NO3 IN A SOIL LAYER SUBJECT TO DENITRIFICATION. PRMT(37) = EXPONENT IN DELIVERY RATIO FOR SWAT OUTPUT(0.1_0.6) TRANSFORMS APEX SMALL WATERSHED SEDIMENT YIELD TO 8 DIGIT BASIN SEDIMENT YIELD FOR SWAT INPUT. NORMALLY 0.5—LOWER VALUES INCREASE SEDIMENT YIELD TO SWAT. PRMT(38) = WATER STRESS WEIGHTING COEF(0_1) AT 0 PLANT WATER STRESS IS STRICTLY A FUNCTION OF SOIL WATER CONTENT; AT 1 PLANT WATER STRESS IS STRICTLY A FUNCTION OF ACTUAL ET DIVIDED BY POTENTIAL ET. 0<PRMT(38)<1 CONSIDERS BOTH APPROACHES. PRMT(39) = PUDDLING SATURATED CONDUCTIVITY(MM/H)(0.00001_0.1) SIMULATES PUDDLING IN RICE PADDYS BY SETTING SECOND SOIL LAYER SATURATED CONDUCTIVITY TO A LOW VALUE. PRMT(40) = GROUNDWATER STORAGE THRESHOLD(.001_1.) FRACTION OF GROUNDWATER STORAGE THAT INITIATES RETURN FLOW. 68/ Interactive APEX (i_APEX) USERS GUIDE PRMT(41) = PLANT ROOT TEMPERATURE STRESS EXP(.1_2.) EXP OF RATIO OF SOIL LAYER TEMP TO AVE OF PLANT OPTIMAL AND BASE TEMPS. PRMT(42) = SCS CURVE NUMBER INDEX COEF(.3_2.5) REGULATES THE EFFECT OF PET IN DRIVING THE SCS CURVE NUMBER RETENTION PARAMETER. PRMT(43) = PLOW LAYER DEPTH(M) USED TO TRACK SOLUBLE P CONCENTRATION OR WEIGHT, ORGANIC C, AND SOIL WATER CONTENT. PRMT(44) = UPPER LIMIT OF CURVE NUMBER RETENTION PARAMETER S(1._2.) SUL=PRMT(44)*S1 ALLOWS CN TO GO BELOW CN1. PRMT(45) = SEDIMENT ROUTING TRAVEL TIME COEF(.5_10.) BRINGS INFLOW SEDIMENT CONC TO TRANSPORT CAPACITY CONC AS A FUNCTION OF TRAVEL TIME AND MEAN PARTICLE SIZE. PRMT(46) = RUSLE C FACTOR COEF(.5_1.5) COEF IN EXPONENTIAL RESIDUE FUNCTION IN RESIDUE FACTOR. PRMT(47) = RUSLE C FACTOR COEF(.5_1.5) COEF IN EXPONENTIAL CROP HEIGHT FUNCTION IN BIOMASS FACTOR. PRMT(48) = ADJUSTS CLIMATIC STRESS FACTOR (AAP/AAT)/PRMT(48) (50_80) SET TO 0.0 GIVES CLF=1. PRMT(49) = MAXIMUM RAINFALL INTERCEPTION BY PLANT CANOPY(MM) (0.0_15.0) PRMT(50) = RAINFALL INTERCEPTION COEF(.05_.3) PRMT(51) = WATER STORAGE CAPACITY OF LITTER (RESIDUE) COEF (.1_.9) FRACTION OF LITTER WEIGHT. PRMT(52) = EXPONENTIAL COEF IN EQ EXPRESSING TILLAGE EFFECT ON RESIDUE DECAY RATE(5._15.) PRMT(53) = COEF IN OXYGEN EQ USED IN MODIFYING MICROBIAL ACTIVITY WITH SOIL DEPTH(0.8_0.95) PRMT(54) = N ENRICHMENT RATIO COEF FOR ROUTING (0.3_0.9) GLEAMS EQ ERTO=MIN(3.5,PRMT(54)/CIN**PRMT(55)) PRMT(55) = N ENRICHMENT RATIO EXP FOR ROUTING (.1_.3) GLEAMS EQ PRMT(56) = FRACTION DESTROYED BY BURN OPERATION (.5_1.) PRMT(57) = P ENRICHMENT RATIO COEF FOR ROUTING (.05_.2) GLEAMS EQ ERTP=PRMT(57)/(CY+1.E-4)**PRMT(58) PRMT(58) = P ENRICHMENT RATIO EXP FOR ROUTING (0.3_0.9) GLEAMS EQ Interactive APEX (i_APEX) USERS GUIDE /69 PRMT(59) = P UPWARD MOVEMENT BY EVAPORATION COEF (1_20) PRMT(60) = MAXIMUM NUMBER OF DAYS A PASTURE IS GRAZED BEFORE ROTATION (1-365) PRMT(61) = SOIL WATER UPWARD FLOW LIMIT(0.05_0.95) LIMITS WATER TENSION RATIO USED TO MOVE WATER FROM A LOWER LAYER TO THE ONE ABOVE IT X1=XX*MIN(PRMT(61),(T1-T2)/T1) PRMT(62) = MANURE EROSION EQ COEF(0.1_0.5) LARGER VALUES INCREASE MANURE EROSION. PRMT(63) = N ENRICHMENT RATIO FOR DELIVERY TO SWAT(0.8_1.2)ENRICHMENT RATIO FOR APPLICATION TO 8 DIGIT SEDIMENT YIELD SUPPLIED TO SWAT. PRMT(64) = DUST DISTRIBUTION COEF(0.5_1.5) AFFECTS DUST DISTRIBUTION AS A FUNCTION OF DOWNWIND TRAVEL TIME. PRMT(65) = RUSLE 2 TRANSPORT CAPACITY PARAMETER (0.001_0.1) REGULATES DEPOSITION AS A FUNCTION OF PARTICLE SIZE AND FLOW RATE. PRMT(66) = RUSLE 2 THRESHOLD TRANSPORT CAPACITY COEFFICIENT (1.0-10.0) ADJUSTS THRESHOLD (FLOW RATE * SLOPE STEEPNESS) PRMT(67) = DUST DISTRIBUTION DISPERSION EXPONENT(5.0_15.0) MODIFIES THE EFFECT OF THE ANGLE BETWEEN THE WIND DIRECTION AND THE CENTROID OF DOWNWIND SUBAREAS. PRMT(68) = MANURE EROSION EXPONENT(0.1_1.0) MODIFIES EQ BASED ON WEIGHT OF MANURE ON SOIL SURFACE. PRMT(69) = COEF ADJUSTS MICROBIAL ACTIVITY FUNCTION IN TOP SOIL LAYER (0.1_1.) PRMT(70) = MICROBIAL DECAY RATE COEF(0.5_1.5) ADJUSTS SOIL WATERTEMPERATURE-OXYGEN EQUATION. PRMT(71) = MANURE EROSION COEF(1.0_1.5) MODIFIES EROSION ESTIMATE BASED ON ABOVE GROUND PLANT MATERIAL. PLANT MATERIAL LIVE AND DEAD REDUCE MANURE EROSION. PRMT(72) = VOLATILIZATION/NITRIFICATION PARTITIONING COEF(0.05_0.5) FRACTION OF PROCESS ALOCATED TO VOLATILIZATION. PRMT(73) = HYDROGRAPH DEVELOPMENT PARAMETER(0.1_0.9) STORAGE DEPLETION ROUTING EXP USED TO ESTIMATE TRAVEL TIME OUTFLOW RELATIONSHIP. PRMT(74) = PARTITIONS N FLOW FROM GROUNDWATER (0.0_20.0) PRMT(74)=NCH/NCV. RSFN=RSSF*NCH; DPKN=DPRK*NCV. 70/ Interactive APEX (i_APEX) USERS GUIDE PRMT(75) = P ENRICHMENT RATIO FOR DELIVERY TO SWAT(0.05_1.5) ENRICHMENT RATIO FOR APPLICATION TO 8 DIGIT SEDIMENT YIELD SUPPLIED TO SWAT. PRMT(76) = STANDING DEAD FALL RATE COEF(0.0001_0.1) GOVERNS RATE OF STANDING DEAD CONVERSION TO FLAT RESIDUE. PRMT(77) = RAINFALL AMOUNT TO DELAY PEST PPLICATION(MM)(0.0_25.0) PESTICIDE IS NOT APPLIED ON DAYS WITH RAINFALL GREATER THAT PRMT(77). PRMT(78) = SOIL WATER VALUE TO DELAY TILLAGE(0.0_1.0) TILLAGE DELAYED WHEN PDSW/FCSW>PRMT(78). PRMT(79) = AUTO MOW LOWER LIMIT(T/HA)(0.2_3.) AUTO MOW DELAYED UNTIL ABOVE GROUND PLANT MATERIAL EXCEEDS PRMT(79). PRMT(80) = UPPER LIMIT OF NITRIFICATION-VOLATILIZATION(0.0_0.5) FRACTION OF NH3 PRESENT. PRMT(81) = TECHNOLOGY COEF(0.0_0.01) LINEAR ADJUSTMENT TO HARVEST INDEX--BASE YEAR=2000 PRMT(82) = NOT USED PRMT(83) = ESTIMATES DRAINAGE SYSTEM LATERAL HYDRAULIC CONDUCTIVITY (0.1_10.0). DRAINAGE HCL IS MAXIMUM OF PRMT(83)*VERTICAL SC AND APEX ESTIMATE CONSIDERING DRAINAGE TIME AND STORAGE. HCL(L,ISA)=MAX(PRMT(83)*SATC(L,ISA),(PO(L,ISA)S15(L,ISA))/(24.*DRT(ISA))) PRMT(84) = COEF REGULATING P FLUX BETWEEN LABILE AND ACTIVE POOL (0.0001_0.001) RMN=PRMT(84)*(WPML(ISL,ISA)-WPMA(ISL,ISA)*RTO) PRMT(85) = COEF REGULATING P FLUX BETWEEN ACTIVE AND STABLE POOL (0.0001_0.001) ROC=PRMT(85)*BK(ISL,ISA)*4.*WPMA(ISL,ISA)-WPMS(ISL,ISA) PRMT(86) = N UPWARD MOVEMENT BY EVAPORATION COEF (0.001_20) BASE VALUE=1.0. RELATED DIRECTLY TO UPWARD MOVEMENT. PRMT(87) = WATERTABLE RECESSION COEF (0.001_1.0) SMALL VALUES SLOW THE WATERTABLE RECESSION. PRMT(88) = LIMITS DAILY WATERTABLE MOVEMENT (0.001_1.0) FRACTION OF DIFFERENCE BETWEEN WTBL AND WTMN OR WTMX. PRMT(89) = WATERTABLE RECESSION EXPONENT (0.1_0.9) EXPONENT OF DAY OF YEAR/365 PRMT(90) = REGULATES LATERAL SUBSURFACE AND QUICK RETURN FLOW(0.1_10.) LARGE VALUES INCREASE FLOW. Interactive APEX (i_APEX) USERS GUIDE /71 PRMT(91) = REGULATES EVAPORATION FROM CHANNEL& FLOODPLAIN(0.001_1.) SMALL VALUES REDUCE CHANNEL & FLOODPLAIN EVAPORATION. PRMT(92) = RUNOFF VOLUME ADJUSTMENT FOR DIRECT LINK (NVCN=0) (0.1_2.0) INVERSELY RELATED TO RUNOFF. USED LIKE PRMT(42) IN CN INDEX METHOD (NVCN=4) PARM(93) to PARM(96) contain cost parameters 72/ Interactive APEX (i_APEX) USERS GUIDE