1
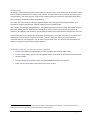
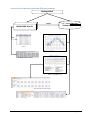
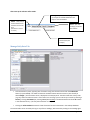
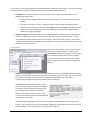
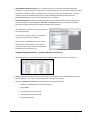
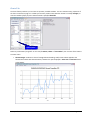
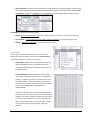
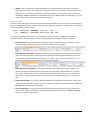
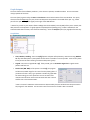
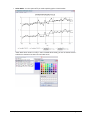
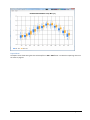
HEALTH AND ENVIRONMENT INTERNATIONAL TRUST
2 June 2012
Climate Data and Heat Exposure Software:
Hothaps-Soft v 1.0.2.4
User Manual
Background
2
What this software can do and output examples
2
An overview of the entry point and different pathways
3
Common Workflow Scenarios
A. Plot data you commonly use, i.e. data already in the database
B. Research arbitrary, new stations
C. New NOAA weather station data has become available (typically at the beginning of a new year)
4
4
4
4
Getting Started
Start-Up
5
5
Manage Daily Data Tab
Context Menu
6
7
Charts Tab
Context Menu
9
10
Graph Outputs
Graph Menu
Trend Lines Menu
Export Menu
12
12
15
15
Charts SD Tab
Graph Menu
Export Menu
16
17
18
Hothaps Software 1.0.2.4
User Manual ©2012
Page 1 of 18
Background
Identifying current and estimating future heat exposures, researchers can access weather station data from several
sources. Many are available free of charge on the Internet. The data comes in various formats, depending on the
collecting agency, and always involves a large number of steps converting raw data into meaningful values before
they are ready for evaluation, research and publishing.
One of the most comprehensive collections of global weather data is being held by the National Oceanic and
Atmospheric Administration (NOAA), and daily readings are freely available under
http://www7.ncdc.noaa.gov/CDO/dataproduct. This software application uses the “Surface data, Global Summary
Of the Day (GSOD)” data set. GSOD contains humidity data, which is essential for estimation of human heat
exposures. For validation and comparison grid cell data provided by the Climate Research Unit (CRU-3) is also used.
This manual walks you through the basic functionality of the software. It provides information on the menu items
and choices, as well as ways to customise the output. There are many permutations and combinations of
commands and uses of this application, not all of which can be shown here. Also, features and specifications are
subject to change as a matter of improving the software.1
What this software can do and output examples
•
Analyse the availability and data density of readily available routine weather station data
•
Produce customisable graphs, trends and statistical analysis of raw weather data as well as calculated heat
exposure indexes
•
Provide a comparison of weather station data (NOAA/GSOD) with CRU-3 grid cell data.
•
Extract any part of the data in numerical form for further analysis
1
Some screenshots used in this manual may show an earlier version number in the heading. In these cases there are no
significant differences in the functionality compared to the current version.
Hothaps Software 1.0.2.4
User Manual ©2012
Page 2 of 18
An overview of the entry point and different pathways
Hothaps-Soft
import
CRU Reference
Hothaps Database
NOAA/GSOD Data Set
find
List of weather
stations
Statistics
Breakdown of data availability
Graphs, trends, threshold
analyses and quality control
Numerical data for further analysis
Hothaps Software 1.0.2.4
User Manual ©2012
Page 3 of 18
Common Workflow Scenarios
A. Plot data you commonly use, i.e. data already in the database
1. Start software, go to Chart or Chart SD Tab, select station(s) and options, then produce a graph
(page 9).
2. Customise graph (page 12).
3. Export graph for printing or publishing (page 15).
4. Alternatively right-click on station(s) and export data for further processing in a spreadsheet,
database or other software (page 11).
B. Research arbitrary, new stations
1. Start software, select the Manage Daily Data Tab (page 6).
2. Try finding suitable stations by typing the name of city you are thinking of. Try different spellings,
try part of the name. (NOAA station names are not consistent, nor are the always in English. Some
stations are named after the name of an airport. There are several stations across the globe that
share the same name.)
3. Use country filtering if in doubt. NOAA, and therefore Hothaps-Soft, uses FIPS country codes
(http://en.wikipedia.org/wiki/FIPS_country_code).
4. If still unsure, look at the latitude/longitude readings. Use a map to verify. Try typing in the
desired coordinates. Use the Find Nearby feature (page 7).
5. When you have found a number of plausible stations, perform an analysis on the station data (page
7).
6. If one or more stations of interest have sufficient data for your purposes (only years with more
than 90% data completeness will be suitable for plotting and further processing), import them into
the Hothaps database (page 8).
7. Continue with workflow scenario A
C. New NOAA weather station data has become available (typically at the beginning of a new year)
1. Go to ftp://ftp.ncdc.noaa.gov/pub/data/gsod/ and locate the latest complete year folder (i.e. in
2012 you would be clicking on the 2011 folder). Locate and download the gsod_YYYY.tar file at the
bottom of the list (YYYY being the year in question). If you are sure that your NOAA data set
doesn’t have this file already, save/copy the file to the gsod folder that Hothaps is expecting (see
page 7).
2. Start (or re-start Hothaps-Soft), select the Manage Daily Data Tab (see page 6).
3. Click All in Database to display your current stations. Highlight, say, 10 stations at a time and rightclick Import NOAA and Calc Chart Avgs (page 8). This will add the new data to the database.
When all the progress-bars have disappeared (this will take a few moments), repeat this for the
next 10 stations, and so on, until you have updated all your stations. (In theory you could select all
stations and do it all at once. Some systems seem to become unstable, so it seems safer to do it
the described way.)
4.
Proceed with scenario A or B.
Hothaps Software 1.0.2.4
User Manual ©2012
Page 4 of 18
Getting Started
To open the software double-click on Start Hothaps-Soft icon
The display has 2 parts: The lists, buttons and clickable areas to the left, and a grey output panel to the right.
The output panel shows a log of
commands, results and the time it
has taken to execute the command.
You can copy and paste data from
the log area
Start-Up
The program will carry out a number of routine activities and checks at start-up. These include validating the status
of the Hothaps database, particularly whether WBGT and UTCI are included, and whether the NOAA/GSOD index
(more information about NOAA data below) is up to date. This should take only a few moments if your database is
up to date. In this case the output is shown in the output panel above.
If you moved the location of the program or the NOAA data files, you will get an error message that no NOAA files
could be found, or that it “Could not find part of the path”. In case of any error message relating to NOAA indexing
try changing the data path (see page 7 for details on changing the data path).
Any other error messages here usually indicate that the connection to the Hothaps database has not been
established. There are potentially numerous reasons for those errors, and if the problems persist you should
contact the developer for advice by providing a screenshot or copy of error message(s) and a brief explanation of
the circumstances (e.g. which operation system was used, whether it used to work at some earlier stage etc.).
Hothaps Software 1.0.2.4
User Manual ©2012
Page 5 of 18
After start-up the software offers 4 tabs:
Manage Daily Data (default display): where
you analyse the available NOAA data and
import it into the database
Station - rarely used, it
contains maintenance
functions not covered
here.
Charts – plot data
readings, trends and
heat indexes
(See Reference manual
for details)
Charts SD – show
statistics (box-plot
analysis)
Manage Daily Data Tab
•
To find a station by name, type any part of a station string into the text box and click the Find Station
button (or press ENTER). The table will show the available stations with that name or part thereof (as
above shangh…) and the station count is displayed in the output panel. The table shows the country code
(e.g. CH), station number and name. If the results list is too large you can narrow your search by selecting a
Country. Clicking Find Station (or pressing ENTER) with nothing in the Station Name box shows all stations
in the selected country. (This may take a moment or two.)
•
Clicking the All in Database button will show all stations for which data exists in the Hothaps database.
The station table can be sorted by clicking on any of the 3 headings, and reversed by clicking on the heading again.
Hothaps Software 1.0.2.4
User Manual ©2012
Page 6 of 18
Once a station is selected (highlighted) its Latitude & Longitude is displayed in the text boxes. You can override the
longitude/latitude by typing in a geographical location for use with the following function:
•
Find Nearby: This is where all stations in the vicinity are listed, using the specified distance from the
displayed longitude/latitude:
1. Enter a number to specify the distance to look for nearby stations. Choose the unit: km, miles or
degrees.
2. The search area may be a circle or a square around the currently displayed longitude/latitude.
Example: If 1 is entered in the number field and deg as the unit and Sq-Dist is selected, the search
area includes a field 1 degree north, east, south and west of the displayed longitude/latitude,
effectively a 2 degree grid-square.
•
Change Data Path: Tells the program where to find the NOAA data set. All NOAA data are expected to be
stored in a single folder, in the form of gsod_YYYY.tar files, with YYYY the year of the records. As new
annual data files become available copy them to this folder. At the start of the program, as well as after
changing the NOAA data path using this button, the program will scan the files and re-index any entries not
already in the Hothaps database.
Context Menu
Select one or more stations in the list (use Ctrl-Shift or
Shift-Click for multiple selections). You access the
context menu by right-clicking anywhere on the station
list. (The following section covers only the essential
menu items. Menu items in brackets are for special
uses like diagnostics and are covered in the Reference
Manual.)
•
Analyse: Clicking Analyse will analyse the Hothaps database as well as the raw NOAA data for the selected
station(s), producing two separate result sets shown in the output panel on the right. Each result set shows
the number of years with any data in them, the number of records found in each year and the
corresponding percentage of data density for those years, for example:
This SHANGHAI example shows that there are 20
years containing any data were found in the NOAA
set between the years displayed in Start Year and
End Year boxes at the bottom of the window.
Relative to 20 complete years (20 x 365 = 7.300
records) the 7133 records found represent 97% data
completeness in those years.
This is followed by a breakdown of the years containing data, showing the data density for each year in
brackets. The second set of results (“Analysing DB for SHANGHAI”) shows that there are no records in the
Hothaps database. This means the station has not yet been imported.
Hothaps Software 1.0.2.4
User Manual ©2012
Page 7 of 18
•
Import NOAA and Calc Chart Avgs: This is a common function, as it makes the weather station data
available for use in this program. Use this when you want to work with this station and the analysis (above)
shows either no records in DB, or the NOAA analysis shows more years than the DB analysis. The latter
normally means that new NOAA data has been made available (downloaded and copied into the
NOAA/GSOD folder) but has not yet been imported into the database.
•
Export Raw Daily Data: Creates one comma-delimited text file containing daily records for each station
selected, between the years displayed in Start Year and End Year boxes at the bottom of the window.
Note that only data imported into the Hothaps database will be exported.
After selecting this menu item the user is prompted
for the desired values:
You can select a single variable or any number of
values by using Ctrl-Click or Shift-Click.
Next, the user is prompted to select the location
(folder) for the generated file(s). The filenames
contain the station, years and the selected values,
followed by the csv extension, e.g.:
SHANGHAI-HONGQIAO 1980-2011 , Temp Max, WBGT(max), UTCI(max).csv
When imported into an Excel spreadsheet this will produce suitable column headers as shown here:
•
Delete: Deletes all daily data records and all monthly chart averages for the selected station(s) from the
Hothaps database. The number of records deleted is reported in the log panel.
•
Change the Start Year and End Year. The setting of Start and End Years affects:
•
Analysis of the NOAA data, but not the DB analysis.
•
Import NOAA
•
Calc Monthly Avgs for Charts only
•
Import NOAA and Calc Chart Avgs
•
Export Raw Daily Data
Hothaps Software 1.0.2.4
User Manual ©2012
Page 8 of 18
Charts Tab
The chart feature produces X, Y line charts in separate, resizable windows. You can customise many properties of
the chart as outlined on page 12. It allows you to either produce charts based on annual or monthly averages, or
chart the number of days per year a station exceeds a specified threshold.
“time modes”
Select any combination (using Shift- or Ctrl-click) of stations, values or ”time modes”, then click one of the buttons
to create charts.
•
Chart Averages: Produces a chart of averaged selected readings and/or heat indexes applied to the
selected time modes and selected stations, between the years displayed in Start Year and End Year boxes
at the bottom.
Hothaps Software 1.0.2.4
User Manual ©2012
Page 9 of 18
•
Chart Thresholds: Produces a chart of the number of days where the selected actual daily readings and/or
heat indexes exceed a threshold, applied to the selected time modes and selected stations, between Start
and End Year. You will be prompted to enter a threshold value in a dialog box after clicking this button:
Time modes will produce the following charts:
•
Annual: One averaged value per year for each reading and/or heat index (i.e. one data point per year)
•
Jan, Feb, Mar…: The averaged Jan or Feb or Mar… value for each year (i.e. one data point per year)
•
Monthly: Each month’s average, (i.e. one data points per month)
Context Menu
Click a single or any combination (using Ctrl- or Shift-click) of
values, time modes or stations, then access the context menu by
right-clicking anywhere in station list is as shown:
•
Analyse (Basic): Will show in the output panel how much
data is available for charting: Complete years, partial
years (giving percentage of completeness) and number of
years with no data.
•
Analyse (Detailed): (screenshot) Shows a matrix of how
many values (Tmax, Tmin, dew point etc.) are suitable for
charting. (“Suitable” are values for which there are more
than 90% readings.) The number shown is the count of
suitable values; there are a total of 7 possible values (Tmin,
Tmax, Tmean, DewPoint, Rain, WindSpeed and
WindSpeedMax.
Therefore a “7” means all 7 values have sufficient data for
this month/year. “0” means no value has a complete set of
readings. Any number in between means that some values
are missing. (E.g. temperatures are often recorded while
dew point and wind speeds are occasionally not. You will
have to plot the graphs to find out which values are
available.
Hothaps Software 1.0.2.4
User Manual ©2012
Page 10 of 18
•
(Delete): This will remove the calculated averages for the selected station(s), effectively removing the
ability to plot this station. The station will no longer show in the list. This function is for maintenance and
diagnostics only, as it leaves the raw data in the Hothaps database. If you want to remove a station from
the Hothaps database completely, use the Delete function in the Manage Daily Data Tab (page 8). (You can
at any stage re-import stations from the NOAA data source.)
Export Functions
The functions described below, calculate values from the Hothaps database and store the results in the clipboard in
a format (tab-delimited plaintext) ready for pasting into a document. The results have a header-row; all calculations
contain the following common columns:
Country
CH
Station (Type)
SHANG (Jul)
USAF-WBAN
583670-99999
Long
Lat
From
121.433 31.167 1980
To
2011
The columns are largely self-explanatory. A “completeness” column (“compl.”) is added at the end of each
calculated value to indicate the data density of the underlying data (for Average and Regression exports).
•
Export Average: This function calculates the average and for the selected values and outputs this along
with the standard deviation (SD), rate of completeness, stations and time modes:
•
Export Regression (Averages): Calculates the slope (a), offset/intersect (b) and standard error of the slope
(SE) for the selected station(s), and values, based on annual or monthly averages depending on the timemode selected. Slope and standard error are given in unit/year. “Unit” here is the obvious unit, i.e. °C in
most cases, mm/day and m/s for rainfall and wind speed respectively:
•
Export Regression (Thresholds): The program will prompt for a threshold value. It will calculate and
produce the slope (a), offset/intersect (b) and standard error (SE) for the selected station(s), values and
time-modes, relative to the number of days above the specified threshold. The output is comparable to
that shown for average regression above. The slope and errors are given in days/year, the intercept is in
days.
•
Export Slope Residuals: This sums the differences between the data values of the last 10, 8, 6 and 4 years
and the trend line/slope of the series. The trend is based on the total time period specified in the Start and
End Year boxes at the bottom of the window.
•
Export Avg Residuals: This sums the differences between the data values of the last 10, 8, 6 and 4 years
and the series’ average. The average is based on the total time period specified in the Start and End Year
boxes at the bottom of the window.
Hothaps Software 1.0.2.4
User Manual ©2012
Page 11 of 18
Graph Outputs
The chart feature of the software produces X, Y line charts in separate, resizable windows. You can customise
many properties of the chart:
The x-axis (time) is governed by the Start and End Years entered at the bottom of the main window. The yearly
divisions mark the beginning of a year; the annual data points are plotted in the middle of the year. E.g. a data
point for the year 2000 appears slightly to the right of the 2000 division.
* Note: If any month or year contains fewer readings than the threshold (currently 90%) of the year or month, that
data point will not be plotted. If a graph appears completely blank (heading only), no data is available for the
selected combination of values, time modes and station(s). Go to the Analysis option (see page 8) to find out why.
Graph Menu
•
Lines, Markers, Heading: These are on/off options and quite self-explanatory. Note that turning Markers
on may show data points in patchy data series that are not visible in Lines-only mode. Lines will only show
if they connect at least 2 existing consecutive data points (years).
•
Legend: You can turn legends on or off. If they are on, you can Customise Legend with regards to the
position and font size.
•
Fixed Y-Axis (NN - MM): If this option is turned off, the program
will derive a suitable range for the Y-axis from the plotting data. If
you want to fix the Y-axis (e.g. to produce a number of graphs with
the same scaling), turn this option on. You can set the Y-axis’s
maximum and minimum values and customise both axes’ interval
and font size in the window shown.
* Note. The X-axis’s maximum and minimum are determined by the Start and End Year values entered on
the program’s main window. You can set the axes’ font sizes even if Fixed Y-Axis is turned off.
Hothaps Software 1.0.2.4
User Manual ©2012
Page 12 of 18
•
Colour Mode: Turn this option off if you need to publish graphs in black & white.
*Note. With colour mode on or off (i.e. even in black & white mode), you can use the Set Colours…
submenu to customise the colours for each data series.
Hothaps Software 1.0.2.4
User Manual ©2012
Page 13 of 18
A customised graph using black &white as well as coloured elements would look like this:
•
CRU Reference: This option adds CRU reference data to the current graph. CRU (Crown Research Unit,
specifically CRU-3, which is used here) provides a validated set of selected values (Tmean, Tmax and dewpoint are currently supported by Hothaps-Soft) for all of the earth’s land-based locations in a 0.5 degree
global grid. When you enable this option, a dotted graph of the nearest CRU grid-square will be shown
alongside the original NOAA/GSOD plot:
Hothaps Software 1.0.2.4
User Manual ©2012
Page 14 of 18
Trend Lines Menu
You can turn on/off any of the
Linear, Logarithmic, Polynomial
and Last Decade (linear) trend
lines by ticking the corresponding menu item. For linear trends
slope and Standard Error are
shown in the legend. If CRU
reference graphs are turned on,
trend lines are shown for these
as well:
Export Menu
You can export charts as bitmap files in JPG or PNG format. While JPG is popular, the PNG format uses lossless
graphic file compression and is the preferred format for line graphs. The program will prompt for the location of
the files and remembers your preference. The file name is taken from the chart’s heading.
*Note. The resolution of exported graphic equals the current display size. So, if you resize the window the resulting
graphic file will also vary. If you need to export a uniform set of graphs for publication, either stick to the default
size of each chart window (i.e. do not resize windows) or maximise each chart window before exporting.
You can also export the chart’s underlying Numeric data. If you chose this option you will be prompted to select
the target folder. The comma-delimited text file contains all data points currently displayed. The file name is
derived from the chart title. For the example chart above (SHANGHAI/HONGQIAO, Tmax, with CRU and trend-lines
turned on) you would get the following output when opened in Excel:
Hothaps Software 1.0.2.4
User Manual ©2012
Page 15 of 18
Since the chart included 4 graphs, you get 4 sets of data rows. Note that linear trends only consist of 2 data points.
Charts SD Tab
This feature allows you to visualise the median, average and the distribution of the underlying data. You can
choose multiple station(s), value(s) to display (e.g. temperatures, heat indexes) and select or create time periods
for which to carry out the analysis:
time periods
In order to Add or Delete a time period, click the corresponding button. You can
edit a time period by double-clicking on it. You edit the time period (year range)
in this window:
After making your choices click the Chart Distributions button to produce a graphic like this:
Hothaps Software 1.0.2.4
User Manual ©2012
Page 16 of 18
This chart shows box-plots for the two chosen temperatures. The median is displayed as a dotted line, the box
showing the upper and lower quartile and the whiskers the 9th and 91st percentile.
Graph Menu
The Graph menu features Heading, Legend and Colour
Mode settings described on page 12ff. In addition you can
customise the percentiles and also turn on features like
Median, Average (mean) and Outliers. The chart below
shows mean, median plus outliers for Tmax for two
different time periods:
Hothaps Software 1.0.2.4
User Manual ©2012
Page 17 of 18
Export Menu
The Export menu allows saving the chart as bitmap files in JPG or PNG format. For details on exporting charts see
the notes on page 15.
Hothaps Software 1.0.2.4
User Manual ©2012
Page 18 of 18