1
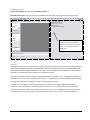
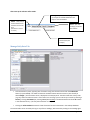
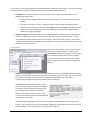
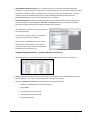
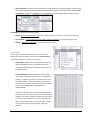
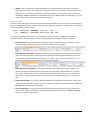
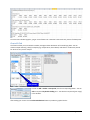
Once a station is selected (highlighted) its Latitude & Longitude is displayed in the text boxes. You can override the
longitude/latitude by typing in a geographical location for use with the following function:
•
Find Nearby: This is where all stations in the vicinity are listed, using the specified distance from the
displayed longitude/latitude:
1. Enter a number to specify the distance to look for nearby stations. Choose the unit: km, miles or
degrees.
2. The search area may be a circle or a square around the currently displayed longitude/latitude.
Example: If 1 is entered in the number field and deg as the unit and Sq-Dist is selected, the search
area includes a field 1 degree north, east, south and west of the displayed longitude/latitude,
effectively a 2 degree grid-square.
•
Change Data Path: Tells the program where to find the NOAA data set. All NOAA data are expected to be
stored in a single folder, in the form of gsod_YYYY.tar files, with YYYY the year of the records. As new
annual data files become available copy them to this folder. At the start of the program, as well as after
changing the NOAA data path using this button, the program will scan the files and re-index any entries not
already in the Hothaps database.
Context Menu
Select one or more stations in the list (use Ctrl-Shift or
Shift-Click for multiple selections). You access the
context menu by right-clicking anywhere on the station
list. (The following section covers only the essential
menu items. Menu items in brackets are for special
uses like diagnostics and are covered in the Reference
Manual.)
•
Analyse: Clicking Analyse will analyse the Hothaps database as well as the raw NOAA data for the selected
station(s), producing two separate result sets shown in the output panel on the right. Each result set shows
the number of years with any data in them, the number of records found in each year and the
corresponding percentage of data density for those years, for example:
This SHANGHAI example shows that there are 20
years containing any data were found in the NOAA
set between the years displayed in Start Year and
End Year boxes at the bottom of the window.
Relative to 20 complete years (20 x 365 = 7.300
records) the 7133 records found represent 97% data
completeness in those years.
This is followed by a breakdown of the years containing data, showing the data density for each year in
brackets. The second set of results (“Analysing DB for SHANGHAI”) shows that there are no records in the
Hothaps database. This means the station has not yet been imported.
Hothaps Software 1.0.2.4
User Manual ©2012
Page 7 of 18