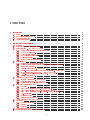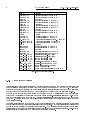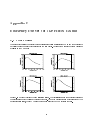
1
EUROPEAN SOUTHERN OBSERVATORY
Organisation Européene pour des Recherches Astronomiques dans l'Hémisphère Austral
Europäische Organisation für astronomische Forschung in der südlichen Hemisphäre
ESO - European Southern Observatory
Karl-Schwarzschild Str. 2, D-85748 Garching bei München
Very Large Telescope
Paranal Science Operations
FORS User Manual
Doc. No. VLT-MAN-ESO-13100-1543
Issue 85.2, Date 25/01/2010
Prepared . . . . . . .I.. .Saviane
.................................
Date
Signature
Smette
Approved . . . . . . A.
....................................
Date
Signature
Released . . . . . . . C.. . Dumas
.................................
Date
Signature
This page was intentionally left blank
Change Record
Issue/Rev.
Date
Sections
af-
Reason/Remarks
fected
draft
July 9, 1998
all
Draft delivered by VIC
1.0
Feb. 11, 1999
some
rst release
1.1
March 25, 1999
all
LADC setting recommended
1.2
August 5, 1999
all
document re-arranged,
page and section numbering
changed
1.3
Sept. 1, 1999
all
more information on FORS2
1.4
Feb. 1, 2000
all
revision for SM P65 & proposals P66
1.5
July 10, 2000
all
revision for SM P66 & proposals P67
2.0
Sept. 17, 2000
all
revision after MXU commissioning and split-up of manuals:
FORS1+2 User's, FORS1+2 FIMS, FORS1+2
Templates
2.1
Dec. 27, 2000
all
revision for SM p67 and proposals P68
2.2
June 27, 2001
all
all sections restructured SM P68 & CFP P69
2.3
Jan. 5, 2002
all
MIT CCD-mosaic detectors
2.4
May 22, 2002
all
updates for SM P70
2.5
Dec. 24, 2002
2,3
chapters 2 and 3 re-sorted, small changes elsewhere
2.6
July 12, 2003
2
V_BESS oset,
ECU, pre-image policy,
and small
changes in the other chapters
2.7
January 5, 2004
2, appendix
2.8
June 30, 2004
all
HIT-mode, POL gure, FORS2 vignetting gures (appendix G), note about the Echelle mode
manual under pdf format,
updates for new FORS1
Grism 1200g+96, update of gain and ron of FORS1
CCD, update of the plate scales due to the FORS1
and 2 move to UT2 and 1, new Rapid Response Mode,
notes about the instrumental linear polarization, the
pre-imaging data delivery, the slit along parallactic angle, the calibration plan in LSS Mode
3
November 28, 2004
2,4
new (integer) manual issue numerotation, update of
4
August 30, 2005
2
79
June 8, 2006
all
80
March 1, 2007
all
81
August 10, 2007
4
Updated read-out modes available in SM
81.2
October 25, 2007
2
Updated information on geometry of mosaic's
82.1
February 27, 2008
2
updated FORS1 standard conguration
83.0
July 14, 2008
all
First version post-merger
84.0
February 26, 2009
2
updated for P84
85.1
December 20, 2009
some
updated for P85 (K. O'Brien); updated graph in Sect.
85.2
January 25, 2010
2.2
E.2; rst LYX version
Note on interference lters
FORS1 gain and ron, MOS supported by the pipeline
new FORS1 Grism 1200B+97, FORS2 Echelle Mode decommissioned, new FORS2 HIT-MS mode
New pdf template, MXU slit sizes, Fig. D22, 23, C4 and
table D2, 3 about Echelle mode removed
New FORS1 E2V blue sensitive CCD mosaic, new broad
band high throughput lters
This page was intentionally left blank
Contents
1 Introduction
1
1.1
Scope
. . . . . . . . . . . . . . . . . . . . . . . . . . . . . . . . . . . . . . . . . . . . . . . . . .
1
1.2
More Information on FORS . . . . . . . . . . . . . . . . . . . . . . . . . . . . . . . . . . . . . .
1
1.3
Contact Information
. . . . . . . . . . . . . . . . . . . . . . . . . . . . . . . . . . . . . . . . . .
2
1.4
Acknowledgements
. . . . . . . . . . . . . . . . . . . . . . . . . . . . . . . . . . . . . . . . . . .
2
2 Instrument Characteristics
3
2.1
Overview
. . . . . . . . . . . . . . . . . . . . . . . . . . . . . . . . . . . . . . . . . . . . . . . .
3
2.2
Standard Instrument Conguration . . . . . . . . . . . . . . . . . . . . . . . . . . . . . . . . . .
5
Direct Imaging IMG and OCC modes . . . . . . . . . . . . . . . . . . . . . . . . . . . . . . .
6
2.3
2.4
2.5
2.6
2.3.1
Basic Characteristics of the Imaging Optics . . . . . . . . . . . . . . . . . . . . . . . . .
6
2.3.2
The FORS Filter Set . . . . . . . . . . . . . . . . . . . . . . . . . . . . . . . . . . . . . .
6
2.3.3
User Provided Filters
. . . . . . . . . . . . . . . . . . . . . . . . . . . . . . . . . . . . .
8
2.3.4
HR Collimator Field Stop . . . . . . . . . . . . . . . . . . . . . . . . . . . . . . . . . . .
9
2.3.5
Occulting Masks
. . . . . . . . . . . . . . . . . . . . . . . . . . . . . . . . . . . . . . . .
9
2.3.6
Image Motion due to Flexure . . . . . . . . . . . . . . . . . . . . . . . . . . . . . . . . .
9
Spectroscopy
. . . . . . . . . . . . . . . . . . . . . . . . . . . . . . . . . . . . . . . . . . . . . .
10
2.4.1
Grisms and Order Sorting Filters . . . . . . . . . . . . . . . . . . . . . . . . . . . . . . .
10
2.4.2
Relative Astrometric Accuracy Requirements for Spectroscopy
. . . . . . . . . . . . . .
10
2.4.3
Instrument Flexures
. . . . . . . . . . . . . . . . . . . . . . . . . . . . . . . . . . . . . .
11
2.4.4
Longslit Spectroscopy LSS mode
2.4.5
Multi-Object Spectroscopy with Movable Slitlets MOS Mode
2.4.6
Wide Slit Spectro-Photometry SPECPHOT mode . . . . . . . . . . . . . . . . . . . .
12
2.4.7
Multi-Object Spectroscopy with masks MXU mode . . . . . . . . . . . . . . . . . . .
12
2.4.8
Slitless Spectroscopy . . . . . . . . . . . . . . . . . . . . . . . . . . . . . . . . . . . . . .
Polarimetry with FORS2
. . . . . . . . . . . . . . . . . . . . . . . . . . . . .
. . . . . . . . . . . . .
. . . . . . . . . . . . . . . . . . . . . . . . . . . . . . . . . . . . . . .
12
12
14
15
2.5.1
Imaging Polarimetry IPOL mode
. . . . . . . . . . . . . . . . . . . . . . . . . . . . .
15
2.5.2
Spectropolarimetry PMOS mode
. . . . . . . . . . . . . . . . . . . . . . . . . . . . .
16
2.5.3
Performance of the Polarimetric Modes
High Time Resolution Modes
. . . . . . . . . . . . . . . . . . . . . . . . . . .
16
. . . . . . . . . . . . . . . . . . . . . . . . . . . . . . . . . . . . .
18
2.6.1
Overview
. . . . . . . . . . . . . . . . . . . . . . . . . . . . . . . . . . . . . . . . . . . .
18
2.6.2
High Time Resolution Mode Imaging (HIT-I) . . . . . . . . . . . . . . . . . . . . . . .
18
2.6.3
High Time Resolution Mode Spectroscopy (HIT-S) . . . . . . . . . . . . . . . . . . . .
19
2.6.4
High Time Resolution Mode Multiple-Shift Mode (HIT-MS)
19
2.6.5
OB-preparation . . . . . . . . . . . . . . . . . . . . . . . . . . . . . . . . . . . . . . . . .
20
2.6.6
Calibration plan
20
2.6.7
Performance on the sky
. . . . . . . . . . . . . .
. . . . . . . . . . . . . . . . . . . . . . . . . . . . . . . . . . . . . . . .
. . . . . . . . . . . . . . . . . . . . . . . . . . . . . . . . . . . .
20
2.7
Rapid Response Mode (RRM) for FORS . . . . . . . . . . . . . . . . . . . . . . . . . . . . . . .
22
2.8
Detectors
23
2.9
. . . . . . . . . . . . . . . . . . . . . . . . . . . . . . . . . . . . . . . . . . . . . . . .
2.8.1
General Properties . . . . . . . . . . . . . . . . . . . . . . . . . . . . . . . . . . . . . . .
23
2.8.2
Fringes
. . . . . . . . . . . . . . . . . . . . . . . . . . . . . . . . . . . . . . . . . . . . .
24
2.8.3
Shutter
. . . . . . . . . . . . . . . . . . . . . . . . . . . . . . . . . . . . . . . . . . . . .
25
The Calibration Units
. . . . . . . . . . . . . . . . . . . . . . . . . . . . . . . . . . . . . . . . .
2.10 'Retired' Instrument Components/Modes
. . . . . . . . . . . . . . . . . . . . . . . . . . . . . .
v
25
26
3 Observing with FORS
27
3.1
Selecting the Observing Mode . . . . . . . . . . . . . . . . . . . . . . . . . . . . . . . . . . . . .
27
3.2
Fast modes or FIMS mask preparation . . . . . . . . . . . . . . . . . . . . . . . . . . . . . . . .
27
3.3
Selecting the Instrument Setups and Exposure Times . . . . . . . . . . . . . . . . . . . . . . . .
28
3.4
OB-preparation FIMS based modes . . . . . . . . . . . . . . . . . . . . . . . . . . . . . . . .
28
3.5
OB-preparation Fast modes
29
3.6
Estimate execution time and optimize overheads
3.7
Visitor Mode
3.8
. . . . . . . . . . . . . . . . . . . . . . . . . . . . . . . . . . . .
. . . . . . . . . . . . . . . . . . . . . . . . . .
29
. . . . . . . . . . . . . . . . . . . . . . . . . . . . . . . . . . . . . . . . . . . . . .
31
3.7.1
The nal package . . . . . . . . . . . . . . . . . . . . . . . . . . . . . . . . . . . . . . . .
31
3.7.2
At the telescope
. . . . . . . . . . . . . . . . . . . . . . . . . . . . . . . . . . . . . . . .
31
3.7.3
At the very end . . . . . . . . . . . . . . . . . . . . . . . . . . . . . . . . . . . . . . . . .
31
FORS and the Unit Telescopes
. . . . . . . . . . . . . . . . . . . . . . . . . . . . . . . . . . . .
. . . . . . . . . . . . . . . . . . . . . . . . . . . . . . . .
31
3.8.1
Guide Stars, Telescope Osets
3.8.2
Telescope and Instrument Focus
3.8.3
Instrument Rotation and Position Angle on the Sky
. . . . . . . . . . . . . . . . . . . .
32
3.8.4
Atmospheric Dispersion Compensation . . . . . . . . . . . . . . . . . . . . . . . . . . . .
32
. . . . . . . . . . . . . . . . . . . . . . . . . . . . . . .
4 Calibrating and Reducing FORS Data
31
32
33
4.1
Calibration Plan
. . . . . . . . . . . . . . . . . . . . . . . . . . . . . . . . . . . . . . . . . . . .
33
4.2
Image Field Distortion and Scales . . . . . . . . . . . . . . . . . . . . . . . . . . . . . . . . . . .
34
4.3
Data Reduction of Pre-Imaging Data for the Mask Preparation . . . . . . . . . . . . . . . . . .
35
4.4
Flat-Fielding
. . . . . . . . . . . . . . . . . . . . . . . . . . . . . . . . . . . . . . . . . . . . . .
Imaging Mode
. . . . . . . . . . . . . . . . . . . . . . . . . . . . . . . . . . . . . . . . .
36
4.4.2
Spectroscopic Modes . . . . . . . . . . . . . . . . . . . . . . . . . . . . . . . . . . . . . .
36
4.5
Wavelength Calibration
4.6
Calibrating Polarimetric Measurements
4.7
36
4.4.1
. . . . . . . . . . . . . . . . . . . . . . . . . . . . . . . . . . . . . . . .
. . . . . . . . . . . . . . . . . . . . . . . . . . . . . . .
37
38
4.6.1
Circular polarimetry . . . . . . . . . . . . . . . . . . . . . . . . . . . . . . . . . . . . . .
38
4.6.2
Linear Polarimetry . . . . . . . . . . . . . . . . . . . . . . . . . . . . . . . . . . . . . . .
39
Pipeline Reduction . . . . . . . . . . . . . . . . . . . . . . . . . . . . . . . . . . . . . . . . . . .
40
4.7.1
Supported modes . . . . . . . . . . . . . . . . . . . . . . . . . . . . . . . . . . . . . . . .
40
4.7.2
Quality Control Pipeline - Service Mode Only . . . . . . . . . . . . . . . . . . . . . . . .
40
4.7.3
Paranal Science Operation Pipeline IMG, LSS and MOS/MXU modes only
41
. . . . .
A Abbreviations and Acronyms
43
B FORS Filter Characteristics
45
B.1
Broadband Filters
. . . . . . . . . . . . . . . . . . . . . . . . . . . . . . . . . . . . . . . . . . .
45
B.2
Interference Filters . . . . . . . . . . . . . . . . . . . . . . . . . . . . . . . . . . . . . . . . . . .
49
C Eciency Curves for the FORS Grisms
C.1
FORS2 Grisms
. . . . . . . . . . . . . . . . . . . . . . . . . . . . . . . . . . . . . . . . . . . . .
51
51
D Wavelength Calibration Spectra for the FORS Standard Grisms
54
E FORS Image Orientation
65
E.1
MOS Orientation . . . . . . . . . . . . . . . . . . . . . . . . . . . . . . . . . . . . . . . . . . . .
65
E.2
LSS Orientation
66
. . . . . . . . . . . . . . . . . . . . . . . . . . . . . . . . . . . . . . . . . . . .
F World Coordinate System Information
67
G Field vignetting with the MIT CCD
69
List of Figures
2.1
Schematic view of the FORS instruments
2.2
Light paths for the standard and high resolution collimators.
. . . . . . . . . . . . . . . . . . . . . . . . . . . . . .
2.3
FORS2 standard broadband lters
2.4
Results of exure measurements as a function of the rotator position for the SR collimator at
4
. . . . . . . . . . . . . . . . . . .
4
. . . . . . . . . . . . . . . . . . . . . . . . . . . . . . . . . .
7
◦
zenith distance of 40 . The panels show the exure in un-binned pixels across (X) and along
(Y) the slit. The solid green circle represents zero-exure. . . . . . . . . . . . . . . . . . . . . .
11
2.5
Strip Mask for Imaging Polarimetry
15
2.6
Quantum eciency of the MIT (red) and E2V (blue) CCDs. The individual curves show the
. . . . . . . . . . . . . . . . . . . . . . . . . . . . . . . . .
slight dierence in QE of the 2 detectors in each mosaic.
The dashed line shows where the
fringing will limit the S/N achievable with the E2V detector.
4.1
. . . . . . . . . . . . . . . . . . .
24
. . . . . . . . . . . . . . . . . . . . . . . . . . . . . . . . . . . . . . . . . . . . . . . . . . . . . .
39
B.1
Filter transmission curves
. . . . . . . . . . . . . . . . . . . . . . . . . . . . . . . . . . . . . . .
46
B.2
Additional Bessell lter transmission curves . . . . . . . . . . . . . . . . . . . . . . . . . . . . .
47
B.3
Gunn lter transmission curves . . . . . . . . . . . . . . . . . . . . . . . . . . . . . . . . . . . .
48
B.4
FORS intermediate band lter transmission curves . . . . . . . . . . . . . . . . . . . . . . . . .
50
C.1
Eciency curves of the low resolution grisms. . . . . . . . . . . . . . . . . . . . . . . . . . . . .
51
C.2
Eciency curve of the medium resolution grisms. . . . . . . . . . . . . . . . . . . . . . . . . . .
52
C.3
Eciency curve of the medium resolution grisms. . . . . . . . . . . . . . . . . . . . . . . . . . .
53
D.1
Calibration spectrum SR + GRIS_1400V . . . . . . . . . . . . . . . . . . . . . . . . . . . . . .
56
D.2
Calibration spectrum SR + GRIS_1200R
. . . . . . . . . . . . . . . . . . . . . . . . . . . . . .
56
D.3
Calibration spectrum SR + GRIS_1200g
. . . . . . . . . . . . . . . . . . . . . . . . . . . . . .
57
D.4
Calibration spectrum SR + GRIS_1028z
. . . . . . . . . . . . . . . . . . . . . . . . . . . . . .
57
D.5
Calibration spectrum SR + GRIS_600B . . . . . . . . . . . . . . . . . . . . . . . . . . . . . . .
58
D.6
Calibration spectrum SR + GRIS_600V . . . . . . . . . . . . . . . . . . . . . . . . . . . . . . .
58
D.7
Calibration spectrum SR + GRIS_600R . . . . . . . . . . . . . . . . . . . . . . . . . . . . . . .
59
D.8
Calibration spectrum SR + GRIS_600RI
D.9
. . . . . . . . . . . . . . . . . . . . . . . . . . . . . .
59
Calibration spectrum SR + GRIS_600I
. . . . . . . . . . . . . . . . . . . . . . . . . . . . . . .
60
D.10 Calibration spectrum SR + GRIS_600I
. . . . . . . . . . . . . . . . . . . . . . . . . . . . . . .
D.11 2nd order Calibration spectrum SR + GRIS_600I
60
. . . . . . . . . . . . . . . . . . . . . . . . .
61
D.12 Calibration spectrum SR + GRIS_600z
. . . . . . . . . . . . . . . . . . . . . . . . . . . . . . .
61
D.13 Calibration spectrum SR + GRIS_600z
. . . . . . . . . . . . . . . . . . . . . . . . . . . . . . .
62
D.14 Calibration spectrum SR + GRIS_300V . . . . . . . . . . . . . . . . . . . . . . . . . . . . . . .
63
D.15 Calibration spectrum SR + GRIS_300I
. . . . . . . . . . . . . . . . . . . . . . . . . . . . . . .
63
D.16 Calibration spectrum SR + GRIS_200I
. . . . . . . . . . . . . . . . . . . . . . . . . . . . . . .
64
D.17 Calibration spectrum SR + GRIS_150I
. . . . . . . . . . . . . . . . . . . . . . . . . . . . . . .
64
G.1
Vignetting of FORS2 CCD by MOS (standard resolution mode) . . . . . . . . . . . . . . . . . .
69
G.2
Vignetting of the FORS2 CCD in high resolution mode) . . . . . . . . . . . . . . . . . . . . . .
70
vii
List of Tables
2.1
FORS2 standard conguration of opto-mechanical components
2.2
Optical properties of FORS
. . . . . . . . . . . . . . . . . . . . . . . . . . . . . . . . . . . . . .
. . . . . . . . . . . . . . . . . .
5
6
2.3
Exchangeable lter set . . . . . . . . . . . . . . . . . . . . . . . . . . . . . . . . . . . . . . . . .
8
2.4
Characteristics of the FORS grisms.
2.5
The FORS longslits
2.6
Retarder plate angles for circular and linear (spectro-)polarimetry
2.7
Mosaic geometry
. . . . . . . . . . . . . . . . . . . . . . . . . . . . . . . . .
13
. . . . . . . . . . . . . . . . . . . . . . . . . . . . . . . . . . . . . . . . . .
14
. . . . . . . . . . . . . . . .
16
. . . . . . . . . . . . . . . . . . . . . . . . . . . . . . . . . . . . . . . . . . . .
23
2.8
Detector readout noise and conversion factors . . . . . . . . . . . . . . . . . . . . . . . . . . . .
24
2.9
Basic characteristics of the FORS CCDs . . . . . . . . . . . . . . . . . . . . . . . . . . . . . . .
25
2.10 Approximate CCD readout times . . . . . . . . . . . . . . . . . . . . . . . . . . . . . . . . . . .
25
2.11 Retired instrument components . . . . . . . . . . . . . . . . . . . . . . . . . . . . . . . . . . .
26
2.12 Detector readout noise and conversion factors of the old FORS1 Tektronix and FORS2 SITE
CCDs
3.1
. . . . . . . . . . . . . . . . . . . . . . . . . . . . . . . . . . . . . . . . . . . . . . . . . .
26
Operational overheads with FORS2 on the VLT. The through-slit exposure is typically executed
twice. It is important to include the overhead times while preparing proposals and service mode
observations packages.
. . . . . . . . . . . . . . . . . . . . . . . . . . . . . . . . . . . . . . . .
30
4.1
FORS Calibration Plan Tasks . . . . . . . . . . . . . . . . . . . . . . . . . . . . . . . . . . . . .
34
4.2
Large-scale structure and small-scale noise in sky ats
4.3
Exposure times for FORS2 imaging screen at calibrations
4.4
Exposure times for spectroscopic screen at calibrations
4.5
Exposure times and switch-on times for FORS2 wavelength calibrations
4.6
FORS1 half-wave plate calibration
B.1
Characteristics of the broadband lters . . . . . . . . . . . . . . . . . . . . . . . . . . . . . . . .
45
B.2
Characteristics of the FORS interference lters
. . . . . . . . . . . . . . . . . . . . . . . . . . .
49
D.1
FORS arc lamp wavelength table . . . . . . . . . . . . . . . . . . . . . . . . . . . . . . . . . . .
55
. . . . . . . . . . . . . . . . . . . . . . .
. . . . . . . . . . . . . . . . . . . .
. . . . . . . . . . . . . . . . . . . . . .
36
37
37
. . . . . . . . . . . . .
38
. . . . . . . . . . . . . . . . . . . . . . . . . . . . . . . . . .
40
viii
Chapter 1
Introduction
1.1 Scope
The FORS User's Manual is intended to cover all aspects of the VLT instrument FORS2 following the merging
of FORS1 and FORS2. It is intended to give comprehensive information on the following topics:
•
Overall description of the FORS2 instrument
•
Observing with FORS
•
Calibrating and reducing FORS data
•
Supplementary Data and Informations about CCDs, lters and grisms
The informations about observation block preparation for FORS with p2pp and mask preparation with FIMS
are given in the following supplementary manuals:
•
FORS FIMS Manual
(ESO document VLT-MAN-ESO-13100-2308)
•
FORS Template Manual
(ESO document VLT-MAN-ESO-13100-2309)
The knowledge of these manuals is essential for the preparation of proposals and observations with FORS2.
1.2 More Information on FORS
The FORS User's, FIMS and Templates Manuals are published on the FORS instrument WEB page. Additionally, a version of the user manual from P82 can be found which has information on FORS1 and FORS2
prior to the merger:
http://www.eso.org/sci/facilities/paranal/instruments/fors/
Information and software tools for the preparation of service and visitor mode observations with FORS2 are
given under:
http://www.eso.org/observing/p2pp/
Visiting astronomers will nd instructions and hints on the Paranal Science Operations WEB page and the
Paranal Observatory home page:
http://www.eso.org/sci/facilities/paranal/
http://www.eso.org/sci/facilities/paranal/sciops/
1
2
FORS User Manual
VLT-MAN-ESO-13100-1543
1.3 Contact Information
In case of specic questions related to Service Mode observations and proposal preparation please contact the
ESO User Support Group:
[email protected]
For visitor mode observations please contact the Paranal Science Operations Team:
[email protected]
1.4 Acknowledgements
The rst edition of this User Manual was delivered by the FORS Consortium which was formed by the
Landessternwarte Heidelberg, the University Observatories of Göttingen and Munich in the scope of the FORS
contract and nally compiled and edited by G. Rupprecht. Later editions were edited by H. Böhnhardt, T.
Szeifert and E. Jehin.
We are very greatful for the input from the members of the FORS instrument operation team, from the team
of the Paranal observatory and last but not least for the feedback from the users.
Chapter 2
Instrument Characteristics
2.1 Overview
Instrument Concept: FORS is the visual and near UV FOcal Reducer and low dispersion Spectrograph
Very Large Telescope (VLT) of the European Southern Observatory (ESO). Two versions of FORS
for the
were built and installed on the Cassegrain foci. They have been moved to dierent telescopes in the last years.
As of P83, FORS1 was decommissioned to make way for the second generation of VLT instrumentation.
FORS was designed as an all-dioptric instrument for the wavelength range from 330 nm to 1100 nm and
00
00
provides an image scale of 0. 25/pixel (and 0. 125/pixel) with the standard resolution collimator (and the high
resolution collimator, respectively) and in the default binned (2x2) read-out mode of both FORS detectors.
Since April 2009, FORS2 has been available with a choice of components from both of the original instruments.
FORS2 is equipped with a mosaic of two 2k×4k MIT CCDs (pixel size of 15×15
µm) and particularly sensitive
in the red part of the spectrum (up to 1100 nm). The detector previously mounted on FORS1 is also available
(in Visitor Mode only). It consists of a mosaic of two 2k×4k E2V CCDs (pixel size of 15×15
µm)
particularly
sensitive in the blue range of the spectrum.
The main instrument components shown in Figure 2.1 are: The Top Section with the focal plane equipment
including the multi object spectroscopy (MOS) unit with 19 movable slits, the longslits, the polarimetry mask,
the MXU mask exchange unit and the two calibration units. The Collimator Section with the two collimators
and the electronic cabinets.
The Filter/Camera Section with the retarder plate mosaics, the wheel for the
Wollaston prism and optional optical analyzers (lters and/or grisms), the grism wheel and the broadband
lter wheel in the parallel beam.
Furthermore the camera, the interference lter wheels in the converging
beam and the exposure shutter in front of the CCD.
Observing Modes:
FORS oers the observing modes tabulated below. While the observing modes IMG,
LSS and IPOL are supported for both collimators, some restrictions apply in the modes MXU, MOS, HIT and
PMOS:
direct imaging
IMG
imaging with occulting bars
OCC
imaging polarimetry
IPOL
multi-object spectro-polarimetry
PMOS
multi-object spectroscopy with masks
MXU
SR-collimator only
multi-object spectroscopy with movable slitlets
MOS
SR-collimator only
longslit spectroscopy
LSS
high time resolution imaging and spectroscopy
HIT
3
SR-collimator only
SR-collimator only
4
FORS User Manual
Figure 2.1:
Figure 2.2:
VLT-MAN-ESO-13100-1543
Schematic view of the FORS instruments
Light paths for the standard and high resolution collimators.
FORS User Manual
VLT-MAN-ESO-13100-1543
5
2.2 Standard Instrument Conguration
FORS is operated with a standard conguration with certain opto-mechanical components permanently
mounted in xed positions.
This instrument conguration is kept frozen for a given observation period to
ensure that all observations in service or visitor mode can be taken at any time without delays due to conguration changes. The current standard conguration is listed below in Table 2.1. The interference lters given
in Table 2.3 and up to 10 MXU masks will be mounted on user request.
Please note that the instrument standard conguration will be only modied in exceptional cases upon request
and with the approval of ESO. Such requests should be submitted to [email protected] before the beginning
of the observing period with a justication for the changes.
Instrument Location
P2PP Entry Name
Component Name
Focal area
MOS
19 slitlet multi-object spectroscopy unit
LSS
9 slit longslit mask unit
MXU
mask exchange unit for multi-object spectroscopy with up to 10 masks
polarimmask
Mask unit for imaging polarimetry
with HR collimator
Collimator unit
Retarder swing arm
Wheel 1 (Wollaston wheel)
Wheel 2 (grism wheel)
Wheel 3 (broadband lter)
Table 2.1:
COLL_SR+6
Standard resolution collimator
COLL_HR+7
High resolution collimator
RETA4+4
Quarter wave plate mosaic
RETA2+5
Half wave plate mosaic
WOLL_34+13
Wollaston prism
g_HIGH+115
Standard g-band lter
GRIS_150I+27
Grism 150I
GRIS_600RI+19
Grism 600RI
GRIS_600z+23
Grism 600z
z_GUNN+78
Standard z-band lter
GRIS_1028z+29
Grism 1028z
GRIS_1400V+18
Grism 1400V
GRIS_600B+22
Grism 600B
GRIS_1200B+97
Grism 1200B
GRIS_1200R+93
Grism 1200R
GRIS_300I+11
Grism 300I
GRIS_300V+10
Grism 300V
u_HIGH+112
Standard u-band lter
GG435+81
Order sorting lter GG435
OG590+32
Order sorting lter OG590
b_HIGH+113
Standard b-band lter
v_HIGH+114
Standard v-band lter
R_SPECIAL+76
Standard R-band lter
I_BESS+77
Standard I-band lter
FORS2 standard conguration of opto-mechanical components.
Exchangeable Components:
up to 8 interference lters can be installed in FORS2, in addition to the
standard conguration set-up. For visitor mode observers, the appropriate lter set-up request referring to
the available lters of Table 2.3 has to be submitted to the Paranal Science Operations Group at least one day
before the start of the observing program. For service mode, a maximum of two interference lters per OB
can be asked. Paranal Science Operations will take care of the proper instrument set-up for the observations.
Special rules and recommendations apply for the use of user provided lters: see section 2.3.3.
Filter and Grism Combinations:
In general only 1 lter can be used per instrument setup for imaging
and 1 grism (plus the recommended order separation lters in table 2.4 if needed) for spectroscopic modes.
The combination of 1 grism with 1 lter, other than the order separation lters is only supported if the two
components are mounted in dierent wheels. However, these non-standard congurations are not supported by
the calibration plan, as described in Section 4.1. The combination of two lters at the same time are generally
not supported in normal operation since these setups would require testing and software reconguration.
6
FORS User Manual
VLT-MAN-ESO-13100-1543
2.3 Direct Imaging IMG and OCC modes
2.3.1
Basic Characteristics of the Imaging Optics
Field of View, Pixel Resolution, Transmission, Image Quality:
image scale of 528
µm/arcsec
high resolution collimator and the binned (2x2) 15
(2x2) 15
µm
FORS reduces the VLT Cassegrain
00
00
to 0. 25/pixel with the standard resolution collimator and 0. 125/pixel with the
pixels of the E2V CCD mosaic.
µm pixels of the MIT CCD mosaic as well as for the binned
Please take the accurate scales and informations about the
image eld distortion from section 4.2. Sky concentration eects will be small and negligible for at-eld and
photometric calibrations.
Standard Resolution
00
Image Quality
collimator focal length
camera focal length
nal f-ratio
High Resolution
00
80 % in 0. 2
80 % in 0. 1
0
within 4.0
0
within 2.0
1233 mm
616 mm
280 mm
280 mm
3.13
6.25
∼000. 25/pixel
∼000. 125/pixel
0
0
6.8×6.8
∼000. 125/pixel
∼000. 0632/pixel
0
0
4.2×4.2
∼000. 25/pixel
∼000. 125/pixel
0
0
6.8×6.8
∼000. 125/pixel
∼000. 0632/pixel
0
0
4.2×4.2
MIT mosaic
Pixel Scale (2x2)
Pixel Scale (1x1)
Field of View
E2V mosaic
Pixel Scale (2x2)
Pixel Scale (1x1)
Field of View
Table 2.2:
Optical properties of FORS
Field vignetting and detector geometry with the FORS2 CCD mosaics:
The eld of view of FORS
with the MIT/E2V CCDs is restricted by the MOS unit in the focal plane of the unit telescope to about 6.8
arc-minutes for the standard resolution collimator. In case of the high resolution collimator the corners of the
eld of view are vignetted by the camera lenses. The two CCDs of each mosaic are mounted slightly oset from
the optical axis by 33 for operational reasons. The center of the eld of view will fall on y-pixel
∼260
of the
upper chip1 CCD for unbinned standard resolution mode. Images showing the respective vignetting pattern
for the standard (MOS) and high resolution collimator mode can be found in appendix G of this manual.
High resolution imaging with the FORS2 CCD mosaics:
With the high sampling of the MIT/E2V
00
CCDs of 0. 125/pixel for the unbinned 15
µm pixels it is possible to operate with the standard resolution
00
collimator down to seeing values of about 0. 35 without performance losses in respect to observation with the
00
high resolution collimator. Below seeing values of 0. 3 the high resolution collimator is expected to improve
the image quality in a signicant way.
2.3.2
The FORS Filter Set
Standard Broadband Filters:
FORS provides positions for 7 broadband lters in any of the three wheels of
the parallel beam section and for 8 interference lters in two wheels of convergent beam section. The standard
lter sets for FORS2 are the four new high throughput broad band lters previously mounted in FORS1
u_HIGH, b_HIGH, v_HIGH, g_HIGH, together with the R_SPECIAL, I_BESS, Gunn z (see Figure 2.3)
and some order separation lters (see Table 2.1). The special R band lter and the Bessel I lter of FORS2
show internal fringes at a faint level. In case of the Bessel I, the internal fringes can be only seen with the IR
optimized MIT detectors. In both cases the typical shape of the pattern is circular and o-axis. The complete
list of lters together with the transmission curves are presented in appendix B of this manual.
Order Separation Filters:
the order separation lters are foreseen for spectroscopic applications in the rst
place, but they are also available for imaging exposures. They have an edge-shape transmission curve with
cut-o wavelength designed to match the respective grisms for spectroscopy. The order separation lters are
installed in the parallel beam of the instruments.
FORS User Manual
Figure 2.3:
VLT-MAN-ESO-13100-1543
7
The FORS2 lters which can either be used in the ubvRIz sequence or the ugrIz sequence to cover
the full wavelength range with broad band lters.
Interference Filters: the standard interference lters available for FORS2 are centered on important emission
lines and on wavelengths 5 and 10% longer. The interference lters are located in the convergent beam in the
camera and have a diameter of 115 mm. Their wave front error is less than
λ/4
within 25 mm.
The intrinsic transmission curves of the narrow band lters have approximately Gaussian shape. The central
wavelengths of the interference lters depend on the tilt angle of the incident beam. Therefore, all interference
lters of FORS are used in the convergent beam to minimize the eld dependence of the lter curves. For the
given focal ratio of FORS the minimum recommended lter resolution
λ/∆λ
will be 100 (SR) and 400 (HR
collimator). Filter curves that are narrower than this will be convolved and only the transmission will only
lead to a decrease in transmission. The measured transmission parameters of the narrow band lters for the
convergent beam are summarized in Table B.2.
Medium band Interference Filters:
a few intermediate band lters are available to be shared with both
FORS instruments. Table B.2 lists the lter names and the transmission characteristics, Figure B.2 shows the
transmission curves of the lters.
Image Osets:
The sources of image osets are the small exures of FORS and the atmospheric dispersion,
both of which are relatively small eects. The later is corrected by the atmospheric dispersion corrector, such
that there should be no signicant image osets between the telescope guiding system and the respective
images taken with FORS for zenith distances of up to 45 degrees (it gives a partial correction even at larger
zenith distances).
8
FORS User Manual
P2PP entry
Filter type
OII+44
O II lter
OII/4000+45
O II lter redshifted by 4000 km/s
OII/8000+46
O II lter redshifted by 8000 km/s
HeII+47
He II lter
HeII/3000+48
He II lter redshifted by 3000 km/s
HeII/6500+49
He II lter redshifted by 6500 km/s
OIII+50
O III lter
OIII/3000+51
O III lter redshifted by 3000 km/s
OIII/6000+52
O III lter redshifted by 6000 km/s
HeI+53
He I lter
HeI/2500+54
He I lter redshifted by 2500 km/s
HeI/5000+55
He I lter redshifted by 5000 km/s
OI+56
O I lter
OI/2500+57
O I lter redshifted by 2500 km/s
OI/4500+58
O I lter redshifted by 4500 km/s
H_Alpha+83
H Alpha lter (replacement for H_Alpha+59)
H_Alpha/2500+60
H Alpha lter redshifted by 2500 km/s
H_Alpha/4500+61
H Alpha lter redshifted by 4500 km/s
SII+62
S II lter
SII/2000+63
S II lter redshifted by 2000 km/s
SII/4500+64
S II lter redshifted by 4500 km/s
SIII+65
S III lter
SIII/1500+66
S III lter redshifted by 1500 km/s
SIII/3000+67
S III lter redshifted by 3000 km/s
FILT_485_37+68
special intermediate-band lter
FILT_691_55+69
special intermediate-band lter
FILT_815_13+70
night sky suppression lter
FILT_834_48+71
night sky suppression lter
z_SPECIAL+43
Special z-band lter (width 20nm)
FILT_917_6+88
Special z-band lter (width
FILT_530_25+84
Munich intermediate-band lter
FILT_500_5+85
Munich O III lter
FILT_503_5+86
Munich O III lter redshifted by 1800 km/s
Table 2.3:
2.3.3
VLT-MAN-ESO-13100-1543
6nm)
Exchangeable lter set.
User Provided Filters
The installation of user provided lters in FORS2 is subject of approval by the Director of Paranal and will
only be considered upon recommendation of the ESO program committees (OPC and DDTC). The lters and
their mounts must comply optically and mechanically with the specications of the standard FORS lters and
mounts (which can be requested from ESO via the Instrument Operation Team (email: [email protected]).
The diameter of user provided lters shall not be smaller than 138mm (parallel beam) to avoid vignetting
which would be equivalent to a reduction of the main mirror diameter. Interference lters (115±0.25mm) are
used in the converging beam of the camera. Their spectral resolution shall not exceed 100 (SR mode) or 400
(HR mode). There is a limited number of lter mounts (for converging beam lters only) available to be sent
to the users on request.
The lters, fully assembled in the mounts, must be made available to the Paranal Observatory at the latest
6 weeks before the start of the respective observing program execution. They will be installed in the instrument
and tested for compatibility and focusing during this time. The Observatory reserves the right not to allow
special lters to be mounted for observations in case of technical and/or operational problems. User-provided
lters are usually not allowed for FORS service mode observing programs.
FORS User Manual
2.3.4
VLT-MAN-ESO-13100-1543
9
HR Collimator Field Stop
For HR observations in imaging mode the MOS slit arms are also used to form a eld stop mask to limit the
eld in the focal area of the instrument and thus to reduce stray light.
2.3.5
Occulting Masks
Individual arms of the MOS unit can be used in the direct imaging modes (this includes also imaging polarimetry) to block light from bright objects next to very faint ones. In this case, the use of the FIMS software
tool is mandatory for the preparation of the observations; for details see the FORS2 FIMS Manual.
2.3.6
Image Motion due to Flexure
Image motion due to instrument exure under gravity is below 0.25 pixel over a 1 hour exposure with the
◦
standard and a 2 hour exposure with the high resolution collimator for zenith distances less then 60 .
10
FORS User Manual
VLT-MAN-ESO-13100-1543
2.4 Spectroscopy
Spectroscopy Modes:
FORS2 oers four spectroscopic observation modes: LSS, (P)MOS, MXU and HIT.
A variety of grisms with dierent wavelength ranges and dispersions is available (see Table 2.4). The grisms
can be combined with lters for order separation or more specialized settings. The dispersion direction is along
the X direction of the CCD in all spectroscopic modes with the exception of the HIT mode, where a dedicated
grism that has been rotated through 90 degrees is used. The camera focus is set automatically depending on
the grism-lter combination in the optical path of the instrument.
Usable Field for Spectroscopy:
for objects close to the edge of the eld of view (in the direction of
dispersion), a part of the spectrum will not reach the CCD. Therefore, the typical usable eld of view for
spectroscopy with the standard and high resolution collimators will be reduced in dispersion direction.
2.4.1
Grisms and Order Sorting Filters
Normal Grisms:
a set of normal grisms is available which cover the full operational wavelength range of
FORS with essentially three dierent resolutions: 230 Å/mm, 110 Å/mm, 45 to 50 Å/mm (see Table 2.4).
GRIS_600B+22, GRIS_300V+10, GRIS_150I+27. All grisms are mounted in the grism or Wollaston wheels
of the parallel beam section.
Holographic Grisms:
in addition to the normal/standard grisms some medium resolution high throughput
grisms are available with FORS2: GRIS_1400V+18, GRIS_1200B+97, GRIS_1200R+93, GRIS_1028z+29,
GRIS_600RI+19 and GRIS_600z+23. These grisms are based on volume-phased holographic gratings which
are cemented between two glass prisms (see Figures C.1 for the 1st order throughput measurements).
A special note about grisms 600RI and 1400V:
Due to manufacturing errors, a tilt of the light beam
is induced for grisms GRIS_1400V+18 and GRIS_600RI+19 which shifts the spectrum on the detector in
Y direction by
∼111
and
∼272
pixels (unbinned 15 micron pixels, as compared to the object position in the
through-slit image). There should be no part of the spectrum lost for grism 1400V since the CCD mosaics are
large enough to receive all the tilted light. For grism GRIS_600RI+19 the expected consequences will be that
the uppermost 21 arc-seconds of the eld of view will fall o the CCDs in SR-mode.
Order Separation Filters:
order sorting lters are available to allow for the suppression of spectral order
overlaps in the spectra. Order separation lters are installed in the broadband lter wheel.
Other FORS Filters:
normal broad-band, medium and narrow-band lters can also be combined with the
grisms, but only one lter at a given time and only lters which are not mounted in the same wheel as the user
selected grism. Please note that such set-ups are not covered by the FORS Calibration Plan, see Section 4.1
for details.
Grism and Filter Transmission:
eciency curves of the available grisms are presented in Appendix C. For
the lter characteristics see Appendix B.
2.4.2
Relative Astrometric Accuracy Requirements for Spectroscopy
Highly accurate relative astrometry is required for any observing mode which will make use of FIMS or blind
oset acquisitions. The mask preparation with FIMS requires input images which are astrometrically corrected
within the denitions and precision given below. DSS images will, in almost all cases, not be suitable for the
task. In general the relative astrometry must be known better than 1/6 of the slit widths all over the eld of
view. Relative astrometry here means that the slit positions must be known relative to those of reference stars
in the eld of view with the given precision. To achieve such an astrometric calibration based on stars in your
eld is dicult. It is recommended to cross check the values for the image scale and eld distortion in other
1
elds (whenever possible in elds with astrometric standard stars ).
All these relative astrometric calibrations are not required, if your FIMS preparation is based on pre-images
taken with any of the FORS instruments. It is strongly recommended to search in the VLT Science Archive
(http://archive.eso.org) for released FORS imaging data.
1 see
eg. UCAC1, Zacharias et al. 2000, AJ 120, p2131 or SDSS, Stoughton et al. 2002, AJ 123, p485
FORS User Manual
VLT-MAN-ESO-13100-1543
11
Restrictions for pre-images to be used for the mask preparations:
The target acquisition procedures
were reviewed and based on the latest astrometric measurements there should be no more restrictions in using
FORS1, FORS2 and other astrometrically corrected images (with world coordinate systems dened in the ts
headers) to prepare masks for any FORS instrument. The ts headers of FORS1 images taken before March
22, 2003 would need to be corrected in the ts headers. This should be discussed with the observatory sta
([email protected]) before submitting the respective masks.
pre-imaging source
2.4.3
alignment quality
FORS2
optimum
FORS1 (after March 22, 2003)
optimum
other images & catalogs
optimum
Instrument Flexures
The image motion due to instrument exure under gravity is less then 0.2 un-binned pixels over a 1 hour
exposure with the standard and a 2 hour exposure with the high resolution collimator for zenith distances less
◦
then 60 . Arcs and at are however taken at daytime and at the zenith. This will introduce an oset between
night time calibration based on telluric emission lines and day time calibrations based on arc lines depending
on the zenith distance and the absolute angle of the Cassegrain rotator. The passive exure compensation of
the FORS instruments, based on support struts on the camera section was optimized down to the following
small but not negligible image motions between zenith and the given zenith distances:
Figure 2.4:
Results of exure measurements as a function of the rotator position for the SR collimator at
◦
zenith distance of 40 . The panels show the exure in un-binned pixels across (X) and along (Y) the slit. The
solid green circle represents zero-exure.
zenith distance
COLL_SR
COLL_HR
<000. 06
<000. 10
<000. 14
<000. 18
<000. 03
<000. 05
<000. 07
<000. 09
◦
0
◦
15
◦
30
◦
45
◦
60
In all standard congurations telluric emission lines will fall into the wavelength range of FORS, which allow
to correct for any shifts/rotation between science and calibration observations.
However, when using the
1200B+97 grism there may be no telluric lines in the observed spectra. The same is true for the 600B+22 or
1400V+18 grisms with MOS blades located towards the right/red side of the instrument, In the case of the
MOS mode observations, adding empty slitlets at the top and bottom of the mask, which contain a wavelength
range including 5577 Å, can be helpful.
Shifts and/or rotations between science observations of the same mask during the night cannot be corrected
using sky lines. In this case the through-slit image can allow to look for potential movements of targets. If
12
FORS User Manual
VLT-MAN-ESO-13100-1543
high precision is required (e.g. for radial velocity studies, line width determinations, abundance analyses) it is
recommended to take a through-slit image before and after each science observation.
2.4.4
Longslit Spectroscopy LSS mode
Longslit Mask LSS: A mask providing 9 longslits with high quality slit edges is available for the focal area
0
of FORS; they have a common slit length of 6.8 and xed slit widths. The approximate osets of the slits
00
with respect to the central (0. 28) slit are given in Table 2.5. They are shown in terms of osets on the sky
as well as on the CCD (collimator dependent). The requested slit for an observation is selected by a decker
mask.
See appendix E.2 for the orientation.
The actual LSS slitpositions on the CCD depend also on the
mounting reproducibility of the CCD dewar and may change slightly when the CCD dewar is mounted back
to the instrument after maintenance (typically a few times per year) and following Visitor Mode runs with the
auxiliary E2V detector. However, the centering accuracy of the objects on the slits is not aected by these
variations in the projected slit positions.
Target Acquisition on Slit:
target acquisition on the LSS mask slit can be done in the following ways:
1. in case of fairly bright objects, the fast mode acquisition can be used.
This involves the operator
selecting the target on a direct image of the target eld.
2. for faint sources the acquisition can be done with blind osets - the osets will be executed after centering
a reference star in the method above and verication in the subsequent image of the slit (template
FORS2_lss_obs_slit_fast).
2.4.5
Multi-Object Spectroscopy with Movable Slitlets MOS Mode
MOS Concept:
in the MOS mode up to 19 objects can be observed simultaneously by means of slitlets which
are formed each by two blades mounted on opposite carriers. The slitlets can be moved by linear guides to
any position along the dispersion direction in the eld of view. The slit width of the single MOS slits can be
adjusted to any user dened value. By combining the linear positioning of the slitlets in the focal area with a
rotation of the FORS instrument around its optical axis a wide variety of object congurations can be realized.
MOS Slitlets:
00
19 movable slitlets are available per instrument. Even-numbered slitlets are 20
numbered slitlets 22
00
(projected on the sky).
2
long , odd-
The approximate Y-position within which objects should be
positioned is slightly decreased by parasitic light falling between the slitlets.
Collimator Constraints:
the LSS mode is supported with both collimators but the MOS mode is only
supported with the standard resolution collimator.
Target Acquisition with MOS: MOS observations must be prepared using FIMS. Reference stars are used
to position the telescope and instrument such that the spectroscopy targets are in the slitlets of the predened
MOS mask.
2.4.6
Wide Slit Spectro-Photometry SPECPHOT mode
For high accuracy spectro-photometry a supplementary mode SPECPHOT was introduced which is used
mostly for the monitoring of the instrument response in the framework of the FORS calibration plan. The
MOS slits are opened to 5 arcsecs slit width. By default the slits will be placed to the center of the eld in
dispersion direction. Alternatively the slits can be set to to the position of the FORS longslits or to any user
dened oset position to the edge of the eld of view (see the FORS2 Template Manual for further details).
2.4.7
Multi-Object Spectroscopy with masks MXU mode
FORS2 has a Mask eXchange Unit (MXU) built into its top section. This MXU is a magazine holding up
to 10 masks (made of black painted stress relieved invar sheets of 0.21 mm thickness) laser-cut by the Mask
Manufacturing Unit (MMU) of the VIMOS instrument.
2 The
The purpose of the MXU mode is to allow more
reason is alternating light traps which prevent sky light from falling between the slit blade carriers
FORS User Manual
Grism
VLT-MAN-ESO-13100-1543
λcentral
[Å]
λrange
[Å]
FORS2 standard grisms
GRIS_1200B+97
4350
3660 - 5110
GRIS_1400V+18 (3)
5200
4560 - 5860
GRIS_1200R+93
6500
5750 - 7310
GRIS_1028z+29
8600
7730 - 9480
GRIS_600B+22
4650
3300 - 6210
GRIS_600RI+19 (3)
6780
5120 - 8450
GRIS_600z+23
9010
7370 - 10700
GRIS_300V+10 (1)
5900
3300 - (6600)
GRIS_300V+10
5900
4450 - (8700)
GRIS_300I+11
8600
6000 - 11000
GRIS_150I+27 (1)
7200
3300 - (6600)
GRIS_150I+27 (1)
7200
4450 - (8700)
GRIS_150I+27
7200
6000 - 11000
other FORS2 grisms (not available in Service Mode)
GRIS_1200g+96 (4)
4880
4170 - 5640
GRIS_600V+94 (4)
5850
4430 - 7370
GRIS_600R+14 (4)
6270
5010 - 7690
GRIS_600I+25 (4,5)
7950
6630 - 9390
GRIS_200I+28 (2,4)
7450
5600 - 11000
GRIS_600R+14 (4,5)
6270
5010 - 7690
Table 2.4:
13
dispersion
[Å/mm]/[Å/pixel]
at λcentral
24.0/0.36
20.8/0.31
25.0/0.38
28.3/0.42
50/0.75
55/0.83
54/0.81
112/1.68
112/1.68
108/1.62
230/3.45
230/3.45
230/3.45
1420
2100
2140
2560
780
1000
1390
440
440
660
260
260
260
24.3/0.36
49/0.74
45/0.68
44/0.66
162/2.43
45/0.68
1605
990
1160
1500
380
1160
λ/∆λ
Characteristics of the FORS grisms. The table lists the resolution
case of the standard resolution collimator and for a 0.5
00
λ/∆λ
lter
GG435+81
OG590+32
GG435+81
OG590+32
GG435+81
OG590+32
GG435+81
OG590+32
GG435+31
GG435+31
OG590+32
GG435+31
00
achieved for a 1
slit in
slit in the case of the high resolution collimator at
the given central wavelength in column 2. The wavelength range corresponds to a slit which is located in the
eld center (see Table 2.5 for long slit x-osets). A value in parenthesis indicates the approximate wavelength
at which order overlap occurs. O-center slit positions (for instance with MOS, MXU or other LSS longslits)
shift the wavelength range on the CCD accordingly.
(1) The start wavelength of the 2nd order overlap is given in parenthesis.
(2) This order separation lter (OG550) is cemented to the grism itself.
(3) This grism produces a Y oset on the CCD, see section 2.4.1 for details.
(4) This grism is not available in not part of the Standard Instrument Conguration and is therefore not
available in service mode.
(5) Higher throughput volume phased holographic grisms are available on FORS2
14
FORS User Manual
VLT-MAN-ESO-13100-1543
Longslits of FORS2
slit width
Table 2.5:
slit osets
FORS2 in 15
µm
pixels
sky
CCD SR-mode
CCD HR-mode
2. 5
00
45. 3
00
-362
-723
00
1. 60
00
1. 0
00
0. 51
00
0. 28
00
0. 40
00
0. 70
00
1. 31
00
2. 0
34. 0
00
-272
-544
22. 6
00
-182
-362
11. 3
00
-91
-182
00
0
0
00
91
182
00
182
362
00
272
544
00
362
723
0. 0
-11. 3
-22. 6
-34. 0
-45. 3
Slit widths of the FORS2 longslits and approximate osets relative to the central slit (in pixels on
the CCD). The exact values are determined after each dismounting of the Cryostat (CCD).
objects to be observed simultaneously than with the 19 slitlets MOS unit. Furthermore it gives more freedom
in choosing the location, size and shape of individual slitlets. MXU spectroscopy is only oered in the standard
resolution mode of FORS2.
It is recommended that observers in Visitor Mode prepare the masks design or get familiar with MXU mask
preparation before their arrival on Paranal (usually 3 days before the start of their observation run). Mask
manufacturing and installation is only done at day time. Therefore the mask manufacturing has to be initiated
1 day before starting the observations. Only up to 10 masks can be stored in the magazine and observed in
one night.
MXU Slits:
boundary conditions for the MXU slits are:
00
00
1. slit width: 0. 1 (minimum) to 30
00
2. slit length: up to 30
3. available eld of view:
X: minus 15mm at either end; this is indicated by FIMS.
Y: full eld of view
4. slit shapes: rectangular, circular, and curved slits.
Acquisition Accuracy:
With the improved astrometry of FORS2 with the MIT CCDs the targets can be
properly placed on the slits all over the unvignetted eld of view in standard resolution mode.
Collimator Constraints: only observations with the SR collimator are supported.
Target Acquisition with MXU: The MXU mask design has to be prepared with
FIMS. The alignment
of the mask on the sky is done with user dened reference stars and with pre-dened reference slits on the
bottom of the upper CCD.
2.4.8
Slitless Spectroscopy
Slitless spectroscopy can be performed in MOS mode with all slits open. Please not that the sky background
will be the same as for imaging mode observations and jitter osets between the exposures must be applied to
achieve a good sky subtraction.
For the preparation of observations in slitless spectroscopy a very good understanding of the instrument optics
is essential: Note that the 0th order of grisms 150I and 200I will fall into the eld of view of FORS and
contaminate 1260 and 480 unvignetted pixels on the left/blue side of the eld of view of FORS2 (unbinned
15
µm
pixels). Any observation with lters of wavelengths which are o the central wavelength of the grism
will cause eld vignetting which can cut the eld on both sides depending on the sign of the wavelength oset
between lter and grism. Depending on the length of the spectra (the requested lter) the targets should be
more than half the length of spectra o the zero order and the eld vignetting!
FORS User Manual
VLT-MAN-ESO-13100-1543
15
2.5 Polarimetry with FORS2
Polarimetry Concept:
the polarimetric modes allow the measurement of linear and circular polarization,
both for direct imaging and spectroscopy.
The polarization optics are located in the parallel beam section
and consists of a Wollaston prism as beam splitting analyser and two superachromatic phase retarder plate
mosaics (9 individual plates arranged in a square mosaic frame) to measure linear and circular polarization.
Both mosaics are installed in rotatable mountings on a dedicated swing arm which can be moved in and out
of the light path. The Wollaston prism is inserted in the uppermost wheel of the parallel beam section.
2.5.1
Imaging Polarimetry IPOL mode
Strip Mask for Imaging Polarimetry IPOL:
for imaging polarimetry (IPOL) of extended objects or
crowded elds a strip mask is produced in the focal area of FORS2 to avoid overlapping of the two beams of
polarized light on the CCD. When using the standard resolution collimator the strip mask is formed by placing
every second MOS slit jaw carrier arm (odd numbered MOS slits) across the eld of view of the instrument.
A full coverage of the imaging eld of view is then achieved by taking two frames displaced by 22
00
in direction
of the MOS slitlets. For the high resolution collimator a separate pre-manufactured strip mask of slits of 11
is moved into the focal area of FORS2.
#1
#2
#3
#4
#5
#6
#7
MOS stripes
#8
o
e
polarisation
optics
split stripe into
e-ray and o-ray
stripe pairs
on the CCD
#2 #2 #4 #4 #6 #6 #8 #8
Figure 2.5:
For imaging polarimetry (IPOL) of extended objects or crowded elds a strip mask is produced
in the focal area of FORS2 to avoid overlapping of the two beams of polarized light on the CCD.
Field Coverage:
since with IPOL observations only half of the full eld of view of the instrument is imaged
on the CCD in one exposure, the complete eld coverage can only be achieved by o setting the telescope
accordingly in between exposures.
Retarder Plate Angles:
the retarder plate angles can be selected from a set of xed predened angles (see
Table 2.6).
Filters for IPOL:
all imaging lters (see section B) can be used except the ones that are located in the
Wollaston wheel in the instrument standard conguration (see section 2.1). The use of the latter ones is in
16
FORS User Manual
Retarder Plate
circular
linear
VLT-MAN-ESO-13100-1543
Position Angles (deg)
-45, 45, 135, 225
0, 22.5, 45, 67.5, 90, 112.5, 135, 157.5
180, 202.5, 225, 247.5, 270, 292.5, 315, 337.5
Table 2.6:
The table lists the angles of the predened retarder plate positions which can be selected for
imaging and spectropolarimetry.
To achieve the highest accuracy we are recommending to take exposures
with the highlighted plate position angles.
principle possible, but requires a reconguration of the instrument. This, however, is considered for visitor
mode observations only and needs a-priory approval by the observatory before proposal submission.
Target Acquisition in IPOL:
Only Fast modes are available.
In the fast mode the object is selected at
the instrument console by mouse click in an acquisition image and the telescope is then oset such that the
target is at the center eld position of MOS slit 10. FIMS can still be used (PMOS mode with all slits open)
to simulate the focal eld geometry in cases of rather complex target distribution.
2.5.2
Spectropolarimetry PMOS mode
MOS Slit/Strip Mask for Spectropolarimetry PMOS: spectropolarimetry (PMOS) using MOS slitlets
is possible with the standard resolution collimator only. In this mode the MOS slitlet arms with odd numbers
are positioned to form the same strip mask as for imaging polarimetry. The even numbered slitlets are available
as in the normal MOS mode, i.e. they can be positioned on the objects in the eld of view.
Slitless Spectropolarimetry:
slitless spectropolarimetry can be implemented for SR collimator in a similar
way as for MOS, but keeping the odd MOS slitlets in close position. See section 2.4.8 for general comments
on slitless spectroscopy.
Grisms and Filters for PMOS:
all grisms (but GRIS_600z+23, GRIS_150I+27 and GRIS_600RI+19)
together with the recommended order separation lters can be used in PMOS mode. The above mentioned
grisms are congured for the Wollaston wheel and can't be mounted in the grism wheel. Other lters together
with these grisms can be used if the lter is not mounted in the Wollaston wheel (see section 2.1).
Retarder Plate Angles:
the retarder plate angles can be selected from a set of xed predened angles (see
Table 2.6).
Collimator Constraints: spectropolarimetry PMOS is possible only with the SR collimator.
Target Acquisition for PMOS: Fast and FIMS based acquisition modes are available but fast mode can only
be applied for single target observations. Multi-object spectro-polarimetry will require mask preparation with
FIMS. The fast mode will put the selected object on MOS slit 10 moved to the eld center. The other MOS
slits are set-up to the same position and slit width like slit 10 and can serve for sky background measurements.
Blind oset acquisitions are supported.
2.5.3
Performance of the Polarimetric Modes
The polarization optics allow the determination of the degree of polarization to a relative error of
< 3 × 10⁻⁴
◦
and of the position angle (depending on the target polarization) to about 0.2 . For observation in the center
−4
of the eld no instrumental polarization was found at the detection level of our measurement of < 3 × 10
.
−4
For o-axes measurements (3 arminutes oset) spurious polarization of up to ∼ 8 × 10
was detected in some
measurements (circular polarization in this case).
Important update on the instrumental polarization:
When the polarisation optics were mounted in
FORS1, we found a strong linear instrumental polarization in the corners of the eld of view. This spurious
−4
polarization eld shows a high degree of axial symmetry and smoothly increases from less than 3x10
optical axis to 7x10
−3
on the
at a distance of 3 arcmin from it (V band). There is currently no data available in case of
the other lters and spectro-polarimetric measurement. The corrective functions can be estimated with an observation of a globular cluster with the respective lters and details of such work can be found on the FORS webpage (http://www.eso.org/sci/facilities/paranal/instruments/fors/inst/pola.html). There was no
problem for spectro-polarimetric, or imaging polarimetry observations of single targets in the center of the
FORS User Manual
VLT-MAN-ESO-13100-1543
17
eld of view. In case of the circular polarization the spurious polarization was found an order of magnitude
smaller.
We intend to repeat the analysis for FORS2 and will report the results once they are known. We expect the
results to be qualitatively the same for FORS2 as they were for FORS1.
18
FORS User Manual
VLT-MAN-ESO-13100-1543
2.6 High Time Resolution Modes
2.6.1
Overview
The principle of the high time resolution (HIT) mode is to move the charges in positive x-direction on the
CCD while integrating the incoming light with the exposure shutter open. The time resolved spectra or light
curves are stored on the CCD which is then read out at the end of the sequence with the mode of lowest read
out noise (100kHz,2x2,high).
The HIT mode allows Imaging observations of one or more targets, as well as spectroscopic observations of up
to two targets. The imaging mode uses the MOS to create a pseudo-longlit on the extreme left-hand side of
the unvignetted eld of view. Whereas the spectroscopic mode uses re-dened (in the case of HIT-S mode) or
user-dened (in the case of the HIT-MS mode) masks installed in the FORS2 mask exchange unit (MXU). The
position angle of the instrument can be selected such that a second target may be observed simultaneously
in the imaging and HIT-MS modes. Please note that the HIT mode observations are only congured for the
standard resolution collimator COLL_SR.
One shift mode denotes that the charges are moved at constant speed on the detector until the complete
detector is used as storage for the data. A part of the FORS2 MIT detector mosaic is vignetted by the FORS2
top unit. Therefore not all 4096 columns can be used to store the data, but only 3548 columns. The charges
are moved over this number of columns in the user specied times of 1, 4, 16, 64, or 256 seconds. The resulting
frequencies of 0.28 to 73 pixels/millisecond are not however the eective time resolution - the time resolutions
is reduced by the seeing (in the case of a wide slit) or the slit width in units of pixels. This corresponds to
the number of shifts a pixel remains in the exposed region for. For an image scale of 0.125/px and a seeing of
1 the time resolutions would be between 2.3 milliseconds and 0.56 seconds for the fastest and slowest modes
respectively.
HIT mode name
one-shift time
HIT-OS1-1sec
1s
HIT-OS2-4sec
4s
HIT-OS3-16sec
HIT-OS4-64sec
HIT-OS5-256sec
time resolution
0.0023s/
16s
64s
256s
0.56s/"
The readout mode (100kHz,2x2,high) was selected to give the lowest possible readout noise level. All frames will
be binned at readout time. The CCD parameters like the binning are deeply hidden in the CCD conguration
le and can not be changed during normal operation. About 40 seconds overhead time is expected to readout
the full mosaic detector and to handle the data les.
The fundamental problem with the HIT-I and HIT-S modes is that even smallest image motions due to
atmospheric eects or residual guiding osets will strongly compromise the photometric accuracy of the measurements when used in conjunction with a wide-slit. The respective targets will appear brighter while the
residual image motion is in direction of the moving charges on the CCD. High accuracy photometry can not
be done with the HIT modes unless a nearby star can be used as a reference source!
2.6.2
High Time Resolution Mode Imaging (HIT-I)
The MOS slits will be placed to the extreme left side (-3 arcminutes) and opened to a user dened (typically
broad) slit width.
The mode (HITI) can be used with any available FORS2 lter of the FORS2 standard
conguration and the exchangeable interference lters. Accurate photometry on a 1% level is only possible if
there is a nearby star observed simultanously on the slit as a ux reference. Another requirement is to select
a slitwidth which is larger then the actual seeing. The residual guiding osets would reduce the performance
to about the 10% level, without the dierential measurement of a reference star. The atmospheric eects on
the image motion would be only corrected in case of a reference star within the isoplanatic angle. This eect
is however thought to be relatively small for large telescopes.
FORS User Manual
2.6.3
VLT-MAN-ESO-13100-1543
19
High Time Resolution Mode Spectroscopy (HIT-S)
The readout direction is for FORS2 in spectral direction for the standard FORS2 grisms.
disperser grisms XGRIS_600B and XGRIS_300I can be used for the the HITS mode.
Only the cross-
There are 7 masks
available with slit widths between 0.5 and 5 arcseconds. The absolute photometric accuracy will be poor, since
it is not possible to do a dierential photometric measurement with a 2nd star on a slit. Equivalent widths
of lines and for a wide slit also the colors should be less compromised by the image motion. Same as for the
imaging mode: The slits are on the extreme left side of the eld of view oset by about -3 arcminutes. The
slits are little squares. The grism XGRIS_300I can be used with order separation lter OG590 or without.
In the later case there would be some 2nd order overlap typically at the red end of the 1st order where the
CCD response would be reduced. The 2nd order overlap would start at
at wavelengths above about
>8000Å
>6600Å
but would become important
depending on the color of the target. The following slit masks will be
available:
mask name
slit width
HITS_0_5+900015
0.5
HITS_0_7+900016
0.7
HITS_1_0+900017
1.0
HITS_1_3+900018
1.3
HITS_1_6+900019
1.6
HITS_2_0+900020
2.0
HITS_5_0+900021
5.0
The respective rotated grisms are identical copies to the standard FORS2 grisms (600B, 300I). The wavelength
range of the grisms are however slightly dierent from the standard ones.
This is primarily caused by the
asymmetric mount of the FORS2 MIT CCD mosaic which is o-centered by 33.
FORS2 cross disperser grisms for the HITS mode
Grism
λcentral
λrange
dispersion
[Å]
[Å]
[Å/mm]/[Å/pixel]
λ/∆λ
λcentral
XGRIS_600B+92
4452
3300 - 6012
50/0.75
780
XGRIS_300I+91
8575
6000 - 11000
108/1.62
660
XGRIS_300I+91
8575
5032 - (6600)
108/1.62
660
The central wavelength is dened as the wavelength
λcentral
lter
at
OG590+32
in the center of the eld of view.
The gap
between the two CCDs will cause a gap of about 7 pixels in the spectra at a wavelength of approximately
λcentral − 267 px×
2.6.4
dispersion.
High Time Resolution Mode Multiple-Shift Mode (HIT-MS)
A multiple-shift (MS) mode is also available. This mode is predominantly implemented for fast spectroscopy
and allows a block of rows to be shifted together, rather than a single row as is the case with the previously
implemented one-shift (OS) mode. In the MS mode, two user-dened slits can be used (with a mask manufactured for the MXU) which place the spectra of the target and a comparison star (for slit loss determination)
onto a small region of the CCD. After a pre-dened wait time, the rows of the CCD are rapidly (in
50
microsec) shifted, causing the exposed region to be moved into the storage area (the unexposed region) of
the CCD and a new region to be illuminated. This 'shift and wait' scheme continues until the rst pair of
spectra taken reach the limit of the storage region and the CCD is subsequently read-out in the normal way.
This HIT-MS mode is oered in visitor mode with either the MIT or E2V mosaics. It is oered with two 5
long slits (allowing 41 pairs of spectra per CCD readout), or a single 10" long slit and a user-dened slit-width.
The position angle of the rotator is determined so that the target and comparison slits fall onto adjacent xpixels on the CCD. The y-pixel positions of the two slits are determined by the oset between the target and
the comparison star. This oset also determines the relative spectral coverage of the two spectra. Osets in
the range 5 - 300 are possible, but it is recommended to choose a comparison with a separation of
<60
to
ensure a reasonable ux calibration. Please contact the FORS instrument scientist ([email protected]) for updates
and further information.
20
FORS User Manual
Visitor mode only!
VLT-MAN-ESO-13100-1543
The cross disperser grisms are not included in the FORS2 standard conguration.
There will be no instrument setup changes according to the service mode rules and accordingly the spectroscopic
HITS mode is only oered in visitor mode! (HITI - imaging mode is oered both in visitor and service mode).
2.6.5
OB-preparation
The HIT mode templates for modes HITI and HITS are of fast mode target acquisition type, whereas
the HIT-MS mode is ms based.
There is no mask preparation required for the phase 2 observation block
(OB) preparation except for the HIT-MS mode. There are special templates available for the modes: Three
observation templates for the night time science observations for target acquisitions, through slit images and
the science observation. Additionally at eld templates for HITI, HITS and HITMS mode and an arc line
spectral template for HITS and HITMS modes.
For the HITI (imaging) mode the OB would consist of three templates in the following order:
FORS2_hiti_acq_fast
target acquisition
FORS2_hiti_obs_slit_fast
through slit image
FORS2_hiti_obs_exp_fast
science exposures
Very similarly in case of the HITS spectroscopic mode:
FORS2_hits_acq_fast
target acquisition
FORS2_hits_obs_slit_fast
through slit image
FORS2_hits_obs_exp_fast
science exposures
And nally in case of the HITMS spectroscopic mode:
2.6.6
FORS2_hitms_acq
target acquisition
FORS2_hitms_obs_slit
through slit image
FORS2_hitms_obs_exp
science exposures
Calibration plan
The bias frames of the normal spectroscopic modes can be also used for modes HITI, HITS and HITMS. This
is not the case for ats elds and arcs of course.
The at eld frames and arcs should not depend on the
selected readout speed. The observatory sta will dene an appropriate readout speed for which well exposed
calibration frames can be achieved. For the other readout speeds it is typically impossible to get the exposure
level right. Night time standard stars are to be selected by the HIT mode users and the respective observation
blocks are to be prepared by the users. In the case of the HIT-MS mode, a separate MXU mask will need to
be prepared for the spectrophotometric standard.
2.6.7
Performance on the sky
HIT-S
The limiting magnitudes to reach a signal to noise ratio of
S/N = 5
as obtained in every 2x2 binned pixels for
the dierent grisms are given below. The value was calculated for the center of the wavelength range at dark
time. The S/N would drop strongly in the blue part of grism 600B. For the spectroscopic mode the S/N is
independent of the seeing for the very wide slit, but time resolution and spectral resolution would both become
worse in case of a bad seeing. Here for the slowest readout mode of 1024 seconds per one-shift:
grism
limiting magnitude
XGRIS_600B
15.8
XGRIS_300I
15.9
FORS User Manual
VLT-MAN-ESO-13100-1543
21
The expected number of counts per binned pixels can be derived by the following equation for a 10th magnitude
3
star , a dispersion of 0.75 Å/ pxl, response
counts
∼ 0.17,
0.75 Å/pxl and an OS-time of 256s:
=
time
∗ bin2
3548
1000 ∗ 10−0.4∗10 ∗ π ∗ 4052 ∗ 0.17 ∗ 0.75 ∗ 0.00028 ∗ 256 ∗ 22
=
1757 photons
=
flux ∗ π ∗ R2 ∗ resp ∗ disp ∗
(2.1)
(2.2)
(2.3)
HIT-I
In case of the imaging modes the number of parameters like seeing, night sky brightness,. . . and the number
of lters is very high and it's hard to present a meaningful table with limiting magnitudes here. The expected
count rates integrated in spatial direction (no slit losses) for a lter width of 1115Å are estimated by the
following equation for a 15th magnitude star:
counts
time
∗ bin
3548
= 1000 ∗ 10−0.4∗15 ∗ π ∗ 4052 ∗ 0.3 ∗ 1115 ∗ 0.00028 ∗ 256 ∗ 2
= 17288 photons
=
flux ∗ π ∗ R2 ∗ resp ∗ fwhm ∗
You may have to distribute the 17000 photons over the PSF and to devide with the gain factor of 0.7e
(2.4)
(2.5)
(2.6)
−
/adu
to estimate peak ux values and the integrated signal to noise ratio.
HIT-MS
Since the exposure time and slit width are free parameters, the limiting magnitude for the HIT-MS mode is the
same as that for the traditional spectroscopic modes. The only dierence is that the charge remain stored on
the detector for longer and are therefore subject to correspondingly higher dark current and cosmic ray events.
For this reason, the HIT-MS mode is best suited to short exposures, which would otherwise be impossible (or
prohibitively expensive in terms of overheads).
3 1000 ∗ 10−0.4∗10 photons ∗ cm−2−1 s−1
to remember.
at 5500Å - the 1000 photons at 5500Å for a 0th magnitude star is just a nice number
22
FORS User Manual
VLT-MAN-ESO-13100-1543
2.7 Rapid Response Mode (RRM) for FORS
The Rapid Response Mode (RRM) is oered for observations of transient phenomena such as gamma-ray
bursts or supernovae in semi-automatic mode.
The user (PI or Co-I of an approved target-of-opportunity
program) submits an ftp le with the coordinates of the target to a specic ftp server on Paranal. A special
program at the telescope continuously monitors this ftp directory; when it detects a le, it checks if the lename
corresponds to an approved activation code, and if this is the case, the on-going observations are ended, and
a new BOB starts an OB with the same name as the ftp le.
The telescope automatically presets to the
coordinates specied in the ftp le, and the requested observations are performed straight away.
PIs of approved FORS ToO programs requesting this mode need to prepare their OBs in the usual way.
However, these RRM programs use specic acquisition templates described in the FORS Template Reference
Guide. More information on the RRM can be found on the USD Phase II webpages
(http://www.eso.org/observing/p2pp/rrm.html).
FORS User Manual
VLT-MAN-ESO-13100-1543
23
2.8 Detectors
2.8.1
General Properties
Chip Characteristics, Pixel Number and Size, CCD Control:
consists of two 2k×4k MIT CCDs (the pixel size is 15
×
15
µm),
The standard detector mosaic of FORS2
thinned and anti-reection coated. The E2V
mosaic, previously installed on FORS1, is a mosaic of two blue optimised 2k×4k E2V CCDs, with the same
pixel size (15
×
15
µm).
In both mosaics the detectors are at and the bottom ('chip 2') detector is rotated
and shifted with respect to the upper ('chip 1') detector.
The most accurately determined values for this
rotation and shift can be found in the header keywords for the respective detectors and they are summarised
in Table 2.7.
Detector Mosaic
rotation
X-oset (µm)
Y-oset (µm)
MIT
0.08
30.0
480.0
E2V
0.025
-10.5
1390
Table 2.7:
The detector geometry of the 2 mosaic detectors.
The CCDs are controlled by FIERA controllers. The obvious dierence between the detector mosaics is the
response which is optimised for wavelengths
>600 nm for the MIT mosaic (with low fringing level) and for the
E2V mosaic, the response below 550 nm, and especially below 450nm. For this reason, users should consider
carefully which detector is best suited to their scientic goals, remembering that the E2V detector is available
in Visitor Mode only.
Read-out Modes:
The default readout modes for both mosaics are 200kHz,2x2,low for imaging (2x2 binned,
low gain mode read with 200kHz) and 100kHz,2x2,high for spectroscopy. For special applications such as high
resolution imaging or deconvolution techniques the following modes are supported: 200kHz,1x1,low (Imaging)
and 100kHz,1x1,high (Spectroscopy).
Standard Operation Modes of the CCDs:
the following standard CCD set-ups are oered for service
mode observations:
•
200kHz,2x2,low direct imaging IMG, OCC and imaging polarimetry IPOL
•
100kHz,2x2,high spectroscopy LSS, MOS, PMOS and MXU
Additional Operation Modes: the following CCD set-ups are available in service mode only with a pre-approved
waiver:
•
200kHz,1x1,low direct imaging IMG, OCC and IPOL
•
100kHz,2x2,high spectroscopy LSS, MOS, PMOS and MXU
Visitor mode observations allow the full complement of CCD read-outs. However, it is strongly recommended
to use the standard read-out modes whenever possible (for instance to benet from the calibration data taken
in the context of the FORS instrument calibration plan).
Window Read-out: window read-out is not supported with either mosaic.
Noise, Gain and Conversion Factors: the read-out noise (RON) and conversion factors (K) as measured
on the site for all CCDs are given in Tables 2.8. Please note that low gain denotes high charge conversion
factors K (in e
−
/adu)
and slightly higher readout noise. Pickup noise is clearly visible for the fast imaging
modes and in some exposures of the slow spectroscopic mode with the MIT CCDs.
Linearity, Full Well Capacity, Dark Current etc.:
some more characteristic data of the CCDs are given
in Table 2.8.1. None of the CCDs will saturate before reaching the numerical truncation limits (65535 adu).
Read-out Speed and Times:
the detectors readout speed are 200 kHz and 100 kHz for the imaging and
spectroscopic modes with both E2V and MIT mosaic detectors. Approximate readout times for various modes
are given in Table 2.10.
24
FORS User Manual
Figure 2.6:
VLT-MAN-ESO-13100-1543
Quantum eciency of the MIT (red) and E2V (blue) CCDs.
The individual curves show the
slight dierence in QE of the 2 detectors in each mosaic. The dashed line shows where the fringing will limit
the S/N achievable with the E2V detector.
E2V CCDs mosaic
−
]
K [e
−
MIT CCDs mosaic
RON [e
/ADU]
−
]
K [e
−
read-out mode
chip1
low, 200kHz
5
2.24
4.1
1.25
chip2
low, 200kHz
5
2.60
4.2
1.25
chip1
high, 100kHz
3
0.55
2.7
0.70
chip2
high, 100kHz
3
0.60
3.0
0.70
Table 2.8:
2.8.2
RON [e
CCD
/ADU]
Detector readout noise and conversion factors.
Fringes
MIT CCDs:
The amplitudes of the internal CCD fringes are strongly reduced in respect to the old Site and
Tektronix CCDs and the E2V mosaic. For Bessel I imaging fringes are hardly visible (circular fringes from the
lters are however visible for I_BESS and R_SPECIAL lters). For z_Gunn imaging the fringe amplitudes
are below 1% and in the strongest telluric lines in spectroscopic modes fringe amplitudes were found to be of
the order of 5% in the worst cases. The MIT mosaic is most suited for any observation
E2V CCDs:
detector.
The fringe amplitude of the new E2V mosaic at
>650nm
>
650nm.
is much larger than for the MIT
The fringes will remain in the night sky background in imaging modes with lters of a central
wavelength
>
650nm even after the at elding of the data. For the further data reduction it will be required
to subtract the scaled night sky background from the frames. In spectroscopic modes only a partial correction
of the fringe can be obtained from the at elding. At wavelength
>650nm,
signal noise ratio of
>15
may not
be obtained due to the residual of the fringe corrections. Sky subtraction at these wavelengths will require that
the target is observed at oset positions (nodding on the slit). This will however not correct for the residual
fringes in the extracted science spectra.
Jitter and nodding on the slit:
It will be mandatory to use oset techniques (jitter images, nodding on the
slit) to subtract the sky background at wavelengths greater
∼800nm
for spectroscopy and due to the detector
cosmetics at any wavelength in imaging mode. The fringes are quite stable but depend on the spectrum of the
night sky which will be variable. To subtract a scaled master sky will give quite reasonable results even at z-
FORS User Manual
VLT-MAN-ESO-13100-1543
25
Parameter
E2V mosaic
MIT mosaic
photosensitive pixels (HxV)
2*4096*2048
2*4096*2048
pixel size (µm)
15
dark current at 120C (e
−
/px/h)
linearity (up to full well; % RMS)
2
cosmic ray rate (events/min/cm )
TBD
15
∼
3
TBD
TBD
TBD
TBD
Table 2.9: Basic characteristics of the FORS2 CCDs. H = horizontal, V = vertical.
readout area
speed, binning, gain
total readout time
default mode for:
E2V mosaic
2×4k×2k
100kHz,2x2,high
39s
spectroscopy
2×4k×2k
100kHz,1x1,high
78s
high spatial resolution spectroscopy
2×4k×2k
200kHz,2x2,low
28s
imaging
2×4k×2k
200kHz,1x1,low
56s
high resolution imaging
2×4k×2k
100kHz,2x2,high
41s
spectroscopy
2×4k×2k
100kHz,1x1,high
82s
high spatial resolution spectroscopy
2×4k×2k
200kHz,2x2,low
31s
imaging
2×4k×2k
200kHz,1x1,low
62s
high resolution imaging
MIT mosaic
Table 2.10:
Approximate CCD readout times in the dierent read-modes. The read-out times include the
overheads during the exposure execution (for CCD wiping, header compilation).
band wavelengths where observations without jitter or nodding will be very hard to calibrate. Most applicants
will observe fainter targets with 8m-class telescopes while the sky will be as bright as with any other telescope.
2.8.3
Shutter
FORS contains a rotating half-segment exposure shutter which guarantees uniform illumination of the CCD
to the 1 % level or better for exposure times as short as 1 sec (the shortest possible exposure time is 0.25 sec).
2.9 The Calibration Units
FORS2 contains two sets of internal calibration lamp units in its top section.
The light from a variety of
calibration lamps is projected onto a calibration screen inside the telescope, located approximately 2.5m above
the instrument.
All lamps can be switched on and o individually and in several combinations by means
of calibration templates (see http://www.eso.org/sci/facilities/paranal/instruments/fors/docs). Blue and red
at eld lamps as well as Neon and Argon arc lamps are installed in both calibration units. He and HgCd
arc lamps are only installed in one of the two calibration units. A guide to approximate exposure times is
given in sections 4.4 and 4.5, a spectral atlas of the FORS spectral calibration lamps in appendix D. The
red internal at eld lamps (FlatRed+1 and FlatRed+2) can't be used anymore after the installation of the
external calibration units. The control electronics of the respective lamps is now used by the external units
(see below).
External Calibration Units:
the ateld lamps in the old internal calibration units have produced parasitic
light in MOS and LSS ateld exposures. Therefore, new external calibration units (ECUs) have been installed
which are located above the LADC in the Cassegrain tower. The new calibration units consist of two blue
and two red lamp which are linked to the Cassegrain tower with a ber bundle. One of each red and blue
lamps will be projected into the ber bundle in focus (high illumination level) while the other lamps are out
of focus of the projection optics. Only one of the two red and one of the blue lamps can be used at a given
time. The ECUs are the only calibration units used for spectroscopic ats elds. Actually we use the faint red
lamp together with the bright blue lamp such that there is a secondary peak in the at eld spectrum which
may appear odd on the rst view.
Nighttime Calibrations:
For technical reasons the arcs and ats are
only taken at day time with the telescope, guide probe, LADC parked and the beam shutter (identical with
the calibration screen) closed.
26
FORS User Manual
VLT-MAN-ESO-13100-1543
2.10 'Retired' Instrument Components/Modes
•
Table 2.11 lists the instrument components which are no longer oered for FORS and the time period
during which they were used.
Removed Component
Used in
Availability
Reason for
Replacement
Removal
H_Alpha+59
FORS1+2
1/4/99-30/9/00
ghosts
H_Alpha+83
GRIS_600z+16
FORS1
1/4/00-31/3/01
low response
GRIS_600z+26
1/4/00-31/3/02
GRIS_600R+24
FORS2
low response
GRIS_600RI+19
XGRIS_600V+90
FORS2
no red Echelle
none
XGRIS_300I+91
FORS2
no red Echelle
none
2k×2k Site CCD
FORS2
1/4/00-31/3/02
red optimization
MIT mosaic
GRIS_600z+26
FORS1+2
1/4/00-31/9/02
low response
none
GRIS_600I+15
FORS1
1/4/00-31/3/07
low response
none
GRIS_300I+15
FORS1
1/4/00-31/3/07
low response
none
Table 2.11: Retired instrument components
•
The Echelle mode with the two conventional grisms was known to perform bad in terms of its instrument
response.
It was ocially decommissioned in P77.
To replace it a new volume phased holographic
grism has been installed whith a response 3x higher than the Echelle mode (or the respective 2nd order
observations which also show relatively low performance). The wavelength range is 3730 to 4970 Å with
the central wavelength at 4340Å and a dispersion of 0.61 Å/pxl. The spectral resolution is equal to 1420
for a slit width of 1.
•
The Second-order observations were not supported beyond P82, as there was little or no demand for
them and the space was needed in the instrument for more frequently used Grisms and lters.
•
The MOS was not oered with the HR-collimator following the upgrade of FORS1 to the E2V mosaic.
Users should use the un-binned mode instead for applications requiring such observations.
•
Table 2.12 lists the readout noise and conversion factors of the old FORS1 and FORS2 CCDs.
old Tektronix FORS1 CCD
−
old SITE FORS2 CCD
A
high
5.13±0.11
1.37±0.02
5.2±0.1
1.85±0.03
]
K [e
−
RON [e
/ADU]
RON [e
−
gain
]
K [e
−
port
/ADU]
B
high
5.57±0.11
1.70±0.04
5.5±0.1
2.00±0.02
C
high
5.76±0.10
1.62±0.02
5.3±0.1
1.90±0.02
D
high
5.87±0.15
1.73±0.03
5.5±0.1
1.83±0.05
A
low
5.89±0.16
2.74±0.06
5.6±0.1
2.62±0.03
B
low
6.23±0.17
3.35±0.06
5.9±0.1
2.81±0.05
C
low
6.27±0.10
3.17±0.05
5.8±0.1
2.68±0.04
D
low
6.40±0.15
3.31±0.06
5.7±0.1
2.61±0.03
Table 2.12: The old FORS1 and FORS2 CCDs
Detector readout noise and conversion factors of the old Tektronix and SITE FORS1 and FORS2 CCDs.
Port A of FORS1 is the lower left, B the lower right, C the upper left and D the upper right quadrant.
Chapter 3
Observing with FORS
All observations with FORS are done via observing blocks (OBs). OBs contain of the target information
and a small number of users selected observing templates depending on the observing mode. The users will
ll out the parameter elds (keywords) of the templates (eg. grisms, lters, slits). All the preparations are
done with the phase 2 proposal preparation tool p2pp. Furthermore FORS masks will have to be prepared
with the FORS instrument mask simulator FIMS. The detailed information for the observation preparation
are given in the p2pp-manual, the FORS template manual and the FIMS-manual. The instructions how to
retrieve the manuals from the WEB pages are given in Section 1.
The strategy behind (observing blocks and templates) is to prepare the observations well in advance to minimize
any interactive steps during the observations (optimization and service mode compatibility). The execution
of the OBs will be mostly automatic and the execution will be done by telescope and instrument operators or
the sta astronomers. Direct interaction at execution time is needed only for the target identication and the
quality control of the data or for real time decisions. In the following we summarize the steps from a successful
application to the nal access of the data.
The preparation of service mode observations will require special care, some more rules and recommendations,
since unclear points in the service mode packages will signicantly delay the execution of the project. The
additional requirements and instructions for service mode observations are available on WEB pages:
http://www.eso.org/observing/p2pp/
http://www.eso.org/observing/p2pp/ServiceMode.html
3.1 Selecting the Observing Mode
The rst step is to select the best observing mode according to the scientic needs. In some cases there will
be a choice between eg.
MOS and MXU mode for example to observe 10 targets well distributed over the
FORS eld of view and in this case the optimization of the strategy will start at this point. In most cases the
observing modes will be pre-dened and only a limited number of observing templates are needed and have to
be studied with the help of the FORS template manual in detail.
3.2 Fast modes or FIMS mask preparation
All multi-object observations in modes MOS, MXU and PMOS will require the preparation of mask with
FIMS. Occulting bar imaging and slitless spectroscopy is only supported with ms-based modes. Typically
the mask design has to be ready before starting the preparation of the observing blocks.
Meanwhile all observations in modes IMG, IPOL and LSS are done without using FIMS - as well as single
target observations in "PMOS" mode. For faint targets we support blind oset acquisition modes for all the
fast modes (this is done with the through slit templates). The astrometric requirements are similar for blind
27
28
FORS User Manual
VLT-MAN-ESO-13100-1543
fast acquisitions and FIMS acquisitions. In general the OB execution in fast mode won't be much faster than
the FIMS mode, but the OB preparation will be.
3.3 Selecting the Instrument Setups and Exposure Times
A good understanding of the instrument is required, before starting the preparation of the observing blocks.
It is possible to dene observing sequences which don't make any sense - both within FIMS and within p2pp.
Inconsistencies should be eliminated by the user, although a cross check of the OBs will be done both in visitor
and service mode by verication scripts or the sta astronomers. It will be one of the rst steps to dene the
instrument setups (chapter 2) and to calculate the exposure times with the exposure time calculator.
3.4 OB-preparation FIMS based modes
1. Get your pre-imaging data or other astrometrically corrected images (see section 2.4.2)
2. Select the observing mode, the instrument setup and calculate the exposure times with the exposure
time calculator
.fims to reload the mask if
.p_targ, .p_focf (and .p_gbr for MXU mode) for the OB
FIMS in directory ∼/.fims/SET/
3. Prepare your masks with FIMS and keep the ms output le with sux
needed and the output les with extensions
preparation. These les will be saved by
4. Make a hard-copy of the mask conguration within FIMS on which the reference stars and slits are well
visible and a few hard-copies of the same masks with high magnication. This will be the typical set of
nding charts needed at the end
5. Prepare the observing blocks - a typical OB in imaging mode (with occulting bars OCC mode) will
consist of two templates:
FORS2_img_acq_align
target acquisition
FORS2_img_occ_crsplit
science exposure
or similar for imaging polarimetry:
FORS2_ipol_acq
target acquisition
FORS2_ipol_obs_o
science exposures
For all spectroscopic modes a through slit image is required to verify the proper centering of the target on the
slit. For observing modes MOS, MXU, LSS or PMOS the OB would typically consist of the following three
templates:
FORS2_mos_acq
target acquisition
FORS2_mos_obs_slit
through slit image
FORS2_mos_obs_o
science exposures
here the MOS mode as an example but with an identical sequence of observing templates for the other
spectroscopic modes.
In case you want special calibrations not included in the FORS calibration plan (section 4.1) a calibration OB
has to be prepared which would look like the following scheme (again for the MOS mode example):
FORS2_ima_cal_coll
collimator selection
FORS2_mos_cal_daycalib
screen ats & arcs
where the rst template is only used to select the collimator.
There are a few important points to be veried now:
1. don't mix observing modes in one OB
FORS User Manual
VLT-MAN-ESO-13100-1543
29
2. make sure that all ms input les belong to the same mask - in general only one mask per OB is possible:
The keyword INS.FIMS.NAME on the top of the p_focf, p_targ and p_gbr les must be identical.
3. be sure that the requirement for reference stars (and reference slits in MXU mode) are fullled - the
details about the reference star selection are explained in the ms manual
3.5 OB-preparation Fast modes
1. Get any imaging data and good target coordinates and very good astrometry in case of blind oset
acquisitions (see section 2.4.2) and prepare nding charts with targets, slit positions and reference stars
for blind oset acquisitions
2. Select the observing mode, the instrument setup and calculate the exposure times with the exposure
time calculator
3. Prepare the observing blocks - a typical OB in imaging mode (fast IMG mode) will consist of two
templates:
FORS2_img_acq
target acquisition
FORS2_img_obs_crsplit
science exposure
or similar for imaging polarimetry:
FORS2_ipol_acq_fast
target acquisition
FORS2_ipol_obs_o_fast
science exposures
For all spectroscopic modes a through slit image is required to verify the proper position of the target on
the slit. For fast observing modes LSS, SPECPHOT, HITI or PMOS the OB would typically consist of the
following three template:
FORS2_lss_acq_fast
target acquisition
FORS2_lss_obs_slit_fast
through slit image
FORS2_lss_obs_o_fast
science exposures
here for the LSS mode but very similarly for the other spectroscopic modes. For blind acquisitions in fast
modes LSS, and PMOS the coordinates of the reference star will be required for the target acquisition. The
oset from the reference star to the target will be executed from the through slit image template, after ne
adjustment of the reference star on the slit.
In case that you ask for special calibrations not included in the FORS calibration plan (section 4.1) a calibration
OB has to be prepared which would look like the following scheme:
FORS2_ima_cal_coll
collimator selection
FORS2_lss_cal_daycalib
screen ats & arcs
where the rst template is only used to select the collimator.
There are a few important points to be veried now:
1. don't mix observing modes in one OB
2. make sure that the same slits are used in LSS mode for all templates within an OB
3. verify that the osets for blind oset acquisitions are correct in size and sign
3.6 Estimate execution time and optimize overheads
In the following example in MOS mode we presumed that the reference stars for the target acquisition were
bright enough to be seen in 5 seconds (ms mode or blind acquisition typically with broad band lters) and that
30
FORS User Manual
VLT-MAN-ESO-13100-1543
Telescope
telescope preset
3 min
guide star acquisition
0.75 min
active optics
2 min
LADC resetting
1 min
Interactive Acquisition (excluding exposure time)
one loop IMG(occulting)/IPOL
1.5 min per loop
one loop MOS/MXU/PMOS
2.0 min per loop
one loop LSS/HIT
1.5 min per loop
two loops through-slit exposure
2.0 min per loop
Instrument
instrument setup
0.5 min
collimator exchange
4.5 min
retarder plate setup
1.0 min
Exposure
integration time
user dened
E2V read-out 100kHz binned
39s
E2V read-out 200kHz binned
28s
E2V read-out 200kHz unbinned
78s
MIT read-out 100kHz binned
41s
MIT read-out 200kHz binned
31s
MIT read-out 200kHz unbinned
62s
Table 3.1: Operational overheads with FORS2 on the VLT. The through-slit exposure is typically executed
twice. It is important to include the overhead times while preparing proposals and service mode observations
packages.
there were some targets on the slits which can be seen in 60s on the through slit image which is ideally done
without lters (atmospheric dispersion corrector!) or with a broad band lter (to reduce the sky brightness in
case of the IR sensitive MIT detector). No further acquisition overheads are required for the imaging mode
after the preset and the start of the active optics correction. There is in most cases no need to repeat the
acquisition procedure in the spectroscopic modes. The through slit images taken with the targets on the slits
typically have to be repeated in case of corrections of the order of 1 pixel. Two loops are require to verify
safely that the targets are on the slits.
FORS2_mos_acq
telescope preset
guide star acquisition
active optics (2 loops)
acq. image integration time
acquisition procedure
180s
45s
120s
5s
120s
FORS2_mos_obs_slit 2 loops!
instrument setup
FORS2_img_acq
telescope preset
guide star acquisition
30s
active optics (2 loops)
180s
45s
120s
through slit integration time (2*60s)
120s
FORS_img_obs_crsplit NEXP = 1 & NOFF = 5
through slit image (2*120s)
240s
instrument setup
FORS2_mos_obs_o NEXP = 1 & NOFF = 1
science integration (5*600s)
instrument setup
200kHz,2x2 CCD readout (5*31s)
science integration (1*3000s)
100kHz,2x2 CCD readout (1*41s)
all OB execution time
30s
3000s
all OB execution time
30s
3000s
155s
3530s
41s
3931s
There would be an additional overhead of 270 seconds to exchange the collimators (but this setup is partly
executed during the telescope preset and the guide star and active optics setup procedure). Further overheads
of 60 seconds per template exist for the PMOS and IPOL science templates to setup the retarder plates. This
is now the time to optimize the strategy and to estimate if all your OBs can be done in the limited number of
FORS User Manual
VLT-MAN-ESO-13100-1543
31
nights or service mode hours!
3.7 Visitor Mode
3.7.1
The nal package
The nal package needed at the telescope will typically consist of:
•
nding charts
•
observing blocks
•
the ms output les and the pre-imaging data on which the ms preparation was done (ms modes)
In most cases the meteorological conditions will be ne, but there are also bad nights with bad seeing or clouds
and sometimes strong wind which will come typically from the North.
3.7.2
At the telescope
The telescope and instrument operation is done by the sta personal. A good nding chart and a close collaboration between sta and visiting astronomer is the fastest way to the slit. The incoming data will be displayed
on real time displays which will allow only very basic assessment of the data and automatically transferred to an
oine workstation with data reduction software packages (iraf, Midas and idl). The basic observing modes will
be pipeline reduced but sky subtraction and target extraction has to be done interactively. The working environment is described on the Science Operation WEB page: http://www.eso.org/sci/facilities/paranal/sciops/.
At the end of the night an automatic procedure calobBuilt will be started which will create a complete calibration OB for all modes and setups used during the night. The calibration OB will be executed during the
morning hours.
3.7.3
At the very end
Finally, after the last night, a single copy of all science, calibration and test data is prepared by the data
handling administrators on DVD. Reduced data (no matter if pipeline or interactive reduction) are not on the
package and the visitor is required to back-up any of these les that they wish to keep.
Please send us your end of mission reports with evaluations and suggestions available from WEB page:
http://www.eso.org/sci/facilities/paranal/sciops/
3.8 FORS and the Unit Telescopes
3.8.1
Guide Stars, Telescope Osets
All FORS science observations will require a guide star in the unvignetted eld of view of the Unit Telescope.
The guide star is used for the alignment of the telescope relative to the guide star coordinates, for the wave
front sensor of the active optics system and for fast o-axis guiding with typical tip-tilt corrections of the M2
of greater than 20Hz.
The guide stars are automatically found from the GSC-2 catalog by the telescope control system (TCS) during
the acquisition of the eld. Due to the limits of the Cassegrain eld of view and vignetting constraints for the
FORS instruments the optimum distance range for guide stars from the eld center is 4 7.4 arcmin for the
SR collimator and 2 7.4 arcmin for the HR collimator. Depending on the seeing the guide star brightness
should be between 10 13 mag.
For small telescope osets (a few arcsec to a few arcmin), the telescope may keep the same guide star; otherwise
it will automatically try to nd a new one. Whether or not such telescope osets cause a change of the guide
32
FORS User Manual
VLT-MAN-ESO-13100-1543
star, depends on the oset amplitude and direction and on the position of the original guide star in the eld.
If the guide star is kept during an oset, the oset accuracy will be better than 0.1 arcsec. If the guide star is
changed, larger oset errors can be introduced by the uncertainties of the guide star positions.
3.8.2
Telescope and Instrument Focus
The telescope focus is automatically set by the active optics system.
observer.
No intervention is required by the
Defocussing of the telescope is not possible during the observations.
The instrument focus is
corrected automatically for the dierent thickness of the various lters, for the grisms, collimator and for
varying instrument temperature (autofocus).
For user-provided lters (visitor mode only) the instrument
focus will be determined by the observatory engineering and operations sta which requires the provision of
these lters to the observatory at least 6 weeks before the scheduled observing run.
3.8.3
Instrument Rotation and Position Angle on the Sky
FORS can be rotated independently from the guide probe. The allowed range for rotator presets with FORS
is -180 to +180 deg while the operational range with FORS is -270 to +270 deg. Please note that the rotator
oset angle of the telescope is minus the position angle of the targets on the sky. Note that a value of 9999
can be used to set the position angle to the parallactic angle.
3.8.4
Atmospheric Dispersion Compensation
Atmospheric dispersion is partially compensated by a linear atmospheric dispersion compensator (LADC)
which is built into the M1 cell of the telescope in front of the Cassegrain focus.
intrinsic image quality of FORS for zenith distances between 0 and 45
◦
1 It is designed to maintain the
and to signicantly reduce the eects
of the atmospheric dispersion at higher airmass. The LADC position is automatically set when the telescope
is preset to the target position and can not be corrected during the exposure. It is recommended to reset the
LADC after signicant changes in airmass during long series of exposures. At zenith distance larger then 45
degree the LADC prisms remain however always at the maximum separation. Although placed in front of the
polarization optics there are no negative impacts (instrumental polarization) for polarimetric measurements
expected or known.
1 The
LADC is described in G. Avila, G. Rupprecht, J. Beckers:
Atmospheric Dispersion Correction for the FORS Focal
Reducers at the ESO VLT, Optical Telescopes of Today and Tomorrow, A. Ardeberg (ed.), Proc. SPIE 2871, 1135 (1997)
Chapter 4
Calibrating and Reducing FORS Data
4.1 Calibration Plan
The VLT observatory aims at providing calibrations of the FORS instruments with an accuracy as listed in
Table 4.1. Applicants have to request additional observation time including overheads if much higher accuracy
is required than given below or if the mode is not supported by the calibration plan. In this case the respective
observation blocks must be provided by the users.
The FORS Calibration Plan will ensure that ESO provides dark frames, biases, at eld frames and arc lamp
spectra with the exceptions given below. Observations of standard stars in broad band lters are executed to
obtain photometric zero points, atmospheric extinction coecients and rst order color terms for the UBVRI
lters.
For the other lters only one ux standard star close to airmass 1 is taken.
Spectra of spectro-
photometric standard stars with 5 arcsec slit width will provide response functions for the ux calibration of
spectroscopic data.
The standards for the spectroscopic modes are all observed with the MOS slits in the
center of the eld to avoid additional target acquisition overheads. Neither the longslits nor the MOS or MXU
slits of the science setups are in the center of the eld of view. Therefore some part of the spectra won't overlap
with the derived response function. Please request special calibrations (send OBs) if this is problematic for
your scientic data reduction.
Visitor mode observers are welcome to use calibration data taken in the framework of the FORS Calibration
Plan. They should expect about half an hour per night to be used by observatory sta for calibration exposures.
In most case the sta will observe one eld with photometric standards for the performance monitoring and
a spectro-photometric standard with a 5 arcsecs MOS slit for the setups used in the respective nights.
The calibration plan does not support:
1. night time standard stars and twilight ats for non standard CCD-modes as a baseline only the CCD
read-out modes 200kHz,2x2,low (imaging), 100kHz,2x2,high (spectroscopy) for FORS2 will be supported.
2. any standard star observations to correct for telluric absorption lines
3. radial velocity standards
4. any day or night calibrations for slitless spectroscopy
5. any day or night calibrations for spectroscopy with lters other then the recommended order separation
lters GG375, GG435, OG590 and FILT_465_250
6. any day or night time polarimetric calibrations for retarder plate angles dierent from 0,22.5,45,67.5
degree (linear) and -45,45 degree (circular polarimetry)
7. any PMOS screen ats at retarder plate angles dierent from 45.0 degree
8. any IPOL screen ats
9. any IPOL day or night time calibrations with COLL_HR
33
34
FORS User Manual
Calibration Mode
Bias
Darks
Screen Flats UBVRI
Astrometry
Imaging Sky Flats
UBVRI photom. std
UBVRI photom. std
Flux std Gunn & other
lters
AM > 1.6 UBVRI std
Screen Flats LSS,
MOS, MXU
Screen Arcs LSS, MOS,
MXU
Flux std spectroscopic
Imaging Sky Flats
without polarizers
IPOL polarized std
IPOL unpolarized std
IPOL unpolarized std
PMOS arcs
PMOS ats (45 degree)
PMOS polarized std
PMOS unpolarized std
PMOS unpolarized std
Table 4.1:
Collimator
VLT-MAN-ESO-13100-1543
Number
5
3
2
1
4
4
1
1
1
Time
Day
Day
Day
Night
Twilight
Twilight
Night
Night
Night
Results
bias level, RON
dark current
CCD check
distortion, scale
normalized at
normalized at
zero points
zero points
response
Accuracy
RON/2
SR
SR+HR
SR
HR
SR
HR
SR+HR
Frequency (4)
weekly
monthly
weekly
annually
weekly (1)
as needed
nightly (1,2)
as needed
as needed
SR+HR
SR+HR
weekly (1,2)
as needed
1
5
Night
Day
extinction coe.
normalized at
5%
5%
SR+HR
as needed
1
Day
dispersion coe.
0.3 pixel (3)
SR
SR
as needed (5)
as needed
1
4
Night
Twilight
response
normalized at
10%
2%
SR
SR
SR
SR
SR
SR
SR
SR
as needed
annually
annually
as needed
as needed
as needed
annually
annually
1
1
1
1
5
1
1
1
Night
Night
Night
Day
Day
Night
Night
Night
zero angle (lin)
instr. pol (lin)
instr. pol (cir)
dispersion coe.
normalized at
zero angle (lin)
instr. pol (lin)
instr. pol (cir)
1 degree
1 pixel
2%
2%
5%
5%
10%
0.3 pixel (3)
5%
1 degree
FORS Calibration Plan Tasks
(1) only during FORS observing runs; (2) for (U)BVRI lters only and under photometric conditions only; (3)
internal accuracy - not considering instrumental exures - see section 2.4.3; (4) Frequency as needed denotes
that the calibration task is done if the subsequent mode was used; (5) Please note that the ux std to calibrate
LSS mode is taken with a MOS slit of 5 (at the center of the eld) to include all the ux. If you want the
std to be observed with the same LSS slit you have to provide a special calibration OB.
The observatory sta will prepare a day-time calibration OB in the morning with biases, screen ats and
arc-lamp spectra for all spectroscopic and spectro-polarimetric setups. This is done with the semi-automatic
calobBuilt software. Calibrations according to item 5 and 6 are hard to congure in an automatic tool and
therefore not included in the calibration plan. Calibrations according to item 8 and 9 are thought to be not very
usefull for the data reduction and therefore not included. In all other cases the respective calibrations are not
supported by the calibration plan to keep the time for the calibration plan within some reasonable limits. The
daily maintenance activities of telescope and instruments must not be compromised by extensive calibration
requests by visiting or sta astronomers. We will have to keep it as short as possible or the calibrations must
be interupted (postponed or even partly canceled,. . . ) in case of scheduled or urgent maintenance and setup
activities.
4.2 Image Field Distortion and Scales
The image distortion was measured on an astrometric standard star eld in 47Tuc (Tucholke 1992, A&AS 93,
293) for FORS1 and FORS2 and in the eld of cluster Pal 3 for FORS2 (SDSS coordinates). This method is
limited by the accuracy of the astrometric positions of the stars. The measurements were done with FORS1 in
the Bessel V band. A third order polynomial was tted to the measured data. The formulas to determine the
deviation (in pixel) of the position measured on the detector from the real (astrometric) position (r in pixel)
are given in the table. The measured distortion is in agreement with the design data (SR 0.30%, HR 1.55%
at the corner of the eld). The residuals of the t were 0.05 pixels in SR and 0.06 pixels in HR mode.
FORS User Manual
FORS1 SR:
FORS1 HR:
VLT-MAN-ESO-13100-1543
∆r =
∆r =
35
−9
*r
3
- 1.228*10
−6
*r
2
+ 0.360*10
−3
*r
−9
*r
3
- 3.605*10
−6
*r
2
+ 1.001*10
−3
*r
2.091*10
9.515*10
The radial oset derived from the equations above has to be subtracted from the measured position on the
CCD. The radius r is calculated from the reference pixel (ts keywords CRPIX1 and CRPIX2) of the world
coordinate system. From the optics design it was estimated that the chromatic and thermal eects are of the
order of 10% of the distortion.
The radial eld distortion of FORS2 was measured with a pinhole MXU mask. The osets are expressed in
0
units of 24 micron pixels even though measured with 15 micron pixels of the new MIT detectors (∆r and
r0
in pixels measured on the MIT CCDs):
FORS2 SR:
FORS2 HR:
with:
∆r =
∆r =
r=
∆r0 =
−9
*r
3
- 2.158*10
−9
*r
3
+ 3.782*10
2.113*10
7.133*10
−6
2
−3
*r + 0.537*10
*r
−6 2
−3
*r + 0.160*10
*r
r0 ∗ (15/24 * binning)
∆r/(15/24 * binning)
The images scale was determined using astrometric standard stars in the star clusters 47Tuc and Pal 3 in
several nights during commissioning of the instruments.
The plate scales have also been measured in June
2004 when FORS2 was moved to Antu and FORS1 to Kueyen. In this case three elds of standard UCAC2
stars in the vicinity of the cluster
Ω Centauri have been used.
The measured values are given in the table. For
FORS2 the scale is given for unbinned 15 micron pixels in SR mode.
FORS/UT
Coll.
Target
Filter
Scale (arcsec/pix)
FORS1/Antu
SR
47Tuc
I
0.20013±0.00005
FORS1/Antu
HR
47Tuc
I
0.09975±0.00004
FORS2/Yepun
SR
47Tuc
I
0.12604±0.00003
FORS2/Yepun
SR
Pal 3
I
0.12607±0.00003
FORS2/Yepun
HR
Pal 3
I
0.06323±0.00003
Coll.
Target
Filter
Scale (arcsec/pix)
Cen
I
0.20036±0.00008
Cen
I
0.20047±0.00007
Cen
I
0.12591±0.00002
Cen
I
0.12591±0.00002
Cen
I
0.12590±0.00003
FORS/UT (June 2004)
FORS1/Kueyen
SR
FORS1/Kueyen
SR
FORS2/Antu
SR
FORS2/Antu
SR
FORS2/Antu
SR
Ω
Ω
Ω
Ω
Ω
4.3 Data Reduction of Pre-Imaging Data for the Mask Preparation
Pre-imaging data delivery:
As soon as a pre-image is successfully taken, the data will be immediately
transfered to the ESO data archive in Garching, where it will be automatically reduced (bias subtraction and
at elding). Reduced and raw data will then be available on a dedicated ftp account. Detailed instructions
on where to retrieve the data from, as well as further information is send to the user by e-mail, typically the
day after the pre-image was taken. Please note that the data must be fetched from its ftp location within a
certain range of time, usually within a week. The data delivery process starts as soon as the rst pre-image is
taken, i.e. not only after the whole pre-imaging run is completed.
Shift and add only:
The mask preparation for FORS MOS, PMOS and MXU modes will require that the
original scale and eld distortion is the same in reduced data as it was for the raw data. This is required since
the ms tool will correct for the scale distortion in case of FORS pre-images at the time when the masks are
saved. Advanced techniques to combine jitter images such as drizzle will require some distortion corrections
before the techniques will be applied. It is strongly recommended only to use clean shift and add techniques
(eg. IRAF imcombine) to reduce images which are thought to be used for ms mask preparation.
FORS1/1 mosaics - don't cut the edges:
In case of pre-imaging data taken with the FORS1/2 mosaic
detectors it will be required to keep the original le format of the pre-images. Vignetted parts of the images
and pre- and overscan regions must not be cut before using the les with ms. The plug-in function fsmosaic
delivered with the ms software can be used to merge the two les safely:
fsmosaic RAW_INPUT_FILE OUTPUT_FILE
36
FORS User Manual
VLT-MAN-ESO-13100-1543
The merged output les could be now combined with standard software such as imcombine (eg.
for IRAF
imcombine: a median of the jittered les with the oset parameter set to wcs should give satisfactory results
for the mask preparations). In general: 1st fsmosaic and then imcombine!
Pipeline support:
The quality control group is planning to deliver reduced science frames to applicants
which have requested pre-imaging runs with the MIT mosaic. The reduced and merged les can be combined
with the standard tools.
The description of the functionality of the fsmosaic plug-in is given in the ms manual (see section 1).
4.4 Flat-Fielding
4.4.1
Imaging Mode
Best results for at elding are obtained if the illumination is as similar as possible to that of the science frames.
This can be achieved from 4 science frames with adequate S/N of the sky background taken with osets of
>500 ;
elds should not be too crowded as well. This observing mode is supported by the corresponding templates. In
order to achieve a suitable S/N of the resulting super-ateld, a larger number of science frames may be needed
if the sky level is low. If this is not guaranteed, twilight sky ats should be taken in addition. Night ats need
to be carefully checked for remaining stars. Master night ats are processed by the reduction pipeline.
Templates are also available which for any desired lter generate sky ats during dusk or dawn, automatically
determining the required exposure time from a brief windowed exposure and taking into account the decreasing
or increasing sky brightness in the evening or morning. Flat elding from these exposures will however not
remove large scale gradients (of the order of 1000 pixels).
In service mode twilight ats are provided as
standard calibration frames.
Screen atelds can be taken (see section 2.9) with the internal lamps and the screen in the telescope.
A
guide to approximate exposure times is given in Table 4.3. Screen ats should be used only for removing the
high-frequency component of the at eld. However, this can be equally well achieved using sky ats, since the
exposure levels in both are comparable. Furthermore, screen ats contain articial reections o the LADC
(2-3 dots close to the image center) which need to be removed before applying. Screen ats are not provided
as standard calibration frames in service mode, but need to be requested.
Table 4.2 lists results from the analysis of the atelds (including master ats produced by the pipeline)
taken during the past periods. The sigma values scale as sqrt(exposure level). All other values scale with
the exposure level.
contributing.
sigma in masters goes down by a factor sqrt(N) where N is the number of raw les
di_AB is the fractional gain dierence between ports A and B which is removed by the
attening. gradient is the 'large'-scale gradient measured in a window of size 200x200 pixels.
Typical exposure
sigma
sigma
noise, photon
noise, xed
(ADU)
(raw)
pattern
20000
0.6%
0.5%
level
di_AB
gradient
2
(200 )
18-25%
0.7%
Table 4.2: Large-scale structure and small-scale noise in sky ats (high gain CCD readout)
Table 4.3 gives typical exposure times for screen ats for the SR collimator and Bessell lters. The numbers
are indicative only since they are subject to changes due for instance lamp replacements.
The observatory
sta has updated values at hand and takes also care of proper adjustments of the calibration exposure times
for delivered service mode OBs (unless otherwise stated in the readme le of the program).
4.4.2
Spectroscopic Modes
For the spectroscopic modes one will use internal screen ats in most cases.
These ats are taken during
daytime with the telescope pointing to zenith and the instrument in calibration position. Spectroscopic ats
on the sky in twilight are not supported by the FORS standard templates.
A guide to exposure times is given in Table 4.4. In MOS mode some bleeding from zero order may occur for
FORS User Manual
VLT-MAN-ESO-13100-1543
Lamp
37
U_SPECIAL
B
V
R
I
Blue+1
+
+
+
+
+
Blue+2
+
+
+
+
+
Red+1
Red+2
200
4
4
6
10
exp. time
Table 4.3: Approximate exposure times (seconds) for FORS2 imaging screen at calibrations for the Bessell
and special broadband lters, SR collimator, high gain readout
low dispersion grisms and unfavorable (i.e. wide spread in dispersion direction) object geometry. The numbers
are indicative only since they are subject to changes due for instance lamp replacements.
The observatory
sta has updated values at hand and takes also care of proper adjustments of the calibration exposure times
for delivered service mode OBs (unless otherwise stated in the readme le).
Please note that red internal at eld lamps (FlatRed+1 and FlatRed+2) can't be used anymore after the
installation of the external calibration units (see section 2.9).
Grism
OSF
Exposure time
1400V
1200B
21.9
27.3
1200g
21.9
27.3
1200R
GG435
1028z
OG590
600B
11.8
600V
GG435
12.5
600R
GG435
15.4
600I
OG590
34.0
600RI
GG435
600z
OG590
300V
/GG435
5.2
9.0
300I
/OG590
9.8
4.0
200I
150I
/OG590/GG435
E2V
MIT
27.3
11.5
9.1
8.3
7.0
3.8
5.2
1.2
2.3
1.1
Table 4.4: Approximate exposure times (seconds) for spectroscopic screen at calibrations with the 2 available
mosaics. Flateld lamps of one calibration unit switched on. Approximate exposure level is 30000 ADU. Slit
00
width = 1 , SR collimator, high gain readout, 2x2 binning.
4.5 Wavelength Calibration
For the wavelength calibration one may use the He and Ar lamps (at the lowest spectral resolution grism
150I) and in addition the Ne lamp (at higher resolution). Note that the exposure time of the Ne lamp should be
reduced by a factor of 5 at least (switch-on times can be dened individually for each lamp in the corresponding
calibration template). For grism 600B the HgCd lamp must be used. Approximate exposure times for well
00
exposed spectra are given in Table 4.5 for the dierent grisms and lamps, for a slit width of 1 . Calibration
spectra taken with the dierent grisms are plotted in gures DD.
The numbers are indicative only since they are subject to changes due to e.g.
lamp replacements.
The
observatory sta has updated values at hand and takes also care of proper adjustments of the calibration
exposure times for delivered service mode OBs (unless otherwise stated in the README le).
Wavelength calibration exposures
instrument in calibration position.
are done during the day only with the telescope in zenith and the
38
FORS User Manual
VLT-MAN-ESO-13100-1543
Grism
OSF
He
HgCd
2*Ar
2*Ne
1400V
100
25
0
100
1200B
100
100
0
0
1200R
GG435
75
0
37
7
1028z
OG590
100
0
5.5
100
600B
100
25
0
0
600V
GG435
50
50
10
10
600R
GG435
0
50
10
10
600RI
GG435
90
40
4.5
4.5
600z
OG590
75
0
4.5
75
300V
/GG435
70
17.5
9.8
0
300I
OG590
100
0
5
0
200I
70
0
4.9
0
150I
/OG590/GG435
60
18
6
0
Table 4.5: Approximate exposure times and switch-on times of calibration lamps (seconds) for wavelength
calibrations with FORS2. Any slit width, SR collimator, high gain readout, 2x2 binning. The update with
the integration times for the E2V mosaic is still pending.
4.6 Calibrating Polarimetric Measurements
4.6.1
Circular polarimetry
V
θ = ±45◦ ,
The amount of circular polarization
can be determined, observing with the quarter wave retarder plate at
two retarder plate angles of
by the equation:
1
V =
2
(f
o
, fe
"
fo − fe
fo + fe
−
θ=45
fo − fe
fo + fe
#
(4.1)
θ=−45
being the ordinary and extraordinary beam of the object measured for a given retarder plate angle
θ)
One could determine the circular polarization observing at one retarder plate position, but two observations
are required to eliminate the strongest observing biases in the rst order approximation:
•
the improper at eld correction
•
the color dependent oset
•
the incomplete and color dependent retardation of
θ
F F
to the nominal retarder plate zero angle
90 + Φ (λ)
degree of the quarter wave plate
Observations at only one retarder plate angle would cause hardly correctable Stokes parameter cross talks in
the case of objects with non-negligible linear polarization. The color dependence of the retarder angle
cause an additional polarization of
∆V = −2θ U
and the incomplete retardation
wave) would cause the additional polarization of
∆V = −Φ Q (Φ
&
θ
Φ (Φ 6= 90
θ
would
degree, quarter
in radians, UVQ being the Stokes
parameters). One would get
fo − fe
f o + f e θ=45
o
f − fe
f o + f e θ=−45
V + F F + (−2θ U − Φ Q)
(4.2)
= −V + F F + (−2θ U − Φ Q)
(4.3)
=
The dierence between the two observations yields
V
while the small deviations have the same sign in the two
equations and are therefore eliminated for small angles
Φ
&
θ .
FORS User Manual
VLT-MAN-ESO-13100-1543
39
Figure 4.1:
4.6.2
Linear Polarimetry
After the pre-reduction of the spectroscopic data and integration of the ordinary and extraordinary target
spectra or ux
f o (θi )
and
f e (θi ),
the normalized ux dierences
F (θi ) =
where
θi = i ∗ 22.5◦
F (θi )
must be calculated:
f o (θi ) − f e (θi )
,
f o (θi ) + f e (θi )
is the angle of the retarder plate (0
(4.4)
< i < 15).
If the polarimetry is obtained from the normalized ux dierences, no absolute ux calibration of the data is
required. In this case, the Stokes parameters
Q
Q =
and
N
−1
X
i=0
U
=
N
−1
X
i=0
U
can be derived via Fourier transformation:
2
F (θi ) cos(4θi )
N
(4.5)
2
F (θi ) sin(4θi )
N
(4.6)
In principle, two observations at dierent retarder angles (N
= 2) are sucient to calculate Q and U .
At least
four measurements at angle 0.0 to 67.5 are needed to suppress the impact of the improper at elding of the
data. Best results will be obtained, if observations at all the rotation angles of the retarder plate (N
= 16)
will be carried out.
Although a super-achromatic half wave plate is used with FORS, the zero angle of the plate is not negligible.
Therefore all raw measurements of polarization position angles are rotated by an angle of a few degrees. For
the half wave plate the chromatic dependence of the zero angle was determined with an aligned Glan-Thomson
prism. The tabulated values of the zero angle as displayed on gure 4.1 can be obtained on request.
For imaging polarimetry the oset angles can be determined by convolving the lter response curves with the
color dependence of the half wave plate. The results are given in Table 4.6.
40
FORS User Manual
VLT-MAN-ESO-13100-1543
zero angles imaging mode
Table 4.6:
Filter
θ
Bessel U
-2.07deg
Bessel B
+1.54deg
Bessel V
+1.80deg
Bessel R
-1.19deg
Bessel I
-2.89deg
Gunn u
-2.03deg
Gunn v
-0.47deg
Gunn g
+3.10deg
Gunn r
-1.31deg
Gunn z
-1.64deg
Calibration of the FORS1 half wave retarder plate in imaging mode from the spectroscopic
measurements with the Glan-Thompson prism. These values will depend slightly on the color of the observed
targets.
θ = 134.20 deg in the Bessel B lter one would correct this raw
θ = 132.66 deg. The oset angles should be conrmed periodically by the
Measuring a polarization angle of e.g.
measurement to a nal result of
observation of polarized standard stars.
4.7 Pipeline Reduction
A data reduction pipeline is operational for FORS2.
4.7.1
Supported modes
The FORS pipeline supports three instrumental modes:
imaging (IMG), longslit spectroscopy (LSS) and
multi-object spectroscopy (MOS/MXU). It provides :
•
creation of master calibration products
•
reduction of science data
•
photometric zero points
For IMG data, the raw data are bias subtracted and at elded and SExtractor is used to detected and classify
sources. The single frames taken within a sequence are not combined.
LSS, MOS, and MXU data, in addition to de-biasing and at elding (high spatial frequencies only), are
rebinned to wavelength space. The spatial curvature is corrected for MOS and MXU data. Spectrophotometric
standard star observations are reduced like LSS science data, but no response curve is determined. The night
sky is subtracted. However, since the pipeline uses a median to determine the sky, it does not correct for any
spatial gradient along the slit. It will also not work properly if more than 50% of the pixels along the slit at
a given wavelength contain signal from sources. This can cause problems for extended objects and crowded
regions or for very short slits in the case of MXU. The sources are extracted, but the single frames taken within
a sequence are not combined.
More information about the spectroscopic FORS pipeline can be found at
http://www.eso.org/observing/dfo/quality/FORS1/pipeline/fors_calib.html
(calibration data) and
http://www.eso.org/observing/dfo/quality/FORS1/pipeline/fors_science.html
(science data). The pipeline can be downloaded from http://www.eso.org/pipelines.
4.7.2
Quality Control Pipeline - Service Mode Only
All data taken in service mode are reduced by the quality control group in Garching:
FORS User Manual
Master Calibration Data:
VLT-MAN-ESO-13100-1543
41
As part of the service mode concept, the master calibration data set is provided
to the service mode observer. All raw calibration data from the pipeline-supported modes of FORS (regardless
of whether they are obtained in visitor or in service mode) are processed to obtain master calibration data.
These are optimized for e.g.
low noise level, and they are quality-checked.
Hence they give the optimum
calibration data to the best present knowledge.
Master calibration data are of the following types:
•
MASTER_BIAS (bias level, read-out noise),
•
MASTER_SKY_FLAT_IMG (high and low spatial frequency at, taken in twilight),
•
photometric zero points (from standard star observations),
•
MASTER_NORM_FLAT_LSS (high spatial frequency at, slit function),
•
DISP_COEFF_LSS (wavelength calibration).
•
WAVELENGTH_MAP_LSS (image in which each pixel has its wavelength as pixel value)
•
MASTER_NORM_FLAT_MOS/MXU (high spatial frequency at, slit function),
•
SLIT_LOCATION_MOS/MXU (table with the slit positions and edges)
•
DISP_COEFF_MOS/MXU (dispersion coecients from the wavelength calibration).
•
CURV_COEFF_MOS/MXU (coecients to describe and correct the spatial curvature of the spectra)
•
WAVELENGTH_MAP_MOS/MXU (image in which each pixel has its wavelength as pixel value)
•
SPATIAL_MAP_MOS/MXU (image in which each pixel has its position along the slit as pixel value)
Usually MASTER_SKY_FLAT_IMG are used for at-elding IMG data.
This removes all multiplicative
artifacts in the image (pixel-to-pixel gain variations, instrument and CCD eciency). Since the illumination
during dusk/dawn is, however, dierent from night conditions, a large-scale gradient of a few percent may
remain which can be easily removed by e.g. tting a polynomial.
A better large-scale illumination correction can be obtained from night ats which are pipeline-processed from
jittered science images. Since these usually have a lower signal-to-noise ratio than lamp ats, it is preferable
to use them for large-scale correction only.
Photometric zero points are routinely calculated for the standard Bessell or special broadband lters of the
−
instrument. They are derived from the ux of the stars in e
, not in ADU. They are provided to the users as
part of the service mode package. However, they are meant for monitoring purposes and should
for scientic data without careful checks.
not be used
In particular they use default values for extinction and colour
coecients that may not be appropriate for a given night. For details see
http://www.eso.org/observing/dfo/quality/FORS1/qc/zeropoints/zeropoints.html
or
http://www.eso.org/observing/dfo/quality/FORS2/qc/zeropoints/zeropoints.html
Science Data:
Science data are pipeline-processed if they are obtained in service mode. Any standard mode
IMG observation can expect a reduced le if appropriate calibration data (bias, twilight at) are available.
For the spectroscopic modes all LSS, MOS, and MXU observations can expect reduced data (i.e. wavelength
calibrated and at-elded 2-dimensional spectra and 1-dimensional extracted spectra corrected for sky background, see, however, note above about sky subtraction) if the appropriate calibration data are available (bias,
lamp at, arc lamp frame).
4.7.3
Paranal Science Operation Pipeline IMG, LSS and MOS/MXU modes
only
In parallel to Garching, the FORS pipeline is in operation on Paranal.
This allows the sta and visiting
astronomer to better estimate the quality of the data. The on-site pipeline is operated with calibration data
42
FORS User Manual
VLT-MAN-ESO-13100-1543
provided by the quality control group and therefore are not the most recent ones. Note also that the calibration
database can be incomplete (in particular in longslit mode) due to the high number of longslits, grisms and
lters combinations, and therefore only a part of the data will be processed. Therefore a special recipe was
developed for the spectroscopic data, which allows to get quick-look results without dedicated calibrations.
The Paranal pipeline works on a dedicated machine. Reduced science data are computed shortly after they
have been exposed and are transmitted for inspection to the o-line user workstation.
The on-site pipeline will deliver the following products:
•
master bias frames
•
master twilight ats
(IMG mode)
•
at elded science images
(IMG mode)
•
photometric zero points
(IMG mode)
•
normalized master screen ats
(LSS, MOS, MXU mode)
•
wavelength calibration products
(LSS, MOS, MXU mode)
•
reduced science data (quick-look only)
(LSS, MOS, MXU mode)
Appendix A
Abbreviations and Acronyms
The following abbreviations and acronyms are used in this manual:
ACQ
Acquisition
ADU
Analogue-to-Digital Unite
BOB
Broker of Observation Blocks
CCD
Charge Coupled Device
DDTC
Director's Discretionary Time Committee
DSS
Digital Sky Survey
ECH
Echelle Spectroscopy
ESO
European Southern Observatory
ETC
Exposure Time Calculator
FIERA
Fast Imager Electronic Readout Assembly
FIMS
FORS Instrumental Mask Simulator
FITS
Flexible Image Transport System
FORS
Focal Reducer/Low Dispersion Spectrograph
FWHM
Full Width Half Maximum
HIT
HIgh-Time resolution
HR
High Resolution
IDL
Interactive Data Language
IMG
Imaging
IPOL
Imaging Polarimetry
IRAF
Image Reduction and Analysis Facility
ISF
Instrument Summary File
LADC
Longitudinal Atmospheric Dispersion Compensator
LSS
Long Slit Spectroscopy
MIDAS
Munich Image Data Analysis System
MOS
Multi Object Spectroscopy
MXU
Mask eXchange Unit
OB
Observation Block
OSF
Order Separation Filter
OT
Observing Tool
PMOS
Polarimetric Multi Object Spectroscopy
PSF
Point Spread Function
P2PP
Phase 2 Proposal Preparation
RMS
Root Mean Square
RON
Read Out Noise
RQE
Responsive Quantum Eciency
SR
Standard Resolution
S/N
Signal-to-Noise
TBC
To Be Conrmed
TBD
To Be Dened
TCS
Telescope Control System
43
44
FORS User Manual
UV
Ultraviolet
VIMOS
Visible Multi-Object Spectrograph
VLT
Very Large Telescope
WCS
World Coordinate System
Å
Ångstrom
e−
Electron
cm
Centimeter
h
Hour
kpx
KiloPixel
min
Minute
mm
Millimeter
nm
Nanometer
px
Pixel
s
Second
µm
Micrometer
VLT-MAN-ESO-13100-1543
Appendix B
FORS Filter Characteristics
B.1 Broadband Filters
Table B.1 lists all presently (see issue date of this document) available FORS2 broadband lters. The transmission curves are given thereafter. Tables of the measured transmission values are available via the ESO web
pages:
http://www.eso.org/sci/facilities/paranal/instruments/fors/inst/Filters/curves.html
http://filters.ls.eso.org/efs/index.htm
Filter
λ0
FWHM (nm)
361
50.5
B_HIGH+113
437
102.0
V_HIGH+114
555
123.2
g_HIGH+115
467
160.3
R_SPECIAL+76
655
165.0
I_BESS+37/+77
768
138.0
Z_SPECIAL+43
916
18.4
U_BESS+33
366
36.0
U_SPECIAL+73
362
29.0
B_BESS+34/+74
429
88.0
V_BESS+35/+75
554
111.5
R_BESS+36
657
150.0
u_GUNN+38
359
33.5
v_GUNN+39
398
46.0
g_GUNN+40 (1)
506
79.5
g_HIGH+115
471
159.0
r_GUNN+41
653
81.5
z_GUNN+42/+78
910
130.5
GG435+31/+81 (2)
edge lter: n/a
n/a
OG590+32/+72 (2)
edge lter: n/a
n/a
465
250
FILT_465_250+82 (2)
Table B.1:
(nm)
U_HIGH+112
Characteristics of the FORS2 broadband lters.
λ0
is the central wavelength in nm.
(1) this is located in one of the interference lter wheels, as it is physically designed as an interference lter
(2) these are intended as order separation lters for spectroscopy
45
46
FORS User Manual
VLT-MAN-ESO-13100-1543
Figure B.1: Filter transmission curves for the standard instrument broadband lters.
FORS User Manual
VLT-MAN-ESO-13100-1543
Figure B.2: Additional Bessell lter transmission curves.
47
48
FORS User Manual
Figure B.3: Gunn lter transmission curves.
VLT-MAN-ESO-13100-1543
FORS User Manual
VLT-MAN-ESO-13100-1543
49
B.2 Interference Filters
Table B.2 lists all presently available interference lters used with for FORS2. Their characteristics are given
with the FORS SR and HR collimators: central wavelength, peak transmission and FWHM. Due to their
location in the converging beam, the lter characteristics depend on the collimator used. The lter bandwidths
are wider, the central wavelength is blue-shifted, and the peak transmission is lower than in a parallel beam.
With the SR collimator, the eect is larger than with the HR collimator. The lters are centered on important
emission lines and on 5 % and 10 % longer wavelengths.
λ0
T0
FWHM (nm)
SR
HR
SR
HR
SR
HR
λ0
371.7
372.9
0.45
0.48
7.3
6.9
0%
OII/4000+45
377.6
378.8
0.37
0.40
6.5
6.1
5%
OII/8000+46
381.4
382.6
0.43
0.47
6.5
6.1
10%
468.4
469.1
0.79
0.82
6.6
6.4
0%
HeII/3000+48
472.6
473.4
0.76
0.79
5.8
5.6
5%
HeII/6500+49
478.1
478.9
0.78
0.81
6.8
6.6
10%
Filter
Line
OII+44
[OII] 372.7
HeII+47
OIII+50
HeII 468.6
500.1
500.9
0.76
0.80
5.7
5.5
0%
OIII/3000+51
504.5
505.3
0.76
0.80
5.9
5.7
5%
OIII/6000+52
510.5
511.3
0.74
0.78
6.1
5.9
10%
HeI+53
[OIII] 500.7
shift
586.6
587.6
0.79
0.84
6.0
5.7
0%
HeI/2500+54
592.0
593.0
0.77
0.81
6.8
6.5
5%
HeI/5000+55
597.5
598.5
0.85
0.89
7.4
7.2
10%
629.5
630.6
0.75
0.79
7.2
6.9
0%
OI/2500+57
635.4
636.4
0.75
0.81
5.9
5.5
5%
OI/4500+58
640.4
641.4
0.77
0.83
6.3
6.0
10%
656.3
657.4
0.70
0.76
6.1
5.7
0%
H_Alpha/2500+60
660.4
661.5
0.77
0.83
6.4
6.1
5%
H_Alpha/4500+61
666.5
667.6
0.72
0.77
6.5
6.1
10%
672.8
673.9
0.77
0.82
6.6
6.3
0%
SII/2000+63
677.4
678.5
0.77
0.82
6.8
6.5
5%
SII/4500+64
683.2
684.3
0.72
0.78
6.4
6.0
10%
952.3
953.9
0.68
0.80
5.9
5.2
0%
SIII/1500+66
957.2
958.8
0.72
0.84
6.3
5.6
5%
SIII/1500+67
962.1
963.7
0.70
0.83
5.9
5.2
10%
FILT_485_37
485
0.89
37
FILT_691_55
691
0.93
55
FILT_815_13
815
0.90
13
FILT_834_48
834
0.90
48
z_SPECIAL
915
0.94
20
FILT_917_6
917
0.85
6
500
0.81
5
FILT_503_5
503
0.83
5
FILT_530_25
530
0.85
25
OI+56
H_Alpha+83
SII+62
SIII+65
FILT_500_5
Table B.2:
HeI 587.6
[OI] 630.0
Hα 656.3
[SII] 672.4
[SIII] 953.2
[OIII] 500.7
Characteristics of the FORS interference lters.
transmission.
λ0
is the central wavelength in nm, T0 the peak
50
FORS User Manual
Figure B.4:
VLT-MAN-ESO-13100-1543
FORS intermediate band lter transmission curves.
Appendix C
Eciency Curves for the FORS Grisms
C.1 FORS2 Grisms
This appendix contains the eciency curves of all standard grisms available for FORS2 and the approximate
wavelength range for a slit which is located in the eld centre. Tables of the measured eciency values are
available on the WEB page:
Figure C.1:
Eciency curves of the low resolution grisms. The vertical lines mark the approximate limits of
the spectral range with the slit in the center of the eld. The cuto wavelength is in most cases given by the
order separation lters, the red CCD limit or the 330nm limit of the FORS optics in the blue.
51
52
Figure C.2:
FORS User Manual
VLT-MAN-ESO-13100-1543
Eciency curves of the medium resolution grisms. The vertical lines mark the approximate limits
of the spectral range with the slit in the center of the eld.
FORS User Manual
Figure C.3:
VLT-MAN-ESO-13100-1543
53
Eciency curves of the medium resolution volume phased holographic grisms. The vertical lines
mark the approximate limits of the spectral range with the slit in the center of the eld.
Appendix D
Wavelength Calibration Spectra for the
FORS Standard Grisms
This Appendix gives a wavelength table for the calibration lamps used in FORS2 together with the arc line
spectra taken with the FORS grisms and the SR collimator. The measurements were done with MOS slits
located in the center of the eld of view and a slit width of 1.0 arcseconds.
Note:
these plots are indicative only, since minor shifts of the wavelength pixels may occur between the two
FORS instruments and due to dierent dewar mounting after instrument and CCD maintenance. The x-scale
is in units of binned pixels.
54
FORS User Manual
VLT-MAN-ESO-13100-1543
Wavelength (Å)
Table D.1:
Element
Wavelength (Å)
55
Element
3610.500
Cd
7065.200
He I
3650.144
Hg
7081.880
Hg
3654.840
Hg
7091.990
Hg
3663.274
Hg
7147.041
Ar I
3888.646
He I
7173.939
Ne I
3964.700
He I
7245.167
Ne I
4026.200
He I
7272.930
Ar I
4046.557
Hg
7281.349
He I
4077.831
Hg
7346.200
Cd
4347.500
Hg I
7383.900
Cd
4358.343
Hg
7383.981
Ar I
4471.479
He I
7385.300
Cd
4678.160
Cd
7438.900
Ne I
4713.200
He I
7488.870
Ne I
4799.920
Cd
7503.868
Ar I
4916.070
Hg
7514.652
Ar I
4921.929
He I
7535.800
Ne I
5015.675
He I
7635.106
Ar I
5085.824
Cd
7724.210
Ar I
5341.100
Ne I
7948.176
Ar I
5400.562
Ne I
8006.157
Ar I
5460.742
Hg
8014.786
Ar I
5764.419
Ne I
8103.693
Ar I
5769.598
Hg
8115.311
Ar I
5790.656
Hg
8264.523
Ar I
5852.488
Ne I
8300.326
Ne I
5875.620
He I
8377.367
Ne I
5881.900
Ne I
8408.210
Ar I
5944.830
Ne I
8424.648
Ar I
5975.534
Ne I
8495.360
Ne I
6029.977
Ne I
8521.442
Ar I
6074.338
Ne I
8591.259
Ne I
6096.160
Ne I
8634.648
Ne I
6143.063
Ne I
8654.384
Ne I
6163.594
Ne I
8667.944
Ar I
6217.281
Ne I
8681.900
Ne I
6266.495
Ne I
8704.150
Ne I
6304.790
Ne I
8853.867
Ne I
6334.428
Ne I
8919.500
Ne I
6382.991
Ne I
9122.968
Ar I
6402.246
Ne I
9201.800
Ne I
6438.470
Cd
9224.499
Ar I
6506.528
Ne I
9300.850
Ne I
6532.880
Ne I
9354.218
Ar I
6598.953
Ne I
9425.380
Ne I
6678.149
He I
9657.784
Ar I
6678.300
Ne I
9784.501
6717.040
Ne I
10140.000
Hg
6907.160
Hg
10394.600
Cd
6929.468
Ne I
10830.171
He I
6965.431
Ar I
7032.413
Ne I
Ar I
Wavelengths of the arc lamp lines, with the corresponding element
56
FORS User Manual
VLT-MAN-ESO-13100-1543
Figure D.1:
Calibration spectrum taken with the SR collimator and grism GRIS_1400V+18
Figure D.2:
Calibration spectrum taken with the SR collimator and grism GRIS_1200R+93
FORS User Manual
VLT-MAN-ESO-13100-1543
Figure D.3:
Calibration spectrum taken with the SR collimator and grism GRIS_1200g+96
Figure D.4:
Calibration spectrum taken with the SR collimator and grism GRIS_1028z+29
57
58
FORS User Manual
VLT-MAN-ESO-13100-1543
Figure D.5:
Calibration spectrum taken with the SR collimator and grism GRIS_600B+22
Figure D.6:
Calibration spectrum taken with the SR collimator and grism GRIS_600V+94
FORS User Manual
VLT-MAN-ESO-13100-1543
Figure D.7:
Calibration spectrum taken with the SR collimator and grism GRIS_600R+14
Figure D.8:
Calibration spectrum taken with the SR collimator and grism GRIS_600RI+19
59
60
FORS User Manual
Figure D.9:
Figure D.10:
VLT-MAN-ESO-13100-1543
Calibration spectrum taken with the SR collimator and grism GRIS_600I+15
Calibration spectrum taken with the SR collimator and grism GRIS_600I+25
FORS User Manual
VLT-MAN-ESO-13100-1543
Figure D.11: 2nd order calibration spectrum taken with the SR collimator and grism GRIS_600I+25
Figure D.12:
Calibration spectrum taken with the SR collimator and grism GRIS_600z+23
61
62
FORS User Manual
Figure D.13:
VLT-MAN-ESO-13100-1543
2nd order calibration spectrum taken with the SR collimator and grism GRIS_600z+23
FORS User Manual
VLT-MAN-ESO-13100-1543
Figure D.14:
Calibration spectrum taken with the SR collimator and grism GRIS_300V+20
Figure D.15:
Calibration spectrum taken with the SR collimator and grism GRIS_300I+21
63
64
FORS User Manual
VLT-MAN-ESO-13100-1543
Figure D.16:
Calibration spectrum taken with the SR collimator and grism GRIS_200I+28
Figure D.17:
Calibration spectrum taken with the SR collimator and grism GRIS_150I+27
Appendix E
FORS Image Orientation
E.1 MOS Orientation
The orientation of the FORS image in MOS mode is given below for rotator position 0 deg. Note that the
sky directions in this schematics change for dierent rotator angles while the orientation on the CCD remains
unchanged. The orientation of the images on the CCD is given in parenthesis. Also given are the locations of
the CCD readout ports.
65
66
FORS User Manual
VLT-MAN-ESO-13100-1543
E.2 LSS Orientation
The orientation of the FORS image in LSS mode is given below for rotator position 0 deg.
Note that the
sky directions in this schematics change for dierent rotator angles while the orientation on the CCD remains
unchanged. The orientation of the images on the CCD is given in parenthesis.
Appendix F
World Coordinate System Information
The header of the FITS le used for preparing a FORS target mask with FIMS should contain the following
keywords, for a linear scale:
CTYPE1
CRVAL1
CRPIX1
CTYPE2
CRVAL2
CRPIX2
=
=
=
=
=
=
'RA---TAN'
12.345678
512.0
'DEC--TAN'
-12.34567
525.5
/
/
/
/
/
/
tangential projection type
x- coord of reference pixel: RA in deg
x coord of reference pixel: PIXEL
tangential projection type
y- coord of reference pixel: DEC in deg
y coord of reference pixel: Pixel
CDELT1
CROTA1
CDELT2
CROTA2
=
=
=
=
-3.234E-5
10.0
3.234E-5
10.0
/
/
/
/
x- scale: degrees per
rot in degrees, from N
y- scale: degrees per
rot in degrees, from N
2000.0
/ equinox
EQUINOX =
Beside this conventional
pixel
to E
pixel
to E
CROTA/CDELT-notation there is also the PCiiijjj/CDELT-notation in use, in particular
for ESO instruments, where PC keywords are the rotation matrix:
CTYPE1
CRVAL1
CRPIX1
CTYPE2
CRVAL2
CRPIX2
=
=
=
=
=
=
CDELT1 =
CDELT2 =
PC001001
PC001002
PC002001
PC002002
EQUINOX =
=
=
=
=
'RA---TAN'
12.345678
512.0
'DEC--TAN'
-12.34567
525.5
/
/
/
/
/
/
tangential projection type
x- coord of reference pixel: RA in deg
x coord of reference pixel: PIXEL
tangential projection type
y- coord of reference pixel: DEC in deg
y coord of reference pixel: Pixel
-3.234E-5
3.234E-5
0.9848
0.1736
0.9848
0.1736
/
/
/
/
/
/
x- scale: degrees per pixel
y- scale: degrees per pixel
cos(CROTA)
- sin(CROTA)
sin(CROTA)
cos(CROTA)
2000.0
/ equinox
A third notation for WCS FITS header keywords is the
CDi_j
notation. Transformation formulae between
the dierent keyword notations are given in A Users Guide for the Flexible Image Transport System (FITS)
(version 3.1, NASA), Denition of the Flexible Image Transport System (FITS) (NOST 100-1.2) and the
Data Interface Control Document (GEN-SPE-ESO-19400-0794).
67
68
FORS User Manual
CTYPE1
CRVAL1
CRPIX1
CTYPE2
CRVAL2
CRPIX2
CD1_1
CD1_2
CD2_1
CD2_2
=
=
=
=
=
=
=
=
=
=
EQUINOX =
VLT-MAN-ESO-13100-1543
'RA---TAN'
12.345678
512.0
'DEC--TAN'
-12.34567
525.5
/
/
/
/
/
/
tangential projection type
x- coord of reference pixel: RA in deg
x coord of reference pixel: PIXEL
tangential projection type
y- coord of reference pixel: DEC in deg
y coord of reference pixel: Pixel
3.185E-5
-5.616E-5
5.616E-5
3.185E-5
/
/
/
/
partial
partial
partial
partial
2000.0
/ equinox
derivative
derivative
derivative
derivative
Appendix G
Field vignetting with the MIT CCD
Figure G.1: The eld of view of FORS2 with MIT CCDs is restricted by the MOS unit in the focal plane of
the unit telescope to about 6.8 arc-minutes for the standard resolution collimator.
69
70
Figure G.2:
FORS User Manual
VLT-MAN-ESO-13100-1543
In case of the high resolution collimator the corners of the eld of view are vignetted by the
camera lenses.
Index
order separation lters, 6
calibration plan, 33
overview table, 34
scale and eld distortion, 34
unsupported modes, 33
user provided lters, 8
world coordinate system, 67
calibration units, 25
new calibration units, 25
IMG mode, 6
night time calibrations, 25
IPOL mode, 15
calibrations, 33
instrument performance, 16
CCD, 23
restrictions, 15
conversion faction, 23
dark current, 23
LADC, 32
exposure shutter, 25
LSS mode, 12
fringes, 24
slit orientation, 66
linearity, 23
x-osets, 14
readout modes - standard modes, 23
manuals, 1
readout noise, 23
MOS mode, 12
readout time, 23, 25
ms only, 12
window readout, 23
movable slits, 12
slit lengths, 12
data reduction, 33
slit orientation, 65
pre-imaging data, 35
slitless spectroscopy, 14
MXU mode, 12
exposure shutter, 25
restrictions, 14
lters, 45
SR collimator only, 14
broad band lters, 6, 45
target acquisition, 14
combinations, 5
visitor mode - arrival time, 14
exchangeable components, 5
observing, 27
interference lters, 6, 49
fast or ms, 27
ms manual, 1
OB-preparation, 28
FORS
instrument components, 3
OCC mode, 9
instrument overview, 3
overhead times, 29, 30
example, 29
observing modes, 3
WEBpage, 1
P2PP
FORS upgrades
WEB page, 1
new calibration units, 25
Paranal Science Operations
replaced components, 26
contact information, 2
WEB page, 1
grisms, 13, 51
pipeline data reduction, 40
PMOS mode, 16
high time resolution modes, 18
instrument performance, 16
HIT mode, 18
restrictions, 16
imaging, 6
polarimetry, 15
broad band lters, 6, 45
chromatism of the half wave plate, 39, 40
lters, 45
circular polarization, 38
at elds, 36
imaging polarimetry, 15
instrument exures, 9
instrument performance, 16
interference lters, 6, 49
linear polarization, 39
occulting masks, 9
slitless spectro-polarimetry, 16
71
72
FORS User Manual
spectro-polarimetry, 16
Rapid Response Mode, 22
replaced components, 26
RRM, 22
service mode observations
contact information, 2
observing with FORS, 27
WEB page, 27
slitless spectroscopy, 14
SPECPHOT mode, 12
spectroscopy, 10
astrometric requirements, 10, 35
catalog of the HgCd, He, Ne and Ar lines, 54
data reduction for pre-imaging data, 35
eld of view, 10
at elds, 36
grisms - holographic, 10
grisms - standard, 10
grisms response, 51
instrument exures, 11
lamp exposure times, 37, 38
longslits, 12
order separation lters, 10
other lters, 10
overview table of all grisms, 13
wavelength calibrations, 37, 54
y-osets of grisms 600RI and 1400V, 10
standard instrument conguration, 5
exchangeable components, 5
lter combinations, 5
FORS2, 5
waivers, 5
telescope, 31
atmospheric dispersion corrector, 32
focus, 32
guide stars, 31
LADC, 32
paralactic angle, 32
rotator oset angle, 32
template manual, 1
visiting astronomers
general informations, 1
observing with FORS, 27
on the site, 31
WEB page, 1
world coordinate system, 67
VLT-MAN-ESO-13100-1543