1
Documentation and Analysis of Microsoft® Access Databases
For Microsoft® Access
www.fmsinc.com
License Agreement
PLEASE READ THE FMS SOFTWARE LICENSE AGREEMENT. YOU MUST AGREE
TO BE BOUND BY THE TERMS OF THIS AGREEMENT BEFORE YOU CAN
INSTALL OR USE THE SOFTWARE.
IF YOU DO NOT ACCEPT THE TERMS OF THE LICENSE AGREEMENT FOR THIS
OR ANY FMS SOFTWARE PRODUCT, YOU MAY NOT INSTALL OR USE THE
SOFTWARE. YOU SHOULD PROMPTLY RETURN ANY FMS SOFTWARE
PRODUCT FOR WHICH YOU ARE UNWILLING OR UNABLE TO AGREE TO THE
TERMS OF THE FMS SOFTWARE LICENSE AGREEMENT FOR A REFUND OF
THE PURCHASE PRICE.
Ownership of the Software
The enclosed software program (“SOFTWARE”) and the accompanying
written materials are owned by FMS, Inc. or its suppliers and are protected
by United States copyright laws, by laws of other nations, and by
international treaties. You must treat the SOFTWARE like any other
copyrighted material except that you may make one copy of the SOFTWARE
solely for backup or archival purpose, and you may transfer the SOFTWARE
to a permanent storage device.
Grant of License
Licenses are granted on a PER DEVELOPER basis. For each license, one
designated developer can use the SOFTWARE on one computer at a time.
Other Limitations
You may not reverse engineer, de-compile, or disassemble this SOFTWARE.
The SOFTWARE is licensed as a single product and may not be separated by
use for more than one user at a time. You may not rent or lease the
SOFTWARE.
You may not transfer any of your rights under the FMS Software License
Agreement to other individuals or entities. Without prejudice to any other
rights, FMS may terminate this FMS Software License Agreement at any
time if you fail to comply with any of its terms. In such an event of
termination, you must destroy and stop using all affected SOFTWARE
copies.
Total Access Analyzer
License Agreement i
Transfer of License
If your SOFTWARE is marked “NOT FOR RESALE”, you may not sell or resell
the SOFTWARE, nor may you transfer the FMS Software license.
If your SOFTWARE is not marked “NOT FOR RESALE,” you may transfer your
license of the SOFTWARE to another user or entity provided that:
1. The recipient agrees to all terms of the FMS Software License
Agreement.
2. You provide all original materials including software disks or
compact disks, and any other part of the SOFTWARE’S physical
distribution to the recipient.
3. You remove all installations of the SOFTWARE.
4. You notify FMS, in writing, of the ownership transfer.
Limited Warranty
If you discover physical defects in the media on which this SOFTWARE is
distributed, or in the related manual, FMS, Inc. will replace the media or
manual at no charge to you, provided you return the item(s) within 60 days
after purchase.
ALL IMPLIED WARRANTIES ON THE MEDIA AND MANUAL, INCLUDING
IMPLIED WARRANTIES OF MERCHANTABILITY AND FITNESS FOR A
PARTICULAR PURPOSE ARE LIMITED TO SIXTY (60) DAYS FROM THE DATE OF
PURCHASE OF THIS PRODUCT.
Although FMS, Inc. has tested this program and reviewed the
documentation, FMS, Inc. makes no warranty or representation, either
expressed or implied, with respect to this SOFTWARE, its quality,
performance, merchantability, or fitness for a particular purpose. As a
result, this SOFTWARE is licensed “AS-IS”, and you are assuming the entire
risk as to its quality and performance.
IN NO EVENT WILL FMS, INC. BE LIABLE FOR DIRECT, INDIRECT, SPECIAL,
INCIDENTAL, OR CONSEQUENTIAL DAMAGES RESULTING FROM THE USE, OR
INABILITY TO USE THIS SOFTWARE OR ITS DOCUMENTATION.
THE WARRANTY AND REMEDIES SET FORTH IN THIS LIMITED WARRANTY
ARE EXCLUSIVE AND IN LIEU OF ALL OTHERS, ORAL OR WRITTEN, EXPRESSED
OR IMPLIED.
Some states do not allow the exclusion or limitation of implied warrantees
or liability for incidental or consequential damages, so the above limitations
or exclusions may not apply to you. This warranty gives you specific legal
rights; you may also have further rights that vary from state to state.
ii License Agreement
Total Access Analyzer
U.S. Government Restricted Rights
The SOFTWARE and documentation are provided with RESTRICTED RIGHTS.
Use, duplication, or disclosure by the Government is subject to restrictions
as set forth in subparagraph (c) (1) (ii) of the Rights in Technical Data and
Computer Software clause at DFARS 252.227-7013 or subparagraphs (c) (1)
and (2) of the Commercial Computer Software - Restricted Rights at 48 CFR
52.227-19, as applicable.
Manufacturer is FMS Inc., Vienna, Virginia.
Printed in the USA.
Total Access Analyzer is copyright by FMS, Inc. All rights reserved.
Microsoft, Microsoft Access, Microsoft Excel, Microsoft Word, Microsoft Windows, Visual Basic, and
Visual Basic for Applications are registered trademarks of Microsoft Corporation.
All other trademarks are trademarks of their respective owners.
Total Access Analyzer
License Agreement iii
Acknowledgments
We would like to thank the entire Microsoft Access community for their
many years of support for Total Access Analyzer. Over the years, Total
Access Analyzer has won numerous “Best Access Add-in” awards and rave
reviews, and we are deeply in debt to all the people who trust us to solve
their Access database needs.
As our first Access add-in, Total Access Analyzer is what made it possible for
us to offer our extensive line of products for Access. Our success would not
be possible without the strong endorsement of Access users and developers
from around the world.
Thanks to the many existing users who provided valuable feedback and
suggestions, and to all of our beta testers for their diligence and feedback.
Many people at FMS, Inc. contributed to the completion of Total Access
Analyzer, including:
Product Design: Luke Chung
Development: Luke Chung, Dan Haught and David Juth
Quality Assurance and Technical Support: John Litchfield, Molly
Pell, Aparna Pophale, and Madhuja Vasudevan
Documentation: Luke Chung, Molly Pell, and Aparna Pophale
Table of Contents
Chapter 1: Introduction ........................................................................3
Product Highlights ................................................................................... 4
Enhancements in This Version ................................................................ 8
Enhancements from Previous Versions ................................................. 13
Visit Our Web Site ................................................................................. 21
Chapter 2: Installation and Startup ..................................................... 23
System Requirements ........................................................................... 24
Upgrading from Previous Versions ........................................................ 24
Installing Total Access Analyzer ............................................................. 24
Using the Update Wizard ...................................................................... 25
Uninstalling Total Access Analyzer ........................................................ 25
Preparing for Documentation ............................................................... 26
Starting Total Access Analyzer............................................................... 28
Microsoft Visual SourceSafe (VSS) ........................................................ 31
Startup Errors ........................................................................................ 32
Chapter 3: Documentation Basics ....................................................... 35
Why Document? .................................................................................... 36
ACCDB/MDB vs. ADP Documentation ................................................... 37
Documentation Process ........................................................................ 38
Documentation Limitations ................................................................... 40
Documentation Limitations for ADPs .................................................... 44
Chapter 4: Generating Full Documentation ......................................... 47
Main Form ............................................................................................. 48
Documentation Wizard Quick Start....................................................... 50
Page 1: Selecting Objects to Document ................................................ 52
Page 2: Specifying General Options ...................................................... 59
Page 3: Output Database and Scheduling ............................................. 63
Generating Documentation................................................................... 67
Troubleshooting Documentation Failures ............................................. 70
Chapter 5: Viewing Documentation .................................................... 75
View or Print? ........................................................................................ 76
Quick Start ............................................................................................. 77
Using the Documentation Explorer ....................................................... 80
Using Property Slices ............................................................................. 82
Errors, Suggestions, and Performance Tips ........................................... 83
Documentation by Object Type ............................................................ 87
Database Item ....................................................................................... 88
General Folder ....................................................................................... 89
Tables Folder ......................................................................................... 94
vi Table of Contents
Total Access Analyzer
Queries Folder ........................................................................................99
Views Folder .........................................................................................101
Database Diagrams Folder ...................................................................102
Stored Procedures Folder.....................................................................103
Relationships Folder .............................................................................104
Forms Folder ........................................................................................105
Reports Folder ......................................................................................107
Macros Folder ......................................................................................109
Overview of Module Documentation...................................................111
Modules Folder ....................................................................................112
Module Cross Reference ......................................................................115
Command Bars Folder ..........................................................................127
Diagrams Folder ...................................................................................129
Selecting Another Output Database to View .......................................135
Chapter 6: Searching Results ............................................................ 139
Initiating the Search .............................................................................140
Search Results ......................................................................................141
Searching a Previously Documented Database ....................................143
Chapter 7: Printing Documentation .................................................. 145
Quick Start ............................................................................................146
Selecting Reports .................................................................................149
Exporting Reports .................................................................................151
Filtering Reports ...................................................................................152
Customizing Reports ............................................................................154
Report Categories ................................................................................159
Report Sets ...........................................................................................170
Chapter 8: Quick Documentation...................................................... 173
Introduction .........................................................................................174
Quick Doc Wizard .................................................................................175
Chapter 9: Product Support .............................................................. 179
Support Resources ...............................................................................180
Web Site Support .................................................................................180
Technical Support Options ...................................................................181
Contacting Technical Support ..............................................................183
Index ............................................................................................... 185
Total Access Analyzer
Table of Contents vii
Welcome to Total Access Analyzer!
Thank you for selecting Total Access Analyzer. Total Access Analyzer is the
world’s premier database analysis and documentation program for
Microsoft Access, and has won more awards than any other Access product.
We would like to thank all of our loyal customers, and we trust that you’ll
find this version more valuable than ever.
Total Access Analyzer is developed by FMS, the leading developer of
Microsoft Access products. In addition to Total Access Analyzer, we offer a
wide range of products for Microsoft Access developers, administrators, and
users:
Total Access Admin (database maintenance control)
Total Access Components (ActiveX controls)
Total Access Detective (difference detector)
Total Access Emailer (email blaster)
Total Access Memo (rich text format memo fields)
Total Access Speller (spell checker)
Total Access Statistics (statistical analysis program)
Total Access Startup (version launcher)
Total Visual Agent (database maintenance and scheduling)
Total Visual CodeTools (code builders and managers)
Total Visual SourceBook (code library)
Total Zip Code Database (city and state lookup lists)
EzUpData (share your data, reports, and files over the internet
Visit our web site, www.fmsinc.com, for more information. We also offer
Sentinel Visualizer, an advanced data visualization program that identifies
relationships among people, places and events through link charts,
geospatial mapping, timelines, social network analysis, etc. Visit our
Advanced Systems Group at www.fmsasg.com for details.
Please make sure you sign up for our free email newsletter. This guarantees
that you will be contacted in the event of news, upgrades, and beta
invitations. Once again, thank you for selecting Total Access Analyzer.
Luke Chung
President
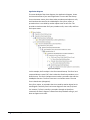
Chapter 1: Introduction
Total Access Analyzer provides comprehensive documentation and analysis of your Access
database objects. Documentation for ACCDBs, MDBs, and ADPs is generated for tables,
fields, indexes, relationships, queries, views, database diagrams, stored procedures, forms,
reports, controls, macros (regular and embedded), modules, command bars, users, groups,
security, import/export specifications and more. You can view and search the documentation
using the treeview display, or print the output using any of the program’s 300+ reports. Since
all output is stored in Access tables, you can also query or export the data for further
analysis.
Topics in this Chapter
Product Highlights
Enhancements in This Version
Enhancements from Previous Versions
Visit Our Web Site
Total Access Analyzer
Chapter 1: Introduction 3
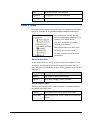
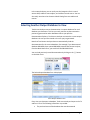
Product Highlights
Total Access Analyzer Main Menu
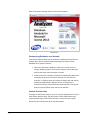
Rave Reviews and Awards
The most popular Access add-in ever, Total Access Analyzer has received
rave reviews and numerous awards, including every “Best Access Add-in”
award since 1994. It is recognized as the premier tool for generating
comprehensive documentation and analysis of Access databases, and many
developers won’t ship their databases without running them through Total
Access Analyzer first.
Comparison to the Built-in Documenter
Microsoft Access includes a built-in database documenter; however, its
features are lacking for most Access users and developers. The built-in
documenter only examines objects individually. It does not answer the
critical question “Where is this object used?”, nor does it perform code
analysis on your macros and VBA modules.
In addition to documenting individual objects, Total Access Analyzer is
designed to analyze the entire database. Each object isn’t just considered by
itself, but in relation to all the other objects in the database. It performs
sophisticated analysis to show everywhere an object is used and the
complex relationships between them. By examining the entire database,
hidden information (such as references to fields or objects that don’t exist
and objects that aren’t used) is revealed. Additionally, Total Access Analyzer
4 Chapter 1: Introduction
Total Access Analyzer
documents offers almost 300 errors and improvement suggestions, and the
ability to search for values across all your objects.
For more detailed comparisons, visit our web site:
http://www.fmsinc.com/Products/analyzer/compare.htm
Product Overview
Here are some highlights of Total Access Analyzer.
Documents your Access databases and generates detailed views and
390+ reports of what’s in your database
Detects and recommends almost 300 specific types of ways to fix,
improve or speed up your application, including unused object and
code analysis
Detailed VBA code analysis with recommendations for applying
coding Best Practices
Generates diagrams to illustrate how your code and data flow
across objects
A powerful Search feature to locate strings, property values, and
code within the documentation
Completely Wizard driven, runs from the Add-ins ribbon (in Access
2007 and later), or the Tools, Add-ins menu (in Access 2003 or
earlier)
Offers a variety of filterable views and reports
All results are stored in tables in a separate Access database that
can be referenced in the future
A Quick Doc feature to document basic information for individual
objects and generate formatted module printouts
Basic Documentation
Total Access Analyzer
Documents table fields, indexes, linked table information, and
properties (including descriptions).
Documents query type, SQL, included tables and fields, parameters,
joins, and properties.
Documents forms and reports with sections, controls, and
properties including embedded macros.
Generates form and report blueprints, showing their layout with
annotated controls.
Documents saved import/export specifications.
Generates macro and module code listings with line numbers.
Creates table relationship documentation with tables, fields, join
type, and referential integrity settings.
Chapter 1: Introduction 5
Documents workgroup, security, and permission settings.
Documents ADP objects such as views, stored procedures, and
diagrams.
Object Cross Reference
Documents where and how objects reference each table, field,
query, form, report, macro, and sub-macro.
Module Analysis
Generates bracketed source code printouts showing where each
loop begins, ends, and exits. Standardizes code indentations.
Extensively analyzes modules, documenting definitions and usage of
procedures, properties, variables, constants, user defined types,
library declarations, events, classes, VBA functions, DoCmd, labels,
TempVars, etc.
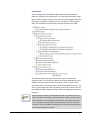
Hierarchical Diagrams
Cross reference documentation is only one level (what references an
object). The diagrams in Total Access Analyzer illustrate the complex, multilevel hierarchy of those relationships.
For instance, the data flow diagram not only shows which objects reference
a table, but also all the objects that reference those objects. Easily see how
a table flows through a query, into another query, and into a subform that’s
referenced by a master form. See the objects that are impacted by
modifying a table.
Total Access Analyzer offers three diagrams:
Application flow diagram
Shows how your application flows across macros, objects, events,
and procedures.
Data flow diagram
Shows how your tables flow through the entire family of queries,
forms, reports, and modules.
Object diagram
Shows the family of objects referenced directly and indirectly by a
form, report, or query.
Diagrams can show the entire application hierarchy, and can also be
“redrawn” to display and print the hierarchy of a single object.
6 Chapter 1: Introduction
Total Access Analyzer
Errors, Suggestions and Performance Tips
A complete list of Errors, Suggestions and Performance Tips is available in
Total Access Analyzer’s System Reports.
Errors
One of Total Access Analyzer’s most valuable features is its ability to detect
errors in your database, including many hidden bugs that cause your
database to crash when it is run. While no automated tool can catch every
possible bug, Total Access Analyzer finds many types of problems and offers
suggestions about how to resolve them. In fact, many developers won’t ship
a database until it passes Total Access Analyzer’s analysis.
Suggestions Offered
Based on our experience developing Access applications and feedback from
our customers, we’ve discovered a wide range of “Best Practices”
techniques. Many of these tips can be detected and are offered to help
users and developers improve their databases and learn better styles.
Suggestions are issues that are not likely to cause the database to crash, but
that should be addressed to clean up the database and simplify future
maintenance.
Performance Tips
Total Access Analyzer includes several Performance Tips to help you
optimize your database. The Performance Tips detected by Total Access
Analyzer include:
Output Reports
Over 390 presentation quality reports are available with a variety of sorting
options, including:
Total Access Analyzer
Database summary (overview)
Lists and detailed reports of every object type
Table structure reports including field descriptions
Field dictionary reports to see where and how the same field name
is defined across different tables
Report Page Setup summary report to quickly see the orientation
and margins of all the reports
Module printouts including a basic listing and a formatted,
bracketed source code report clearly showing every loop
Summary for each module and class revealing their public interface
and summary of private items
Chapter 1: Introduction 7
Detailed module cross reference reports for procedures, variables,
DoCmd, VBA functions, events, labels, user defined types, and many
other parts of module code
Diagram reports for Application, Data, and Object Flows
Enhancements in This Version
The latest version for Total Access Analyzer is for Microsoft Access 2013 and
is our tenth major release of Total Access Analyzer. It is built on our growing
knowledge, experience and customer feedback on the best practices for
Microsoft Access database development. In addition to Access 2013, we
also created updates for earlier versions. These are the new releases:
Version 15.0 for Microsoft Access 2013
Version 14.5 for Microsoft Access 2010 (update from 14.0)
Version 12.95 for Microsoft Access 2007 (update from 12.90)
Version 11.95 for Microsoft Access 2003 (update from 11.90)
We added many new features (some are only applicable to the Access 2013
or 2010 versions):
Microsoft Access 2013 Support
Total Access Analyzer 2013 runs as an add-in for the 32 and 64 bit versions
of Microsoft Access 2013. It documents all Access database formats
supported by Access 2013 including ACCDB and MDB formats. Access 2013
does not support Access Data Project (ADP) formats.
The new version supports the new object properties, macro commands,
module VBA commands, and Access options in Access 2013. Accordingly,
data types are now Short and Long Text rather than Text and Memo.
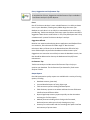
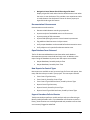
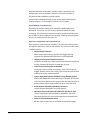
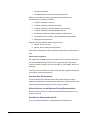
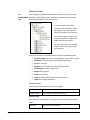
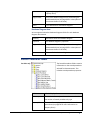
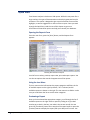
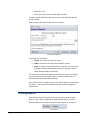
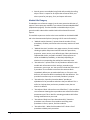
Search Bar for Selecting Objects
A search bar, similar to what’s available on the Navigation Pane, is added to
the places where you select objects.
8 Chapter 1: Introduction
Documentation Wizard
Quick Doc Wizard
Report Filter, Objects Tab
Total Access Analyzer
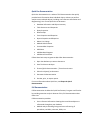
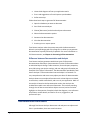
Search Bar to Filter Names for Selection
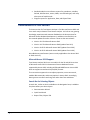
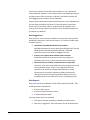
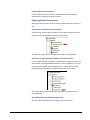
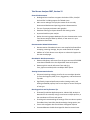
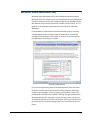
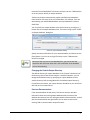
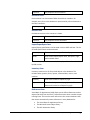
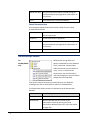
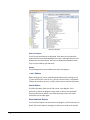
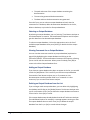
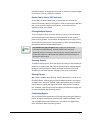
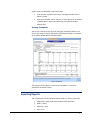
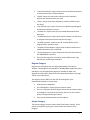
Report Filter Shows Count of Issues
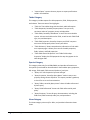
For the reports that show issues, you can specify a filter to limit which issues
are included. The Errors, Suggestions, and Performance tabs now show the
count for each issue to make it easier to decide which issues to include:
When Filtering Issues for Reports, You Can Now See the Count for Each Issue
Enhanced VBA Module Parser for Compiler Conditionals
The VBA module parser for the 2010 version added support for compiler
conditionals in the declarations section or procedures as defined in
#IF...#ELSE…#END IF statements. This is particularly common when using the
VBA7 constant to manage 32 versus 64 bit code:
Total Access Analyzer
Chapter 1: Introduction 9
#If VBA7 Then
< 64 bit specific code >
#Else
< 32 bit specific code >
#End If
The VBA parser in Total Access Analyzer 2013 supports entire procedures
defined by compiler conditionals to avoid triggering duplicate procedure
definition issues. The duplicate procedures should be paired together:
#If VBA7 Then
Sub ProcName()
...
End Sub
#Else
Sub ProcName()
...
End Sub
#End If
Documentation of Conditional Formatting
On forms and reports, controls may have conditional formatting
to use colors for different values. Total Access Analyzer
documents those settings and performs cross-reference analysis
to determine if fields, code and other references are valid.
These new reports are available:
Form Controls with Format Conditions
Report Controls with Format Conditions
Documentation of Navigation Control and Buttons
Total Access Analyzer documents the navigation controls and buttons.
References to subforms are documented and cross-referenced for
validation. Additionally, an error and two suggestions are offered:
10 Chapter 1: Introduction
Navigation Control Button Has No Action
A navigation control has a navigation button that does not have any
events and its NavigationTargetName property is not defined. This
means if the user clicks on the button, the navigation subform is not
updated and nothing happens.
Navigation Control Button has No Caption
A navigation control button doesn't have a caption or picture, so it's
just blank.
Total Access Analyzer
Navigation Control Button Should Show Hyperlink Hand
Display a hyperlink hand rather than the default mouse arrow when
the cursor is over the button. This provides a user experience similar
to a web browser. Set the button's Cursor On Hover property to
Hyperlink Hand to get this feature.
Documentation Enhancements
Documentation was enhanced to:
Document Web Browser control type properties
Improve analysis of embedded macros on form events
Improve parsing of SQL statements
Improve VBA parsing to preserve control names in parameters
Flag additional bad characters in object names
Verify output database can be created before documentation starts
Verify objects aren’t open before documentation starts
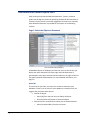
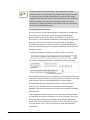
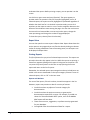
Open Database Form Enhanced
The list of documented databases now shows when each database
documentation process started and how long it took. In addition to the
report listing the databases by name, two new reports are available:
Output Databases, Sorted by Analysis Time
Output Databases, Sorted by Start Time
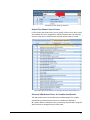
New Reports for Control Types
New reports are available to see, by control type for forms and reports, how
many and where they are used in your project. The new reports include:
Form Control Type Summary
Form Controls, Sorted by Control Type
Form Control Types 2010 and Later, Sorted by Control Type
Report Control Type Summary
Report Controls, Sorted by Control Type
Report Control Types 2010 and Later, Sorted by Control Type
Support Procedure Calls to Libraries
Total Access Analyzer performs module analysis and cross-referencing to
identify invalid procedure calls. If your database calls functions stored in a
library, those functions are not being detected and procedure calls to them
are incorrectly flagged as undefined.
Total Access Analyzer
Chapter 1: Introduction 11
Total Access Analyzer cannot detect the procedures in your referenced
library databases. However, if you create a table in your database listing the
procedure names from your library or libraries, Total Access Analyzer will
avoid flagging those procedure calls as undefined.
Simply create a table name usysTAnalyzerLibraryProcs in your database with
two text fields: Procedure and Library. Fill the table with the procedure
names you call. The library value isn’t required, but provided for easier
tracking. Total Access Analyzer will check the list to avoid identifying those
procedures as undefined.
New Suggestions
Over the years, as we encounter mistakes in our own work, when possible,
we add their detection to Total Access Analyzer. This version includes many
new Best Practices:
Unused DLL and Windows API Declare Procedures
DECLARE statements let you use procedures defined in DLL files and
Windows API commands. Procedures defined in DECLARE
statements that are not called are flagged as unused.
Property or Procedure Name Conflicts with Parameter
Parameters shouldn’t be the same name as the property or
procedure name since it creates confusion when referencing it.
Unused Constants, Variables, and Parameters are Separated
Previously, all of these unused definitions were categorized into one
Unused Variables group. They are now separated into three
separate issues so you can manage them differently. Unused
Parameters are particularly important to address because the
calling procedure may be expecting different behavior from the
procedure based on that parameter, but it’s completely ignored.
New Reports
Many new reports were added for a total of 400+ reports from 380+. They
include these items listed earlier:
6 Control Type reports
4 Control Format Conditions reports
2 Output Database reports
Two new system reports are available:
12 Chapter 1: Introduction
Total Access Analyzer New Reports Added Since 2010 Version
New Errors, Suggestions, and Performance Tips Since 2010 Version
Total Access Analyzer
New Treeview and Graphics
The hierarchical treeview is used in the View Explorer and Diagrams. A new
treeview interface is provided with more modern graphical icons and font,
more responsive expand and collapse behavior in the diagrams, and support
for 32 and 64-bit versions of Microsoft Access.
Improved Module Display and Opening to the Current Module
When viewing module results, the Module Tab now shows the entire
module rather than separate records for each procedure.
When viewing module results, you can press the Design icon to open the
module editor at the current procedure. This feature is enhanced to better
handle property Get, Let, and Set definitions, and to move to the first line of
the procedure (after any comment lines) and highlight it.
User Interface Enhancements
With higher and higher resolution monitors, larger fonts are used
throughout the program to make it easier to read.
Revised User Manual and Help File
The user manual and help file are updated with the new features.
Enhancements from Previous Versions
Total Access Analyzer 2010, Version 14.0
Microsoft Access 2010 Support
Total Access Analyzer 2010 runs as an add-in for the 32 and 64 bit versions
of Microsoft Access 2010. It documents all Access database formats
supported by Access including ACCDB, MDB and ADP formats.
This version supports the new object properties, macro commands, module
VBA commands, and Access options in Access 2010.
VBA Module Parser Supports Compiler Conditionals
The VBA module parser now supports compiler conditionals as defined in
#IF...#ELSE…#END IF statements. This is particularly common when using the
VBA7 constant to manage 32 versus 64 bit code:
#If VBA7 Then
< 64 bit specific code >
#Else
< 32 bit specific code >
#End If
Total Access Analyzer
Chapter 1: Introduction 13
Duplicate definitions of constants, variables, declare statements, user
defined types, enum, procedures, and other constructs are properly
documented and handled for the code analysis.
Conditionals are displayed in many of the module XREF documentation
views and reports. A new Compiler Conditions item is added.
Partial Module Cross-Referencing
Previously, all modules needed to be selected for Module XREF to be
performed. This version lets you choose a subset of modules for faster
processing. The code analysis may be incomplete if important modules are
not included. If some modules are not selected, a warning message appears,
but you can now proceed at your own risk.
New Errors, Suggestions and Performance Tips
Over the years, as we encounter mistakes in our own work, when possible,
we add their detection to Total Access Analyzer. This version includes many
new Best Practices:
14 Chapter 1: Introduction
Advanced Macro Analysis
Macro actions with missing arguments are flagged. Missing
arguments for RunMenuCommand items are also detected.
Undefined and Unused TempVars Detected
Temporary variable cross-referencing detects TempVars referenced
but not created, and TempVars created and not used.
Timer Interval and Timer Event Mismatch
Forms with a timer interval (not 0) but no Form_Timer event are
flagged. Similarly, forms with a Form_Timer event but timer interval
property set to zero are documented.
Queries Using Other Queries with Both having GroupBy Clauses
Queries with GROUP BY clauses take longer to process. Queries with
Group By clauses based on other queries with Group By clauses may
perform better if the Grouping were only done at the final level.
Action Queries Opened by OpenQuery Command
Use the Execute command to run action queries.
SQL Server list of reserved words updated for SQL Server 2012
The list of SQL Server reserved words is updated for SQL Server
2012 along with the new list of anticipated future reserved words.
Check for Truncated Number Fields
Set this option so users are not confused by truncated numbers.
Total Access Analyzer
Enhanced Macro Documentation
IF..ELSE..END IF syntax in macros are documented and displayed with
indentations in the Macro Dictionary reports.
Displaying Results Enhancements
Many enhancements were made to show more data and make it easier to
use.
ActiveX Controls added to the General Folder
A new item for ActiveX Controls makes it easy to see the types of ActiveX
controls used in the database and where they are used.
This does not appear if there a no ActiveX controls in your database.
Temporary Variables (TempVars) added to the General Folder
In Access 2007 and later, temporary variables can be assigned from macros
and modules, including embedded macros on forms and reports. They can
be used on many object types including queries. A new TempVars item
provides the list of temporary variables and where there are used.
This makes it easy to see how temporary variables are used across your
entire database.
New Table-Fields Folder added to Tables Folder
The new Table-Fields folder lists the fields across all the tables.
Total Access Analyzer
Chapter 1: Introduction 15
This makes it easy to filter and sort field names and types across all your
tables.
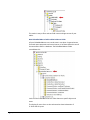
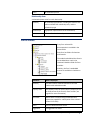
New Embedded Macros Folder added to Macros Folder
All your Embedded Macros can now be seen in one place. Scattered across
form and report properties and control events, it has been difficult to see all
the automation code in a database. The Embedded Macros folder
consolidates this:
Look at all the embedded macros or filter down to a specific object and
event.
The display of macro lines are also enhanced to show indentation of
IF..ELSE..END IF syntax.
16 Chapter 1: Introduction
Total Access Analyzer
Explorer Tab Captions are Context Sensitive
The Explorer has many tabs which vary based on the selected folder or
object in the treeview. To make it easier to know what’s available, the
captions change to better describe what's available. For tabs that never
have data to display, the captions are blank.
Enhanced Opening of Referenced Object in Design Mode
For modules, when viewing the Module XREF tab, pressing the Design
button now opens the referencing (parent) object. Previously, it was
opening the called object which can still be opened from the other tabs, but
the XREF opens the calling side which makes it more convenient to see
where your code is used.
Report Enhancements
Preview Multiple Reports
Previously, only one report could be previewed or opened in report view.
Now, multiple reports can be opened simultaneously so you can see more
reports at once. The only exception is when the same report is used with
different filters where only one instance of that report can be opened at a
time.
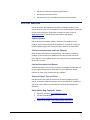
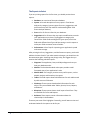
Color Customization for Reports
Colors can be applied to sections of the report under Report Options. Text
and background colors can be selected for the title, sub-title, headers,
footer, and group shading:
The settings are automatically applied to all the reports. See Colors on page
156 for more information.
New Reports
Many new reports were added for a total of 380+ reports. They include
database level documentation:
Total Access Analyzer
ActiveX Controls: Summary and Cross-References
Import Export Specifications details
Chapter 1: Introduction 17
Temporary Variables
Workgroup Security Summary of Groups and Users
Module Cross-Reference reports were added, especially with the
documentation of compiler conditions:
Compiler Conditions, Summary
Compiler Conditions, Sorted by Condition
Compiler Conditions, Sorted by Module and Procedure
Compiler Conditions, Sorted by Module and Line
Variable List Condition, Sorted by Module and Procedure
Variable Constants Condition, Sorted by Module and Procedure
Debug and Stop Statements
Reports were also added for where DoCmd is used:
DoCmd, Action Summary
DoCmd, Action and Argument Summary
Many of the existing reports were modified to show where conditionals are
used.
Macro Dictionary Reports
For regular and embedded macros, the macro action is moved to the top of
the line and bolded, followed by each of its argument labels and values,
similar to the way it appears in the macro editor. IF..ELSE..END IF blocks are
indented.
There are two macro dictionary reports now. One has a page break between
every macro, and the other doesn’t.
User Interface Enhancements
The look and feel of the add-in supports Office 2010 themes and other
appearances expected in a modern Access application. Maximized forms are
used where appropriate to display as much data as possible.
Microsoft Access can be Minimized During Documentation
While Total Access Analyzer is performing database documentation, it can
now be minimized.
Revised User Manual and Help File
The user manual and help file are updated with the new features.
18 Chapter 1: Introduction
Total Access Analyzer
Total Access Analyzer 2007, Version 12
General Enhancements
Redesigned user interface to support the sleeker Office, Vista/XP
look and feel including support for Tabbed views
Main screen redesign to simply the context of the currently
documented database and opening previous documentation
The use of transparent buttons with graphics
Datasheet filtering for object selection and viewing results
Improved module syntax analysis
Rather than storing output databases for your documentation in the
Total Access Analyzer folder by default, it now stores it in your
Application Data folder
Documentation Wizard Enhancements
Documentation of databases that are not compiled is allowed after
accepting a warning message, but your code should still compile
Addition of a Finish button once objects are selected to bypass the
last two wizard pages
New Module VBA Documentation
Detects table/query references from the open command of ADODB
recordsets and adds this to the Object XREF views and reports
Detects explicit control references from code (e.g.
Form_MyForm.txtValue) with new Object XREF reports
Viewing Documentation Results
Enhanced switching to design view for the current object whether
it's from the Diagrams, XREF, Errors, Suggestions, and Performance
Tips tabs
Significantly improved performance when viewing results, and
looking at detailed property lists for one object or across all objects
of one type
New Suggestions and Performance Tips
Total Access Analyzer
Eliminate/Consolidate duplicate queries: Identical SQL Analysis to
determine if the same SQL string is used across multiple queries, or
the recordsource of forms and reports
Checking and recommending the settings of the new Access options
like tabbed view, Search Bar, datasheet design change option, etc.
Forms with navigation bars should have a Navigation Caption
Command Buttons should show Hyperlink Hand on mouse hover
Chapter 1: Introduction 19
Datasheet and continuous forms should take advantage of the new
alternating background color option
Unused forms and reports
Module analysis:
o
Use of old constants from pre-Access 97 syntax
o
Procedures with exits in the middle of its body
New Access option for database picture property storage to reduce
database size
Report Enhancements
Reports can be sent to the new Report View which supports your
ability to filter the results interactively
Individual or multiple reports can be exported to formats such as
HTML, PDF, RTF, Snapshot, Text, and XPS files to a folder
The list of reports excludes reports with no data
New Reports
There are over 300 professional quality reports with the option to Preview,
Print, Report View, or export. Here are some of the new reports:
New Access Options reports
Import Export Specifications
Embedded macros and what they cross-reference
TempVars assignments and cross-reference
Objects with Identical SQL and RecordSource
Unused forms, reports, and code
Enhanced Database Summary reports
Table field property slice reports
Search Enhancement
Search lets you view results and jump directly into design view of
the currently selected item
Support for the New Features of Access 2007
Total Access Analyzer 2007 supports the new features in Access 2007,
including:
20 Chapter 1: Introduction
Supports the new ACCDB database format
Documents and cross-references the new embedded macros in
Access forms and reports
Supports new Access 2007 macro commands
Supports new Access 2007 VBA commands
Total Access Analyzer
Documents saved import/export specifications
Documents links to SharePoint
Documents the use of variables tied to the TempVars object
Visit Our Web Site
FMS is constantly developing new and better developer solutions. Total
Access Analyzer is part of our complete line of products designed specifically
for the Access developer. Please take a moment to visit us online at
www.fmsinc.com to find out about new products and updates.
Product Updates
FMS is committed to quality software. When we find problems in our
products, we fix them and post the new builds on our web site. Check our
Product Updates page in the Technical Support area for the latest build.
Product Announcements and Press Releases
Read the latest information on new products, new versions, and future
products. Press releases are available the same day they are sent to the
press. Sign up in our Feedback section to have press releases automatically
sent to you via email.
Product Descriptions and Demos
Detailed descriptions for all of our products are available. Each product has
its own page with information about features and capabilities. Demo
versions for most of our products are also available.
Technical Papers, Tips and Tricks
FMS personnel often speak at conferences and write magazine articles,
papers, and books. Copies and portions of this information are available to
you online. Learn about our latest ideas and tricks for developing more
effectively.
Social Media: Blog, Facebook, Twitter
Total Access Analyzer
Signup for our blog: http://blog.fmsinc.com/
Like our Facebook page:
https://www.facebook.com/MicrosoftAccessProducts
Follow us on Twitter: http://www.twitter.com/fmsinc
Chapter 1: Introduction 21
Links to Other Development Sites
Jump to other locations, including forums, user groups, and other sites with
news, techniques, and related services from our website.
22
Total Access Analyzer
Chapter 2: Installation and Startup
Total Access Analyzer comes with an automated setup program to get you up and running as
quickly as possible. This chapter describes the system requirements, installation steps, and
instructions for uninstalling. It also provides information about running the program for the
first time, and tips for troubleshooting startup errors.
Topics in this Chapter
System Requirements
Upgrading from Previous Versions
Installing Total Access Analyzer
Using the Update Wizard
Uninstalling Total Access Analyzer
Preparing for Documentation
Starting Total Access Analyzer
Microsoft Visual SourceSafe (VSS)
Startup Errors
Total Access Analyzer
Chapter 2: Installation and Startup 23
System Requirements
Total Access Analyzer is a Microsoft Access library database that runs within
Access. Its system requirements are similar to the requirements of
Microsoft Access, and include:
A copy of the Microsoft Access version corresponding to the Total
Access Analyzer version.
Hardware and operating system supported by Microsoft Access.
90 MB free disk space to install the product, and additional disk
space to store your documentation.
Total Access Analyzer can only be opened through its associated version
of Access, and will work with database formats supported by the specific
version of Access.
Upgrading from Previous Versions
Just like multiple versions of Microsoft Access can reside on the same
machine, multiple versions of Total Access Analyzer can be installed—just
make sure to install them in separate folders. Each version of Total Access
Analyzer is a completely separate program, and files are not shared
between versions. If you no longer use a version of Total Access Analyzer,
you can remove it without affecting other installations (see page 25 for
details).
Installing Total Access Analyzer
Where to Install Total Access Analyzer
For best performance, install Total Access Analyzer on a local hard drive.
Installing to a network drive will cause slower performance.
By default, Total Access Analyzer creates temporary files and stores its
output in your Windows Application Data folder (you can change this).
Regardless of where you install the program, it can document databases
stored locally or on a network.
If you install Total Access Analyzer on a network drive, each user must have
full rights to that folder. Do not make the folder read-only. Microsoft Access
add-ins cannot be installed in a Read Only folder.
Installing Total Access Analyzer on a network drive allows you to save space
on your local system and allows multiple network users to run Total Access
24 Chapter 2: Installation and Startup
Total Access Analyzer
Analyzer (but not at the same time). You must purchase a copy of Total
Access Analyzer for each developer who uses the program. FMS offers
quantity discounts to economically add developer counts.
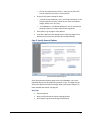
Installation Steps
Total Access Analyzer is installed using an automated setup program. To
install Total Access Analyzer, follow these steps:
1. Locate and run the setup program.
2. When prompted, enter your registration information and product
key (serial number).
3. Select whether to install for This Machine or Current User. Choose
This Machine to let any user on the PC run it. Only select Current
User if your permissions do not allow you to install programs for the
machine.
4. Specify the destination folder for the program. We recommend a
local hard disk. More information in the following section.
5. Confirm the setting and press Next to install the program.
6. When installation is completed, be sure to review the readme file
for any late breaking news that is not included in the manual or help
file.
Using the Update Wizard
Total Access Analyzer includes a built-in mechanism to check the availability
of updates via the Internet. If you have an active Internet connection, you
can use the Total Access Analyzer Update Wizard to ensure that you have
the latest version.
To run this program, press the Windows Start button and select Programs,
FMS, Total Access Analyzer, Update Wizard. Follow the prompts to check for
the latest update.
Uninstalling Total Access Analyzer
Total Access Analyzer follows standard Windows installation protocol, so
uninstalling is straightforward.
From the Windows Start Menu, select Control Panel, then
Total Access Analyzer
Chapter 2: Installation and Startup 25
Windows Vista, Windows 7, 8, 10 and Later
1. Select Uninstall a Program (in Programs section)
2. Select FMS Total Access Analyzer from the list of installed programs
3. Click on Uninstall/Change
4. Follow the prompts to uninstall.
Windows XP
1. Select Add/Remove Programs
2. Select FMS Total Access Analyzer from the list
3. Press the Change/Remove button
4. Follow the prompts to uninstall.
Please note that uninstalling does not delete any documentation databases
that you created with Total Access Analyzer. If you want to remove these
files, use Windows Explorer to locate and delete the files, which all have the
*.TDB file extension.
Preparing for Documentation
Before documenting your database with Total Access Analyzer, make sure
your database is ready. By understanding the issues listed here, you can
document your databases more rapidly and effectively.
Have permissions for all objects
In order for Total Access Analyzer to document objects, it needs to open
them in design mode. Ideally, you should open Access as the owner of the
database with sufficient permissions for all objects. You must have at least
Read Definitions permission for each object that you wish to document.
Make sure the database is not being used
You should be the only one in the database when you document it. This
ensures that you have full access to all objects that Total Access Analyzer
examines, and that your results are consistent. If this is not possible because
your database is shared on the network, make a local copy to document.
Total Access Analyzer can still run in a shared situation, but may generate
incomplete results in cases where users are modifying objects or have
objects open.
26 Chapter 2: Installation and Startup
Total Access Analyzer
The best way to avoid this situation is to open your database in Exclusive
mode (by selecting the Open Exclusive option on the [Open] button in the
Open Database dialog).
Make sure your database is not corrupt
Total Access Analyzer cannot document corrupt or damaged database
objects. We recommended compacting and repairing your database before
running Total Access Analyzer.
For optimal performance, your databases should be regularly compacted
and backed up. If you do not have an automated process in place,
consider Total Visual Agent from FMS, which automates these
administrative chores. For more information and a trial version, visit
http://www.fmsinc.com/Products/Agent/
Verify linked tables for MDB and ACCDBs
If your Jet database contains linked tables, check your table links before
generating documentation. Broken links often occur when linked databases
or their objects are renamed or moved. Total Access Analyzer flags tables
that are not linked properly, but it cannot document its properties, child
objects, etc. It will also have problems documenting objects referencing
those tables. You should make sure that all the links to external tables are
valid by using the Linked Table Manager available from the Navigation Pane
when you right click on table.
Special Handling for Linked SharePoint and Office365 Tables
If you have tables linked to a SharePoint lists (which may be hosted by
Office365), make sure you are logged into the server before starting
documentation. If not, when Total Access Analyzer documents the table,
Access may prompt for the login and not allow it to continue until you do
so. Unfortunately, we are unable to trap this, so skip and go to the next
table, so the entire process pauses until you log in.
Verify connection for ADPs
If your database is a Microsoft Access Project (ADP), you must ensure that it
is properly connected to its back-end server (the SQL Server, SQL Express, or
other database containing its data objects). If a connection cannot be
established, Total Access Analyzer cannot document the database. Access
2013 no longer supports ADP files.
Make sure your code compiles
Your module code must contain valid syntax if you want Total Access
Analyzer to perform module cross referencing, which documents your
Total Access Analyzer
Chapter 2: Installation and Startup 27
procedures, variables, etc. Open one of your modules or press [Alt-F11] and
select Debug|Compile <project name> from the menu. After correcting any
syntax errors, select File|Save <project name>. This instructs Microsoft
Access to compile and save all of your module code, including code behind
forms and reports. Your project remains in a compiled state until you make
additional changes to your database’s VBA project.
Have sufficient disk space for output
Make sure the drive containing the Total Access Analyzer output folder has
enough free space. By default, this is in your Application Data folder under
Total Access Analyzer, 15.0, Output.
If you are generating blueprints, cross reference documentation, or all
properties for all objects, a large amount of disk space may be required. The
amount of space is based on the documentation options and the number
and complexity of the objects selected. It is not based on amount of data
stored in your database. Unfortunately, Total Access Analyzer cannot
determine the amount of space required before documenting your
database. It is not surprising, however, to have an output database that is
many times larger than the database that you are documenting.
Make a backup copy of your database
We have tried to anticipate every possible situation that could cause
unwanted results in your database during documentation. However,
unexpected problems with Microsoft Access, Windows, or your hardware
can cause problems that damage your database. You should always have a
backup copy of your database before you run any utility program, including
Total Access Analyzer. This ensures that you can recover from a system
failure.
Starting Total Access Analyzer
Total Access Analyzer runs from within Microsoft Access. The program is a
Microsoft Access Add-in and uses Microsoft Access forms, reports, tables,
and queries. If you are familiar with Microsoft Access, you should feel very
comfortable using Total Access Analyzer.
First, start Microsoft Access and open the database to document. Select the
Open Exclusive option if there’s a chance that someone else may modify it
during the documentation process. You do not need to enable the code in
your database for Total Access Analyzer to document it.
28 Chapter 2: Installation and Startup
Total Access Analyzer
If you have an AutoExec macro or Startup form in your database, other
objects may be automatically opened. To ensure that these objects do
not interfere with Total Access Analyzer, close any open objects except
the database window, or hold down the [Shift] key while clicking the
[Open] button in the dialog box to prevent these objects from opening.
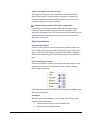
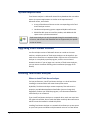
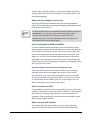
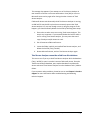
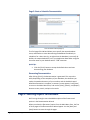
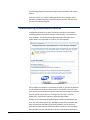
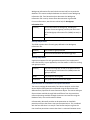
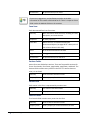
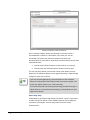
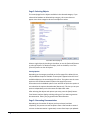
Next open Total Access Analyzer. In Access 2007 and later, open Total
Access Analyzer from the Database Tools ribbon, Add-ins menu:
Starting Total Access Analyzer in Access 2013, 2010 or 2007
In Access 2003 and earlier, open Total Access Analyzer from the Tools, Addins menu:
Starting Total Access Analyzer in Access 2003 and Earlier
Total Access Analyzer
Chapter 2: Installation and Startup 29
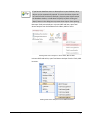
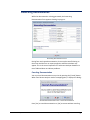
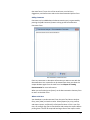
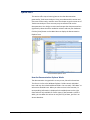
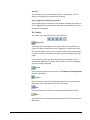
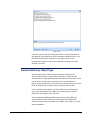
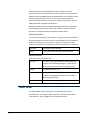
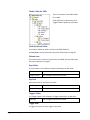
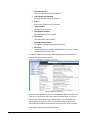
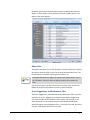
When Total Access Analyzer opens, the main form appears:
Initial Screen
Documenting Databases on a Network
Total Access Analyzer allows you to document a database that resides on a
network drive, but we recommend documenting local copies of these
databases for a couple of reasons:
1. When you document a database, make sure no other users are
using or designing objects. Total Access Analyzer cannot document
objects that other users have open or locked.
2. Performance over a network connection is substantially slower than
accessing a local drive. Total Access Analyzer is a disk-intensive
program—it needs to open your objects in design view and read all
properties and definitions. Because of this, running across a
network connection may cause slower performance in Total Access
Analyzer and may affect other users on the network.
Context Sensitive Help
Throughout Total Access Analyzer, you can press the [Help] button or [F1] to
view context-sensitive help. The help system is fully indexed with many
jumps between topics. Most of this manual is in the online help system,
which may also include more up-to-date information.
30 Chapter 2: Installation and Startup
Total Access Analyzer
Microsoft Visual SourceSafe (VSS)
Microsoft Visual SourceSafe (VSS) is part of MSDN and can be used with
Microsoft Access for version control. It is installed with the Access developer
extensions program and lets you manage changes to your database objects
with features such as check-in/check-out, rollback, version control, etc. It’s
great for multi-developer environments but also helpful for individual
developers.
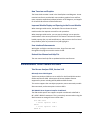
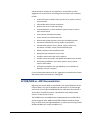
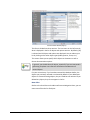
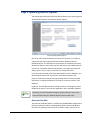
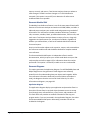
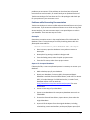
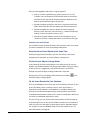
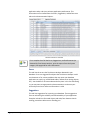
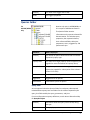
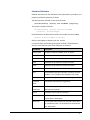
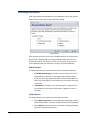
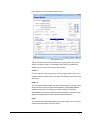
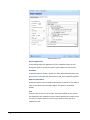
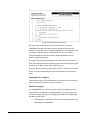
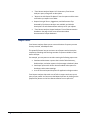
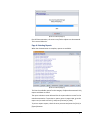
If your database is under Microsoft Visual SourceSafe control, a warning
message appears when you launch Total Access Analyzer. The warning
message recommends that a VSS option be set to No, so that you are not
prompted when a new object is created.
Visual SourceSafe Warning
In the course of generating some of the documentation (form and report
blueprints, and the relationship window reports), temporary objects get
created in your database. If VSS is managing your database, and is set to
prompt when new objects are created, a warning message will disrupt the
documentation process, and require you to manually answer it each time.
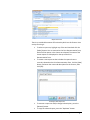
To avoid this, follow the instructions in the form and set your VSS option to
No. Check the “Do not show this page again” box to avoid this form in the
future.
Total Access Analyzer
Chapter 2: Installation and Startup 31
Disabling Visual SourceSafe
There are situations where a database under Visual SourceSafe (VSS) control
may take a long time to document. To improve performance, create a copy
of your database and remove that copy from VSS control. You can do this by
compacting your database to a new name and answering “Yes” when
prompted to remove the new database from VSS. Run Total Access Analyzer
on that copy.
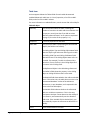
Startup Errors
Most errors that occur with Total Access Analyzer happen when you first
start it. This section explains the most common problems how to fix them.
The Wizard you’ve requested is not installed or is in a bad
state. Please install or reinstall the wizard.
This error is usually caused by a problem in the Microsoft Access registry
setting for the Total Access Analyzer add-in. When you install Total Access
Analyzer, it places entries in the Windows Registry to identify the location
and name of the Total Access Analyzer library database and the name of the
main Total Access Analyzer function.
If these entries are incorrect, or if the Total Access Analyzer program
becomes corrupt, this error message appears. To resolve this issue, make
sure the Windows user logged on has permissions to write to the Windows
Registry, and re-install Total Access Analyzer from its setup program.
Current database is not updateable
This error indicates that you have opened the current database in read-only
mode, or another condition has forced the database to be read-only (such
as a read-only operating system attribute set for the database file or folder).
Total Access Analyzer cannot document a database opened in read-only
mode. To resolve this issue, either open the database in normal (not readonly) mode, or create a copy of the database with update rights for
documentation purposes.
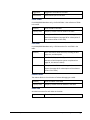
This copy of Total Access Analyzer is currently in use. Please try
again later.
Total Access Analyzer can be installed on a shared or network drive, but can
only be used by one user at a time. If more than one user attempts to start
Total Access Analyzer at the same time, the second user sees a dialog box
saying the copy of Total Access Analyzer is already in use.
32 Chapter 2: Installation and Startup
Total Access Analyzer
This message also appears if you attempt to run Total Access Analyzer in
two instances of Access on the same workstation. Press [OK] to return to
Microsoft Access and try again after closing the other instance of Total
Access Analyzer.
If Microsoft Access exits abnormally while Total Access Analyzer is running,
an LDB lock file may be left in place that erroneously reports that Total
Access Analyzer is in use, even though no one is using the program. If this
happens, you should manually delete the lock file by following these steps:
1. Ensure that no other users are running Total Access Analyzer. This
step is very important—if you manually delete the lock file while a
user is running Total Access Analyzer, you may cause that user’s
copy of Analyzer and/or Access to crash.
2. Exit all instances of Microsoft Access.
3. Locate the folder in which you installed Total Access Analyzer, and
delete the lock file (TAA_C.laccdb).
4. Restart Microsoft Access, and run Total Access Analyzer again.
Total Access Analyzer cannot be called from this database
This error occurs if you try to load Total Access Analyzer while the database
(TAA_C.ACCDE) is open in another instance of Microsoft Access. Close the
Total Access Analyzer database, open another database from Microsoft
Access and restart Total Access Analyzer from the Database Tools | Add-Ins
ribbon.
If you encounter other problems, please be sure to read Chapter 9: Product
Support for more information about troubleshooting and obtaining
technical support.
Total Access Analyzer
Chapter 2: Installation and Startup 33
Chapter 3: Documentation Basics
This chapter explains the importance of documentation and how Total Access Analyzer can
help you build better applications. This chapter provides an overview of using Total Access
Analyzer, and the difference between documentation and analysis. Make sure you read the
Limitations section to understand what Total Access Analyzer cannot do.
Topics in this Chapter
Why Document?
ACCDB/MDB vs. ADP Documentation
Documentation Process
Documentation Limitations
Documentation Limitations for ADPs
Total Access Analyzer
Chapter 3: Documentation Basics 35
Why Document?
Documentation is an essential part of application development and
maintenance. Microsoft Access provides a great deal of control over the
appearance and behavior of objects and controls. As your application grows,
objects, properties, code, and relationships between objects become more
numerous and complex. Without a consistent, automated documentation
and analysis tool, development and maintenance becomes a major chore.
Total Access Analyzer is designed to reduce and eliminate many of the
tedious and difficult parts of documentation. You can use Total Access
Analyzer in a variety of situations:
During Development
As you design new objects and relate them to other objects, documentation
and analysis can be invaluable when selecting fields, creating expressions,
and calling forms, reports, and queries. As you develop your application,
you can run Total Access Analyzer to generate reports of table structures,
form properties, modules, etc. for quick reference. Such information is vital
for maintaining consistency across objects. Total Access Analyzer also
detects errors and suggests specific ways to help you write better and faster
solutions.
Maintaining an Inherited System
One of the most difficult aspects of taking over an existing database is
determining what is in the database. Because Total Access Analyzer
provides comprehensive analysis of your database, you can quickly get up to
speed on an unfamiliar project. The application diagrams are particularly
useful.
Providing System Documentation
As a developer, you are probably responsible for creating detailed system
documentation. Total Access Analyzer eliminates much of the work, making
it easy to supply professional, comprehensive, and accurate documentation
in both printed and electronic format. You can even customize the header
and footer of the reports in Total Access Analyzer to include your project
name, your name, and/or your firm’s name. See page 154 for more
information
Increasing Application Quality
Before you start using or distributing your Access application, you need to
test it. Done manually, this is a time-consuming, incomplete, and errorprone task. Total Access Analyzer automatically finds many types of errors
36 Chapter 3: Documentation Basics
Total Access Analyzer
and performance problems in your application, and provides you with
suggestions for improvement, minimizing what you need to test. Examples
include:
Invalid references to tables, fields, queries, forms, reports, macros,
and procedures
Linked tables with incorrect connections
Queries with errors in their SQL strings
Command buttons on forms without a hyperlink jump or code in
their OnClick events
Form controls with identical hotkeys
Forms controls no in default tab order
Reports tied to explicit printers rather than the default printer
Procedures called with the wrong number of parameters
Unused tables, queries, forms, reports, macros, sub-macros,
procedures, variables, classes, and user defined types
Global procedures that should be private
Debug and Stop statements in your code
Variables and functions that are not typecast
Variable names that conflict with global and module-level variables
Performance problems in your tables, queries, forms, reports,
macros, and modules
Performance problems with your database, your installation of
Windows, and your computer
For more information about the Errors, Suggestions, and Performance items
detected by Total Access Analyzer, see page 83.
ACCDB/MDB vs. ADP Documentation
Beginning with Access 2000, Access offered a new type of database, Access
Projects (ADPs). This type of database uses SQL Server for its data storage
rather than the Jet Engine ACCDB/MDB format. ADPs were discontinued in
Access 2013. The ADP information is provided for Access 2000 to 2010
versions of Total Access Analyzer.
The ACCDB format is the MDB format introduced with Access 2007. When
compared against ADPs, MDBs and ACCDBs should be considered similar
(they are both Access Jet Engine databases), so rather than referring to both
ACCDB and MDB, we’ll simply use MDB or Jet.
Total Access Analyzer
Chapter 3: Documentation Basics 37
Because of the many differences between ADPs and MDBs and ADPs and
the way add-ins work with them, there are significant differences with the
documentation Total Access Analyzer generates and the way it behaves.
Certain object types are similar between MDBs and ADPs. For instance,
forms, reports, macros, modules, and command bars are essentially the
same and the documentation for those objects is identical.
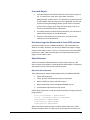
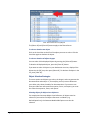
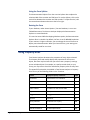
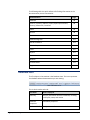
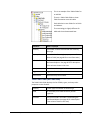
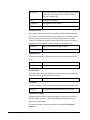
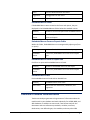
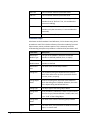
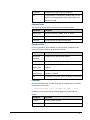
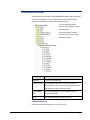
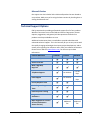
Some objects only exist in one and not the other:
Type
ACCDB/MDB Jet Databases Access Data Projects (ADPs)
Objects
Queries
Views
Database Diagrams
Stored Procedures
SQL Syntax
Access SQL can reference
objects/controls and VBA
Transact SQL (TSQL)
Data
Local or linked tables
Links to SQL Server tables
Table Features
Keys
Triggers
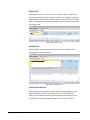
Total Access Analyzer generates the appropriate documentation for all of
these objects.
Both MDBs and ADPs have tables, but they are different. The
documentation of the tables is also different. Fields in MDBs are called
Columns in ADPs. ADP tables also have Keys and Triggers. Again, these are
documented based on the database type.
Due to the differences, the way documentation is displayed and the reports
available differ for ACCDBs/MDBs and ADPs. Details of these differences are
provided in Chapter 5: Viewing Documentation.
See Documentation Limitations for ADPs on page 44 for information about
the limitations of ADP documentation.
Documentation Process
Total Access Analyzer works by examining the objects in your database. As it
documents the database, Total Access Analyzer writes the results to tables
in an output database you specify. Although the documentation process
may create temporary objects in your database, no changes or permanent
additions are made.
To generate documentation, you need to follow a series of steps. Before
starting, decide if you need quick documentation or full documentation.
38 Chapter 3: Documentation Basics
Total Access Analyzer
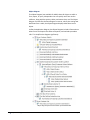
Quick Doc Documentation
Quick Doc documentation is a subset of Full Documentation that quickly
provides basic information about individual objects. It does not perform
analysis across multiple objects (including cross reference information and
diagramming). You can use Quick Doc to document:
Database Information and Object Inventory
Table Structures and Properties
Query Properties
Relationships
Form Properties and Blueprints
Report Properties and Blueprints
Macro Line Listings
Module Code Printouts
Command Bar Properties
ADP Views
ADP Database Diagrams
ADP Stored Procedures
Follow these basic steps to generate Quick Doc documentation:
1. Open the database you want to document
2. Start Total Access Analyzer
3. Choose [Quick Documentation…] from the main menu
4. Select the object(s) to document
5. Generate the documentation
6. Preview, print, or export reports
For more information about Quick Doc, see Chapter 8: Quick
Documentation.
Full Documentation
Full Documentation includes the Quick Doc features, but goes much further
by providing extensive analysis. Because of this, full documentation takes
more time.
Full documentation provides:
Total Access Analyzer
Cross reference information showing where and how objects are
referenced throughout your database
Module analysis including listings and cross referencing of
procedures, variables, constants, labels, etc.
Chapter 3: Documentation Basics 39
Hierarchical diagrams of how your application works
Errors and suggestions to fix and improve your database
Performance tips
Follow these basic steps to generate Full documentation:
1. Open the database you want to document
2. Start Total Access Analyzer
3. Choose [Document] and select the objects to document
4. Select the documentation options
5. Generate the documentation
6. View the documentation
7. Preview, print or export reports
Total Access Analyzer makes these steps easy with the Documentation
Wizard. A principal design goal of the program is to allow you to generate
documentation as quickly and easily as possible. For more information on
Full Documentation, see Chapter 4: Generating Full Documentation.
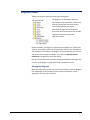
Difference between Documentation and Analysis
Total Access Analyzer generates two distinct types of information:
documentation and analysis. Documentation consists of information about
an individual object’s design. Table structures, form and report properties,
query SQL strings, permission settings, and user and group information are
examples of this type of information. The documentation provided by Total
Access Analyzer is information about how each object is structured. It is
very comprehensive and covers every object you select for documentation.
Analysis shows more complex information such as how objects are related
to each other, module code details, and errors in your application. Much of
the analysis is based on the Documentation results, but Analysis also
includes the module cross reference information. This involves searching
through a lot of data to reveal where objects are used, and to find other
highlights or discrepancies. Examples include the diagrams, cross reference
information, module details, and the list of errors, suggestions, and
performance tips.
Documentation Limitations
Although Total Access Analyzer documents and analyzes most objects and
links in your database, there are some limitations:
40 Chapter 3: Documentation Basics
Total Access Analyzer
Errors with Objects
Your VBA module code should compile for Total Access Analyzer to
run. To compile your code, open any module, and select
Debug|Compile <project name>. This performs a syntax check on all
of your module code. As syntax errors are highlighted, fix them and
continue invoking the Debug|Compile <project name> command
until all errors are gone, then select File|Save <project name> to
save the compiled state of your VBA project.
If an object cannot be opened for documentation, the references it
makes to other objects are not documented.
If a query’s SQL property has a syntax error, the query and its
references are not documented.
Data Access Pages Not Documented in Access 2007 and Later
Data Access Pages can exist in MDB and ADP files, and Access 2007 and
2010 can run them. However, you cannot put Data Access Pages in design
mode in Access 2007 or later. If you try, it instructs you to use Access 2003
instead. As a result, Total Access Analyzer cannot document Data Access
Pages in Access 2007 or later.
Object References
Total Access Analyzer effectively detects explicit object references, but
there are some cases where it cannot determine which object is referenced,
and therefore cannot verify that the reference exists.
References that are Resolved
These references are always documented properly for MDB and ACCDBs:
Tables used by queries
Tables, queries, and fields used by forms, and reports
Macros called from events and other macros
Objects opened by macros including embedded macros
Command bars linked to forms and reports
Explicit object references in code are also documented, including references
using constants:
Const cstrTableName = "MyTableName"
Set rst = db.OpenRecordSet(cstrTableName)
DoCmd.RunMacro "MyMacroName"
DoCmd.RunQuery "MyQueryName"
DoCmd.OpenForm "MyFormName"
When Total Access Analyzer detects a field or object reference, it checks
whether the object exists. If it does not exist, the reference is stored as an
Total Access Analyzer
Chapter 3: Documentation Basics 41
error. This is an extremely powerful feature, since it validates all of your
application’s object references.
References that are Not Resolved
There are situations where Total Access Analyzer is unable to determine the
referenced objects.
In module code, references to objects within an expression, variable, or
function are documented but flagged as unresolved. Because the value of
expressions, variables, and function return values is only known at runtime,
Total Access Analyzer cannot determine the name of the referenced object.
This is particularly important if you have a “table-driven” or “registrydriven” system where object names are stored in tables or the registry and
not your code.
When an object is referenced with a variable, Total Access Analyzer records
the reference in the cross reference documentation, and sets the [Variable]
field to “Yes” and the [Resolved] field to “No.” This allows you to find the
references that you need to manually resolve. The following are some
examples that cannot be resolved:
DoCmd.RunMacro "Sales " & x
DoCmd.OpenTable "Customers For " & "2015"
DoCmd.RunQuery strQueryName
DoCmd.OpenForm MyTestFunction()
The following is another reference (to MyTable) that cannot be detected:
strSQL = "SELECT DISTINCTROW * FROM MyTable"
set rs = db.OpenRecordSet(strSQL)
Due to the inability to document data access pages, table and query
references in data access pages are not documented. Similarly, field
references in VBA code are not resolved.
Library Databases
References to variables, procedures, or objects in Library Databases or
databases linked to your database with the References menu are also not
automatically resolved. Only references to objects in the database being
documented can be resolved.
You can manually maintain a list of calls to library procedures with a new
feature introduced in the Access 2013 version (and updates for other
versions). Simply create a table with the list of procedure names in your
libraries and they are not be flagged as undefined procedures. For more
information, see Support Procedure Calls to Libraries.
42 Chapter 3: Documentation Basics
Total Access Analyzer
Hyperlinks in Tables
Total Access Analyzer does not document or verify hyperlinks stored in
hyperlink fields in Access tables. Hyperlinks on forms or in code using the
FollowHyperlink command are documented.
EVAL Statements
Total Access Analyzer cannot document references to procedures, variables,
or other types of objects if the reference is made within an EVAL() function.
Ribbons
Total Access Analyzer does not document references defined in ribbon XML
text.
Class Module References
Most class module references are properly documented. If you explicitly
invoke a class module’s method or refer to its property, the reference is
documented:
Dim varName As New ClassName
Form_MyForm.MyMethod
Forms("MyForm").MyMethod
These references are not documented:
Dim varName As Object
Forms(MyFormVariable).MyMethod
Additionally, class references from elements of user-defined types are not
documented.
Problems with Unresolved References
Unresolved references cause two major problems:
The referenced object cannot be verified (it may or may not exist).
Objects may be incorrectly flagged as unused. Unused objects are
objects with no references from other objects. If an object is
referenced in a way that Total Access Analyzer cannot detect, it may
be incorrectly flagged as unused. Check the Object XRef reports for
variable references to understand the references in the database
that could not be resolved (see page 167 for more information).
VBA Code in Conditional Compilers
The VBA module parser in Total Access Analyzer does a great job reading
and understanding how your code works. However, with conditional
compilers (#IF..#ELSE..#END IF syntax), the syntax can become difficult to
decipher.
Total Access Analyzer
Chapter 3: Documentation Basics 43
If entire procedures are defined within branches of the conditional
compiler, the VBA parsing is successful:
#If VBA7 Then
Sub ProcName()
...
End Sub
#Else
Sub ProcName()
...
End Sub
#End If
However, the analysis is less successful if a procedure definition is split:
#If VBA7 Then
Sub ProcName()
#Else
Sub ProcName()
#End If
...
End Sub
In the first case, we can treat each procedure separately, even though they
are named identically. In the latter, the duplicate procedure definition line
makes it more challenging.
Total Access Analyzer treats the first portion (from #IF to #ELSE) as one
procedure and the second part to the End Sub as a separate procedure. In
general this does not affect the documentation but depending on the
differences in definitions, it may.
Documenting MDE, ADE, and ACCDE Databases
Databases that are converted to MDE, ADE, or ACCDE files do not allow
viewing of the code-bearing objects: forms, reports, and modules. Because
of this, Total Access Analyzer cannot analyze these objects in these files.
Documentation Limitations for ADPs
In addition to the limitations listed above, there are some additional
limitations associated with the documentation of ADPs:
Transact SQL Syntax
The Transact SQL (TSQL) syntax of ADPs is not examined for references to
other objects. Therefore, references to data objects such as Tables, Views,
and Stored Procedures in Views, Stored Procedures, and TSQL used in Form
and Report RecordSource or RowSources are not available.
44 Chapter 3: Documentation Basics
Total Access Analyzer
Direct references (without TSQL) to objects from form and report
RecordSource and RowSources are documented.
Field Cross Referencing
Because Transact SQL is not analyzed, field cross referencing is not
performed for ADPs.
Object Cross Referencing
Because Transact SQL is not analyzed, table and view cross reference is
incomplete in ADPs. Therefore, the documentation of unused tables and
views is not generated for ADPs. Similarly, the Data Diagram and Object
Diagrams are not available.
For module cross reference, procedures passed through Input Parameters
are not documented.
Security Documentation
Security settings for the underlying SQL Server/MSDE database are not
documented.
MDB Only Objects
Certain objects, such as Queries, Documents, Containers, and Relationships,
are unique to MDBs and ACCDBs. Because of this, these types of objects do
not appear in the documentation for an ADP.
Total Access Analyzer
Chapter 3: Documentation Basics 45
Chapter 4: Generating Full Documentation
Now that you have a basic understanding of what Total Access Analyzer does, you are
probably eager to generate full documentation of your databases. This chapter shows you
how to generate the results you want with Total Access Analyzer. It explains how to select
objects and documentation options, specify an output database, generate results, and
troubleshoot problems that may occur. The Quick Start section is available to get you
running quickly, and a more detailed description follows to explain all of the available
options.
Topics in this Chapter
Main Form
Documentation Wizard Quick Start
Page 1: Selecting Objects to Document
Page 2: Specifying General Options
Page 3: Output Database and Scheduling
Generating Documentation
Troubleshooting Documentation Failures
Total Access Analyzer
Chapter 4: Generating Full Documentation 47
Main Form
After preparing your database for documentation (explained on page 26),
you’re ready to start using Total Access Analyzer. With the database you
want to document open, start Total Access Analyzer from the Database
Tools | Add-ins ribbon. After a moment, the screen appears:
Total Access Analyzer Main Form
The buttons on this form guide you through the process:
Generate New Documentation
This launches the Wizard that generates full documentation of your
database. From this wizard you can select the objects to document, set
documentation options, specify the output database name, and start or
schedule documentation. When documentation finishes, you return to this
Main Menu form.
Currently Document Database
Current Documentation Options
48 Chapter 4: Generating Full Documentation
Total Access Analyzer
The currently documented database is displayed. You can change this by
selecting the […] button. The View, Search, and Reports buttons apply to the
currently selected documentation.
View
After you generate the documentation and analysis, this button lets you
browse the results in the Documentation Explorer. You can also retrieve and
view documentation previously generated for other databases.
Search
After you generate the documentation and analysis, the Search feature lets
you find all places that a string (word or phrase) occurs in the documented
objects properties or lines of code (macro and modules).
Reports
After you generate the documentation and analysis, the [Print] button lets
you access the Total Access Analyzer reports. You can preview any report
and send multiple reports to your printer. You can also filter many of the
reports to include only a subset of the documented objects.
Quick Documentation
The [Quick Documentation..] button launches a Wizard that quickly
generates basic documentation of individual objects in the current
database. This is performed without the full documentation and analysis
features under the [Generate New Documentation…] button. See Chapter 8:
Quick Documentation for more information.
Exit
This button closes Total Access Analyzer and returns you to Microsoft
Access. Your database remains open and your workspace is reset to its
original state. All settings and documentation in Total Access Analyzer are
automatically saved.
Help
The online help system is available by pressing the [Help] button or [F1].
About
This button displays information on your version of Total Access Analyzer. It
also allows you to generate a log file that includes information about your
installation.
Total Access Analyzer
Chapter 4: Generating Full Documentation 49
Documentation Wizard Quick Start
After pressing the [Generate New Documentation…] button, a Wizard
guides you through the process of specifying the desired documentation. A
summary of each screen is listed with suggestions for how to use it quickly.
More detailed information is provided for each option in the following
sections.
Page 1: Select the Objects to Document
Documentation Wizard (Page 1)
All database objects are displayed, and the icon menu on the left lets you
display the items and options by object type. Basic documentation is
generated for every object selected, and the options in the right column let
you specify optional documentation. For more detailed information, see
page 52.
Quick Tips
The more items you select, the more time it takes to document your
database. If time is not an issue or if your database is relatively small, we
suggest that you select these options:
Choose all objects:
o
Select [All] from the icon menu to display all objects.
o
Press the [Select All] button to choose all objects.
Eliminate built-in command bars unless you’ve customized them:
o
50 Chapter 4: Generating Full Documentation
Select [Command Bars] from the icon menu.
Total Access Analyzer
o
Click on the option button “Built-In” and press the [Clear All]
button to deselect the built-in command bars.
Choose all the options except for these:
o
“Control Format Properties” only if you need information on the
format properties of every control on your forms and reports
(height, width, color, font, etc.).
o
“Form Blueprints” and “Report Blueprints” only if you want the
blueprint reports since these take a while to generate
Press [Next] to go to page 2 of the Wizard.
If you don’t want to make changes on the remaining pages of the
Wizard, you can just press [Finish] and start documenting.
Page 2: Specify General Options
Documentation Wizard (Page 2)
Some documentation options apply to the entire database, not just the
individual objects you selected on the previous screen. This page lets you
select those options and specify settings under performance analysis. For
more detailed information, see page 59.
Quick Tips:
Total Access Analyzer
Select all options
Ignore the [Performance Analysis Settings] button
Press [Next] to go to that last page of the Wizard
Chapter 4: Generating Full Documentation 51
Page 3: Start or Schedule Documentation
Documentation Wizard (Page 3)
The final page of the Wizard allows you to specify the output database
name, and whether to start documenting the database immediately or
schedule it for a later time (e.g. at night when the database is not used). By
default, the output database is put in your Application Data folder and given
the same name as your database with a “.TDB” extension.
Quick Tips:
Click the [Finish] button to accept the default values and start
documenting your database.
Generating Documentation
After clicking [Finish], the documentation is generated. This may take a
while, depending on the complexity of your database, the selections you
made, the speed and memory of your machine, and the hard disk speed.
When documentation is complete, a summary screen appears. Press [Next]
to return to the Main Menu form, and use the [View], [Search], and [Report]
buttons to view, search, and print the results.
Page 1: Selecting Objects to Document
We’ll now go through a more detailed description of the features and
options in the Documentation Wizard.
When you select the [Document] option from the Main Menu form, the first
of three pages of the Documentation Wizard appear. Use the [Back] and
[Next] buttons to move through the pages.
52 Chapter 4: Generating Full Documentation
Total Access Analyzer
Documentation Wizard (Page 1)
This form is divided into three sections. The icon menu on the left controls
what is displayed in the list of objects and options sections. By default, [All]
is selected and all objects and options are displayed. You can reduce your
list by clicking on the other object types (tables, queries, forms, etc.).
This screen allows you to specify which objects to document as well as
choose documentation options.
In general, you should select all objects, especially if you are interested in
generating complete cross reference information and detection of
unused objects.
For your convenience, if you have documented this database before, the
objects you previously selected are selected by default. If you added new
objects or renamed existing objects, they are listed but not selected. If you
deleted any objects, they do not appear in the list.
Name Filter
Similar to the Search Bar on the Microsoft Access Navigation Pane, you can
enter text to filter the list of objects:
Total Access Analyzer
Chapter 4: Generating Full Documentation 53
Enter Text to Filter the List of Objects
The [Select All] and [Clear All] buttons apply to the filtered items.
To select or deselect one object
Click on the check box to the left of the object you want to select. Click the
check box again to deselect the object.
To select or deselect all objects by type
You can select all the displayed objects by pressing the [Select All] button.
To deselect all displayed objects, press the [Clear All] button.
If you want to select all objects in your database at one time, display all the
objects via the [All] icon, then press [Select All]. To deselect all objects in the
list, press [Clear All].
Object Selection Strategies
The more options and objects you select, the longer it takes to generate the
documentation and analysis. If, for example, you only want to document
your tables, only select the tables for documentation. If you want to see
how your tables are referenced from queries, forms, and reports, you must
also select those queries, forms, and reports.
Selecting Objects for Object Cross Reference
For complete and accurate Object Cross Reference, all objects must be
selected. If you need to find object references in modules (e.g.
DoCmd.OpenForm), the Generate Module XRef option must also be
selected.
54 Chapter 4: Generating Full Documentation
Total Access Analyzer
Selecting Objects for Field Cross Reference
Field Cross Reference is available for MDB documentation and follows the
same rules as Object Cross Reference. To generate Field Cross Reference,
make sure all tables are selected.
Selecting Objects for Modules Cross Reference
The Generate Module XRef option on the next page automatically
documents every module (regular or class modules)—even if you did not
select them individually here. It also analyzes the modules of every selected
form and report.
To generate complete cross reference, every object using module code
must be selected. This includes all forms and reports, as well as any queries,
macros, and command bars that invoke your functions. If you only want
analysis of your modules, you do not need to select any objects. Just select
Module XRef on the next page.
Selecting Options and Objects for Diagrams
To generate Diagrams, select all queries, forms, reports, macros, and
command bars.
Selecting Fewer Command Bars
When you select [Command Bars] from the icon menu, the list of Command
Bars appears. The number of command bars in the list may surprise you—
the list includes all command bars available to your database, including the
100+ built-in command bars from Access. The built-in command bars are
listed because you can customize them. Since there are so many command
bars, you should decide whether you want to document them all. To help
you, an option group appears under the list:
Differentiating Types of Command Bars
When you select “Built-In”, the list only displays the Access command bars.
When you select “Custom,” the list shows command bars that you created.
You should select every command bar listed under “Custom.” Additionally,
you should choose every built-in command bar that has been modified.
If you are not sure, you should select all the command bars. Command bars
can call procedures and macros, which you need to document if you want
complete procedure cross referencing.
Specifying Options
The right side of the form lists documentation options for the different
object types:
Total Access Analyzer
Chapter 4: Generating Full Documentation 55
Object Documentation Options
By default, all the basic properties of each selected object and the database
are documented. The options presented here allow you to perform
additional documentation of your selected tables, forms, and reports. Even
if you choose none of the options, plenty of documentation is still
generated.
Your initial thought may be to turn on everything to get full and complete
documentation. You may wonder why you would want to turn off any
options. The simple answer is to save time and disk space. Each option takes
time and adds to the amount of output generated. If you have no need for a
certain type of documentation, turn it off to document your database more
quickly and use less disk space. If time and disk space are not issues, select
all of the options.
The available options fall into four categories: Table Options, Form and
Report Control Properties, Blueprint Options, and Printer Properties.
Table Options
Table Field Properties
Total Access Analyzer examines the properties of tables, queries, fields,
relations, and indexes. Unfortunately, if you have linked tables in a
Jet/ACCDB/MDB database, there may be significant performance problems
examining field properties in tables with a large number of fields. You can
see this problem outside of Total Access Analyzer by running the Access
Database Documenter on a linked table with a large number of fields.
To alleviate this problem, you can disable the “Table Field Properties”
option. When you turn this option off, Total Access Analyzer does not
document the properties of fields in tables other than their name, type, and
size. Turning this option off does not affect the analysis or cross reference
documentation—it merely makes the documentation process run faster. Of
course, if you want reports listing all field properties, you must turn this
56 Chapter 4: Generating Full Documentation
Total Access Analyzer
option on. If you are generating documentation and notice that each table is
taking an inordinately long amount of time to complete, consider turning
this option off.
This is not an issue when documenting ADPs.
Table Record Counts
This option is used to get the record count of every selected table. If your
tables contain a large number of records or are linked to large external
tables, this can take a while. Turn this option off if you have large tables and
are not interested in record counts.
Control Properties
Total Access Analyzer can document all of the properties of your form and
report controls. This may, however, generate a huge amount of information
that you may not want and would never use. In particular, you can decide
whether you want to document format and other properties of controls on
forms and reports.
Control Format Properties
Format properties appear in the “Format” tab of a control’s property sheet
and determine appearance. If you are not interested in properties such as
size, font, color, and border information of every control, turn off this
option. Otherwise, this information is documented for every control on
every form and report.
Control Other Properties
This option documents the properties listed in the Microsoft Access
property sheet’s “Other” tab. Examples of these properties are Status Bar
Text, HelpContextID, Tag, Tab Stop, etc. Properties that can reference other
objects (e.g. Shortcut Menu Bar) are always documented.
Blueprints Options
One of Total Access Analyzer’s most powerful documentation features is
blueprints, which are visual representations of your forms and reports. They
are helpful in documenting objects in a “what-you-see-is-what-you-get”
format. Annotations (numbers) can be placed on each control, making it
easy to identify each control and cross reference the visual representation
of the form with other documentation.
Blueprints take additional time to generate, and they require a considerable
amount of space in the output database. If you do not need blueprints, do
not enable them and you can decrease both the documentation time and
the size of the output database.
Total Access Analyzer
Chapter 4: Generating Full Documentation 57
There are several options for generating blueprints:
Generate Form Blueprints
This option generates a Blueprint for every selected form.
Generate Report Blueprints
This option generates a Blueprint for every selected report.
Annotate Blueprints
This option places an annotation number on each control on the Form or
Report Blueprint. Controls are numbered starting with 1. Annotations make
it easy to reference each control in the printed documentation. Additionally,
annotations allow you to recognize controls that invoke VBA code or
macros. Controls with italicized annotations have code.
If you want the Blueprints to be a closer approximation of what the user
actually sees when they open the form or report, do not select this option.
Unhide Controls on Blueprints
This option makes invisible controls appear on the generated Blueprints. If
you use invisible controls, this option can help locate and identify these
controls. If you want the Blueprints to be a closer approximation of what
the user actually sees when they open the form or report, turn this option
off. With this option off, only the controls that are visible when the form or
report is opened are printed on the Blueprint.
Printer Properties
Total Access Analyzer allows you to specify whether to document printer
properties for forms and reports, such as Device Name, Default Size,
Orientation, Paper Size, Margins, etc. Documenting these items takes some
additional time, and can be turned off if not necessary.
Form Printer Properties
Select this option to document printer properties for each form selected for
documentation. Forms are normally not printed, so you may never care
what these settings are.
Report Printer Properties
Select this option to document printer properties for each report selected
for documentation.
After selecting objects and documentation options, press the [Next>] button
to go to the next page.
58 Chapter 4: Generating Full Documentation
Total Access Analyzer
Page 2: Specifying General Options
The second page of the Documentation Wizard allows you to specify general
documentation options not related to specific objects.
Documentation Wizard (Page 2)
One of the most powerful features of Total Access Analyzer is its ability to
analyze the information generated from the basic documentation of
individual objects. This includes how your objects are related to each other,
where each object is used, and any errors that exist in your database due to
incorrect or incomplete references. By default, cross reference analysis of
tables, queries, forms, reports, and macros is always performed.
If you are only interested in the basic documentation of your database, turn
all the Analysis options off. This results in faster documentation, but
prevents Total Access Analyzer from generating some of its most valuable
information, including the detection of some errors that may exist in your
database.
In general, the two XRef options should be turned on. The Diagrams option
should be turned on if you want the application, data, and object diagrams.
Generally, turn the Total Access Analyzer options off only if you are not
concerned with how your database objects relate to each other.
Generate Field XRef
The Generate Field XRef option is available for ACCDBs/MDBs and generates
field cross reference analysis, showing where fields are used and whether
they exist. By showing every reference to a field in tables, queries, forms,
Total Access Analyzer
Chapter 4: Generating Full Documentation 59
reports, controls, and macros, Total Access Analyzer shows you where to
make changes if a field’s structure changes or if a field is deleted or
renamed. If this option is turned off, error detection of references to
undefined fields is not possible.
Generate Module XRef
The Module Cross Reference feature is one of the most powerful and useful
features of Total Access Analyzer and works on ACCDBs, MDBs, and ADPs. A
VBA code parser analyzes your module code and generates a great deal of
information. This information includes procedure definitions, procedure
calls, constants, variables, labels, procedure declarations, function calls, and
much more. Total Access Analyzer detects a variety of errors, along with
suggestions and performance tips. It analyzes all modules, regardless of
whether you selected them, as well as the modules behind the selected
forms and reports.
Keep in mind that other objects such as queries, macros, and command bars
also reference module code and should be selected for complete module
cross reference.
The Generate Module XRef option is independent of basic module
documentation, which just prints your module code. Make sure your VBA
code compiles and refer to page 115 for information about the analysis
performed. If this option is turned off, module errors are not detected.
Generate Diagrams
This option generates the Application Diagram. For ACCDBs/MDBs, Data and
Object Diagrams are also generated. These diagrams are extremely
powerful tools for understanding how your objects work together. While
cross reference information shows only one level (where each object is
used), the diagrams show the entire multi-level hierarchy. For more
information on diagrams, see page 129.
Application Diagram
The Application diagram displays your application and procedure flow in a
hierarchical format from its top-level object (Autoexec macro or startup
form) through every referenced form, report, event, and procedure call.
This multi-level tree provides an excellent illustration of the way your
program works. If you are interested in the Application Diagram, also select
the Generate Module XRef option. Otherwise, procedure calls are not
included in the diagram.
60 Chapter 4: Generating Full Documentation
Total Access Analyzer
Data Diagram
The Data Diagram shows how data flows from tables through other objects
such as queries, forms, reports, and code. It shows the entire family of
objects using each table.
Object Diagram
The Object Data diagram shows all the objects (tables, queries, and macros)
referenced by every form, report, and query. It shows the entire family of
objects used by each object.
General Documentation
The options on the second and third rows of the page generate additional
documentation. Note that these four options are not available for ADPs
since they deal with objects that don’t exist in ADPs:
Document Relationships
This option documents the table and query relationships as defined in the
Database Tools | Relationships window. Each relationship is documented
along with the relationship window showing all the related data sources.
Document Security
This option documents the security (permission) settings for each selected
object by each group and user defined in the current workgroup.
Document Containers and Documents
JET databases store information about objects in Containers and
Documents. Containers are object types (tables, queries, forms, reports,
relationships, etc.). Documents are individual objects within each container
(a table, query, form, etc.). Properties include values such as date created,
date modified, etc. Most of this information is already in the inventory
documentation Total Access Analyzer generates.
Turn this option on to document container and document properties. This
option adds time especially if you have a large number of tables and
queries. This documentation does not affect any other documentation or
analysis, but you may want to run it for thoroughness.
Compact After Documentation
This option compacts the output database after documentation. This can
save considerable disk space, but takes extra time.
Total Access Analyzer
Chapter 4: Generating Full Documentation 61
Performance Analysis Settings
Total Access Analyzer automatically generates extensive performance
analysis of your system, database, and each object selected for
documentation. The performance analysis offers suggestions and warnings
on items that should be examined to improve performance. They do not
imply that the flagged items need to be modified, only that they should be
examined for potential improvement.
Several options are available to configure these tests from the [Performance
Analysis Settings] button. Total Access Analyzer performs many more tests
than are shown here—this form shows only the tests with configurable
values. For more information, see page 81.
Performance Analysis Settings Form
Maximum Number of Fields per Table
Enter a number up to 255. This value is the maximum number of fields that
can exist in a table before the table is flagged as a potential performance
problem. For example, if you consider 32 fields to be the maximum number
of fields that should be in a table before performance suffers, enter that
number here. The default value is 32.
Maximum Number of Fields per Query
Enter a number up to 255. This value is the maximum number of fields that
a query can return before the query is flagged as a performance problem.
The default value is 16.
62 Chapter 4: Generating Full Documentation
Total Access Analyzer
Minimum Acceptable RAM
Enter the amount of RAM (in megabytes) that should be on the computer. If
available physical RAM is below this level, a performance problem is
recorded. The default value is 128 megabytes.
Minimum Local Disk Free Space
Enter the amount of disk space in megabytes that should be available on
local, non-networked drives. If the amount of space falls below this level, a
performance problem is recorded. The default value is 100 megabytes.
Maximum Controls per Form
Enter the maximum number of controls that can exist on a form before a
performance problem is recorded. The default value is 50.
Maximum Controls per Report
Enter the maximum number of controls that can exist on a report before a
performance problem is recorded. The default value is 50.
Maximum Form/Report Complexity
Different control types have different performance “weights” associated
with them. For a list of the control types with their associated weights, see
the System Report “Total Access Analyzer Performance Tips,” and look at
the description for the Form Control Cost tip.
Enter the maximum control complexity that can exist on a form or report
before the object is flagged as a performance problem. The default value is
300.
Press [OK] to return to page 2 of the Documentation Wizard, or [Next>] to
go to the last page of the Documentation Wizard.
Page 3: Output Database and Scheduling
The third and final page of the Documentation Wizard provides information
about the documentation and analysis that is about to be generated. It also
allows you to specify the output database name, change the default output
directory, and to start or schedule the documentation:
Total Access Analyzer
Chapter 4: Generating Full Documentation 63
Documentation Wizard (Page 3)
Number of Objects to Document
The label at the top of the form displays the number of objects you selected
to document.
Free Disk Space
This feature tells you how much disk space is available. Depending on the
complexity of your objects and the number of objects selected, the
documentation can be many times the size of your empty database (the
amount of data does not affect the documentation size). Without
documenting your database, it is impossible to determine the size of the
documentation.
If the documentation process is started and Total Access Analyzer runs out
of disk space, the program is halted. Your database is not modified in this
situation, but you do need to provide more disk space and restart the
documentation process.
A good safety margin is to have at least 100 MB free on the disk where you
are placing the output database. Your system should also have enough free
space for the Windows swap file (also known as the virtual memory file).
Consult your Windows documentation for information on this file and its
settings.
Output Database
Total Access Analyzer stores the documentation in a Microsoft Access
database. This database is like any other Access database except it contains
Total Access Analyzer documentation and has a file extension of TDB
64 Chapter 4: Generating Full Documentation
Total Access Analyzer
instead of the standard MDB. Total Access Analyzer uses the .TDB extension
as an easy way to identify an output database.
Total Access Analyzer automatically supplies a default output database
name based on the name of the current database. For example, if you are
documenting your SALES.MDB database, the output database is named
SALES.TDB.
You can specify the output database name and location by pressing the […]
button next to the output database name. This button brings up the “Select
an Output Database” dialog box:
Select an Output Database Dialog
Specify the name and location for your output database, and then press the
[Save] button. You can use any legal file name, but the .TDB extension
cannot be changed.
Because of the way Access locks database files, you cannot have the
output file with the same name and in the same folder as the database
you are documenting.
Changing the Default Output Directory
The default directory for output databases is the “Output” subdirectory of
the directory where Total Access Analyzer is installed. However, you can
change the default directory by specifying an output database name in
another directory and pressing [Make this the Default Output Directory].
For performance reasons, the output directory should be on your local hard
disk and not on a network drive.
Previous Documentation
If the output database already exists, Total Access Analyzer provides
information about the existing output database with the name of the
database documented, the user who generated the documentation, and the
date the documentation was generated. You can either overwrite the
existing .TDB or choose another output file name.
Total Access Analyzer
Chapter 4: Generating Full Documentation 65
Output databases can be quite large. If you already have an output
database for the current database, you should decide whether you want
to overwrite it with the new documentation or select another output
database name. Normally, one set of documentation for each database is
sufficient; however, you may want to keep extra copies for archival
purposes. The number of different copies that you can save is limited by
the amount of available disk space.
Scheduling Documentation
You can choose to run Total Access Analyzer immediately or schedule it to
run at a later time. This option is useful if you want documentation
generated when users are not active in the database. In a multi-user
environment, it may be difficult to document your database during normal
hours since users may have objects exclusively locked. By scheduling
documentation after hours, you can minimize or eliminate conflicts with
other users. Alternatively, you can copy your database to a local drive and
document it there.
To schedule Total Access Analyzer to run later, click the [>>] button:
This reveals scheduling information on the bottom portion of the page:
Schedule Documentation
Use the buttons next to Day, Hour, and Minute to set the date and time that
Total Access Analyzer should run, and leave the current window open. Total
Access Analyzer will run at the designated time. Do not schedule
documentation and close Total Access Analyzer or Microsoft Access.
Of course, if the scheduled time arrives and users are still using the
database, Total Access Analyzer may still not be able to generate complete
documentation.
If you schedule the documentation to run at a later time and then decide
you would like to cancel the scheduling, click on the [X] button. This brings
you back to the form without the schedule documentation information
visible. From here you are given the option to click on the [Cancel], [Back],
or [Finish] button. Click on the [Finish] button to begin documentation
immediately.
66 Chapter 4: Generating Full Documentation
Total Access Analyzer
Generating Documentation
While the documentation is being generated, the Generating
Documentation form appears showing its progress.
Generating Documentation Form
During form and report documentation, there may be some flickering on
the screen and the form or report properties and other windows may
appear. This is the normal operation of Total Access Analyzer based on its
use of VBA and does not indicate problems.
Canceling Documentation
You can cancel documentation at any time by pressing the [Cancel] button.
When Total Access Analyzer reaches a stopping point, it displays this dialog:
Documentation Generation Form - Cancel Documentation
Press [Yes] to cancel documentation or [No] to resume without canceling.
Total Access Analyzer
Chapter 4: Generating Full Documentation 67
Screen Savers
If you are using a screen saver with Windows, it may move slowly or appear
frozen while Total Access Analyzer is running. Moving the mouse may not
immediately restore the status screen. Do not be alarmed; this does not
indicate a problem. Total Access Analyzer is running while the screen saver
is active. If you move the mouse while the screen saver is up, the program
waits until the current object is documented, and then restores the status
screen.
Documentation Summary
When documentation is completed, the Documentation Summary form
appears displaying summary information about the documentation
generated:
Documentation Summary Form
There may be situations where problems arise and you do not get to this
screen. If this happens, refer to the Troubleshooting section on page 70.
Problems Detected
Total Access Analyzer can detect a variety of problems in your database.
This form shows the types of errors, suggestions and performance problems
68 Chapter 4: Generating Full Documentation
Total Access Analyzer
that were found. To see a list of the actual items, use the Errors,
Suggestions, and Performance tabs on the Documentation Explorer form.
Adding Comments
Comments can be added about the documentation you just generated by
pressing the [Add Comments] button to bring up the Documentation
Comments form:
Documentation Comments Form
Enter any comments or descriptive information you want to save with the
documentation. Your comments can be viewed later when you select this
output database again from the main form. See Chapter 5: Viewing
Documentation for more information.
When you are finished, press [Next>] on the Documentation Summary form
to return to the Main Form.
Where to Go Next
Your database is now documented. From the main Total Access Analyzer
form, press [View] to view the results. Select [Reports] to print, preview,
and export reports, and [Search] to find specific values. If this is your first
time, we strongly urge you to view the data and preview the reports before
printing them. You will be surprised how large some of the reports can be.
Total Access Analyzer
Chapter 4: Generating Full Documentation 69
The following chapters show how to view the documentation and use the
reports.
If you press [Exit], you return to Microsoft Access. Your settings, object
selections, and documentation are automatically saved for the next time
you start Total Access Analyzer.
Troubleshooting Documentation Failures
Unexpected situations may cause Total Access Analyzer to stop before
completing the documentation process. Unfortunately, if you encounter
these problems, the documentation generated up to that point is not
usable. When an unexpected error occurs, this form appears:
Total Access Analyzer Error Form
If the problem and solution is not obvious or listed, or you feel the problem
is with Total Access Analyzer, please email us a copy of the error file. The
error file can be viewed by pressing the [View Error File] button. From there
you can choose to print the error message. The error file is saved as
TAERR.TXT in Total Access Analyzer’s application data folder.
At FMS, we are committed to supporting our products. Depending on the
error, we may need a copy of your database to replicate the problem. We
have attempted to anticipate all potential problems, but the variety of
applications and limitations of Microsoft Access prevent us from handling
every possible situation. Nevertheless, we are committed to resolving any
70 Chapter 4: Generating Full Documentation
Total Access Analyzer
problems you encounter. If the problem can be solved, we will provide
instructions to work around it, or we will send you an updated version of
Total Access Analyzer for free when we fix it. We apologize and thank you
for your patience if you encounter errors.
Problems while Generating Documentation
Total Access Analyzer is written in VBA and uses Microsoft Access as its host
environment. If you encounter a Microsoft Access error while running Total
Access Analyzer, the most common cause is corrupted objects or code in
your database. There are two ways to fix this:
Decompile
Sometimes corruption occurs in the compiled state of the VBA code of a
database. There is a simple way to fix this by launching Access with the
/decompile command line:
<Access installation path>\MSACCESS.EXE /decompile
Once in Access, open the database. It may take a moment to
decompile.
Recompile it by putting a module in design mode.
From the Debug menu, select Compile <project name>.
From the File menu, select Save <project name>.
Steps to Fix Corrupted Databases
If decompile fails, a more complicated process is necessary to recover your
database:
Make a backup copy of your database.
Repair your database. For Access 2010, Compact and Repair
Database is available from the Office button, under Info. For Access
2007, it’s under Manage. For 2003 and earlier, it’s under Tools,
Database Utilities. Visit our web site
http://www.fmsinc.com/microsoftaccess/compact/ for more
information.
Create a clean copy of your database:
1. Create a new database with a temporary database name such as
TEMP.MDB.
2. Choose the External Data ribbon, Import Access, then select the
original database.
3. Import all of the objects from the original database, including
relationships, menus and toolbars, and Import/Export specs (click
Total Access Analyzer
Chapter 4: Generating Full Documentation 71
the Options button in the Microsoft Access Import Objects dialog
box).
4. Close the new database, archive the original database, and then
rename the new database to the original database’s name.
Re-install Total Access Analyzer
There is a chance that one or more objects in the Total Access Analyzer
database may be corrupt. To eliminate this possibility, uninstall Total Access
Analyzer (see page 25 for details). Then re-install Total Access Analyzer from
its original setup.exe program. This does not overwrite or erase existing
documentation, but you do need to add the *.TDB files to your
documentation list if you want to use them. See page 135 for more
information.
These steps should fix any corruption that may exist in your database or
Total Access Analyzer. Run Total Access Analyzer again to ensure that you
can document your database without problems.
Out of Memory or Unable to Open More Databases Errors
If you encounter an out of memory error and have sufficient RAM, this
usually indicates that Windows does not have enough free disk space on the
drive it uses for its swap file. To alleviate this problem, you need to free up
more space on the drive (we recommend 2 GB or more) for Microsoft
Access to operate properly.
However, Out of Memory or Unable to Open More Databases errors are
usually related to corrupt objects. When Total Access Analyzer attempts to
document the damaged object, Microsoft Access consumes memory that
prevents Total Access Analyzer to complete its analysis.
Sometimes the crash occurs while the corrupt object is being documented.
This makes it easy to examine the object to see if it can be fixed. If it’s no
longer being used, you can delete it from your database or simply don’t
select it when running the documentation.
In other cases, the error occurs well after the corrupt object is documented,
which makes it very difficult to determine which object is causing the
problem. Even worse is if multiple objects are corrupt. Because these types
of errors are due to problems with Microsoft Access, Total Access Analyzer
cannot trap the errors consistently. To get around this, we suggest selecting
a subset of your objects to see if they can be successfully documented.
Hopefully, you can isolate the objects that cause the corruption so you can
fix or remove them.
72 Chapter 4: Generating Full Documentation
Total Access Analyzer
Explorer Can’t Load TreeView
When viewing the documentation results, Total Access Analyzer uses a
treeview to showcase the hierarchy of the objects. In prior versions of Total
Access Analyzer this relied on the standard Microsoft Common Control
which comes with Windows. In August 2012, Microsoft released an update
to this control which did not install properly. This problem extended well
beyond Access and affected any program that use the treeview control.
Unfortunately, the fix requires manually reinstalling the control. We provide
an explanation and step-by-step instructions for resolving this at: Fixing the
Microsoft Windows Common Control Library (MSCOMCTL.OCX) Security
Update
(http://www.fmsinc.com/MicrosoftAccess/controls/mscomctl/index.htm)
Note that due to Microsoft not releasing a 64-bit version of the treeview
control, the 64-bit version of Total Access Analyzer uses a series of combo
boxes rather than treeview to show the results.
Other Known Problems
For a list of known problems not documented in the manual or help file,
read Total Access Analyzer’s README file or visit our web site for the latest
information.
Total Access Analyzer
Chapter 4: Generating Full Documentation 73
Chapter 5: Viewing Documentation
Total Access Analyzer includes a powerful explorer that organizes and displays the
documentation you generated. This chapter explains the many ways you can view and filter
data for multiple objects, individual objects, and parts of an object (fields, indexes, sections,
controls, etc.). It also explains how to use the cross reference information, diagrams, and
lists of errors, suggestions, and performance tips.
Topics in this Chapter
View or Print?
Quick Start
Using the Documentation Explorer
Using Property Slices
Errors, Suggestions, and Performance Tips
Documentation by Object Type
Selecting Another Output Database to View
Total Access Analyzer
Chapter 5: Viewing Documentation 75
View or Print?
Even though you may be eager to print all of your documentation, we
strongly recommend that you first view it in order to:
1. Verify that all the objects you selected were successfully
documented
2. Quickly spot errors in your application without printing a single page
(if serious errors are listed, the documentation may be flawed or
you may want to fix the problems and re-document your application
before printing the reports).
There are advantages and disadvantages to viewing vs. printing the
documentation.
First, there are some items that are only available in reports:
Form and report blueprints
Bracketed module code printouts
Dictionary reports that show multiple types of data for an object
(for example, the Table Dictionary report shows a table, its
properties, and its list of indexes and fields with each of their
properties)
Second, most of the data displayed with the Documentation Explorer is in
tabular format. On the other hand, reports are richly formatted, with data
organized and sorted in a variety of ways and with more types of data
displayed on one page than the Explorer.
The reports, however, can be quite large. It is much easier to locate an
object or other information by using the Documentation Explorer, especially
with the objects organized in a treeview hierarchy. There are also
interactive options, such as object selections, property slices, sorting, and
the ability to mark Errors, Suggestions, and Performance issues as
“reviewed.”
Another powerful feature available in the Documentation Explorer is the
ability to open the current object in design view and modify it while
exploring its documentation, analysis, and issues. This feature is described
in more detail below.
76 Chapter 5: Viewing Documentation
Total Access Analyzer
Quick Start
This section offers tips on learning how to view the documentation
generated by Total Access Analyzer. Once you understand this section and
view some of the results, read the rest of the chapter to get the most out of
Total Access Analyzer. There are many ways to examine and use the
documentation. Your ability to review and interpret the data presented can
significantly reduce the effort needed to maintain and test your databases.
Click the [View] button on the Main Menu to display the Documentation
Explorer form.
Documentation Explorer Form
How the Documentation Explorer Works
The documentation is organized in an easy-to-use, hierarchical treeview.
This form is similar to the Windows Explorer. Folders contain individual
items and may also include additional folders. You can easily “drill-down” to
select more detailed items. When you select an item in the treeview, its
corresponding information is displayed in the tabbed panes on the right.
Some tabs are only available for certain items. If data exceeds a column’s
width, you can widen the column or use [Shift F2] to Zoom, just like in an
Access datasheet.
Total Access Analyzer
Chapter 5: Viewing Documentation 77
Here are some highlights and tips for using the explorer:
Click on an object type folder (e.g. tables, queries, etc.) in the
Treeview. You can examine the information shown in each of the
tab views on the right side of the Documentation Explorer to see
data for all documented objects of that type.
Expand the object type folder, and click on any object under that
folder. Notice that the tabs now display data for that object only.
Expand the object (the “parent” object) to show any types of
objects (“child” objects) it may contain (e.g., a table has fields and
indexes, a form has controls, sections, etc.).
Expand any of these folders to see a list of child objects. As you
choose any of these, related information is presented on the right.
Selection in the 64-bit Version
For the 64-bit version of Microsoft Access, the treeview control is not used.
The data is selected from a set of cascading combo boxes.
View Results and Your Objects at the Same Time
While browsing the documentation, you can also switch to the Access
navigation pane and open any of your objects in design view.
Put the Current Object in Design Mode
A very powerful and time saving feature is the ability to put the current
object in the Database Explorer into design mode. While viewing an object,
or the list of errors, suggestions, and performance tips, Total Access
Analyzer can put that object in design mode with a keystroke.
Simply press [Ctrl D] or the Design View button on the toolbar
the object opens in Design Mode.
, and
Fix the Errors Detected In Your Database
Click on the database icon (the first item in the Treeview), then click on the
Errors tab. Ideally, there is nothing in the list. Every item listed is a
potentially serious problem in your database or a problem Total Access
Analyzer encountered while generating its analysis (which may indicate
incomplete documentation). Many errors, such as invalid object references,
can cause your database application to crash.
If the list is long, you can use the [Filter Items] button to limit the types of
errors displayed. You can also click on folders or objects in the Treeview to
show only the errors that apply to those object types or individual objects.
For instance, click on the Modules folder to see only module errors. For
more information, see page 83.
78 Chapter 5: Viewing Documentation
Total Access Analyzer
After fixing the errors, you may need to regenerate the documentation. This
is especially important if you fixed objects that could not be documented
originally, since they are likely to affect the cross reference and unused
object analysis.
You can easily jump to the offending object by selecting an error from the
list, and pressing [Ctrl D] or the Design View button on the toolbar. This
feature allows you to easily fix errors as you view them in the
Documentation Explorer. As you fix items, you can also mark them as
“Reviewed,” and filter them out of the list.
Review Suggestions and Performance Tips
Under the Suggestions and Performance tabs, there are many tips for ways
to improve your database. These are less serious than errors, but you
should examine the tips and determine whether you want to implement
them. If you make modifications to your database, you should run the
documentation again.
Like with Errors, you can easily jump to the offending object by using the
Design View button, and mark items as “Reviewed” to filter them from
the list.
Diagrams of How Your Database Works
Expand the Diagram folder in the treeview to view the Application, Data,
and Object diagrams. Click on the Summary tab to view any of them. For
more information, see page 129.
Object Cross Reference
See where objects are used across your entire database. Select the XRef tab
and the desired folder or item.
For instance, to see where each table is used, click on the Tables folder.
Each referenced table is shown with information for its calling object. You
can also view Field references by looking at a table’s Fields folder.
Module Cross Reference
Select the Modules folder and XRef tab. The Module XRef Filter lets you
choose the output to view. You can see lists of procedure definitions, where
procedures are used, constants, variables, etc. By clicking on items within
the Modules folder you can reduce the items in the list. Modules are
grouped into three major categories: general, form, and report.
Total Access Analyzer
Chapter 5: Viewing Documentation 79
Property Slices
Property slices let you view the value of one property across multiple
objects. Select an object folder (tables, queries, etc.) and the Property Slices
tab. Specify a property in the dropdown list and see the values for that
property across all the documented objects in the selected folder. This lets
you easily verify consistent property settings across objects. You can switch
between the properties for all parent objects (e.g., tables) and all child
objects (e.g., fields).
Using the Documentation Explorer
The Documentation Explorer has the following components:
Treeview on the left
Tab Pane on the right
Toolbar across the top
Form Splitter
Treeview
The treeview on the left side of the form displays all the objects you
selected for documentation. You can expand and collapse the nodes in the
Treeview by double-clicking them, or by clicking the [+]/[ - ] box to the right
of the name. The treeview has folders for major groups such as object types.
Each folder can contain many individual items.
Tab Pane
The large area to the right of the treeview is the Tab Pane, which has six
tabs to display the documentation. The tabs show information based on the
currently highlighted item in the Treeview. Some tabs are not available for
every item.
Summary Tab
This tab shows summary information for the object selected in the
Treeview. The type of summary information shown depends on the type of
object selected.
Details Tab
This tab shows detailed information for the object selected in the Treeview.
The information shown depends on the type of object, but typically contains
property information.
80 Chapter 5: Viewing Documentation
Total Access Analyzer
XRef Tab
This tab shows cross reference information for a single object, or for all
objects of the object type selected in the Treeview.
Errors, Suggestions, and Performance Tabs
These provide high-level analysis of your database including information on
errors, suggestions for improvement, and performance problems. For more
information, see page 83.
The Toolbar
The toolbar at the top of the form has these buttons:
Design View
The Design View button allows you to open an object for modification, or
jump to the object indicated in an Error, Suggestion, or Performance issue.
This works for tables, queries, forms, reports, modules, and command bars.
For security reasons, Access does not allow macros to be opened in design
mode.
For this feature to work, you must open Total Access Analyzer from the
documented database. If the object does not exist in the current database,
an error message is displayed.
Search
Press this button to open the search form. See Chapter 6: Searching Results
for more information.
Reports
Press this button to open the Print Documentation form to preview, print
and export reports. See page 145 for more information.
Help
Press this button for on-line help on the Documentation Explorer form.
Close
Press this button to close the Documentation Explorer form and return the
Main Menu.
Total Access Analyzer
Chapter 5: Viewing Documentation 81
Using the Form Splitter
The Documentation Explorer form has a vertical splitter bar to adjust the
relative width of the treeview and Tab Pane. To use the Splitter, click on the
vertical line between the treeview and Tab controls. To adjust the size, hold
the mouse button down and move to the left or right.
Resizing the Form
If your database, under Access Options | Current Database, is set to use
Tabbed Documents, Total Access Analyzer displays the Documentation
Explorer as a maximized tab.
If it uses the Access 2003 Overlapping Windows option, the Documentation
Explorer form is resizable. By default, the form is set for 800x600 resolution.
If your monitor is higher resolution, you can enlarge the size of the form to
display more documentation. When you close this form, your settings are
automatically saved for next time.
Using Property Slices
Total Access Analyzer documents the properties of every object selected.
The Property Slices tab usually displays the properties for the current
object, but there may be times that you want to see a property’s settings
across multiple objects. For example, as a quality control check on your
forms, you may want to check the AutoCenter property value of every form.
This powerful functionality is available in Total Access Analyzer as Property
Slices for any of the following folders in the Treeview:
82 Chapter 5: Viewing Documentation
Folder
Displays Property Values for
Page
Containers
All documents in a container
90
Tables
All tables or fields
94
Table Fields
All fields in the current table
97
Table Indexes
All indexes for the current table
97
Keys
All keys
98
Triggers
All triggers
98
Queries
All queries
99
Query Columns
All columns for a query
100
Views
All views
101
Stored Procedures
All stored procedures
103
Total Access Analyzer
Folder
Displays Property Values for
Page
Forms
All forms or form controls
105
Form Controls
All controls in the current form
106
Form Sections
All sections in the current form
106
Reports
All reports or all report controls
107
Report Sections
All sections in the current report
108
Report Controls
All controls in the current report
109
Report Group Levels
All group levels in the current report
109
After selecting one of the folders listed above, click on the Details tab and
the Details form appears:
Property Slices for Tables
Use the Property Filter combo box to select the property you want to
examine. The first time you use it, the form takes a moment to load the
property values. All items in the current folder with that property are
displayed. Objects without the property value (null values) are not listed. In
the example above, the Option Group to the right of the Property Filter lets
you switch between views of parent and child object properties.
The list of properties available is controlled by options you selected for
documentation. For more information, see page 55.
Errors, Suggestions, and Performance Tips
One of the most powerful features of Total Access Analyzer is its ability to
offer solutions for common database problems and suggestions to make
your application more robust. This includes detection of errors that can
crash your database, suggestions to improve your object design and
Total Access Analyzer
Chapter 5: Viewing Documentation 83
application code, and tips to enhance application performance. This
information can be viewed from the Errors, Suggestions, and Performance
tabs on the Documentation Explorer.
Tab Pane with Errors Selected
For a complete list of all the Errors, Suggestions, and Performance tips
detected by Total Access Analyzer, print the reports from the System
category. See page 169 for more information.
Errors
This tab lists the errors that Total Access Analyzer detected in your
database. Errors are triggered for objects that Total Access Analyzer could
not document or for serious problems that may cause your database
application to crash (e.g. invalid linked tables, references to missing objects,
etc.). You should fix or at least understand every item in this list. After doing
so, you may want to regenerate the documentation to make sure your
entire object and cross reference information is valid.
Suggestions
This tab lists suggestions for improving your database. These suggestions
focus on enhancing the reliability and maintainability of your application.
Examples include lists of unused objects and code, form buttons that do
nothing, procedures without error handling, etc.
84 Chapter 5: Viewing Documentation
Total Access Analyzer
Performance
This tab lists performance tips to help you optimize your database for speed
and efficiency. Not every performance tip can be implemented, but the list
tries to highlight areas where you should focus. For example, it lists queries
that return a lot of fields or use the “SELECT * ” syntax. You may or may not
be able to reduce the number of fields returned, but if you do, you can
improve performance.
Use Design View button on the toolbar:
to open the object that
triggered the Error, Suggestion, or Performance issue for editing. This
feature allows you to easily fix issues as you view the list.
Reviewing Issues
Total Access Analyzer allows you to flag issues you’ve reviewed by checking
the [Reviewed] column for the items you’ve fixed or deemed unnecessary to
fix.
From the Documentation Explorer, you can filter the Errors, Suggestions,
and Performance lists by reviewed status. The associated reports also show
the reviewed status for each item, and can be filtered to show reviewed
items, non-reviewed items, or all items.
Keeping Reviewed Status Between Documentation
The Reviewed status is saved between documentation runs, and can be
seen the next time you document the database. This allows you to ignore
items that you previously reviewed (note that issues that you fixed will no
longer be in the list).
Reviewed status is stored in the output database. For this feature to work,
make sure that the output database name remains the same every time you
document the database.
Keep in mind that the output database name should be unique for each
database you document. If you have multiple databases with the same
name (e.g. C:\MySales\Sales.mdb and C:\CompanySales\Sales.mdb), the
default output database name will be the same (OutputDirectory\Sales.tdb).
To take advantage of this feature, be sure to specify unique output database
names for each database you document.
Filtering by Reviewed Status
As you review Errors, Suggestions, and Performance issues, check the
“Reviewed” box next to the issue. This feature helps you keep track of items
you have addressed, or items that you determine require no action. The
Reviewed status of each item is retained if you document the database
Total Access Analyzer
Chapter 5: Viewing Documentation 85
again to make it easy to see new issues. Issues can also be filtered by
Reviewed status on screen and in reports.
To filter by Reviewed status in the Documentation Explorer, select “All” or
“Not Reviewed” from the option group at the bottom of the screen:
Reviewed Status Filter
Filtering reports by Reviewed status is explained on page 154.
Filtering by Object or Object Type
The number of Errors, Suggestions, and Performance tips can be quite large.
To reduce the number of records displayed, click on a different folder or
item in the Treeview. This adjusts the list to just the currently selected item
in the Treeview.
For example, to view all Errors, Suggestions, and Performance tips for the
entire database, click on the top item (database node) in the treeview and
select the appropriate tab. To view all table errors, select the Tables folder
in the Treeview. Similarly, you can reduce the list to a specific table by
selecting that table in the Treeview.
In general, the Errors, Suggestions, and Performance tabs are available for
parent or top-level objects (tables, relations, queries, forms, reports,
macros, modules, command bars, and containers) and not available for child
or sub-objects (fields, controls, sections, etc.). The one exception is module
procedures; this is because there may be a large number of items per
procedure.
Filtering by Error Type
You can also filter the Errors, Suggestions, and Performance lists by the type
of error, suggestion, or performance tip. Just press the [Filter] button at the
bottom of the form. A filter form appears showing all available items for
your current tab. For example, if you are on the Errors tab and press the
[Filter] button, the Filter form shows a list of all available Error types:
86 Chapter 5: Viewing Documentation
Total Access Analyzer
Filter Errors
Each error type is listed, and a description of the currently selected error
type appears in the Details box. Select or deselect individual items, or use
the [Select All] and [Clear All] buttons. Press [OK] to return to the
Documentation Explorer, and the list is updated according to the items
selected in the filter.
Documentation by Object Type
The following sections outline the documentation available in the
Documentation Explorer. Organized by object type, it shows how the
documentation is organized and explains the contents of each Tab for each
type of object. In some cases, a particular tab is not applicable for a
particular type of object and it is not listed. For example, when the General
folder is selected in the Treeview, only the Summary tab has data.
In the remainder of this chapter, the term Folder is used to describe an
entry in the treeview that has a folder icon. The term Item is used to
describe all other objects in the Treeview.
Since Jet databases (MDBs) and Microsoft Access Projects (ADPs) can
contain different types of objects, the descriptions that follow show
whether the object type is available only in MDBs, only in ADPs, or in both
types of databases.
Total Access Analyzer
Chapter 5: Viewing Documentation 87
The following table is a quick reference for finding information on the
documentation you are interested in:
Documentation
Page
Database
88
General, Inventory, Ribbons, Import/Export Specifications,
Security, References, Containers
89
Tables
94
Queries
99
Views
101
Database Diagrams
102
Stored Procedures
103
Relationships
104
Forms
105
Reports
107
Macros
109
Modules
112
Command Bars
127
Diagrams
129
Database Item
The first object in the treeview is the Database item. This item represents
the database whose documentation you are viewing.
Tabs at Database Level
This is what’s under each tab:
88 Chapter 5: Viewing Documentation
Tab Name
What’s Displayed
Summary
Summary information about the database, including
the full path, name, and version
Database
Properties
All database properties
Database XRef
All object cross-references across the database
Total Access Analyzer
Errors
All errors detected in the database
Suggestions
All suggestions for the entire database
Performance
All performance tips for the entire database
General Folder
The General folder contains information about your database at the highest
level and is available for Jet (ACCDB and MDB) and ADP documentation.
Your Access option settings, ActiveX
controls, ImportExport specifications, an
inventory of all objects, library
references, and temporary variables
(TempVars) are included.
MDB documentation may also include
workgroup security information.
For ADPs, containers and security are
not available.
Access Options Item
Access allows you to set a variety of options under Access Options. Those
settings are documented by Total Access Analyzer and shown here. For
more information on individual settings, in Access, go under Access Options
and press F1.
Tab Name
What’s Displayed
Summary
The number of options documented
Options
Each option category, section, and value
ActiveX Controls Item
ActiveX controls can be used on forms and reports. Total Access Analyzer
documents each of their uses.
Total Access Analyzer
Summary
The number of controls by ActiveX control type
ActiveX XRef
Where each ActiveX control is used on the forms and
reports
Chapter 5: Viewing Documentation 89
Containers Folder
For
Access organizes ACCDB and MDB database objects into Containers and
ACCDBs/MDBs Documents. These objects hold permissions and other security settings
only
implemented by Access User-Level security.
If you selected the “Document
Containers and Documents” option
(see page 61), this node appears in
the General folder of the Treeview.
The Container folder includes nine
Containers, each with a Document
folder that holds documents.
For more information on Container
objects, search Access online help
for Containers.
These nine containers are defined in Access by the JET database engine:
DataAccessPages for all data access pages for Access 2003 or earlier
Databases for internal objects maintaining the database
Forms for all forms
Modules for all standard (non-form/report) modules
Relationships for table relationships
Reports for all reports
Scripts for all macros
SysRel for relationship window layout information
Tables for all tables and queries
Containers Folder
The Containers folder contains all container objects.
Summary
A list of all container names
Property Slices
View a property across all containers
Container Item
Each container in the database is an item. Each item also has a Documents
folder.
Summary
90 Chapter 5: Viewing Documentation
The name of the container
Total Access Analyzer
Properties
The properties of the container
Documents Folder
Each container has a Documents folder that holds its members. For
example, every form in the database is represented by a form document in
the Forms container.
Summary
The name of each document in the container
Document Item
Each document item in the container is shown.
Summary
The name of the document
Properties
The properties for the document
ImportExportSpecs Item
Import/Export specifications can be saved in Access 2007 and later. The list
of saved specifications are documented
Summary
The number of saved specifications by type
Details
A list of each import/export name, description, type,
path and XML values
The Detail reports provide more readable displays of the XML text divided
by XML section.
Inventory Item
Inventory contains a list of all top-level objects in the database. This
includes tables, queries, forms, reports, command bars, macros, and
modules.
Summary
A list of the number of objects by type
Objects
A list of each object name by type (use the Filter
feature to limit the list of objects by type)
References Item
Visual Basic for Applications (VBA) allows you to define references to other
objects (libraries) from the Tools | References menu when a module is open
in design view. This item lists each reference in the current database. Note
that Access automatically creates references in every database for:
Total Access Analyzer
The Visual Basic for Applications library
The Microsoft Access Object library
The OLE Automation library
Chapter 5: Viewing Documentation 91
The Microsoft ActiveX Data Objects library
Additionally, other references may be added by Access on your behalf. For
example, when you place an ActiveX control on a form or report, Access
creates a reference to the ActiveX control’s resource library file.
Please note that the Microsoft DAO Object library is not included by default
in new databases that are created in Microsoft Access 2000 or later.
However in databases that need DAO, or in databases converted from
previous versions of Access, this reference exists.
Summary
The number of references in the database
References
Each reference in the database and its properties
(such as the full path, name, and version)
Temporary Variables (TempVars)
In Access 2007 and later, temporary variables can be defined in macros,
embedded macros on forms and reports, and in VBA modules. These
variables can be used by other objects including queries. Since they span so
many object types across the entire database, temporary variables are listed
under General with these tabs:
Summary
Number of named temporary variables
Variables
List of each temporary variable name
TempVars XRef
Where each temporary variable is defined and used
The cross-reference is also available under Modules XREF where you can
filter it from the treeview by object. See Temporary Variables (TempVars)
on page 120 for more information.
Security Folder
Security settings are only available for MDBs and do not apply to ACCDB and
ADP databases.
This folder contains security information on groups, users, permissions, and
the workgroup. If you are not familiar with security, refer to the Access
online help.
A workgroup is a collection of users and groups defined for security.
Information for a workgroup is stored in an Access database called a
Workgroup Information File, which typically has an extension of .MDW. If
you implemented user-level security in your Access application, the
information displays the specific users and groups of users you defined. If
you have not implemented user-level security, the default Access Admins
and Users groups are shown, along with an Admin user.
92 Chapter 5: Viewing Documentation
Total Access Analyzer
Workgroup Information Files are linked to Access itself, not to particular
databases. This means multiple databases can share the same Workgroup
Information File. Total Access Analyzer documents the Workgroup
Information File in use by Access when documentation is generated.
For more information, search Access online help for Workgroup
Information Files.
Summary
Information about the workgroup, including the
number of users and groups, and the path and name
of the Workgroup Information file (.MDW) currently in
use
Errors
Errors detected with security
Security Groups Folder
This folder contains items for each group defined in the Workgroup
Information file.
Summary
The number of groups defined
Errors
Errors encountered while documenting groups
Security Group Items
A group item appears for each group documented. If you implemented
User-Level security in your application, this information is useful for tracking
your group accounts.
Summary
The name of the group, as well as the path and name
of the Workgroup Information file (.MDW) where the
group is defined
Details
The properties of the group
Permissions
The group’s permissions for each object
Important Note on Jet Database Security Documentation
The security settings documented by Total Access Analyzer are the Data
Access Objects (DAO) permissions obtained using the Permissions and
AllPermissions properties of Access Document objects. The names and types
of permissions available through DAO are different from the permission
names and settings available through the Access User Interface using the
Database Tools, User and Permissions ribbon.
Unfortunately, Microsoft provides no documentation on how DAO
permissions map to the Access User-Interface permissions. This, combined
with the fact that there is no way for Total Access Analyzer to get to the
User-Interface permissions means that there is a mismatch between some
Total Access Analyzer
Chapter 5: Viewing Documentation 93
of the permissions documented by Total Access Analyzer and the
permissions you see through the Access User-Interface. Rest assured that
FMS has tested the DAO permissions documentation very carefully and the
values being returned are correct. To use the Total Access Analyzer
permissions documentation correctly, you must become familiar with the
DAO permissions constants and properties.
We regret that we cannot accurately document permissions according to
the terminology shown in the Access user interface, but the values we
document are the exact values returned by the DAO object.
Security Users Folder
The Users folder contains all user objects in the group currently selected. If
you implemented User-Level security on your database, this information is
useful for tracking your user accounts. If you are not using User-Level
security, this section lists the default Access User and Admin user accounts.
Summary
The number of users defined
Errors
Errors encountered during user documentation
Security User Items
Each user has an item shown here.
Summary
The user’s name and workgroup name (of particular
interest is the HasPassword property, which allows
you to ensure that each user has a password set)
Details
The properties of the user
Permissions
The permissions for the current user for all objects and
containers (see page 93 for important information
concerning permissions)
Errors
Errors encountered during user documentation
Tables Folder
The Tables folder contains information on the tables selected for
documentation. This includes table properties, their fields and indexes,
cross reference, errors, suggestions, and performance tips.
94 Chapter 5: Viewing Documentation
Total Access Analyzer
This is an example of the Tables folder for
an ACCDB.
There is a Table-Fields folder to show
field information across all tables.
Each table has its own folder for its Fields
and Indexes.
The terminology is slightly different for
ADPs which are documented later.
Tab Name
What’s Displayed
Summary
The number of tables documented and sorted by
table type
Property Slices
Show the values for a single property across all
tables or fields (see page 82 for more information)
Table XRef
Everywhere each table is used among the
documented objects. See page 96 for a description
of the columns shown in this view.
Errors
Errors detected among all tables
Suggestions
Suggestions for all tables
Performance
Performance tips for all tables
Table-Fields Folder (and Table Item)
The Table-Fields folder displays the list of fields, types, and many other
properties across all tables.
Total Access Analyzer
Summary
By Data Type, the number of fields using it
Fields
For each table, all its fields and many of their
properties.
Field XRef
Every place a field in the table is used among the
documented objects (see page 96 for a description
of the columns shown in this view)
Chapter 5: Viewing Documentation 95
Table Item
An item appears below the Tables folder for each table documented.
Included below each table item is a list of properties, a list of the table’s
fields, and a list of the table’s indexes.
For more information on table definitions, search Access VBA online help for
TableDef object
Summary
Basic information about the table, including the
number of records in the table and the cumulative size
in bytes per record (note that if you did not select
“Document Record Counts” as an option as explained
on page 57, the value of this property is –1)
Properties
A list of all properties for the table
Table XRef
Every place the table is used among the documented
objects (the fields are as follows):
The Calling Object Type and Calling Object Name fields
show the object type and name referring to the table.
The Calling Child Type and Calling Child Name fields
show which item in the Calling Object Name refers to
the table. For example, if a table is referenced by a
control on a form, the form is the Calling Object and
the control is the Calling Child.
The Referenced Object is the table being referenced.
The Called In field shows the property in the Calling
Object or Calling Child that refers to the table.
The Resolved field shows whether the referenced table
exists. If the value is No, the table does not exist in the
documented database. A value of No indicates a
serious error in your database, and is reported in the
Errors tab of the table object.
The Variable field indicates whether the referenced
table is a variable or expression. If this is the case,
Total Access Analyzer cannot determine the validity of
the reference, and automatically sets the Resolved
field to No. If the Variable field is checked (Yes), you
must manually inspect the reference to determine its
validity.
Errors
96 Chapter 5: Viewing Documentation
Errors documented for the table
Total Access Analyzer
Suggestions
Suggestions available for the table
Performance
Performance tips for the table
Fields Folder
For ACCDB/MDB databases only, the Fields folder is the collection of fields
in the table.
Summary
A list of fields in the table
Property Slices
Property’s values across all fields in the table
Field XRef
Every place a field in the table is used among the
documented objects (see page 96 for a description of
the columns shown in this view)
Field Item
For ACCDB/MDB databases only, a field item exists for each field in the
table.
Summary
Basic information about the field, including its data
type, size, and description
Properties
All of the field’s properties (if you did not select the
Document Field Properties option as explained on
page 56, this section is blank)
Field XRef
Everywhere the field is used among the documented
objects (see page 96 for a description of the columns
shown in this view)
Indexes Folder
The Indexes folder is the collection of Indexes belonging to a table.
Summary
A list of indexes in the table
Property Slices
Property’s values across all indexes in the table
Index Item
An Index item exists for each index in the table.
Properties
Total Access Analyzer
The index properties
Chapter 5: Viewing Documentation 97
Tables Folder for ADPs
This is an example of the Tables folder
for an ADP.
Fields (Columns), Indexes, Keys, and
Triggers folders appear for each table.
Fields (Columns) Folder
The Columns Folder for ADPs is similar to the Fields folder for
ACCDBs/MDBs. See the information about the Fields Folder on page 97.
Column Item
The Column Item is similar to the Field item for MDBs. See the information
about the Field Item on page 97.
Keys Folder
The Keys folder is the collection of Keys that belong to an ADP table.
Summary
A list of keys in the table
Property Slices
See a property value across all keys
Key Item
A Key item exists for each key in the table.
Summary
The name of the key and its fields
Properties
The key’s properties
Triggers Folder
The Triggers folder is the collection of Triggers defined for an ADP table.
Summary
List of triggers defined for the table
Trigger Item
A Trigger item exists for each trigger in the table.
98 Chapter 5: Viewing Documentation
Total Access Analyzer
Summary
The name of the trigger and its TSQL
Details
The trigger’s properties
Queries Folder
For
ACCDBs/MDBs
only
Queries only exist in ACCDB/MDBs, so
are not part of ADP documentation.
The Queries folder contains
information on the queries selected for
documentation. This includes query
properties, their exposed columns,
their referenced fields, table joins,
parameters, errors, suggestions, and
performance tips.
Tab Name
What’s Displayed
Summary
The number of queries documented and the number
of queries by query type
Property Slices
The values for a single property across all queries (see
page 82 for more information on Property Slices)
Query XRef
Every place queries are used among the documented
objects (see page 96 for a description of the columns
shown in this view)
Errors
Errors detected for all queries
Suggestions
Suggestions for all queries
Performance
Performance tips for all queries
Query Item
An item appears below the Queries folder for each query documented.
Included below a query item are folders for the columns exposed by the
query, the fields used by the query, parameters, and joins.
For more information on query definitions, search Access VBA online help
for QueryDef object
Total Access Analyzer
Summary
Information about the query such as its SQL string
and type
Properties
The query’s properties
Chapter 5: Viewing Documentation 99
Query XRef
Every place the query is used among the documented
objects (for a description of the columns shown in
this view, see page 95)
Errors
All errors for the query
Suggestions
All suggestions for the query
Performance
All performance tips for the query
Columns Folder
The Columns Folder represents the collection of fields provided (exposed)
by the query (not the fields used by a query which are in the Fields folder).
Not every query has columns. For instance, Action queries never have
columns. The columns correspond to the DAO Fields collection of a query,
which contains the fields returned by a SELECT or Crosstab query.
Summary
A list of fields referenced by the query
Property Slices
Property slices across all query’s columns
Column Item
A column item appears in the treeview for every column provided by the
query.
Summary
Column name
Properties
Column properties
Fields Folder
The Fields Folder represents the fields used in the query. These fields may
or not be columns (fields exposed by the query).
Summary
A list of fields referenced by the query
Field Item
A field item appears in the treeview for every field referenced by the query.
Summary
The name, type and other attributes of the field
Parameters Folder
Parameter queries require input values before running. These values are
typically used in the query’s constraint (WHERE clause) and allow your
queries to be very flexible.
For more information, search Access VBA online help for Parameters
collection
100 Chapter 5: Viewing Documentation
Total Access Analyzer
A query may have many parameters. Access queries support two types of
Parameters, implicit and explicit. Implicit parameters are defined as a
reference to a field or expression that cannot be resolved by the query
engine until runtime. Explicit parameters are those that are explicitly
identified using the Parameters dialog available while in query design under
Design | Show Hide | Parameters.
All explicit and implicit parameters are documented in the Parameters
folder.
Summary
Each parameter and its name
Parameter Item
Each parameter in the query has a parameter item.
Summary
The name and data type of the parameter
Properties
The properties of the parameter
Joins Folder
When a query links tables or queries together, it does so with joins. Each
join in the query is in the Joins Folder.
Summary
The joins identified by number starting at 1
Join Item
Each join in the query is a Join Item.
Summary
The tables and fields used by the join, and join type
Views Folder
Views only exist in ADPs. They are similar to Jet queries, but are stored on
the server rather than inside the ADP.
For ADPs only
Total Access Analyzer
The Views folder contains information
on the views selected for
documentation. This includes view
properties.
Chapter 5: Viewing Documentation 101
Tab Name
What’s Displayed
Summary
The number of views documented and the number of
views by view type
Property Slices
The values for a single property across all views (see
page 82 for more information on Property Slices)
View XRef
Every place views are used among the documented
objects (see page 96 for a description of the columns
shown in this view)
Errors
Errors detected for all views
Suggestions
Suggestions for all views
Performance
Performance tips for all views
View Item
An item appears below the Views folder for each view documented
Summary
Information about the view such as its TSQL string
and type
Properties
The view’s properties
View XRef
Every place the view is used among the documented
objects (see page 96 for a description of the columns
shown in this view)
Errors
All errors for the view
Suggestions
All suggestions for the view
Performance
All performance tips for the view
Database Diagrams Folder
For ADPs only
The Database Diagram folder contains
information on the database diagram
selected for documentation. This includes
database diagram properties.
Tab Name
What’s Displayed
Summary
The number of database diagrams documented
Property Slices
The values for a single property across all database
102 Chapter 5: Viewing Documentation
Total Access Analyzer
diagrams (see page 82 for more information on
Property Slices)
Diagram XRef
Every place database diagrams are used among the
documented objects (see page 96 for a description of
the columns shown in this view)
Errors
Errors detected for all database diagrams
Database Diagram Item
An item appears below the Database Diagrams folder for each database
diagram documented.
Summary
Information about the database diagram
Properties
The database diagram’s properties
Diagram XRef
Every place the database diagram is used among the
documented objects (see page 96 for a description of
the columns shown in this view)
Errors
All errors for the database diagram
Stored Procedures Folder
For ADPs only
Total Access Analyzer
The Stored Procedures folder contains
information on the stored procedures
selected for documentation. This
includes stored procedure properties.
Tab Name
What’s Displayed
Summary
The number of stored procedures documented and
the number of stored procedures by type
Property Slices
The values for a single property across all stored
procedures (see page 82 for more information on
Property Slices)
Chapter 5: Viewing Documentation 103
Stored Proc XRef Every place stored procedures are used among the
documented objects (see page 96 for a description of
the columns)
Errors
Errors detected for all stored procedures
Stored Procedure Item
An item appears below the Stored Procedures folder for each stored
procedure documented.
Summary
Information about the stored procedure such as its
TSQL string and type
Properties
The stored procedure’s properties
Stored Proc XRef Every place the stored procedure is used among the
documented objects (see page 96 for a description of
the columns)
Errors
All errors for the stored procedure
Relationships Folder
For
ACCDBs/MDBs
only
Relationships among tables and
queries are defined from the Database
Tools | Show Hide | Relationships.
Tables and queries can be linked 1-tomany, 1-to-1, or indeterminate
relationships. You can also enforce
referential integrity to ensure that data
changes do not corrupt data.
Total Access Analyzer documents all relationships in your database,
including those that are inherited from tables in linked databases.
The Relationships folder contains all relationships in the documented
database.
Tab Name
What’s Displayed
Summary
Each relationship and its name
Relationships
Option to preview and print a view of your
Relationships window by pressing the [View
Relationships Window] button (for more information,
see page 166)
104 Chapter 5: Viewing Documentation
Total Access Analyzer
Errors
All relationship errors
Relationship Item
A relationship item exists for each relationship.
Summary
All relationship properties, including the names of the
tables and fields the relationship uses, and the
relationship type
Relationships
A graphical representation of the relationship
Errors
All errors for the relationship
Forms Folder
Every form selected for
documentation is available in the
Forms folder.
Each form has folders for Sections
and Controls.
The module code behind the forms is
not included here. Look in the
treeview’s Modules folder for form
modules.
Similarly, the form’s embedded
macros are available in the Macros
folder.
Total Access Analyzer
Tab Name
What’s Displayed
Summary
The total number of documented forms and the
number with and without code
Property Slices
The property slices for forms (select a property to see
its values across all the forms or form controls; see
page 82 for more information)
Form XRef
Where forms are used among the documented
objects (see page 96 for a description of the columns
shown in this view)
Errors
All errors documented for forms
Suggestions
All suggestions for forms
Chapter 5: Viewing Documentation 105
Performance
All performance tips for forms
Form errors, suggestions, and performance tips do not include
information on the module code behind forms. There is a separate Forms
folder under the Modules folder on the treeview.
Form Item
Each documented form has a form item.
Summary
Basic information about the form, including its name,
description, and record source
Properties
All form properties
Form XRef
Where the form is referenced among the
documented objects (see page 96 for a description of
the columns shown in this view)
Errors
All errors documented for the form
Suggestions
All suggestions available for the form
Performance
All performance tips for the form
Sections Folder
Access forms are divided into sections. There are five possible sections for
forms: form header, form footer, page header, page footer, and detail. The
Sections folder contains every section in the form. If a section does not
exist, it is not listed.
Summary
A list of sections and their names
Property Slices
Select a property for all the sections in the form
Section Item
Each section in the form is represented by a section item.
Summary
The section name and number
Properties
All properties for the section
Controls Folder
The Controls folder contains every control on the form.
Summary
A list of controls and their names
Property Slices
View a property for all the controls on the form
106 Chapter 5: Viewing Documentation
Total Access Analyzer
Control Item
Each control in the form is shown as a control item.
Summary
Basic control information such as type, caption, and
control source
Properties
All properties for the control (the properties listed
depend on your selection of “Control Format
Properties” and “Control Other Properties” as
explained on page 57)
Reports Folder
Every report selected for
documentation is available in
the Reports folder.
Each report has folders for
Sections, Controls, and Group
Levels
The module code behind the
reports is not included here.
Look in the treeview’s
Modules folder for report
modules.
Similarly, the report’s
embedded macros are
available in the Macros folder.
Total Access Analyzer
Tab Name
What’s Displayed
Summary
The total number of documented reports and the
number with and without code
Chapter 5: Viewing Documentation 107
Property Slices
The property slice for reports (select a property to
see its values across all the reports or report
controls; see page 82 for details)
Report XRef
Where reports are used among the documented
objects (see page 96 for a description of the columns
shown in this view)
Errors
All errors documented for reports
Suggestions
All suggestions for reports
Performance
All performance tips for reports
Report errors, suggestions, and performance tips do not include
information on the module code behind reports. There is a separate
Reports folder under the Modules folder on the treeview.
Report Item
Each documented report has a report item.
Summary
Basic information about the report including its
name, description, and record source
Properties
All report properties
Report XRef
Where the report is used among the documented
objects (see page 96 for a description of the columns
shown in this view)
Errors
All errors detected for the report
Suggestions
All suggestions available for the report
Performance
All performance tips for the report
Sections Folder
Access reports are divided into sections. There are several possible sections
for reports: detail, headers and footers for the report, page headers and
footers, and the report’s sorting and grouping levels. The Sections folder
contains all the sections in the report.
Summary
A list of sections and their names
Property Slices
View a property for all the sections in the report
Section Item
Each section in the form is represented by a section item.
108 Chapter 5: Viewing Documentation
Total Access Analyzer
Summary Tab
The section name and number
Properties
All properties for the section
Controls Folder
The Controls folder contains all controls on the report.
Summary
A list of all controls and their names
Property Slices
View a property for all the controls in the report
Control Item
Each control in the report is shown as a control item.
Summary
Basic information on each control including its type,
caption, and control source
Properties
All properties for the control (the properties listed
depend on your selection of “Control Format
Properties” and “Control Other Properties” as
described on page 57)
Group Levels Folder
The Group Levels folder contains all group levels on the report.
Summary
A list of all group levels
Property Slices
View a property for all the group levels in the report
Group Level Item
Each group level in the report is shown as a group level item.
Summary
Basic information on each group level including its
control source, group header, etc.
Properties
All properties for the group level
Macros Folder
Every documented macro is listed in the Macros folder.
For each macro, its properties, macro lines, and sub-macro names are listed.
If Embedded Macros were created on the forms and reports, they are
displayed in the Embedded Macros folder which comes after all the
standard macros.
Total Access Analyzer
Chapter 5: Viewing Documentation 109
Tab Name
What’s Displayed
Summary
The number of macros documented
List
A list of macros
Macro XRef
Where macros are referenced among the
documented objects (see page 96 for a description of
the columns shown in this view)
Errors
All errors documented for macros
Suggestions
All suggestions for macros
Performance
All performance tips for macros
Macro Item
A macro item exists for each macro documented.
Summary
The macro’s name and number of lines
Macro Lines
Macro lines with each action, conditions, and
arguments
Macro XRef
Where the macro is used among the documented
objects (see page 96 for a description of the columns
shown in this view)
110 Chapter 5: Viewing Documentation
Total Access Analyzer
Errors
All errors documented for the macro
Suggestions
All suggestions for the macro
Performance
All performance tips for the macro
Embedded Macros Folder
If Embedded Macros were created on the forms and reports, they are
displayed in the Embedded Macros folder below the standard macros.
Summary
Number of forms and reports with embedded macros
Embedded
Macros
List of every embedded macro event across all the
forms and reports
Embedded Macros Forms or Reports Folder
Within this folder, Embedded Macros are categorized by object type (form
or report).
Summary
Number of embedded macros for the object type
Embedded
Macros
List of every embedded macro event for the object
type
Embedded Macros Form or Report Item
Each form or report with embedded macros is listed.
Summary
Number of embedded macros for the object
Embedded
Macros
List of every embedded macro event for the object
Embedded Macro Item
Each embedded macro is listed with its detailed lines.
Summary
Embedded macro event name
Macro Lines
Macro lines with each action, conditions, and
arguments
Overview of Module Documentation
Total Access Analyzer generates a large amount of information about the
module code in your database and works identically for ACCDB, MDB, and
ADP databases. In addition to source code, Total Access Analyzer also
documents and cross references procedures, variables, constants,
declarations, user defined types, class modules, and many other VBA
Total Access Analyzer
Chapter 5: Viewing Documentation 111
constructs. Because the type of documentation generated for modules is
different from other objects, module cross reference is discussed in detail
later.
Types of Access Modules
Access supports four types of modules. Regardless of type, all documented
modules appear under the Modules folder in the Total Access Analyzer
Documentation Explorer form:
Standard Modules
The standard modules are the regular (general) modules that appear in your
database window.
General Class Modules
Class modules allow you to create powerful self-contained objects defined
with properties and methods. Variables can be based on class modules and
used by any module.
Form Class Modules
The code attached to a form is called a form class module. Forms are
considered class modules and can be invoked from any module.
Report Class Modules
Similarly to form class modules, reports have report class modules.
Modules Folder
The Module folder contains all the documented modules.
112 Chapter 5: Viewing Documentation
Total Access Analyzer
There are three folders under the
Modules folder: General, Forms,
and Reports.
Every selected module, and form
and report with module code, is
listed.
The General folder contains the
modules that appear in the
Module tab of the database
window (standard and general
class modules).
Within each module item is a
Procedures folder containing its
declarations and individual
procedures.
Total Access Analyzer
Tab Name
What’s Displayed
Summary
The number of modules documented and the number
of each type of module
List
A list of modules
Module XRef
Module XRef information for all modules (see page
115 for information on Module XRef)
Errors
All errors documented for modules
Suggestions
All suggestions for modules
Performance
All performance tips for modules
Chapter 5: Viewing Documentation 113
General, Forms and Report Folders
The modules are organized into three folders for standard modules , and
modules behind forms and reports. The tabs are identical to the Modules
level tabs but filtered by the module type.
Module Item
An item exists for every module documented.
Summary
Information about the module including its
description and whether it is a class module
Module Code
The module’s VBA source code by procedure (use the
vertical scroll bar, or [PgDn] and [PgUp] keys to move
between the procedures)
Module XRef
Module XRef information for the module (see page
115 for information)
Errors
All errors documented for the module
Suggestions
All suggestions for the module
Performance
All performance tips for the module
Procedures Folder
The Procedures folder contains the module’s declarations section and all its
procedures.
Summary
A list of all procedures in the module
Procedures
Details of each procedure in the module
Procedure Item
Each procedure in the module is a procedure item. This list includes the
declarations section of the module, shown as “(General Declarations)”.
Summary
The procedure definition including its type, start line,
number of lines of code, parameters, etc.
Module Code
The VBA source code for the procedure
Procedure XRef
Where the procedure is referenced
Errors
All errors documented for the procedure
Suggestions
All suggestions for the procedure
Performance
All performance tips for the procedure
114 Chapter 5: Viewing Documentation
Total Access Analyzer
Module Cross Reference
One of the most powerful features of Total Access Analyzer is its ability to
perform module code analysis. This module analysis is called “Module XRef”
and gives you an incredible amount of detail about your modules and how
they work.
Module XRef information is displayed in the XRef tab when viewing a
module or procedure object. The contents of the XRef tab changes
according to the folder or object you are on in the Treeview. For example,
when you click on the Modules folder and select the XRef tab, you are
viewing cross reference information for all VBA code across all modules.
When you click on a specific module and select the XRef tab, you are
viewing information for all VBA code in the current module.
Module XRef includes many types of information:
Total Access Analyzer
Module Definitions
Module summary of options, procedure and line counts, etc.
Procedure Definitions
Procedure declaration information including events
Procedure Usage
Where and how procedures are used (called)
Procedure Calls
Procedures called by each procedure
Constants
Every declared constant, its value, and module scope
Variables
Every variable and how it’s used (defined, assigned a value, or
referenced)
TempVars
Temporary variables referenced by forms, reports, and modules
DoCmd Actions
Every DoCmd action and how it is used
Labels
Every label definition and reference
Function Usage
Every use of Access VBA functions and the parameters passed
Compiler Conditions
Use of compiler conditions defined with #IF and #ELSE commands
Library Declarations
External procedures referenced with Declare statements
Chapter 5: Viewing Documentation 115
User Defined Types
Every user defined type and its elements
User Defined Type Variables
Variables based on user defined types
Enums
Every enum definition and its elements
Enum Variables
Variables based on enums
Class Module Variables
Variables based on class modules
Class Events
Events defined in class modules
Debug & Stop Statements
Everywhere a Debug or Stop statement is used
DEF Types
Use of type definitions (DefInt, DefDbl, DefStr, etc.) to set variable
types based on their first letter
For module folders and items, the XRef tab includes a Module XRef Filter
that lets you select the data to view:
Module XRef Filter Selections
These items are available if you are on the Modules Folder or module item.
If you are on a procedure item, the module level XRef items (e.g. Library
Declarations, User Defined Types, and DEF types) are not available. The
selected XRef item stays the same as you move among modules. If you
move between modules and procedures, each preserves its last selection.
Each Module XRef type is described in detail:
116 Chapter 5: Viewing Documentation
Total Access Analyzer
Procedure Definitions
Detailed information for the definition of every declaration, procedure, and
property Let/Get/Set statement is shown.
The documentation is based on this syntax for Subs:
[Private|Public] [Static] Sub ProcName [(arglist)]
This syntax is used for Functions:
[Private|Public] [Static] Function ProcName
[(arglist)] [As ReturnType]
Events defined in the declarations section of a module are also included:
[Public] Event ProcName [(arglist)]
Similar syntax applies to Property Let, Get, and Set.
For each of these, the following information is shown. The declarations
section is also listed, but most of the fields are not relevant:
Total Access Analyzer
Field Name
Description
Module Type
The type of module (module, form, or report)
Module Name
The module where the procedure is defined
Procedure
The procedure, event, or property name
Static
Checked if the procedure is declared as Static
Public
Checked if the procedure is declared as Public
Private
Checked if the procedure is declared as Private
Type
The procedure type (Sub, Function, or Event); for class
modules, if it is a property, the type (Get, Let, or Set)
Parameters
The procedure’s parameter declaration (argument list)
Parameter
Count
The number of parameters (arguments)
Optional
Parameters
The number of optional parameters (as specified by the
VBA Optional keyword)
Return
The explicit return type for functions
Description
The first line of comment text which is assumed to be
the procedure’s description
Comments
The comment block before your procedure declaration
(or immediately after if no comments are found above
your declaration)
Chapter 5: Viewing Documentation 117
Start Line
The line number where the procedure starts
End Line
The line number where the procedure ends
Error Trap
Checked if the procedure has error handling code (if the
procedure has an “On Error” line, it is considered to
have error handling)
Code Exists
Checked if the procedure has any code in it (if the
procedure only has comments, it is not considered to
have code)
Condition
Compiler condition, if any
Procedure Usage
Also known as the Procedure Cross Reference, this list shows every place a
procedure is used. This includes references from other modules, form and
report events, macros, and even queries. This is extremely useful for
understanding everywhere a procedure is called and the parameters used.
Field Name
Description
Referenced
Module Type
The type of the module in which the referenced
procedure is defined (module, form, or report)
Referenced
Module Name
The name of the module in which the referenced
procedure is defined
Referenced
Proc
The name of the referenced procedure
Calling Proc
The procedure calling the Referenced Proc (may be
blank if the reference is not from a procedure such as
an event, macro, or query)
Calling Object
Name
If there is a Calling Proc, the name of the module in
which the Calling Proc is defined; otherwise, the name
of the object calling the Referenced Proc
Calling Type
The object type of the Calling Object Name
Calling Child
Type
If the procedure is called from a form or report control,
the control type (Command Button, ListBox, Label, etc.);
it is a “child” of the Calling Object
Calling Child
Name
The name of the control referencing the procedure
Event
The event name, if the procedure is called from a form,
report, or control event
118 Chapter 5: Viewing Documentation
Total Access Analyzer
Parameters
The parameters used to call the procedure
Line
If the procedure is referenced in module code, the line
number in the Calling Object Name module where the
reference is made
Common Fields
The remaining Module XRef listings each have these three fields:
Field Name
Description
Module Type
The type of module (module, form, or report)
Module Name
The module name
Procedure
The name of the procedure documented
Procedure Calls
For every procedure, the procedures it uses are listed. In addition to the
common fields listed above, these fields are shown:
Field Name
Description
Referenced
Procedure
The name of the referenced procedure
Parameters
The parameters used in the procedure call
Referenced
Module Type
The type of module in which the referenced procedure
is defined
Referenced
Module Name
The name of the module in which the referenced
procedure is defined
Line
The module line number where the object is referenced
Constants
Each constant declaration is listed, along with its assigned value. Constants
are defined by this syntax:
[Public|Private] Const constName [As type] = value
In addition to the common fields (listed on page 119), these fields are
shown:
Total Access Analyzer
Field Name
Description
Constant
The name of the constant
Value
The value of the constant
Chapter 5: Viewing Documentation 119
Type
The constant declaration type (Const, Public Const, or
Private Const)
DimType
The data type of constant (string, integer, etc.), if
specified
Line
The line number where the constant is defined
Condition
Compiler condition, if any
Variables
The list includes every variable (including constants) and how it is used. In
addition to the common fields (listed on page 119), these fields are shown:
Field Name
Description
Variable
The name of the variable
Parameters
The array parameters, if any
Type
How the variable is referenced:
Const – the variable is declared as a constant
Dim – the variable is declared
Assigned – the variable is assigned a value
Referred – the value of the variable is used
Param – the variable is a procedure parameter
DIMType
If the variable is defined in a Dim statement, the
variable’s data type (String, Long, Boolean, etc.)
Line
The module line number where the variable is used
Condition
Compiler condition, if any
Temporary Variables (TempVars)
The list includes every temporary variable use and how it is used. In addition
to the common fields (listed on page 119), these fields are shown:
Field Name
Description
Line
Line number if referenced from a macro or module
TempVar Name
The name of the temporary variable
Type
How the temporary variable is referenced:
SetTempVar – the variable is assigned a value
Add – the variable in increased by the amount
Referred – the variable is used (referenced)
RemoveTempVar – the variable is cleared
120 Chapter 5: Viewing Documentation
Total Access Analyzer
Assigned Value
Value assigned or incremented
Property Name
Object’s property, if any, where the TempVar is used
DoCmd Actions
Every use of DoCmd in your code is documented. DoCmd has this syntax:
[Application.]DoCmd.Action Arguments
In addition to the common fields (listed on page 119), these fields are
shown:
Field Name
Description
Action
The DoCmd action (Hourglass, Echo, OpenForm, Close,
etc.)
Arguments
The arguments of the DoCmd action
Line
The module line number where DoCmd is called
Labels
Every label definition and reference is documented. Labels are used in a
variety of syntax. Labels are defined this way:
LabelName:
Or referenced this way:
GoTo LabelName
Resume LabelName
In addition to the common fields (listed on page 119), these fields are
shown:
Field Name
Description
Line
The module line number where the label is used
Label
The name of the label
Type
The type of label reference: Define, GoTo, or Resume
Function Usage
References to Access VBA functions (such as IsNull, CInt, Mid$, Len, etc.) are
documented. Note that these are different from calls to user defined
functions, which are part of the procedure calls list.
In addition to the common fields (listed on page 119), these fields are
shown:
Total Access Analyzer
Chapter 5: Viewing Documentation 121
Field Name
Description
Function
The name of the function being called
Parameters
The parameters passed to the function
Line
The module line number where the function is called
Compiler Conditions
Compiler conditions are VBA syntax that specifies which code is active based
on the value of the condition. This is particularly common for code which
has both 32 and 64 bit API declarations. Compiler conditions are defined in
syntax like this:
#If VBA7 Then
< 64 bit code>
#Else
< 32 bit code >
#End If
The use of these conditions is documented:
Field Name
Description
Condition
The condition value
Line
The module line number where the condition is defined
Library Declarations
Library declarations are procedures stored in external DLL or EXE libraries.
They are defined with the Declare syntax:
[Public|Private] Declare Sub procname Lib libname
[Alias aliasname] [([arglist])]
There is a similar syntax for declared functions, which have a return type. In
addition to the common fields (listed on page 119), these fields are shown:
Field Name
Description
Type
The declared procedure type: Function or Sub
Procedure
The name of the declared procedure
Alias
The alias of the declared procedure, if any
Library
The name of the EXE or DLL library
Parameters
The parameters of the declared procedure, if any
# of Params
The number of parameters
ReturnType
The data type of the return value if it is a function
(String, Boolean, Integer, etc.)
122 Chapter 5: Viewing Documentation
Total Access Analyzer
Line
The module line number of the Declare statement
Condition
Compiler condition, if any
User Defined Types
User defined types are defined in the declarations section of a module with
this syntax:
[Private|Public] Type typeName
element1 [(subscripts)] As varType1
element2 [(subscripts)] As varType2
...
End Type
There is one record for every user defined type and element. In addition to
the common fields (listed on page 119), these fields are shown:
Field Name
Description
Type Name
The name of the user defined type
Public
Checked if the Type is defined as Public
Private
Checked if the Type is defined as Private (types defined
in forms and reports are always Private)
Number
The element number, starting at one and incremented
for each element in the type
Variable
The variable (element) name
Parameters
The parameters if the variable (element) is an array
Dim Type
The data type of the element (if defined)
Line
The module line number where the type element is
defined
Condition
Compiler condition, if any
User Defined Type Variables
Every variable based on a user-defined type is listed. The documentation is
based on this syntax:
Dim varName As UserDefinedType
In addition to the common fields (listed on page 119), these fields are
shown:
Total Access Analyzer
Field Name
Description
Type Name
The name of the user defined type
Variable
The variable (element) name
Chapter 5: Viewing Documentation 123
Enum Definitions
Enums are defined in the declarations section of a module with this syntax:
[Private|Public] Enum enumName
membername1 [= constantExpression]
membername2 [= constantExpression]
...
End Enum
There is one record for every enum and element. In addition to the common
fields (page 119), these fields are shown:
Field Name
Description
Enum Name
The name of the enum
Public
Checked if the Enum is defined as Public
Private
Checked if the Enum is defined as Private
Number
The number, starting at one and incremented for each
member in the Enum
Member Name
The member name
Constant
Expression
The integer value of the element (even if it isn’t
explicitly defined)
Implied
Checked if the constant expression was not explicitly
defined
Line
The module line number where the enum member is
defined
Condition
Compiler condition, if any
Enum Variables
Every variable based on an enum is listed. The documentation is based on
this syntax:
Dim varName As EnumName
In addition to the common fields (listed on page 119), these fields are
shown:
Field Name
Description
Enum Name
The name of the Enum
Variable
The variable name
124 Chapter 5: Viewing Documentation
Total Access Analyzer
Class Module Variables
Every variable based on a class module is listed. The documentation is based
on this syntax:
Dim varName As ClassModuleName
In addition to the common fields (listed on page 119), these fields are
shown:
Field Name
Description
Variable
The variable based on a class module
Class Name
The name of the class module referenced
Class Events
Class events are procedure defined with the WITH EVENTS syntax.
In addition to the common fields (listed on page 119), these fields are
shown:
Field Name
Description
Event Name
The defined event name
Public
Checked if the procedure is declared as Public
Start Line
The line number where the procedure starts
End Line
The line number where the procedure ends
Parameters
The procedure’s parameter declaration (argument list)
Parameter
Count
The number of parameters (arguments)
Optional
Parameters
The number of optional parameters (as specified by the
VBA Optional keyword)
ParamArray
If parameter arrays are used
Called
The event is referenced by the documented modules
Condition
Compiler condition, if any
Debug and Stop Statements
Shows all references to Debug.Print and Stop statements. You should
examine this list since these debugging commands should not be running in
a production database (of course, you may have logic that allows them to
work when you are debugging). In addition to the common fields (listed on
page 119), these fields are shown:
Total Access Analyzer
Chapter 5: Viewing Documentation 125
Field Name
Description
Line
The module line number of the command
Command
The command used: “Debug.Print” or “Stop”
Def Type Statements
Every use of a Deftype statement is documented. This command is used to
set the data type of variables based on their first letter. This is an old style of
Basic programming and is not recommended since you can now explicitly
define the data type of each variable.
For more information, refer to “Deftype Statements” in the Access online
help file. There are many Deftype commands: DefBool, DefByte, DefInt,
DefLng, DefCur, DefSng, DefDbl, DefDec, DefDate, DefStr, DefObj, DefVar.
They share this syntax:
DefInt LowLetterRange[, HighLetterRange]
The definition can be set for one letter or a range of letters. These fields are
shown:
Field Name
Description
Module Type
The type of module (module, form, or report)
Module Name
The module name
Define Type
The Deftype: DefInt, DefLng, DefStr, etc.
Low Range
The first letter of the range
High Range
The last letter of the range
Line
The module line number of the DefType
126 Chapter 5: Viewing Documentation
Total Access Analyzer
Command Bars Folder
Command Bars are available for ACCDBs/MDBs and ADPs and include builtin Access command bars and user defined ones. Command bars were
replaced by the Ribbon in Access 2007 but may still exist.
The Command Bars folder
contains all of the documented
command bars.
Each command bar contains
controls that may also contain
additional controls.
Tab Name
What’s Displayed
Summary
A list of all command bars
Property Slices
View a property value across all the documented
command bars or their controls (see page 82 for more
information on using the Property Filter)
CommandBar
XRef
Where command bars are referenced among the
documented objects
Errors
All errors documented for command bars
Command Bar Item
Each documented command bar is an item in the list.
Total Access Analyzer
Chapter 5: Viewing Documentation 127
Summary
Basic information about the command bar (including
the number of controls it has and whether it is a built-in
command bar)
Properties
The command bar properties
CommandBar
XRef
Where the command bar is used among the
documented objects
Errors
All errors documented for the command bar
Controls Folder
Each command bar contains one or more controls. This folder contains all
the controls in the command bar.
Summary Tab
A list of all controls in the command bar
Property Slices
View a property across all the controls in the command
bar (see page 82 for more information on using the
Property Filter)
Control Item
Each control in the command bar is shown in this section of the Treeview.
Note that command bar controls may contain other controls. When this
occurs, Total Access Analyzer adds an additional folder node below the
control item. Expand this node to see the controls contained in the control.
Summary Tab
The name and type of the control
Properties
Every control property
128 Chapter 5: Viewing Documentation
Total Access Analyzer
Diagrams Folder
Total Access Analyzer generates three types of diagrams.
The diagrams are the highest summary
level analysis of your database. Unlike cross
reference information that only shows a
relationship between two objects
(described on page 115), the diagrams
show multi-level hierarchies across multiple
objects and really show how your
application works.
Please remember, the diagram is limited by the capabilities of Total Access
Analyzer. Some object references and procedure calls are not documented
and therefore not included in the diagram. This is particularly true of forms
and reports referenced by variables in your code. See Documentation
Limitations on page 40 for more information.
Due to the cross reference limitations of ADP documentation (see page 44),
only one of the diagrams (Application Flow) is available for ADPs.
Viewing the Diagrams
When you select the Summary tab, Total Access Analyzer loads the diagram
tree. Depending on the number of objects and the complexity of your
application, this may take a moment:
Total Access Analyzer
Chapter 5: Viewing Documentation 129
Viewing a Diagram
Root Level Objects
The first (root) level objects are displayed. Each object can be opened to
show branches representing dependencies upon it. Although there are lines
between the root level objects, there are no dependencies between them.
They are just sorted by type and name.
Buttons
The following buttons are available at the top of the diagram:
+ and - Buttons
Within the diagram, you can expand individual branches by clicking on the
[+] next to the branch. Click on the [-] box to close the branch. To expand or
collapse all branches, use the [+] and [-] buttons next to the [Search] button.
Search Button
The [Search] button allows you to find a value in the diagram. This is
particularly useful if the diagram is large. Enter a value in the combo box
and press the [Search] button. The combo box keeps a list of the values
entered for you to select again.
Detail and Back Buttons
The first time an object is encountered in the diagram, all of its branches are
drawn. If the same object is used again, a reference is made to the original
130 Chapter 5: Viewing Documentation
Total Access Analyzer
drawing. By showing each object’s tree once, the diagram is considerably
smaller and more manageable.
An object already drawn in the diagram is displayed with a [+] at the end of
its line. If you click on that line, the [Details] button is enabled. Pressing the
button jumps you to the first use of that object and its diagram. The [Back]
button takes you back to where you last pressed [Details]. This lets you
easily “drill-down” and go back through the items that you reviewed.
On the diagram reports, this corresponds to the [See Num] column that
displays the line number of the original call.
Diagram Item Button
The [Diagram Item] button allows you to redraw the diagram to show the
hierarchy of a single object. The redrawn diagram can also be printed,
providing a report of a single object's diagram.
To redraw entire diagram, select it in the treeview.
Print Button
The [Print] button previews the diagram that is currently displayed. If the
full diagram is showing, the printed report includes the diagram for all
objects. If a redrawn diagram is showing, the printed report shows the
diagram for a single object.
Diagram Displays in the 64-bit Version
For the 64-bit version of Microsoft Access, the treeview control is not used.
The diagram items are displayed in their entirety (expanded).
Diagram Descriptions
There are three types of diagrams:
Total Access Analyzer
Application
Data
Object
Chapter 5: Viewing Documentation 131
Application Diagram
The most detailed of the three diagrams, the Application Diagram, shows
the hierarchical flow of your entire application. It starts with the Startup
form or Autoexec macro, then shows what procedures and objects it calls,
and then does the same for the called objects. Every form, report, or
procedure that is not called by another object starts its own tree. This
provides a visual overview of all your procedure calls, macro calls, and form
and report events.
Application Diagram
In this example, the first object is the form named Startup. This form has a
command button named “OK” that invokes the CloseForm procedure on its
OnClick event. The form’s OnOpen event invokes a procedure that calls the
IsItAReplica function. The form’s last item is an OnClose event. The next
form is then drawn (Categories).
Every form, report, or procedure that is not used by another object has its
own diagram. Not every form has its own diagram at the root (first) level.
For instance, if a form is used by a procedure through an OpenForm
command, the form’s diagram is drawn from the procedure calling it, and
does not appear on its own.
132 Chapter 5: Viewing Documentation
Total Access Analyzer
Data Diagram
The Data Diagram (not available for ADPs) shows how your database’s
tables are used across your application. The Table XRef (described on page
96) shows which objects reference each table. The Data Diagram shows this
information, along with the objects that use the objects referencing each
table. This illustrates the entire family of objects related to each table.
Data Diagram
This example shows only a partial view of the objects related to the
Categories table. The first branch shows that the query Alphabetical List of
Products uses the Categories table. That query is used in a report that is
opened by a form’s command button’s Hyperlink SubAddress property. The
form is referenced by two other procedures. Several other queries also use
the Categories table, including Catalog, Products by Category, and Sales by
Category.
Beyond the first reference, subsequent items do not necessarily use the
data in the table. For instance, a query that uses a table may be used by a
form that does not use any fields from the table. Also, objects that open
forms and reports referencing the table definitely do not use data from
the table. They are included in the diagram to illustrate all objects directly
and indirectly related to the table.
Total Access Analyzer
Chapter 5: Viewing Documentation 133
Object Diagram
The Object Diagram (not available for ADPs) shows all objects on which a
form, report, or query is dependent. You can quickly see a form and its
subforms, along with the queries, tables, and macros they use. The Object
Diagram is almost like the Data Diagram in reverse; rather than seeing how
data flows from a table, the Object Diagram displays what flows into an
object.
Unlike the Application Diagram, the Object Diagram includes information on
where forms and reports use tables and queries, and excludes procedure
calls. This simplifies the diagram significantly.
Object Diagram from Documentation of Northwind.mdb
134 Chapter 5: Viewing Documentation
Total Access Analyzer
In the example above, you can easily see the Categories form’s record
source table, subform source object, and subform record source. You can
also easily see where the Customer Labels Dialog form uses tables and
macros.
Selecting Another Output Database to View
Total Access Analyzer stores documentation in output databases for each
database you document. This lets you easily retrieve any documentation
previously generated on other databases. When you open the
Documentation Explorer, Total Access Analyzer retrieves the current output
database: the one you last viewed or the one you just generated.
Note that Total Access Analyzer does not automatically load the
documentation for the current database. For example, if you documented
database DB1.MDB, then opened DB2.MDB, started Total Access Analyzer,
from the Main Menu form, you would still see DB1.MDB listed.
You can load previously saved documentation by clicking on the […] button
on the Main Form:
The Select Output Database form is displayed:
Select Output Database Form
Every time you document a database, Total Access Analyzer keeps track of it
and lists it here. The following information is provided:
Total Access Analyzer
The path and name of the database that was documented
Chapter 5: Viewing Documentation 135
The path and name of the output database containing the
documentation
The user who generated the documentation
The date and time the documentation was generated
From this form, you can select an output databases to load, view the
comments for a database, add a documentation database not in the list,
delete a database, or print the list of output databases.
Selecting an Output Database
By selecting an output database, you are “pointing” Total Access Analyzer to
the documentation it contains. The Documentation Explorer and all reports
get their data from the selected output database.
To select an output database, click on the appropriate row in the list of
available output databases then press [Select] (or double-click the output
database).
Viewing Comments for an Output Database
You can view the comments saved in any output database (explained on
page 69) by highlighting the output database and clicking on the
[Comments] button. The Documentation Comments form appears, allowing
you to view or edit the comments. When you are finished, press [OK] to
return to the Select Output Database form.
Adding an Output Database
If you have an output database that does not appear in the list, you can add
it with the [Add] button. This is useful if you receive an output database
from another Total Access Analyzer user, or if you want to view
documentation stored on another folder or on a network. It is also
necessary if you re-install Total Access Analyzer.
Deleting an Output Database from the List
If you no longer need an output database, you can delete it by highlighting
the database and clicking on the [Delete] button. Total Access Analyzer asks
you for confirmation. Press [Yes] to delete the output database and remove
it from the list. Press [No] to cancel.
If the output database was already deleted outside of Total Access Analyzer
(from Windows Explorer for example), a message appears warning you that
the output database does not exist. Press [Yes] to delete the output
database from the list, or [No] to cancel without changes.
136 Chapter 5: Viewing Documentation
Total Access Analyzer
You may want to make a backup copy of your output databases before you
delete them. Using compression, you can store large output databases in a
much smaller amount of disk space.
To automatically remove a TDB from the list that you’ve already deleted
from disk, press the [Refresh] button.
Printing the List of Output Databases
If you would like a printed list of output databases, click on the [Preview]
button, and the Output Databases report opens in preview mode. You can
then print or export the report from the menu.
Total Access Analyzer
Chapter 5: Viewing Documentation 137
Chapter 6: Searching Results
Once the documentation is generated, you can search the results to find the occurrence of
any string. This powerful feature lets you search all objects in your database that you
selected for documentation, and easily find a property value, object name, or piece of code.
Topics in this Chapter
Initiating the Search
Search Results
Searching a Previously Documented Database
Total Access Analyzer
Chapter 6: Searching Results 139
Initiating the Search
After you generate documentation for your database, click on the [Search]
button from the main form to open the Search dialog:
Search Dialog
Enter the text you want to find in the Find What text box. The text can be a
partial word, a whole word, or a phrase (multiple words). You can even
include punctuation. The search is similar to a Like query, so you can use
criteria wildcards that you would use in a query or Access Find dialog.
Match Options
The Match options let you specify how the search should be conducted:
If Find Whole Word Only is checked, your text is found only if it is
separated from other text. If your search text includes multiple
words, the same logic applies (the phrase must be separated from
other text). If this option is not selected, any occurrence of the text
is retrieved.
If Match Case is checked, a case sensitive match is required. If it’s
not checked, any occurrence of the letters, regardless of case, is
retrieved.
Scope Options
The Scope options let you specify what should be searched:
140 Chapter 6: Searching Results
Select Object Properties to search all documented property values
across all the objects. This also includes field and control properties.
Select Macros to search all macro commands, including comments,
conditions, and option arguments.
Total Access Analyzer
Select Modules to search all module code, including code behind
the selected forms and reports.
When you are ready to conduct the search, press the [Find] button.
Keep in mind that the search is only as accurate as the documentation. If
you made considerable changes since you documented the database, you
will need to document your database again to generate accurate results.
Search Results
After some churning, the results are shown in three tabs corresponding to
the Scope options in the previous screen. If you didn’t select a particular
option, its tab does not appear. You can view the results, sort and resize the
columns, and resize the form. You can also examine your own database
objects while this form is open.
If your database is set to show Tabbed Documents, this form appears as a
separate tab. Otherwise, it’s a resizable and maximizable form.
Object Properties Tab
On the Object Properties tab, each row represents an object value matching
the search string. The Object Type column shows the type of the object
where the search string was found, the Object Name column shows the
name of the object, the Property column shows the property name, and the
Value column shows the property value containing the string. The
SubObject Name and SubObject Type columns show information if
applicable.
Search Results: Object Properties Tab
Total Access Analyzer
Chapter 6: Searching Results 141
Macros Tab
On the Macros tab, every macro line with a match is shown. A macro line
has many parts and if any has a match, the entire line is flagged. The Search
Results column identifies which of the fields has a match. The columns Arg1,
Arg2, etc. represent the text boxes that appear in the lower pane when you
edit a macro line.
Search Results: Macros Tab
Modules Tab
Under Modules, each procedure with a match is shown. Only the lines
containing the match are shown:
Search Results: Modules Tab
Search Result Reports
While viewing any of the search results, reports corresponding to the tab
being viewed are available. You can preview or print any of the three
reports. Use the Options button to specify general report settings just as
you would from the Options button under Print from the main form.
142 Chapter 6: Searching Results
Total Access Analyzer
Searching a Previously Documented Database
If you want to search a previously documented database, you can change
the current output database (see page 135). Keep in mind that the search is
only accurate if your documentation is current and comprehensive.
Total Access Analyzer
Chapter 6: Searching Results 143
Chapter 7: Printing Documentation
One of the main reasons for documentation is to create hard copy information on your
database. For this purpose, Total Access Analyzer provides over 300 presentation-quality
reports. This chapter shows you how to select, filter, preview, print, and customize the
available reports. It also includes a brief discussion of each report category to highlight the
information provided in the reports.
Topics in this Chapter
Quick Start
Selecting Reports
Exporting Reports
Filtering Reports
Customizing Reports
Report Categories
Report Sets
Total Access Analyzer
Chapter 7: Printing Documentation 145
Quick Start
Total Access Analyzer includes over 300 reports. While this may seem like a
large number, the types of documentation and analysis generated are also
numerous. This section is designed to give a quick overview of some of the
highlights, as well as suggestions on how to select a report. Once you work
through the Quick Start, read the rest of this chapter to get more
information on how these reports can help you maintain your database.
Opening the Reports Form
From the main form, press the [Print] button, and the Reports form
appears:
Selecting Documentation Reports
Use this form to select, preview, report view, print and export reports. You
can also set options that control the appearance of the reports.
Using the Icon Menu
The icon menu on the left itemizes the report categories and filters the list
of available reports on the right. By default, “All” is selected, and all
available reports are shown on the right. The icon menu is scrollable—make
sure you scroll down the list to see the other categories.
Previewing a Report
Once you have selected the appropriate category, scroll through the list of
available reports on the right. Select a report by clicking on it (you don’t
need to put a check in the box, just make it the current record). You can
press the [Thumbnail] view to see a sample of the report layout or press the
[Preview] button to display the report (with your data) on the screen. Use
146 Chapter 7: Printing Documentation
Total Access Analyzer
the toolbar buttons to change the zoom level, or select the number of pages
to preview at one time, and print or export it.
Report View in Access 2007 and Later
Access 2007 introduces Report View, a feature that lets you filter the
reports interactively. Many of the reports in Total Access Analyzer 2007 and
later can be viewed in Report View; however, some reports are not
available in Report View mode.
Printing Multiple Reports
To print multiple reports, select the reports by clicking on the checkbox to
the left of the report name. Once you have selected all of your reports,
press the [Print] button. A confirmation dialog appears. Press [OK] to send
all the reports to your printer. If any are empty, a report is displayed listing
the selected reports that had no data to print.
You should never print all reports! Many reports show the same
information sorted differently, and many reports are enormous
(especially the form and report control property reports). Make sure you
preview the reports to understand their purpose, and choose only the
reports you want to print.
Exporting Reports
To export multiple reports, select the reports by clicking on the checkbox to
the left of the report name and press the [Export] button. A dialog appears
letting you specify the type of output, the folder to place the files, and
whether you want them opened. See page 151 for more information.
Filtering Reports
Many reports support object filtering. They are identified by a Check in the
Filterable column. Filtering lets you limit the data presented in the reports.
To apply a filter, select the “Filtered” option group button and click on the
[Filter] button to specify the objects to include. With the filter turned on,
the “Filterable” reports only include the objects you selected. See page 152
for more information about filtering reports.
Customizing Reports
You can customize the appearance of the reports by pressing the [Options]
button. All reports allow you to customize their headers and footers, and
you can modify how module code prints in the reports. See page 154 for
more information about customizing reports.
Total Access Analyzer
Chapter 7: Printing Documentation 147
The Reports to Select
If you are printing reports for the first time, you should preview these
reports:
Database: An overview of the entire database.
System: A list and description of every report in Total Access
Analyzer by category (system reports for errors, suggestions, and
performance tips are also useful for understanding what Total
Access Analyzer detects).
Errors: A list of all errors found in your database.
Suggestions: A list of items that may require modifications to make
your application more robust. The Suggestions category also
contains the Table Fields with Different Types report, which lists
fields with different Data Type and Size settings. Use this report to
make your fields consistent across all tables.
Performance: A list of tips for improving your application’s speed
and resource usage.
After printing the Errors, Suggestions, and Performance reports, you should
address the items listed. If you make extensive changes, you should run the
documentation again. Assuming everything is okay, we suggest that you
examine the following valuable reports:
Diagrams: The Application, Data, and Object diagrams show you
how your database works.
Module: The bracketed module code report provides a wellformatted view of your application’s code.
Module XRef: This category contains many useful reports, such as
Module Analysis and Procedure List reports.
Tables: The field reports show field definitions for each table sorted
by table name or field name.
Dictionary: These reports show detailed information for each
object. They are available under Tables, Queries, Forms, Reports,
and Macros.
Blueprints: These reports show a visual layout of each form. They
are available for Forms and Reports.
Relations: These reports contain information about the
relationships in the database.
These are just some of the highlights. Eventually, you will want to view and
understand what all the reports can do for you.
148 Chapter 7: Printing Documentation
Total Access Analyzer
Learning More
The rest of this chapter describes each of the operations available in the
Print Documentation form in detail. First, a description of this form is
provided, including details on customizing the reports. Then, every report
category is described with its highlights mentioned.
Selecting Reports
Never select all reports and print them—many reports show the same
information sorted differently, and many reports are enormous. We
strongly suggest that you preview the reports before printing, and select
only the reports you need. Depending on the complexity of your database,
you could easily print thousands of pages if you were not careful.
Report data is based on the current output database. Remember that the
current output database can be different from the currently opened
database.
If you want to print reports for a previously documented database,
change the current output database by pressing the [Change DB] button
and selecting a new output database from the list (see page 132 for
details).
Selecting Categories and Reports
The reports in the Print Documentation form are organized into categories
similar to those in the Documentation Explorer form. The categories are
listed in the icon menu on the left side of the form. The [All] category shows
all reports.
To select a report, click on the check box to the left of the report name. To
deselect a report, click on the check box again. Pressing the [Clear All]
button deselects all the reports for the currently selected category.
Selecting a report does not print it. You may choose several reports. When
you have finished selecting reports, press [Print] to send all the selected
reports to the printer.
Depending on the number of objects documented and the reports selected,
printing can take a long time. Most Total Access Analyzer reports have
graphics: titles, lines to separate data, etc. The blueprint reports are
particularly graphic intensive, and therefore take more time to print.
Previewing Reports
Because there are so many reports available, selecting the correct reports
may seem like a daunting task. Don’t worry; there are features to help you
Total Access Analyzer
Chapter 7: Printing Documentation 149
understand the reports. Before printing a report, you can preview it on the
screen.
Just click on a report name and press [Preview]. The report appears in
preview mode. The preview is only for the report highlighted, not for all
selected reports; the report currently highlighted is previewed regardless of
whether the check box for it is checked. In preview mode, you can click
anywhere on the report to zoom in or out. Use the navigation buttons at the
bottom of the window to move among the pages. You can also use items on
the Access Print Command Bar or menu to print the report, change the
zoom percentage, and change the number of pages displayed.
To close the report, choose [Close Print Preview].
Report View
You can also open the current report in Report View. Report View shows the
entire report on one page and you can filter the data by clicking on columns
similar to viewing a datasheet. Due to formatting issues, not all reports can
be displayed in Report View.
Printing Reports
The [Print] button lets you print all selected reports at once. The reports are
printed in the order they appear in the list. While the reports are printing, a
status form appears showing which report is being sent to the printer. You
can press the [Cancel] button on this form to stop printing the current
report and return to the list of reports.
Remember, the selected reports span categories and may include items not
visible in the current view based on the report category selected. To see all
selected reports, click on “All” in the icon menu.
Reports with No Data
For most of the reports, if there’s no data, it would not appear in the list.
However, reports may contain no data for a variety of reasons:
150 Chapter 7: Printing Documentation
You did not select any objects of a certain category for
documentation.
You did not select the options necessary to generate the
documentation required for a report. For example, if you did not
select the “Generate Module XRef” option, none of the Module
XRef reports will have data.
There were no errors, suggestions, or performance tips generated
for your database.
You applied a filter that eliminates all data for a report.
Total Access Analyzer
Empty reports are identified in one of two ways:
If you preview a report with no data, a message box tells you the
report is empty.
If you print multiple reports, and one or more report has no data, an
“Empty Reports” report is printed listing every selected report
without data.
Viewing Thumbnails
You can see a sample of any report by using the [Thumbnail] feature. Just
click on any report in the list and press the [Thumbnail] button. An example
of the report appears with a brief description:
Report Thumbnail
The image in the Thumbnail is not from your database—it is only an
example of the report’s layout.
Exporting Reports
You can also export all the selected reports to files in a variety of formats:
Total Access Analyzer
Adobe PDF (*.pdf) (Total Access Analyzer 2007 and later)
HTML (*.html)
Snapshot (*.snp)
Text (*.txt)
Chapter 7: Printing Documentation 151
Word RTF (*.rtf)
XPS (*.xps) (Total Access Analyzer 2007 and later)
To export to PDF and XPS formats, you must have the Office PDF and XPS
add-in installed.
When you press the Export button, this form appears:
Export Report Options
These options are available:
Format: the output file format to create
Folder: the location where the files should be created
Open: an option to open the file after it is created. You must have a
program installed and associated with the file type (for instance,
Adobe Acrobat Reader for PDF files)
The reports are created in the folder you specify. Each report has a unique
name that reflects the name of the report. If the file already exists, it is
automatically overwritten without warning.
A list of files names is available in the System report “Report List with Export
File Names”. Two reports are available listing the names by category or
alphabetically.
Filtering Reports
If you documented many objects, you may only want a subset of those
objects in your reports, especially the large detailed reports. The Filter
feature below the list of reports lets you limit the objects in the reports.
Filter Option
152 Chapter 7: Printing Documentation
Total Access Analyzer
By default, [All Items] is selected and the reports include all documented
objects. To filter objects, select [Filtered] and press the [Edit] button. The
Reports Filter form appears:
Reports Filter
Object Filter
The Objects tab allows you to filter by object. Check the objects to include in
the reports and press [OK] to return to the Print Documentation form. The
Filtered option is selected, indicating that the filter is on.
The object filter does not apply to all reports. Only reports with a “Yes” in
the “Filterable” column of the Print Documentation form respect the
filter.
Use the icon menu on the left to filter the list by object type, and use the
[Select All] and [Clear All] buttons to select or clear all objects.
Errors, Suggestions, and Performance Filter
The Errors, Suggestions, and Performance tabs allow you to filter any of the
reports in the Errors, Suggestions, and Performance report categories by
any of the possible items available on those reports. For example, if you
want to preview or print a report that just shows broken linked tables,
select that report, open the Reports Filter, click on the Errors tab, and select
only the “Table with Invalid Links” error item.
Total Access Analyzer
Chapter 7: Printing Documentation 153
Reviewed Status Filter
The Reviewed tab allows you to filter the reports in the Errors, Suggestions,
and Performance report categories by Reviewed Status:
Reviewed Status Filter
Using the Documentation Explorer, you can mark issues as “Reviewed,” and
filter them out of reports. The Reviewed Status filter allows you to include
all issues (regardless of reviewed status), Reviewed issues only, or Not
Reviewed issues only.
See Reviewing Issues on page 85 for information about flagging items as
Reviewed.
Customizing Reports
Report Options Form
You can customize the appearance of the reports with your own headers,
footers, date format, and more. Report options are global to Total Access
Analyzer and not saved separately for each output database.
154 Chapter 7: Printing Documentation
Total Access Analyzer
Press [Options] to see the Report Options form:
Report Options Form
The top half of the form contains controls for setting options. As you set
options, the sample report on the bottom half of the form updates the
options that you select. These options are available:
Header 1
This text appears at the top left corner of every report page. It can be your
company name, a project name, or any text. This field can contain up to 50
characters.
Header 2
This text appears below Header 1 on every report page. You can have Total
Access Analyzer insert the name of the database by typing #DATABASE#
anywhere in the field. For example, the default setting is “Database:
#DATABASE#” which prints “Database: Northwind.mdb” at the top of each
page (assuming Northwind.mdb is the documented database).
Footer
This text appears at the bottom left of every report page, and can be up to
50 characters. By default, this field is blank.
Total Access Analyzer
Chapter 7: Printing Documentation 155
Use A4 Paper
By default, the output reports are formatted for US Letter size paper. For
metric users, select this option to print on A4 paper.
Separator Lines
Many of the reports have an optional line between records. Check this
option if you want Total Access Analyzer to print this line. The line makes it
easier to read some reports, but can increase the time a report takes to
print. By default, this option is enabled.
Date/Time Format
You can control the format of the date and time printed at the top of each
report page. To use the short date format (e.g. 1/1/09), press [Short]. To use
the long date format (e.g. January 1, 2009), press [Long]. The date and time
printed is when the documentation was generated, not the current date
and time. By default, this option is set to Long.
These formats are defined by your date and time formats specified by your
Control Panel’s regional settings.
Page Numbers
By default, page numbers at the bottom of each page are displayed (e.g.
Page 1). This option lets you display the page number with the total number
of pages (e.g. Page 1 of 10).
If you display the total number of pages (Page N of M), larger reports will
take longer to load. This is because the report must process all the pages
to determine the total page count prior to displaying the first page. If you
display the page number only (Page N), the report can display pages as
they are available, even if all pages are not processed yet.
Colors
You can customize the font and background colors for the header and
footer of the reports.
Report Colors
156 Chapter 7: Printing Documentation
Total Access Analyzer
When you click on the font or background color icon, the color selector form
appears:
Color Selector Form
You can choose from a dropdown list of pre-defined colors, or specify a
value explicitly by entering it or pressing the […] button to open the
Windows color dialog.
As you select colors, the example displays your choices. Some reports have
a grouping section that you can customize with a background shading color.
Setting Module Printout Options
There are two reports that print module code: the standard and the
bracketed Module Printout reports (see page 165 for more information).
The following options control how the Standard Module Printout report
displays your source code.
Press the [Module Printout] tab to see the Module Options settings:
Total Access Analyzer
Chapter 7: Printing Documentation 157
Module Options Form
General Appearance
These settings adjust the appearance of your module printouts. As you
change the options, the sample report’s layout reflects the new choices.
Greenbars
Enable this option to create a “green bar” effect with alternating white and
gray sections. This makes the code easier to read, and is enabled by default.
Bold Proc Declarations
Enable this option to print procedure declarations in bold text. This makes it
easier to see where each procedure begins. This option is enabled by
default.
Font
Select the font to use for lines of code. The fonts available on your system
are displayed in this combo box. Select a mono-spaced font so code lines up
correctly. An 8-point type size is used, so you make sure the your font
supports this size.
158 Chapter 7: Printing Documentation
Total Access Analyzer
Comments
Comment lines can have their own special formatting to make it easier to
differentiate between code and comments. These settings are only applied
to comments on a line by themselves, not to comments that appear on the
same line as code.
Set the text to Bold and/or Italic styles, and specify the Font.
Line Continuation
Lines of VBA code in Access can be very long and may word-wrap in the
report. To show that a line is linked to the previous line, a special symbol is
added to the beginning of the word-wrapped line. By default, the “->”
symbol is added. If you prefer another symbol, select “Custom” and enter
your own.
The line continuation symbol added in the reports is different from the
VBA underline (_) character at the end of the line. The VBA character is
always shown, but it may or may not be at the word-wrap point in the
report.
Report Categories
Reports are grouped into categories similar to the Documentation Explorer.
This section assumes you have a general understanding of the data available
under each category. If you are not sure, refer to the previous two chapters.
Many of the reports contain the same data, but are sorted differently. Each
sort provides a different perspective of the data. For instance, the reports
sorted by property name let you view all the values for a single property
across your objects and are ideal for verifying consistency. Special dictionary
reports (called dictionaries because they provide the complete definition of
a particular object) provide extensive information on the documented
objects. Save the trees! Determine which reports are appropriate for you,
and print only those reports.
If you are only interested in information on specific objects, use the object
filter (described on page 153).
The following sections describe each report category and highlight reports
to help you decide which ones you need.
Errors Category
This category shows errors detected in your database. Errors are defined as
problems that may cause your database to work incorrectly, crash, or lose
data. You should examine these items carefully and resolve them.
Total Access Analyzer
Chapter 7: Printing Documentation 159
“Summary of Errors by Type” shows, by type of error, the number of
instances it was detected in your database.
“By Error Type, All” lists all errors detected, sorted by error type
(with descriptions) and object.
The error reports sorted by Object Name are useful lists of items to
fix in your database. All errors for each object are grouped together,
making it easy to fix all the problems for an object.
“Object Reference Errors” shows all errors involving references to
objects that do not exist. This information is included in the other
error reports, but this report shows the data in a columnar layout
that is easier to understand, especially if references involve
controls.
Under the System category, the “Total Access Analyzer List of Errors” report
lists each type of error the program detects.
Suggestions Category
The reports in this category offer suggestions for improving your database.
Suggestions cover items that are less severe than errors, but are useful for
simplifying maintenance, making your code more robust, eliminating
unnecessary objects, and applying Best Practices. Examples include lists of
unused objects and code, procedures without error handling, procedures
that should be private, and variable name conflicts.
160 Chapter 7: Printing Documentation
The “Summary of Suggestions by Type” report shows, by type of
suggestion, the number of instances it was detected in your
database.
The “By Suggestion Type, All” report includes all the suggestions
detected sorted by suggestion type and object. The Suggestion
Reports sorted by Suggestion Type include a description of each
type of suggestion.
The suggestion reports sorted by object are useful when viewing
and implementing the suggestions for each object.
There are several other reports in this category that list only one
specific type of suggestion. Each suggestion can include many items,
so the listings by type are helpful if you are implementing one type
of suggestion across your objects. For instance, you may want to
use the report for Unused Variables to go through all of your objects
to examine and eliminate those variables.
Total Access Analyzer
The data in the “Table Fields with Different Types” report does not
appear in the other suggestion reports. This report shows identically
named fields with inconsistent data type and/or size. Ideally,
identically named fields have identical settings regardless of the
table. This report lets you see the fields that should be modified or
renamed for consistency. This report is for identically named fields;
to verify the spelling of your field names (e.g. “CustomerID” vs.
“Customer ID” or “CustID”, etc.) use the “Table Fields, Sorted by
Field Name” report in the Tables Category.
Under the System category, the “Total Access Analyzer List of Suggestions”
report lists every type of suggestion Total Access Analyzer detects.
Performance Category
This category contains reports that show you how to improve the
performance of your application. Performance tips are generated for your
system, database, and specific objects and settings in your database.
“Summary of Performance by Type” shows, by type of error, the
number of instances it was detected in your database.
“By Performance Type, All Items” includes all performance tips
detected, sorted by the performance type and object. Descriptions
of each tip are provided.
The reports sorted by Object Type simplify the process of making
modifications to your objects by grouping all the performance tips
for the same type of objects together.
Under the System category, the “Total Access Analyzer List of Performance
Tips” report lists every performance issue the program detects.
Database Category
The Database category contains reports about your database as a whole,
including inventory reports and information on the database’s Container
and Document objects.
Total Access Analyzer
“Database Summary” provides an excellent overview of the
complexity of your database.
“All Errors, Suggestions, and Performance Tips” lists all the ways to
improve all objects, and is sorted by object.
“Object Inventory” reports are useful for giving you a list of every
object in the database.
“User Defined Properties” shows non-standard Access properties
added to your database and objects.
“ActiveX” reports show where, if any, ActiveX controls are used.
Chapter 7: Printing Documentation 161
“Import Export” reports show any import or export specifications
saved in the database.
Tables Category
This category includes reports for table properties, fields, field properties,
and indexes. These are some of the highlights:
“Table List” lists tables along with their basic table information.
“Table Properties, Sorted by Property Name” lets you verify
consistent values of a property across multiple tables.
“Table Fields, Sorted by Table Name” is one of the most valuable
reports. It shows each table and its fields, as well as each field’s field
type, size, and description.
“Table Field Properties, Sorted by Property and Field” compares
even more field property values across your tables.
“Table Dictionary” shows comprehensive information of each table
on a separate page. It allows you to see all the table properties,
fields, indexes, and field properties.
“Table Field General Properties” and “Table Field Lookup
Properties” display the field properties the way they appear in the
table designer tabs.
Queries Category
This category exists only for ACCDBs/MDBs, and provides information on
the queries you selected for documentation. Data includes query properties,
SQL strings, fields used, fields returned (columns), and joins.
“Query List” lists the queries by name and type.
“Query Properties, Sorted by Query Name” makes it easy to see
property settings across all queries. This report provides a good way
to check for errors and inconsistencies.
“Query Tables, sorted by Query Name” shows all tables referenced
by each query.
“Query Fields Referenced” shows each field referenced by each
query.
“Query Dictionary” shows all query documentation, including the
fields used, fields returned, table joins, and parameters.
Views Category
The Views category exists only for ADPs, and provides information about
views.
162 Chapter 7: Printing Documentation
Total Access Analyzer
Database Diagrams Category
The Database Diagrams category exists only for ADPs, and provides
information about database diagrams.
Stored Procedures Category
The Stored Procedures category exists only for ADPs, and provides
information about stored procedures.
Forms Category and Reports Category
Documentation for forms and reports is very similar. This section describes
both categories.
Information on each documented form or report is available, including
object level properties, controls and control properties, sections, printer
settings, and blueprints.
“List” reports show documented objects with basic information,
including whether the object has module code. There are List
reports with and without the record source.
“Subform” and “Subreport” reports list subforms and subreports in
the documented objects.
“Controls” reports list each control on each object sorted by control
type or control name.
“ActiveX” reports highlight ActiveX controls, show where they are
used, and list their class types.
“Dictionary” reports provide detailed information on each form or
report, including properties, sections, subforms or subreports, and
controls. Each form or report is printed on a separate page. The
“Dictionary with Properties” reports also print out property settings
for each control. This report is extremely large, as it lists the number
of properties for every control on every form.
Form and Report Blueprints
If you selected the “Generate Form Blueprints” option (explained on page
57) for documentation, blueprint reports are available for each selected
form and report. Blueprints are special reports that show a visual layout of
each form or report. Blueprints are available only from the Print form, not
from the Documentation Explorer.
Total Access Analyzer
Chapter 7: Printing Documentation 163
Sample Form Blueprint with Annotations
If the “Annotate Images” option was selected, each major control is
annotated with a number in a box (labels, lines, boxes, etc. are not
annotated). This allows easy reference between the layout and
documentation for each control. Annotations also show which controls have
code behind them:
Controls with italicized numbers contain code (or run macros).
Controls with non-italicized numbers in boxes have no code.
This lets you easily identify controls that contain code. When you print
blueprints, the blueprint appears on one page followed by a separate page
listing the names of the controls.
If you are previewing blueprints, please be patient as the individual
blueprints are displayed. Each blueprint takes a moment to appear. The
screen may appear frozen, but it is still processing.
To increase the speed of previewing and printing, consider filtering for a
subset of forms or reports before previewing or printing blueprints (see
page 153 for details).
Report Page Setup
Under Reports, the “Report Page Setup, Orientation” report is a great way
to make sure all the reports in your database have the correct page size,
orientation, and margins. You can easily examine the list to spot
inconsistencies.
164 Chapter 7: Printing Documentation
Total Access Analyzer
There is an Access bug that may cause reports to reset their orientation and
margins, so it’s important to check this before you ship your databases. This
bug can be avoided if you turn off Name AutoCorrect from the Access
Options, Current Database section.
Macros Category
This category contains reports describing macros, including conditions,
actions, names, and comments.
“Macro List” reports show lists of macros, sorted by Macro name or
Number of Lines.
“Macro Dictionary” prints all the macro lines including labels,
conditions, expressions, actions, and command arguments.
Modules Category
This category contains source code reports for all documented modules,
including form, report, class, and standard modules. For more information
on how Total Access Analyzer documents modules, see page 112.
Standard Module Printout
The “Module Printout – Standard” report prints your module code in a
professional looking report—no modifications are made to the code
indentation. The report shows line numbers, and applies fonts, green bars,
and other options as specified under the Module Printout options (see page
156). At the end of each module is an index listing every procedure in the
module and on which line it starts.
Bracketed Module Printout
The “Module Printout – Formatted with Brackets” report shows your code
with standardized indentations and brackets around programming blocks.
Total Access Analyzer
Chapter 7: Printing Documentation 165
Sample Bracketed Module Code Printout
No matter how the actual code exists in your modules, this report
standardizes the code and makes it easy to read and understand. For
example, if the code uses non-standard indentation or no indentation at all,
this report shows the code in a standardized manner. This is ideal in
multiple developer environments where individual developers have
different programming styles.
Every loop is bracketed and subsequent lines are indented two spaces. A
block is any VBA construct that typically groups lines of code together (Sub,
Function, If, Do, While, Select Case, With, Type, etc.).
Exits from blocks of code (e.g. Exit Function, Exit For, Exit Do, etc.) are also
drawn. This is particularly helpful if Exit is buried within several levels of
loops.
Command Bars Category
Command bar reports list command bars, their properties, the controls on
each command bar, and each control’s properties.
Relations Category
For ACCDBs/MDBs only, relations reports contain information about the
relationships in the database, including properties, fields, join types, and
referential integrity settings. This category also includes the relationships
window printout report.
166 Chapter 7: Printing Documentation
“Relationships” report prints a columnar text representation of all
relationships in the database.
Total Access Analyzer
“Relationships Window” report shows the layout of the
relationships window as it appears in the database (in the Database
Tools | Show/Hide | Relationships ribbon).
Security Category
This category is for ACCDBs/MDBs only, and contains information on users,
groups, and object permissions. Note that the permission settings shown in
these reports are the DAO permission settings as documented by Microsoft
Access. See page 93 for important information on these settings.
“Users” and “Groups” reports show lists of all users and groups.
“Container Permissions for Groups” shows all permission settings
for DAO Container objects for the current workgroup’s groups.
“Container Permissions for Users” shows all permissions setting for
DAO container objects for each of the workgroup’s users.
“Object Permissions for Groups” shows the permissions settings for
all database objects for Groups.
“Object Permissions for Users” shows the permissions settings for
all database objects for Users.
Object XRef Category
Object cross reference information shows where tables, queries, forms,
reports, and macros are used throughout your database. This category
contains several reports for flexible sorting and grouping.
Not all object references can be documented. See page 40 for Total Access
Analyzer’s limitations.
The Query, Form, Report, Macro, and Command Bar References
reports show where each object is referenced.
Several reports are available to show references by referenced
Object Type.
The Hyperlinks report shows all Hyperlink references across your
objects and the use of the FollowHyperlink command in your code.
Field XRef Category
This category is available for ACCDBs/MDBs only, and shows where table
and query fields are used in other objects. Various sort options are
available. Field cross reference information is in its own category with its
own reports because of the large amount of field references that exist in a
typical database.
Total Access Analyzer
“Field References, Sorted by Table Name” shows where fields are
used, and is sorted by the referenced table and field names.
Chapter 7: Printing Documentation 167
Several reports are available listing fields referenced by the calling
object. There is a report for all objects that reference fields, and
other reports for just query, form, and report references.
Module XRef Category
The Module cross reference category has the most extensive collection of
reports. These reports are available if you selected “Generate Module XRef”
(explained on page 60). The data is based on detailed analysis of your
general module code and the modules behind the selected forms and
reports.
The available reports are similar to the items available on the Module XRef
tab in the Documentation Explorer (see page 115 for more information).
168 Chapter 7: Printing Documentation
“Module Analysis Summary” reports show the number of lines,
procedures, variables, and various other summary statistics for each
module.
“Module Overview” provides a one-page summary for each module,
showing its public and private interfaces with their procedures,
properties, events, enums, user defined types, library declarations,
implemented classes, and public variables. Class properties are
shown as ReadWrite, ReadOnly, or WriteOnly depending on
whether the corresponding Get and Set/Let statements exist.
“Procedure List” reports show a list of procedures defined in each
module with information on their settings: procedure type,
parameters, return type, etc. You can even include the comments of
a procedure. The comments come from the comment block
immediately before your procedure definition, or if there is none
before it, the comment block immediately after the definition. This
provides an excellent way to track each procedure’s purpose.
“Procedure List, Sorted by Procedure Name” provides an
alphabetical list of procedures and where they are defined. This is
useful as a lookup when you know a procedure name, but not
where it is defined.
“Procedures Called – Where Procs are Called From” is the procedure
cross reference showing where procedures are called from and the
parameters used. This is ideal for reviewing procedure calls before
making modifications to your code.
“Procedures Called, Non-Event Procedures Only” shows the
procedure cross reference for procedures excluding event
procedures in forms, reports, and class modules.
“Procedure Calls – What Each Procedure Calls” shows a list of
procedures called by each procedure.
Total Access Analyzer
“Library Declarations” reports show all uses of the Declare keyword
to access external DLL or EXE procedures.
“ENUM” reports list every enum definition and its members.
Reports also show where they are used.
“Event” reports show events defined by module, and where they
are raised.
“User Defined Type” reports list every user defined type along with
its elements and where it is used.
“Variable List” reports show a list of variables declared and their
data types.
“Variable References” reports show where variables are referred to
or assigned values (these reports may be very large).
“Variable Constants” reports shows all constants defined, their
assigned values, and their scope.
“Variables of Class Module” reports show variables based on class
modules and where they are defined.
“Classes Implements” reports show what classes are referenced via
the IMPLEMENTS command.
There are also reports for Line Labels, Access/VBA function calls,
DoCmd calls, and DefType statements.
Diagram Category
Diagrams are the highest level of analysis generated by Total Access
Analyzer. Three diagrams are available for ACCDBs/MDBs: Application, Data,
and Object. Only the Application diagram is available for ADPs. The
diagrams are described in detail for the Documentation Explorer (see page
131 for more information).
The diagram reports differ from the view of the diagrams in the
Documentation Explorer in these ways:
All branches are expanded.
The called object’s module type and name is shown.
There is a [See Num] field for objects whose calls were drawn earlier
in the diagram. The value in the column refers to the line number
where the original drawing is located.
Lines are not drawn between root level objects.
System Category
The System category contains reports about Total Access Analyzer. These
reports are helpful for giving you a better idea of the features of the
program:
Total Access Analyzer
Chapter 7: Printing Documentation 169
“Total Access Analyzer Report List” shows every Total Access
Analyzer report, along with its description.
“Report List with Export File Names” lists the reports and the name
used when you export it to a folder.
Reports listing all Errors, Suggestions, and Performance Tips
detected by Total Access Analyzer are available, and include
descriptions of each detected item and ways to fix your objects.
“Total Access Analyzer Output Databases” lists all documentation
databases. See page 131 for more information about
documentation output databases.
Report Sets
Total Access Analyzer allows you to create collections of reports you save
for easy retrieval, called Report Sets.
This powerful feature lets you retrieve a set of reports and minimize the
complexity of dealing with the huge number of reports available in Total
Access Analyzer.
For example, you may want to consider creating the following report sets:
Database administrator reports that includes Table Dictionary,
Relationships, and other reports to help manage a database’s data
Developer reports with all the relevant module code reports for
developer code review meetings
A set of form and report blueprints for application design sessions
Total Access Analyzer ships with a set of built-in report sets that may suit
many of your needs. You can access the Report Sets form by clicking on the
[Report Sets] button on the Print Documentation form to open this:
170 Chapter 7: Printing Documentation
Total Access Analyzer
Report Sets Form
There is a considerable amount of functionality built into this feature. Here
are tips for using it:
To select a report set, highlight any of the sets listed and click the
[Select] button. You are returned to the Print Documentation form,
with all of the reports in the chosen set selected. The name of the
chosen report set is displayed on the top of the Print
Documentation form.
To create a new report set that includes the reports that are
currently selected on the Print Documentation form, click the [New]
button, and enter the name and description for the new set, then
click [OK]:
Creating a New Report Set
Total Access Analyzer
To rename a report set and/or change its description, press the
[Rename] button.
To copy the selected report, press the “Duplicate” button.
Chapter 7: Printing Documentation 171
To delete user-defined report sets, use the [Delete] button. Built-in
reports cannot be deleted.
To update the selected report set by replacing its selected reports
with those currently selected, click the [Update] button.
If you close the Print Documentation form with a report set selected,
your report selections are preserved but the currently selected set
name is reset. The next time you use the Print Documentation form,
you will see that the set name label at the top of the form is reset to
“Report Set: <none>.”
172 Chapter 7: Printing Documentation
Total Access Analyzer
Chapter 8: Quick Documentation
This chapter explains how to use the Quick Doc feature of Total Access Analyzer to generate
basic information for individual objects in your database quickly. Learn how the Quick Doc
Wizard works, and how it can help you understand your objects when full documentation
and analysis of your entire database is not necessary.
Topics in this Chapter
Introduction
Quick Doc Wizard
Total Access Analyzer
Chapter 8: Quick Documentation 173
Introduction
There are times when you simply need a quick printout of an object’s
structure. For example, the field and property list of some tables, or a
module’s code. For such simple tasks, Total Access Analyzer offers a Quick
Doc feature as an alternative to the full documentation. The Quick Doc
feature allows you to document basic information:
Quick Doc Options for Jet Engine (MDB & ACCDB) Databases
Since the point of Quick Doc is to generate documentation quickly, the
advanced information provided by the main Total Access Analyzer
documentation operation is not available. This means that errors,
suggestions, performance tips, cross reference, module analysis, and
diagrams are not available through Quick Doc.
For a complete list of which Full Documentation reports are available in
Quick Doc, print the list of Total Access Analyzer reports from the Main
Menu form’s [Report] button. The report is available under the System
category.
To start Quick Doc, press the Quick Doc button on the Main Menu form.
Unlike full documentation, Quick Doc documentation is not saved. When
you leave the Quick Doc Wizard, the results are discarded. Note that the
documentation generated by Quick Doc is based on a snapshot of the
current state of your database. This may differ from previously generated
results for the same database.
174 Chapter 8: Quick Documentation
Total Access Analyzer
Quick Doc Wizard
Quick Doc is a multi-page wizard that guides you through the process of
selecting an object, selecting options, generating results, and printing or
previewing the output reports.
Page 1: Selecting a Category
The first page of the Quick Doc Wizard displays a list of documentation
categories. Note that you can only select one category at a time:
Quick Doc Wizard (Page 1)
Select a category and press [Next] to continue.
Total Access Analyzer
Chapter 8: Quick Documentation 175
Page 2: Selecting Objects
The second page lists the objects available in the selected category. If you
selected the Database or Relationships category, this screen does not
appear since those categories do not have objects to select.
Quick Doc Wizard (Page 2)
Select a single object by checking its checkbox, or use the [Select All] button
to select all objects. To deselect an object, clear its checkbox, or use the
[Clear All] button to clear all objects.
Setting Options
Depending on the category specified on the first page of the Wizard, there
may be additional options available. These options appear below the list of
available objects on the second page of the form. The options are the same
options as the full documentation options. See page 56 for more
information on the individual options. Your selection of Quick Doc options is
not related to the options selected under [Document]. This lets you set your
options independently on the Document and Quick Doc sides.
After selecting the objects and options you want, press the [Next] button.
Total Access Analyzer displays a dialog asking you if you want to generate
documentation. Select [Yes] to generate the documentation.
Page 3: Generating Documentation
Depending on the number of objects you have selected, and their
complexity, this process can take anywhere from a few seconds to several
minutes. As documentation is generated, a status form keeps you updated:
176 Chapter 8: Quick Documentation
Total Access Analyzer
Quick Doc Wizard (Page 3)
Like Full Documentation, the screen may flash as objects are documented.
This is normal behavior.
Page 4: Selecting Reports
When the documentation is complete, reports are available:
Quick Doc Wizard (Page 4)
This lists the available reports for the category of objects documented. Only
reports with data are listed.
The report selection screen behaves like the report selection screen for the
main documentation. To preview or open a report in report view, go to the
report row (no need to check it), and press [Preview] or [View].
To print or export reports, check the ones you want and press the [Print] or
[Export] buttons.
Total Access Analyzer
Chapter 8: Quick Documentation 177
To change report options, press the [Options] button. See page 154 for the
report options. The report options are the same for both Full
Documentation and Quick Doc. That is, if you change the report layout here,
it also changes for your Full Documentation reports.
Finishing
After you finish previewing and printing your reports, you can:
Press the [Back] button once to select new objects to document.
Press the [Back] button twice to return the first page of the Quick
Doc Wizard where you can specify a new category.
Press the [Cancel] button to close the Quick Doc Wizard and return
to the Total Access Analyzer Main Form.
Keep in mind that Quick Doc results are not saved. When you leave the
Quick Doc Wizard, the results are discarded.
178 Chapter 8: Quick Documentation
Total Access Analyzer
Chapter 9: Product Support
This chapter provides information on troubleshooting problems that arise and obtaining
support for Total Access Analyzer.
Topics in this Chapter
Support Resources
Web Site Support
Technical Support Options
Contacting Technical Support
Total Access Analyzer
Chapter 9: Product Support 179
Support Resources
There are many resources available to resolve issues you may encounter.
Please check the following:
Readme File
Check the README file for the latest product information. The README file
is located in the directory where you installed the product.
Product Documentation
We’ve spent a great deal of care and time to make sure the Total Access
Analyzer manual and help file are very detailed. Check the Table of Contents
and Index for your question, and read the appropriate pages.
Web Site Support
The FMS web site contains extensive resources to help you use our products
better. Resources include product updates, frequently asked questions
(FAQs), forums, information on new versions, betas, and other resources.
Web Site
The FMS web site is located at:
www.fmsinc.com
News and important announcements are posted here.
Support Site
The main support page is located at:
http://support.fmsinc.com
From this page, you can quickly locate the other support resources.
Product Updates
FMS takes product quality very seriously. When bugs are reported and we
can fix them, we make the updates available on our web site. If you are
encountering problems with our product, make sure you are using the latest
version.
Frequently Asked Questions (FAQs)
Common questions and additional information beyond what is in the
manual is often available from our FAQs.
180 Chapter 9: Product Support
Total Access Analyzer
Microsoft Patches
Our support site also includes links to Microsoft patches that are related to
our products. Make sure you’re using the latest versions by checking here or
visiting the Microsoft site.
Technical Support Options
FMS is committed to providing professional support for all of our products.
We offer free access to our online FAQs and forums. Bug reports, feature
requests, suggestions, and general pre-sales questions related to our
products are always available at no cost.
Additional maintenance plans are available to provide subscribers with
enhanced technical support. This is the best way for you to stay current with
the rapidly changing technologies that impact project development, and to
ensure you are getting the maximum return from your software investment.
Please visit our web site, www.fmsinc.com, for the most up-to-date
information.
Features & Benefits
Premium
Incident
Standard
Access to FAQs
Access to Forums
Minor Upgrades/
Bug Fixes
Telephone Support
Per incident
First 30
Days
Email Support
Per incident
First 30
Days
Additional
fee
Additional
fee
Priority Response Time 1
Senior Engineer Support
Team
Email Project for Testing
Programmatic Code
Assistance 2
Major Upgrades for Current
Version (not between
Access versions)
Total Access Analyzer
Chapter 9: Product Support 181
Cost
Annual Fee
Fee Per
Incident
Included
1. Response generally within two business days. Actual resolution may take
longer depending on complexity of the issue reported.
2. Custom Programming implementation is not provided in our Support
Maintenance plans. For products that include a programmatic interface, we
can provide instructions for using our programmatic interface, and show
examples, but we do not implement this into your projects. This service is
available from our Professional Solutions Group.
Premium Subscription
The Premium Subscription is the ideal option for customers seeking the
highest level of support from FMS. The annual fee entitles you to telephone
and email technical support from a senior support engineer.
From time to time, FMS may release new versions of existing products
which add new features. These are point releases (e.g. from version 15.0 to
15.1) and are different from new builds that correct problems in existing
features (e.g. from version 15.00.0001 to 15.00.0004).
These point releases are available for a nominal upgrade fee to existing
customers. Premium Technical Support subscribers receive these upgrades
automatically and for no additional charge during their subscription term.
NOTE: Upgrades between versions (for instance going from Access 2010 to
Access 2013) are not considered Point Release Upgrades and are not
included in the Premium Subscription.
Subscriptions are available for a twelve month period, and may be
purchased at any time. You must be the registered owner of the product to
purchase a subscription and the only person contacting FMS for support
under the subscription.
Please ensure you have purchased the subscription you need for Total
Access Analyzer.
Per Incident
Our Per Incident package is available individually or by purchasing multiple
incidents in advance. The Per Incident support package provides telephone
and email technical support from a Senior Technical Support Engineer for
resolving one incident.
An incident is defined as a single question related to one of our
products. The Per Incident period is from start to finish (report of the
incident to resolution) for a single incident. If you anticipate multiple
182 Chapter 9: Product Support
Total Access Analyzer
questions for a single product, we recommend purchasing the Premium
Subscription.
Standard Subscription
Our Standard Subscription comes with every product purchased for no
additional cost. The standard subscription comes with access to our FAQs
and forums, and responses to bug reports and feature requests for that
version.
Please note that the person requesting support must also be the registered
user of the product. Registration is required and will be requested by our
Technical Support professionals.
Contacting Technical Support
If the troubleshooting suggestions and other support resources fail to
resolve your problem, please contact our technical support department. We
are very interested in making sure you are satisfied with our product.
Registering Your Software
Please register your copy of Total Access Analyzer at:
http://www.fmsinc.com/register
You must be registered to receive technical support. Registration also
entitles you to free product updates, notifications, information about
upcoming products, and beta invitations. You can even receive free email
notification of our latest news.
Contact Us
The best way to contact us is to submit a ticket on our support site:
http://support.fmsinc.com
Please provide detailed information about the problem that you are
encountering. This should include the name and version of the product,
your operating system, and the specific problem. If the product generated
an error file, please submit that as well.
Our ticketing system will let you track the progress of your issue and see the
entire thread of communications and file attachments.
Please bear in mind that a unique issue may involve meetings between the
technical support staff and product developers, so your patience is
appreciated.
Total Access Analyzer
Chapter 9: Product Support 183
Microsoft Technical Support
FMS only provides technical support for its products. If you have questions
regarding Microsoft products, please contact Microsoft technical support.
184 Chapter 9: Product Support
Total Access Analyzer
Index
6
64-bit version, 70, 129
A
A4 paper, 152
Access database documenter, 4
Access options, 82
ActiveX controls, 82, 159
add-ins menu, 23
ADE databases, 38
ADPs
connection, 21
differences from MDBs, 31
limitations, 38–39
objects, 39, 80
security, 39
Transact SQL (TSQL), 38
XRef, 38
analysis, 34
annotate blueprints, 52
application diagram, 54, 130
B
backup, 22
blueprints
annotating, 52
options, 51
reports, 159
unhiding controls, 52
bold proc declarations, 154
bracketed module printout, 161
C
cancel documentation, 61
class events, 123
class module variables, 123
Total Access Analyzer
class modules, 108
colors, 152
columns, 91, 94
command bars, 49, 125–27
controls, 126
reports, 162
comments, 63, 154
compact after documentation, 55
compile code, 21, 35
compiler conditionals, 8
compiler conditions, 119
constants, 117
containers, 55, 82
control properties, 51
format properties, 51
other properties, 51
controls, 102, 105, 126
corrupt databases, 21, 65
cross reference. see XRef
customizing reports, 143
D
Data Access Objects (DAO), 84
data access page, 35, 37
data diagram, 55, 131
database diagrams, 97
reports, 159
database documenter, 4
database reports, 157
databases
backing up, 21, 22
compacting, 21
compiling, 21
corruption, 21, 65
decompiling, 65
disabling Visual SourceSafe, 26
network, 24
opening exclusively, 20
permissions, 20
preparing. see preparing databases
read-only, 26
Index 185
verifying linked tables, 21
date/time format, 152
debug/stop statements, 124
decompile, 65
def type statements, 124
demos, 16
design view, 70, 71, 73
diagrams, 6, 49, 54, 71, 127–32
application, 54, 130
data, 55, 131
database, 97
diagram item, 129
object, 55, 131
redrawing, 129
reports, 165
searching, 128
viewing, 127
disk space, 22, 134
DoCmd, 118
documentation
canceling, 61
comments, 63, 134
compacting, 55
exploring. see documentation explorer
failures, 64–66
full, 34, 41–66
generating, 46, 61–64
limitations, 35–39
object errors, 35
options. see options
performance analysis. see performance analysis settings
printing. see reports
Quick Doc. see Quick Doc
scheduling, 46, 57–60, 60
searching. see search
selecting objects, 44, 47–52
specifying options, 49, 53–57
starting, 46, 57–60
summary, 62
viewing, 67–132
wizard, 42
documentation explorer, 67–132
command bars folder, 125–27
database diagrams folder, 97
diagrams folder, 127–32
forms folder, 100–102
general folder, 81
macros folder, 106
modules folder, 109–11
opening objects, 70, 71, 73
property slices, 72, 74
relationships folder, 99
186 Index
reports folder, 103–5
resizing, 74
stored procedures folder, 98
tables folder, 87–92
views folder, 95–96
documents, 55, 82
E
embedded macros, 106
embedded macros folder, 107
enum definitions, 122
enum variables, 123
errors, 7, 31, 70, 76
filtering, 79
object, 35
out of memory, 66
reports, 155
reviewing, 78, 150
startup, 26–27
EVAL statements, 37
exclusive access, 20
F
field inconsistency, 157
field XRef, 53
reports, 163
fields, 90, 94
filter
errors, 79
objects, 78
properties, 72, 74
reports, 149–50
reviewed status, 78, 150
find whole word only, 136
FMS web site, 13–16, 176
font, 154
footer, 152
format properties, 51
forms, 100–102
controls, 102
reports, 159
sections, 101
function calls, 119
G
greenbars, 154
groups, 105
Total Access Analyzer
H
headers, 151
hyperlinks, 37
I
Import Export Specifications, 84
indexes, 91
installation, 17–27
files installed, 19
location, 19
setup, 18
upgrading, 18
inventory, 84
J
joins, 95
K
keys, 91
L
labels, 119
library databases, 37
library declarations, 120
licensing, i–iii
limitations, 35–39
ADP, 38–39
line continuation, 155
linked tables, 21
M
macro lines, 106
macros, 106
reports, 161
main menu, 42
match case, 136
maximum controls per form, 57
maximum controls per report, 57
maximum fields per query, 56
maximum fields per table, 56
maximum form complexity, 57
maximum report complexity, 57
MDE databases, 38
memory errors, 66
Microsoft Access 2010, 8
Total Access Analyzer
Microsoft database documenter, 4
Microsoft Visual SourceSafe, 25
minimum acceptable RAM, 57
minimum local disk space, 57
module printout, 153
module XRef, 54, 71, 111–25
class events, 123
class module variables, 123
compiler conditions, 119
constants, 117
debug/stop statements, 124
def type statements, 124
DoCmd, 118
enum definitions, 122
enum variables, 123
function calls, 119
labels, 119
library declarations, 120
procedure calls, 116
procedure definitions, 113
procedure usage, 115
reports, 164
temporary variables, 118
user defined type variables, 121
user defined types, 121
variables, 117
modules, 107–25
bracketed printout, 161
general, 110
procedures, 111
report, 161
XRef. see module XRef
N
network database, 24
new errors, 9
new features, 8
new performance tips, 9
new suggestions, 9
O
object diagram, 55, 131
object filter, 78
object references, 35
object XRef, 71
reports, 163
options, 45, 49, 53–57
Access options, 82
blueprints. see blueprints
Index 187
compact after documentation, 55
control, 51
control format properties, 51
control other properties, 51
document containers, 55
document documents, 55
document relationships, 55
document security, 55
generate diagrams, 54
generate field XRef, 53
generate module XRef, 54
performance analysis. see performance analysis settings
printer properties, 52
record counts, 50
table, 50
table field properties, 50
out of memory, 66
output database, 58–59
adding, 134
changing, 132
compacting, 55
default directory, 59
deleting, 134
printing, 134
selecting, 132
P
page numbers, 152
page setup, 160
paper size, 152
parameters, 94
partial module cross-referencing, 8
performance, 7, 31, 71, 77
reports, 157
reviewing, 78, 150
performance analysis settings, 56–57
controls per form, 57
controls per report, 57
disk space, 57
fields per query, 56
fields per table, 56
form complexity, 57
minimum RAM, 57
report complexity, 57
permissions, 20
preparing databases, 20–22
ADPs, 21
backing up, 22
compiling, 21
disk space, 22
opening exclusively, 20
188 Index
permissions, 20
resolving corruption, 21
verifying linked tables, 21
previewing reports, 142, 146
printer properties, 52
printing documentation. see reports
printing reports, 143, 146
procedure calls, 116
procedure definitions, 113
procedure usage, 115
procedures, 111
property slices, 72, 74
Q
queries
columns, 94
fields, 94
joins, 95
parameters, 94
reports, 158
Quick Doc, 33, 169–74
generating, 173
reports, 173
results, 174
selecting category, 171
selecting objects, 172
selecting options, 172
R
readme file, 176
read-only, 26
references, 84
class modules, 37
object, 35
resolved, 35
unresolved, 36–38
registration, 16, 179
relationships, 55, 99
reports, 162
report categories, 155–66
command bars, 162
database, 157
database diagrams, 159
diagrams, 165
errors, 155
field XRef, 163
forms, 159
macros, 161
module XRef, 164
Total Access Analyzer
modules, 161
object XRef, 163
performance, 157
queries, 158
relationships, 162
reports, 159
security, 163
stored procedures, 159
suggestions, 156
system, 166
tables, 158
views, 159
XRef, 163, 164
report sets, 166–68
report view, 143, 146
reports, 7–8, 68, 103–5, 141–66
A4 paper, 152
blueprints, 159
bold proc declarations, 154
bracketed module printout, 161
categories. see report categories
colors, 152
comments, 154
controls, 105
customizing, 143, 151–55
date/time format, 152
exporting, 143, 148
filtering, 143, 149–50
font, 154
footer, 152
greenbars, 154
groups, 105
headers, 151
line continuation, 155
module printout, 153, 161
no data, 146
options, 151–55
page numbers, 152
page setup, 160
previewing, 142, 146
printing, 143, 146
Quick Doc, 173
report view, 143, 146
reports, 159
sections, 104
selecting, 142, 144, 145–48
separator lines, 152
sets, 166
thumbnails, 147
resolved references, 35
reviewed status, 78, 150
filtering, 78, 150
Total Access Analyzer
reviewing issues, 77
ribbons, 37
S
schedule documentation, 46, 57–60, 60
screen saver, 62
search, 136–39
changing database, 139
find whole word only, 136
limitations, 137
macros, 136, 138
match case, 136
modules, 136, 138
object properties, 136, 137
printing, 138
reports, 138
results, 137, 138
sections, 101, 104
security, 55, 85–87
reports, 163
select objects, 44, 47–52
command bars, 49
diagrams, 49
XRef, 48
separator lines, 152
setup. see installation
SourceSafe, 25
start documentation, 46, 57–60
starting Total Access Analyzer, 22–24
startup errors, 26–27
stored procedures, 98
reports, 159
suggestions, 7, 31, 71, 77
reports, 156
reviewing, 78, 150
system reports, 166
system requirements, 18
T
table field properties, 50
table options, 50
table record counts, 50
table reports, 158
tables, 87–92
columns, 91
fields, 90
indexes, 91
keys, 91
triggers, 92
Index 189
technical papers, 16
technical support, 179
Microsoft, 180
temporary variables, 85
TempVars, 85, 118
undefined, 9
unused, 9
thumbnails, 147
Total Visual Agent, 21
Transact SQL (TSQL), 38
triggers, 92
troubleshooting, 26–27, 64–66, 176
U
unhide controls, 52
uninstalling, 19
unresolved references, 36–38, 37
update wizard, 19
updates, 16, 19
upgrading, 18
user defined type variables, 121
user defined types, 37, 121
190 Index
V
variables, 117
VBA function calls, 119
viewing documentation, 67–132
navigating, 72
views, 95–96
reports, 159
Visual SourceSafe (VSS), 25
W
web site, 13–16, 176
X
XRef, 6, 48, 53, 54
field, 53, 163
module, 71, 111–25
object, 71
reports, 163, 164
Total Access Analyzer