1
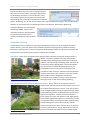
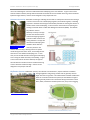
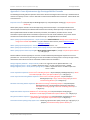
City of Austin Urban Design Division
February 2014
Table of Contents
Introduction ...................................................................................................................................................................2
Green Infrastructure App Quick Start Guide .................................................................................................................3
Green Infrastructure App in the Prototype Builder .......................................................................................................5
Stormwater Model ....................................................................................................................................................5
Stormwater Controls .................................................................................................................................................6
Green Roof: ...........................................................................................................................................................6
Green Roof Connected to Rainwater Harvesting System: ....................................................................................6
Rainwater Harvesting:...........................................................................................................................................7
Biofiltration Systems: ............................................................................................................................................7
Rain Gardens: ........................................................................................................................................................8
Conventional Facility: ............................................................................................................................................8
Preset Buttons ...........................................................................................................................................................9
“No green infrastructure” .....................................................................................................................................9
“Minimum Green Infrastructure” .........................................................................................................................9
“Green Infrastructure Medley” .............................................................................................................................9
“No water quality controls & No fee-in-lieu” .......................................................................................................9
Manual Entry ...........................................................................................................................................................10
Stormwater and Green Infrastructure Costs ...........................................................................................................11
Pollutant Removal ...................................................................................................................................................12
Key Pollutants .....................................................................................................................................................12
Inputs ..................................................................................................................................................................12
Load Calculations ................................................................................................................................................13
Appendix A: Green Infrastructure App Prototype Builder Formulas .....................................................................15
Appendix B: Prototype Builder Local Customization ..............................................................................................17
Changing the Local Stormwater Model ..............................................................................................................17
Changing the Local Pollution Concentrations & Removal Efficiencies ................................................................18
Changing the Stormwater Control Costs ............................................................................................................18
Green Infrastructure App in the Scenario Builder .......................................................................................................19
Overview .................................................................................................................................................................19
Inputs ......................................................................................................................................................................21
Outputs ...................................................................................................................................................................22
References ...................................................................................................................................................................25
City of Austin Urban Design Division
i
Introduction
The Green Infrastructure App allows the user to consider water quality needs when developing a building
prototype in the Envision Tomorrow Plus tool. The resulting benefits, particularly from green infrastructure, are
also measured across a planning area in the Scenario Builder component of the tool. During a storm event
generally the initial runoff from impervious surfaces – parking lots, sidewalks, roofs – is the most polluted. For this
reason, many communities require a minimum volume of water be captured and treated before release into a
stormwater system, creeks, rivers, and the surrounding environment. The Green Infrastructure App calculates the
volume of water typically required to be treated and allows the user to choose either conventional or green
infrastructure water quality controls to meet those treatment needs. The app will also calculate the costs of the
chosen controls and the estimated removal for key pollutants. When green infrastructure controls are chosen, the
annual benefits are quantified in the Scenario Builder according to the Center for Neighborhood Technology guide,
The Value of Green Infrastructure.
Green infrastructure, frequently referred to as Low Impact Development (LID), principally uses plants and soil to
remove pollutants from runoff and has many advantages over conventional “grey” systems. It generally removes
more pollutants than conventional controls and often allows for water infiltration into the soil, more closely
resembling natural patterns. With greater infiltration, the base flows of streams, erosion, and riparian health are
less likely to be negatively impacted by increases in impervious cover associated with development. Green
infrastructure, such as green roofs, biofiltration, and rain gardens, are also generally more aesthetically appealing
than the concrete basins frequently used in conventional controls. Other numerous benefits included decreased
energy costs, improved air quality, reduced heat island effect, reduced carbon dioxide emissions, and potential
open space and habitat. Because the water captured by cisterns is typically used to irrigate landscaped areas or
for other onsite water needs, rainwater harvesting is also considered green infrastructure.
This guide will first provide quick start instructions for using the Green Infrastructure App in the Prototype Builder,
followed by more detailed descriptions of both the Prototype Builder and the Scenario Builder components of the
Green Infrastructure App, including customization for local standards and conditions.
Conventional water quality control
City of Austin Urban Design Division
Green infrastructure: Rain garden
2
Green Infrastructure App Quick Start Guide
1.
Select the appropriate stormwater model.
Select “National – simple method” on the Green
Infrastructure tab of the Prototype Builder unless the
app has been customized to your local conditions.
(Currently customized to Austin, TX.)
2. Click on the appropriate preset button.
3.
•
“No green infrastructure” assumes conventional controls will
be used to treat the minimum volume of stormwater required
to be captured.
•
“Minimum Green Infrastructure” will automatically select
green infrastructure controls depending on the site
configuration in the Prototype Builder in order to satisfy the
minimum water quality capture volumes. If there is enough
landscaping area set aside, rain gardens will be selected,
followed by biofiltration, rainwater harvesting, and finally
green roofs connected to a cistern when there is not enough
landscaping to accommodate other less expensive controls.
Green infrastructure controls will generally provide more
environmental and aesthetic benefits.
•
“Green Infrastructure Medley” will assign a mix of rain gardens,
rainwater harvesting, and green roofs attached to a cistern.
This setting will generally exceed the minimum required
volume of stormwater, with the accompanying environmental
and aesthetic benefits.
•
“No water quality controls & No fee-in-lieu” will ignore any
water quality needs for the building prototype by setting Feein-lieu to “yes” and setting the fee amount to $0.
Customize design parameters of stormwater controls if needed.
If you know the specific design
parameters of the controls you’ve
selected, such as depth and efficiency,
you can customize them in the Physical
Inputs section. There are numerous popup boxes that give more information
about specific defaults. To activate them,
click on the adjoining text box.
City of Austin Urban Design Division
3
Envision Tomorrow + Green Infrastructure Quick Start Guide
4.
Prototype Builder
Input annual rainfall under Pollutant Loads.
In order to get an accurate reflection of the amount of pollutants removed, particularly when aggregating
building prototypes across scenarios in the Scenario Builder, enter the amount of annual rainfall in inches.
5.
Review stormwater dashboard.
At the top of the Green
Infrastructure tab, you can
review the various outputs of
your selections, such as the
square footage of each control
selected and the volume of water
treated by clicking the first
sign.
City of Austin Urban Design Division
4
Green Infrastructure App in the Prototype Builder
The Envision Tomorrow Prototype Builder is essentially a pro forma, allowing the user to “build” a project
quantitatively and investigate the physical and financial aspects of a new building. The user enters physical
characteristics, such as site size, number of stories, parking requirements, use, and setbacks, as well as financial
information, such as acquisition and construction costs and expected revenues from rent or sale. From these
inputs, the Prototype Builder calculates a wide array of values, from building footprint to return on investment.
The Green Infrastructure App uses the impervious cover calculated by the Prototype Builder to determine the
volume of stormwater typically required to be captured for treatment for a given site. It also uses other site
information calculated or input into the Prototype Builder to determine anticipated pollution levels and the
effectiveness of the water quality controls selected to remove those pollutants. The water quality controls
available in the Green Infrastructure App are: green roofs, green roofs with attached cisterns; rainwater
harvesting, biofiltration systems, rain gardens, and a conventional water quality control – a sedimentation-sand
filter. The costs for selected water quality controls are then incorporated into the overall cost of the building as
calculated by the Prototype Builder.
Stormwater Model
To use the app, the user must first select the appropriate stormwater model: a standardized national model that
uses the simple method (also called the 90% rainfall event) or a more localized model.
There are a number of ways to determine the volume of stormwater that should be captured to remove the
majority of pollutants from the “first flush” of a storm event. The green infrastructure app allows the user to
choose from two stormwater models: the simple method (listed as “National – simple method”) or a local
customized version. Both are calculated from the amount of impervious cover as determined by the Prototype
Builder. While there are more sophisticated and precise methods to calculate required water quality volumes, the
simple method has proven to yield reliable ballpark figures and is appropriate for planning purposes. The amount
of runoff can vary depending on local soils and conditions. If there is more localized information available on the
amount of runoff expected as a function of impervious cover, the app can be customized to reflect the local
conditions. Currently the local stormwater model appears as “Local (Austin)” and is calibrated to the City of
Austin’s Environmental Criteria Manual at the time of development of this app in 2013. For information on
customizing the app, please refer to Appendix B.
The sizing used in the simple method is also called the 90%
Rainfall Event method, called such because controls are sized to
capture 90% of average annual stormwater runoff volume. If
the user chooses this stormwater model, the user may adjust the design storm rainfall depth. Generally between 1
and 1.5 inches, it is the depth of stormwater that should be captured to account for 90% of the annual pollutant
load. The default is 1 inch. For a list of values for 90% rainfall events for select US cities, refer to the Center for
Watershed Protection Stormwater Manager’s Center.
City of Austin Urban Design Division
5
Envision Tomorrow+ Green Infrastructure App
Prototype Builder
If the local model is chosen, the user has the opportunity to
select from one of two models, assuming the app has been
correspondingly customized. In the case of Austin, Texas,
water quality requirements are greater over the sensitive
Barton Springs Zone, located above the porous karst Edwards
Aquifer. By selecting “yes” for this cell, the “Water quality capture volume required (gal)” cell is correspondingly
adjusted. For more information on customizing the app to local formulas, please refer to Appendix B.
Using the impervious cover calculated by
the Prototype Builder and the chosen
stormwater model, the app will calculate
the required water quality capture
volume in the dashboard at the top of the
tab.
Stormwater Controls
The app allows the user to select from several green infrastructure controls to treat the required stormwater
capture volumes: green roofs, green roofs connected to rainwater harvesting systems, rainwater harvesting,
biofiltration, and rain gardens. If none are selected by inputting design features, the app assumes treatment will
be handled by a conventional system, typically a sedimentation-sand filter.
Green Roof: Green roofs use vegetation and a growing medium instead of conventional roofing materials. In
http://winterstreetarchitects.files.wordpress.com/2010/08/intensive-greenroof1.jpg
addition to treating stormwater, they offer many benefits,
including reducing building energy requirements, reducing air
pollution, and sequestering and reducing carbon emissions – all
of which are measured approximately in the Scenario Builder.
They also provide an aesthetically appealing amenity and
potential habitat. Green roofs that are not designed to be
occupied are called “extensive” and feature a thinner substrate
and lower construction costs. “Intensive” green roofs involve a
thicker substrate and are designed to accommodate
recreational use by residents, serving as rooftop open space.
Some green roofs are also used for rooftop gardening.
Green Roof Connected to Rainwater Harvesting System: Green roofs can be connected to cisterns to
http://www.klru.org/ctg/blog/?p=2600
City of Austin Urban Design Division
improve water collection efficiencies and provide a water source
for the green roof between storm events. In the case of Austin,
Texas, the region experiences long periods with minimal rainfall
punctuated by large storms, combined with hot summers and a
high rate of evaporation. City best practices recommend a
green roof tied to a cistern that captures a much higher portion
of stormwater (approximately 65%). This stored water is used to
re-irrigate the rooftop, with all captured water ultimately being
processed through the system. Because of this, pollutant
treatment efficiencies of a green roof with cistern are assumed
to be one hundred percent. The app will estimate the area of
green roof needed to drain down the cistern and will flag the
6
Envision Tomorrow+ Green Infrastructure App
Prototype Builder
user if the selected green roof area combined with the landscaping area is not sufficient. To give a sense of the
amount of water collected, the app will also calculate the number of cisterns needed measuring 7 feet in diameter
by 8.5 feet high; however, cisterns can be designed in many shapes and sizes.
Rainwater Harvesting: Rainwater harvesting is collecting rain that falls on rooftops and structures and storing it
in tanks or cisterns for use in landscaping irrigation, horticultural irrigation, or building
greywater. Rainwater harvesting has tremendous potential for reducing the amount of
outdoor water used in landscaping. It also serves the same function of capturing and
treating stormwater flows as other Best Management Practices (BMPs). The defaults
for pollutant removal
efficiency currently in the app
assume that rainwater will be
used for landscaping irrigation
to achieve a 90% removal rate
of key pollutants. The app will
calculate the landscaping area
needed to drain down the
http://www.texashuntfish.com/app/wildl
ife-resources/24585/Texas-Manual-onnecessary volume in the
Rainwater-Harvesting
cisterns within five days, allowing cisterns to capture
runoff during the next storm event, and will flag the user
when there is not sufficient landscaping area. In such
case, the user should consider increasing the landscaping
area or using the water internally in the building. To give
a sense of the volume of water collected, the app will
also calculate the number of cisterns needed measuring
7 feet in diameter and 8.5 feet high. Cisterns can be
City of Austin Environmental Criteria Manual, 1.6.7.D-4
designed in many shapes and sizes.
Biofiltration Systems: Biofiltration systems, also referred to as bioretention, capture and filter stormwater
through vegetation and growing medium and are generally used for
larger sites than rain gardens. The sedimentation chamber and filtration
basin are not unlike conventional systems, but the addition of organic
matter generally leads to more stormwater being treated than in sand
filters, which, without the benefit of plant roots, are prone to clogging.
http://keepaustinbeautiful.org/KABAwards2011
City of Austin, Environmental Criteria Manual, 1.6.7.C-1
City of Austin Urban Design Division
7
Envision Tomorrow+ Green Infrastructure App
Prototype Builder
Rain Gardens: Rain gardens are small bioretention systems designed to catch and hold stormwater that is
filtered by vegetation and a growing medium. Their designs vary, often
resembling a smaller model of a biofiltration system or a short bioswale.
Rain gardens are often preferred for their flexibility and aesthetic potential
in site design. They are also often referred to or categorized as a
bioretention systems in the stormwater literature, but are listed as a
separate control in the Building Prototype.
Rain garden at One Texas Center, Austin, Texas
City of Austin, Environemental Criteria Manual, 1.6.7.H-3
Conventional Facility: The app assumes that if no green infrastructure facilities are selected, the required water
quality volumes will be treated with a conventional facility, such as a
sedimentation-sand filter (assuming fee-in-lieu is not selected).
Sedimentation-sand filters are commonly used in Austin, Texas and generally
employ a sedimentation chamber and a sand filtration basin, which uses a
thick layer of fine-grain sand on top of gravel to filter pollutants out of
stormwater.
http://www.esf.edu/ere/endreny/GICalculator/SandFilterI
ntro.html
An underground filter is used in physically restrained
areas and can include a large storage vault where
stormwater is stored while filtering through the system.
Though it is an effective system, it has lower retention
and pollutant removal capabilities than many green
infrastructure systems and does not offer secondary
benefits or other ecological services.
http://environment.fhwa.dot.gov/ecosystems/ultraurb/3fs8.asp
City of Austin Urban Design Division
8
Envision Tomorrow+ Green Infrastructure App
Prototype Builder
Preset Buttons
To select the methods for handling water quality requirements in the Prototype Builder, the user may choose from
four pre-set buttons on the Green Infrastructure tab.
“No green infrastructure” assumes conventional controls, such
as the sedimentation-sand filter previously described, will be used
to treat the minimum volume of stormwater required to be
captured.
“Minimum Green Infrastructure” will automatically select green
infrastructure controls depending on the site configuration in the
Prototype Builder in order to satisfy the minimum water quality
capture volumes. If there is enough landscaping area set aside, rain
gardens will be selected, followed by biofiltration, rainwater
harvesting, and finally green roofs connected to a cistern when
there is not enough landscaping to accommodate other less
expensive controls. The app will determine the necessary size of
the green infrastructure control based on commonly used default
depths and capture efficiencies.
“Green Infrastructure Medley” will assign a mix of rain gardens, rainwater harvesting, and
green roofs attached to a cistern. Rainwater falling on fifty percent of the building footprint will
be treated by a green roof attached to a cistern with the remaining half captured by other
cisterns. Fifty percent of the landscaping area will accommodate rain gardens. This setting will
generally exceed the minimum required volume of stormwater, with the accompanying
environmental and aesthetic benefits as well as the additional water available for irrigation
between storm events.
“No water quality controls & No fee-in-lieu” will ignore any water quality needs for the
building prototype by setting Fee-in-lieu to “yes” and setting the fee amount to $0. See
Stormwater Costs for more information.
When calculating the square footage of a control and the volume of water treated by the control, the app uses its
capture efficiency, either as defined by the preset button or customized by the user. This information can be
viewed in the dashboard of the Green Infrastructure tab by selecting the first
sign to the left to expand the
Green Infrastructure Outputs section. To the right is a pie chart detailing the percentage of the site occupied by
each type of green infrastructure control.
City of Austin Urban Design Division
9
Envision Tomorrow+ Green Infrastructure App
Prototype Builder
Manual Entry
If preferred, the user may manually
enter design specifications for the
various stormwater controls in the
fields to the left of the preset buttons.
Green roofs and rainwater harvesting
systems are calculated according to the
percentage of building footprint they
cover. The app will flag the user if the
total of both exceeds 100% of the
building footprint. Biofiltration and rain
gardens are limited to a percentage of
the total landscaping entered on the
Physical Inputs tab of the Prototype
Builder. If the total of both exceeds the
allotted landscaped area, the app will
flag the user.
All green infrastructure controls have
inputs for depth and efficiency of water
retention. Please note, the rainwater harvesting depth refers to the depth of the harvesting area and NOT the
cistern depth. For conventional facilities, a depth of four feet is assumed.
Additional inputs include the option to collect rainwater from parking areas and/or structures and to connect
green roofs to a rainwater harvesting system. Green roofs efficiencies generally improve when connected to a
cistern. City of Austin best practices recommend a green roof tied to a cistern, which can capture a much higher
portion of stormwater -- approximately 65% total compared to just 20% with the green roof alone.
Since cisterns generally must be emptied or sufficiently depleted in between storm events in order to be available
for the next storm event, the water collected typically irrigates landscaped areas or is used internally in the
building as greywater. The app will estimate the square footage of a landscaped area needed in order for the
cisterns to drain down within 120 hours after a storm event, assuming no water is released from the cistern for the
first 12 hours after a storm event. (This calculation assumes a soil hydraulic connectivity of 0.005 feet per hour.
This value may differ for different soil types and is intended only as a general indicator.) If the areas are not
sufficiently large for the volume of water collected to drain down within 120 hours, the app will flag the user.
Please note that if more than the required minimum volume of water is being collected, the drain down
requirement may not apply and water may potentially be stored for longer term irrigation of landscaped areas.
Please refer to local standards for more information on drain down times and requirements.
Finally the user may also indicate the capture efficiency of a conventional facility and if the facility is underground.
This will impact the cost of the facility and the overall project cost since underground facilities are more expensive
than surface controls.
Please note, if no green infrastructure controls are selected by inputting a corresponding percentage of building
footprint and/or landscaped area, the app will automatically assume that a conventional control will meet
necessary water quality volumes and will size it appropriately according to that volume. Likewise, if the size of
green infrastructure controls is not sufficient to meet required water volumes, the remaining volumes will be
assumed to be handled by an appropriately sized conventional control. The app will flag the user when a
City of Austin Urban Design Division
10
Envision Tomorrow+ Green Infrastructure App
Prototype Builder
conventional control is used. To view the volume of water handled by each selected control, refer to the
dashboard at the top of the tab under Green Infrastructure Outputs. Click on the first expansion button,
the left, if needed, to view these cells.
, on
Stormwater and Green Infrastructure Costs
The utility also calculates the cost of each system based on a price per gallon function and incorporates the cost
into the overall project costs calculated by the Prototype Builder. These prices were determined through a
literature review, links to which are listed at the bottom of this section. For more information on particular costs,
click on the accompanying text cell to view a pop-up box.
Default green infrastructure costs are based on the study “The Costs of LID: Low-impact development BMP
installation and operation and maintenance costs in Orange County, CA,” which lists costs at 2011 values. Please
note that the current default for green roofs is for an extensive roof, i.e., non-occupiable. Intensive green roofs,
occupiable roofs, will vary from $46 to $64 per gallon treated, according to the same study.
Default costs for convention controls, sedimentation-sand filters, are based on the study, “The Costs of Urban
Stormwater Control Practices” and have been adjusted to 2011 values. Default cost for underground controls,
sedimentation-sand filters, where more difficult to determine and are based on interpolating costs, adjusted to
2011 values, provided in both “The Costs of Urban Stormwater Control Practices” and “Sand and Organic Filters.”
In all cases if local construction costs for stormwater controls are available, they should be normalized to cost per
gallon and entered in this section of the app.
The app also offers the option to include additional fees under “Mitigation fee/Fee-in-lieu.” If water quality
controls are used and a mitigation fee is required, select “no” and enter the fee to the right. If fee-in-lieu is used,
with no water quality controls to be constructed for the project, select “yes” and input the amount in the adjacent
cell. If there is no consideration for water quality controls, as is sometimes the case in infill situations, then select
yes and enter $0. (The same inputs may be set automatically by selecting the fourth preset button, “No water
quality controls & No fee-in-lieu.”)
City of Austin Urban Design Division
11
Envision Tomorrow+ Green Infrastructure App
Prototype Builder
Pollutant Removal
Stormwater controls remove a wide array of pollutants, and pollutant levels vary according to land use: a singlefamily home will have different pollutant levels from an industrial site. Within a site, pollutant levels will also vary,
with parking areas differing from landscaped and building roof areas. The Green Infrastructure App estimates the
amount of pollution expected, given the land uses selected by the user on the Physical Inputs tab and the amount
of land dedicated to building, parking, and landscaping as calculated by the Prototype Builder. Based on the
efficiencies of each type of stormwater control selected, the app will then estimate the percentage reduction of
four key pollutants.
Key Pollutants: The app focuses on four key pollutants that indicate four different types of substances that can
impact ecological and human health.
Total Suspended Solids (TSS), measured in pounds, are an indicator of the turbidity of the water and
the potential sedimentation of waterways. Many other pollutants are frequently attached to TSS and
removing TSS will frequently remove other pollutants.
Total Nitrogen (TN), measured in pounds, indicates the level of excessive nutrients associated with
algae blooms and other ecological problems. Total phosphorous is also a common nutrient found in
excess but not measured by the app.
Total Lead (TL), measured in pounds, is an indicator of contaminants found in stormwater that are
harmful to human and animal health. Levels of copper and zinc in stormwater are also frequently
measured but not considered by the app.
Fecal Coliform, measured in billions of colonies, is also approximated by the app and is among several
bacteria linked to disease. Fecal streptococci is another bacteria sometimes measured to gauge
stormwater quality but not considered by the app.
Inputs
The only inputs required for this section are annual rainfall and, in the case of the national model, the percentage
of annual rainfall producing runoff – the default is ninety percent. Because the amount of pollutants removed is
reported as a percentage in the summary in the Prototype Builder, the amount of annual rainfall may not appear
to have an impact in the summary; however, it will impact the total annual pounds reported as building types are
aggregated across scenarios in the Scenario Builder.
City of Austin Urban Design Division
12
Envision Tomorrow+ Green Infrastructure App
Prototype Builder
Load Calculations
The app uses the Simple Method to calculate
the pollutant loads. While there are more
complex models, this method has been shown
to produce reasonable results. This method
considers the annual rainfall, the runoff
coefficient, the pollutant concentration, and the
area in acres. The runoff coefficient, which is
based on the amount of impervious cover, was
previously calculated to estimate required
volumes – whether for the National stormwater
model or the locally calibrated model. Varying
levels of pollutant concentrations are
associated with different types of land uses.
Based on the land use types selected on the
Physical Inputs tab of the Prototype Builder and
the stormwater model selected, the app will
look up pollutant concentration levels for building types and associated landscaping and parking. Using the square
footages calculated across the site in the Physical Outputs tab, the app will calculate pollution loads across the site.
The pollutant concentration lookup tables list national levels found in various studies as noted in the New York
State Stormwater Management Design Manual. Local pollutant levels are currently calibrated to those found in
the City of Austin Environmental Criteria Manual. These values may be updated to reflect other local criteria.
Please note, since residential pollutant loads are typically based on the single-family building type, the app will
only categorize single-family and townhouse selections on the Physical Inputs tab as “Residential.” Unless
Industrial is indicated, all other land use types will be categorized as “Commercial” for the purposes of pollutant
estimation by the app.
To view these calculations and the lookup tables, click on the expansion button,
City of Austin Urban Design Division
, below the pollutant summary.
13
Envision Tomorrow+ Green Infrastructure App
Prototype Builder
Once the pollutant loads are estimated, the app will estimate the amount of pollutants removed by the various
stormwater controls selected using treatment efficiencies listed in the following table and based on a literature
review specified in the app
reference section. For more
information on specific
efficiencies, click on the cell
to activate the associated
hyperlink or hover over the associated text to view the cell comment boxes. These efficiencies can be updated to
reflect local practices. Please note that green roof efficiencies are currently set to City of Austin best practices,
which require that green roofs be attached to a rainwater harvesting system, for which 100% pollutant efficiency is
assumed.
Building pollutant loads are assumed to be completely treated by green roofs and water harvesting when those
controls are selected. If rainwater harvesting for a parking area is selected in the app physical inputs section, the
app will assume all parking pollutant loads will be treated by rainwater harvesting. Otherwise, if more than one
control type is used, building, parking, and landscaping loads are assumed to be treated by biofiltration, rain
gardens, and conventional controls according to the percentage of water captured by each control. (See the
“Treatment Allocations for Landscape Devices” section in the app.) These removal loads can be viewed in the
calculation tables.
City of Austin Urban Design Division
14
Envision Tomorrow+ Green Infrastructure App
Prototype Builder
Appendix A: Green Infrastructure App Prototype Builder Formulas
The following formulas guide the operation of the water volume and sizing functions of the app. Variables listed in
red text are inputs by the user. Those in bold refer to other formulas defined in this document. Italics indicate unit
of measurement.
Impervious Cover % = (Physical Outputs! BuildingFootprint sf + Physical Outputs! Parking sf) / Physical Inputs!
SiteArea sf
Water quality capture volumes can be calculated using numerous techniques. The simple method used to
estimate required volumes (also called the 90% rainfall event method) is based primarily on impervious cover.
More sophisticated methods consider the intensity of rainfall, soil conditions, and other factors. If local
stormwater capture requirements are based on impervious cover and runoff coefficients, they can be used to
customize the local formulas in the Green Infrastructure app. See Appendix B for more details.
Water quality capture depth (National – simple method) in = Runoff Coefficient * Design storm rainfall depth in
Design storm rainfall depth default = 1 in (For values for select US cities, see the EPA Stormwater
Manager’s Center)
Water quality capture depth (Local – Austin) in = 0.5 * Impervious Cover – 0.2
Water quality capture depth (Local – Austin, Barton Springs Zone) in = 1.8 * Impervious Cover + 0.6
Water quality capture volume required gal = Water quality capture depth in / 12 in/ft * Physical Inputs! SiteArea
sf * 7.48 gal/cu ft
Runoff coefficient formulas typically are curve fits of runoff coefficients plotted against impervious cover for a
particular area. Curves will vary according to the soils and conditions receiving runoff. Currently the app is locally
calibrated to Austin values but can be customized to reflect other local conditions.
Runoff Coefficient (National – simple method) = 0.05 + 0.9 * Impervious Cover [NOTE: Minimum = 0.2]
2
Runoff Coefficient (Local – Austin) = 0.5463 * Impervious Cover + 0.328 * Impervious Cover + 0.0296
2
Runoff Coefficient (Local – Austin, Barton Springs Zone) = 0.6072 * Impervious Cover + 0.2899 * Impervious
Cover + 0.0075
Green roof Gallons Captured = Green roof % of building footprint * Physical Outputs! BuildingFootprint sf * Green
roof media depth ft * Green roof capture efficiency % * 7.48 gal/cu ft
Green roof water harvesting Gallons Captured = Green roof % of building footprint * Physical Outputs!
BuildingFootprint sf * Green roof harvesting depth ft * Green
roof harvesting efficiency % * 7.48 gal/cu ft
Rainwater harvesting Gallons Captured = (Rainwater harvesting % of building footprint * Physical Outputs!
BuildingFootprint sf + Physical Outputs! Parking sf [if selected]) *
Rainwater harvesting depth ft * Rainwater harvesting efficiency % *
7.48 gal/cu ft
Biofiltration Gallons Captured = Biofiltration % of landscaping area* Physical Outputs! Landscaping sf *
Biofiltration media depth ft * Biofiltration capture efficiency % * 7.48 gal/cu ft
Rain gardens Gallons Captured = Rain garden % of landscaping area* Physical Outputs! Landscaping sf * Rain
garden depth ft * Rain garden capture efficiency % * 7.48 gal/cu ft
Conventional water quality facility Square Feet = Remaining required water quality volume gal / 7.48 gal/cu ft / 4
ft depth / Conventional facility capture efficiency %
City of Austin Urban Design Division
15
Envision Tomorrow+ Green Infrastructure App
Prototype Builder
Irrigation areas needed for harvested water depend on required drain down times for cisterns in order to make
them available for the next storm event. The app assumes that the required drain down time is 120 hours and that
draining of cisterns begins 12 hours after the storm event. Soil conductivity will vary for different soils but is
assumed to be 0.005 feet per hour in the app. Drain down times and soil conductivity can be adjusted in the cell
formula to reflect local conditions. If a storage cistern is provided or water is harvested beyond the required
minimum, required drain down times may not apply. Check local standards for more information.
Green roof area needed for harvested water sf = Green roof water harvesting Gallons Captured / 7.48 gal/cu ft /
(o.oo5 ft/hr soil conductivity * (120 hours drain down time – 12
hours lag time))
Landscaping area needed for harvested water sf = Rainwater harvesting Gallons Captured / 7.48 gal/cu ft /
(o.oo5 ft/hr soil conductivity * (120 hours drain down time – 12
hours lag time))
Pollutant loads are calculated according to land uses selected on the Physical Inputs tab and square footage
calculations found on the Physical Outputs tab for building footprint, landscaping, and parking areas. Pollutant
concentration levels on the lookup tables are derived from national or local studies. Local values are currently
calibrated for Austin, Texas, but can be adjusted to reflect other local studies.
Annual Runoff (National – simple method) in = Annual Rainfall in * % of annual rainfall producing runoff (90%
default) * Runoff Coefficient
Annual Runoff (Local – Austin) in = Annual Rainfall in * Runoff Coefficient
Annual load (TSS, TN, and TL) lbs = 0.226 * Annual Runoff in * Pollutant Concentration according to lookup table
mg/l * Applicable Area sf / 43,560 sf/acre
Annual load (F Coli) billions of colonies = 103 * Annual Runoff in * Pollutant Concentration according to lookup
table mg/l * Applicable Area sf / 43,560 sf/acre
Pollutant removal calculations refer to control treatment efficiencies found in the Treatment Efficiencies lookup
table. The default values are based on a literature search, with specific sources listed for each efficiency, but these
values can be adjusted to reflect local practices.
Pollutants removed annually (TSS, TN, and TL) lbs = 0.226 * Annual Runoff in * Pollutant Concentration according
to lookup table mg/l * Applicable Area sf / 43,560 sf/acre *
Captured Volume Assumed Treated * Control Treatment
Efficiency as listed in lookup table
Pollutants removed annually (F Coli) billions of colonies = 103 * Annual Runoff in * Pollutant Concentration
according to lookup table mg/l * Applicable Area sf /
43,560 sf/acre * Captured Volume Assumed Treated *
Control Treatment Efficiency as listed in lookup table
Captured Volume Assumed Treated default = 92% (NOTE: The app sizes controls by taking into
consideration their water capture efficiency and presumes formulas used for calculating required water
quality volumes capture annual runoff.)
City of Austin Urban Design Division
16
Envision Tomorrow+ Green Infrastructure App
Prototype Builder
Appendix B: Prototype Builder Local Customization
Changing the Local Stormwater Model
If local water quality required volumes are based on impervious cover and runoff coefficients, the Green
Infrastructure app can be customized to reflect local standards for water quality capture. Initially calibrated for
Austin, Texas, the app references two sets of requirements that can also be adapted to reflect other two-tiered
standards. Because of the sensitive karst aquifer in the area, the Edwards Aquifer, the city has more stringent
requirements for areas in the Barton Springs Zone, which are hydrologically connected to the aquifer.
1.
Change the local reference. Go to cell A199. (These rows may need to
be unhidden.) Changing the cell contents from “Local (Austin)” to your
local reference will reflect throughout the app.
2.
Update the local special zone by going to
cell A30 and modifying the text. (If you do
not have a two-tiered system, conditional formatting is suggested to hide these cells.)
3.
Update the water quality depth cells to
reflect local requirements. Go to cell
C3 and change the formula to reflect local standards.
If using two tiers, input your special district by adjusting the coefficients and operators highlighted below:
=IF(B29=A200,GI_Runoff_Coefficient*GI_rainfall_depth,IF(GI_Recharge_Zone="yes",(1.8*GI_Impervious_
Cover+0.6),(0.5+GI_Impervious_Cover-0.2)))
Input the rest of the standards as highlighted below (Note: If not using a second tier, enter the same
coefficients and operators in the section highlighted above.):
=IF(B29=A200,GI_Runoff_Coefficient*GI_rainfall_depth,IF(GI_Recharge_Zone="yes",(1.8*GI_Impervious_
Cover+0.6),(0.5+GI_Impervious_Cover-0.2)))
4.
Update the runoff coefficient cells to
reflect impervious cover-runoff
coefficient curves. You may need to do a curve fit to create the formula.
If using two tiers, input your special district by adjusting the coefficients and operators highlighted below:
=IF(B29=A200,IF((0.05+0.9*GI_Impervious_Cover)<0.2,0.2,(0.05+0.9*GI_Impervious_Cover)),IF((GI_Recha
rge_Zone="yes"),(0.6072*GI_Impervious_Cover^2+0.2899*GI_Impervious_Cover+0.0075),(0.5463*GI_Im
pervious_Cover^2+0.328*GI_Impervious_Cover+0.0296)))
Input the rest of standards as highlighted below (Note: If not using a second tier, enter the same coefficients
and operators in the section highlighted above.):
=IF(B29=A200,IF((0.05+0.9*GI_Impervious_Cover)<0.2,0.2,(0.05+0.9*GI_Impervious_Cover)),IF((GI_Recha
rge_Zone="yes"),(0.6072*GI_Impervious_Cover^2+0.2899*GI_Impervious_Cover+0.0075),(0.5463*GI_Im
pervious_Cover^2+0.328*GI_Impervious_Cover+0.0296)))
City of Austin Urban Design Division
17
Envision Tomorrow+ Green Infrastructure App
Prototype Builder
Changing the Local Pollution Concentrations & Removal Efficiencies
To adjust pollutant load concentrations for your area, change values in the Lookup Tables (rows 113-136) under
columns associated with “Local” numbers.
The default values for the effectiveness of various control types in removing pollutants are based on a survey of
academic and professional literature as well as City of Austin standards. Some treatment efficiencies vary widely
according to the type of growing media used and the design of the control, particularly for green roofs. Because of
the wide variation, the default efficiencies for green roofs and green roofs connected to cisterns are set to City of
Austin suggested practices in which green roofs are connected to cisterns and collected water is then circulated
back onto the green roof, resulting in a removal efficiency of 100%.
For more information on specific efficiencies, click on the appropriate cell in the Treatment Efficiencies table to
activate the hyperlinks to the source material or hover over the associated text to view comment boxes. If more
locally appropriate values are available, they may be input into the Treatment Efficiencies table.
Changing the Stormwater Control Costs
The default stormwater control costs are based
on a literature review. See the hyperlinks
below the cost section and the accompanying
text boxes for more information. More locally
appropriate values may be input into the
“Stormwater & Green Infrastructure Cost per
Gallon” table, rows 59-67.
City of Austin Urban Design Division
18
Green Infrastructure App in the Scenario Builder
Overview
The Green Infrastructure App uses the information calculated in the Prototype Builder to measure the effects of
water quality controls across scenarios. In particular, the benefits of green infrastructure controls selected in
building prototypes are quantified using the methodology recommended by the Center for Neighborhood
Technology (CNT) in its publication, The Value of Green Infrastructure. Additionally, the app also creates a
stormwater facility profile for each scenario modeled, indicating how stormwater from a water quality perspective
is handled across the scenario planning area. It will also aggregate the removal of four key water pollutants by
stormwater controls across the scenarios.
The CNT guide outlines eight areas in which green infrastructure can provide benefits: reduced runoff, reduced
energy use, reduced air pollutants, reduced atmospheric CO2, reduced urban heat island effect, community
livability, habitat improvement, and public education. Not all of these areas are easily quantifiable, in some cases
due to, as yet, an insufficient body of research literature.
Of the areas identified in the CNT guide, the Green Infrastructure App quantities five areas in the Scenario Builder
according to CNT formulas: reduced stormwater runoff, reduced energy use, reduced air pollutants, reduced
atmospheric CO2, and potential habitat acreage. The values produced are intended as rough estimates and can be
informative through the comparative nature of the Scenario Builder. For the purposes of the CNT measures, rain
gardens and biofiltration controls used in the Prototype Builder are aggregated into one biofiltration category in
the Scenario Builder.
Annual reduced runoff is calculated by multiplying annual rainfall, the area of the green infrastructure
control (the drainage area in the case of the water harvesting), and its retention efficiency. It applies to
all control types.
Reduced runoff can translate into reduced incidents of combined sewer/stormwater overflows and lower
associated treatment costs, fewer pollutants entering waterways, and improved soil infiltration which can
improve base stream flows, improve riparian health, reduce erosion, and improve groundwater recharge.
Note: The CNT guide recommends monetizing this value by using the avoided stormwater treatment
costs; however, in areas where a combined stormwater-sewer systems is not used, this cost does not
apply. Identifying the cost of avoided public stormwater infrastructure may be an area for future
exploration.
Annual energy savings is calculated by multiplying the reduction in energy use due to the insulating
effect of green roofs with the cost for energy. The insulating effect of green roofs is determined from the
annual number of cooling/heating degree days and the difference in the heat transfer coefficient between
a conventional roof and a green roof.
The insulating effect of green roofs can reduce both heating and cooling costs as well as reduce the heat
island effect found in urban areas by lowering the ambient temperature beyond the green roof environs.
A reduction in the heat island effect also reduces the likelihood of ozone formation, directly impacting air
quality. This effect, however, is not measured by the app.
City of Austin Urban Design Division
19
Envision Tomorrow+ Green Infrastructure App
Scenario Builder
Annual air pollutant reductions is calculated by adding the amount of criteria air pollutants
absorbed by vegetative matter in each control with the amount air pollutant emissions avoided because
of energy savings and associated decrease in power generation. The Criteria pollutants addressed are
nitrogen dioxide (NO2), ozone (O3), sulfur dioxide (SO2), and particulate matter (PM-10).
Annual CO2 reductions is calculated by adding the amount of carbon sequestered by vegetative
matter in each control with the amount of avoided CO2 emissions due to energy savings and the
associated decrease in power generation.
Reductions in CO2 reductions translate to reduced impacts to global climate change.
Potential Open Space and Habitat is calculated by delineating the acreage of biofiltration and green
roofs.
Open space can be defined in many ways and not all green infrastructure controls will meet open space
requirements defined in local standards. For example, an extensive green roof is not intended to be
occupied. Habitat for local fauna can be enhanced when green infrastructure controls are planted with
native species.
Of the types of green infrastructure considered in the app, green roofs will contribute to all five indicators because
of their insulating effect and the resulting reductions in energy use and associated pollutants. They are also
generally the most expensive type of green infrastructure but may provide a reasonable choice, particularly in
confined areas, given the many ecological and social benefits they can provide.
The Green Infrastructure app will also aggregate selections made in the Prototype Builder across the selected
planning area in the Scenario Builder. The Stormwater Facility Profile identifies the method used for meeting
water quality needs – whether by green infrastructure, conventional controls, or through fee-in-lieu – and if excess
capacity may be available to address unmet needs. Sites with additional capacity and those with unmet needs
would need to be hydrologically connected. The profile is intended to give an initial snapshot of potential districtwide water quality controls. (To review the calculations for water quality volumes, please refer to app description
in the Prototype Builder portion of this document.)
The app also summarizes the percentage removal of four key pollutants across a scenario. (Please refer to the
Pollutant Removal section in the Prototype Builder section of this document for more information on calculation of
these values.) Each key pollutant indicates a type of pollutant: total suspended solids (TSS) indicates turbidity;
total nitrogen (TN) indicates nutrient loading associated with algae blooms and other ecological problems; total
lead (TL) refers to contaminants general harmful to human and animal health; and fecal coliform indicates bacteria
associated with disease. The overall performance for these four water quality indicators can be compared across
scenarios.
City of Austin Urban Design Division
20
Envision Tomorrow+ Green Infrastructure App
Scenario Builder
Inputs
All of the inputs for the Green Infrastructure indicators can be found on the Project Info tab. Many of the defaults
are found in the Center for Neighborhood Technology guide, The Value of Green Infrastructure. In some cases, a
national reference value is listed with a corresponding hyperlink available for look up of more regional applicable
values.
City of Austin Urban Design Division
21
Envision Tomorrow+ Green Infrastructure App
Scenario Builder
Outputs
All outputs of the Green Infrastructure App in
the Scenario Builder can be found on the
Summary New tab. The annual indicators
calculate totals and per-acre values across
scenarios according to the formulas found in the
CNT The Value of Green Infrastructure guide.
Five charts graph several of these values across
scenarios:
•
Runoff reduction (gal/yr)
•
Energy savings (kW/yr)
most associated with green roofs
•
Air pollutant reductions (lbs/yr)
most associated with green roofs
•
CO2 reductions (lbs/yr)
most associated with green roofs
•
Potential open space & habitat (acres)
from green roofs and biofiltration,
including rain gardens
The app also summarizes several values from the
Prototype Builder that are aggregated across
scenarios. The Stormwater Facility Profile
characterizes the method used to accommodate
required water quality volumes through
conventional facilities and green infrastructure
as well as required volumes that are not
captured. The chart also graphs additional
capture beyond required volumes, depicting
possible opportunities to use additional capacity
to meet water quality needs by hydrologically
connecting sites or using district-wide controls
within the same scenario planning area.
The app also compares the percentage reduction
of four key pollutants that act as indicators for:
•
Turbidity – total suspended solids (TSS)
Affects water clarity and sedimentation
•
Nutrient loading – total nitrogen (TN)
Linked to algae blooms and other
ecological problems
•
Contaminants – total lead (TL)
Harmful to human and health
•
Bacteria – fecal coliform (f. coli)
Linked to disease
Please see the section on key pollutants in this document for more information.
City of Austin Urban Design Division
22
Envision Tomorrow+ Green Infrastructure App
Scenario Builder
Additional charts can be created from the calculated values found in the following “Summary New” tables.
CNT Annual Indicators of Green Infrastructure Benefits:
Required and Captured Water Quality Volumes:
Water Quality:
To view CNT annual indicators by an individual scenario as it is painted, see
the corresponding scenario tab.
City of Austin Urban Design Division
23
Envision Tomorrow+ Green Infrastructure App
Scenario Builder
Many thanks to Donald Jackson for researching and assisting with this
project. Thanks also for assistance from the City of Austin Watershed
Protection Department, in particular, from Matt Hollon.
For questions and suggestions regarding the Green Infrastructure App
or this document, please contact:
Sylvia Leon Guerrero
Senior Planner
URBAN DESIGN
City of Austin | Planning and Development Review Department
th
505 Barton Springs Road | 8 floor | Austin TX | 78704
Email | [email protected]
City of Austin Urban Design Division
24
Envision Tomorrow+ Green Infrastructure App
Scenario Builder
References
Alsup et al. April 2013. Green roof systems as sources or sinks influending heavy metal concentrations in runoff. Journal of
environmental Engineering, http://ascelibrary.org/doi/abs/10.1061/(ASCE)EE.1943-7870.0000601
Berndtsson, Justyna Czemiel. April 2010. Green roof performance towards management of runoff water quantity and quality: A
review. Ecological Engineering. http://www.sciencedirect.com/science/article/pii/S0925857410000029
Center for Neighborhood Technology. 2010. The Value of Green Infrastructure. http://www.cnt.org/repository/gi-valuesguide.pdf
City of Austin, Environmental Criteria Manual, Section 1.6. ,
http://austintech.amlegal.com/nxt/gateway.dll/Texas/environ/section1waterqualitymanagement?f=templates$fn=default.htm$3.0$vid=amlegal:austin_environment$anc=JD_1.6.9.3
Clary, Jane et al., May/June 2008. Can Stormwater BMPs remove bacteria? New finding f from the international stormwater
BMPS database. Stormwater Magazine.
http://www.udfcd.org/downloads/pdf/tech_papers/Can%20Stormwater%20BMPs%20Remove%20Bacteria.pdf
Dietz, Michael. 2007. Low Impact Development Practices: A Review of Current
Research and Recommendations for Future Directions. Springer Science + Business Media B.V.
http://link.springer.com/article/10.1007/s11270-007-9484-z
Gregoire, Bruce and Clausen, John. 2011. Effect of a modular extensive green roof on stormwater runoff and water quality.
Ecological Engineering 37. http://clear.uconn.edu/projects/tmdl/library/papers/Gregoire-Clausen_2011.pdf
Grey, Mark et al. Feb 13, 2013. The Costs of LID: Low-impact-development BMP installation and operation and maintenance
costs in Orange County, CA. Stormwater. http://www.stormh2o.com/SW/Articles/20426.aspx?page=1
Guildford County, North Carolina. Guildford County Innovative Stormwater Device Fact Sheet: Green Roof.
http://www.co.guilford.nc.us/watershed_cms/bulletins/Green%20Roof%20Factsheet.pdf
Hardin and Wanielista. 2007. Designing cisterns for green roof in Florida. University of Central Florida Stormwater
Management Academy. http://www.stormwater.ucf.edu/conferences/9thstormwaterCD/documents/DesigningCisterns.pdf
International Stormwater BMP Database. December 2010. Pollutant Category Summary: Fecal Indicator Bacteria.
http://www.bmpdatabase.org/Docs/BMP%20Database%20Bacteria%20Paper%20Dec%202010.pdf
Li, Ming-Han et al. July 2010. Bioretention for stormwater quality improvement in Texas: pilot experiments. Texas
Transportation Institute. http://d2dtl5nnlpfr0r.cloudfront.net/tti.tamu.edu/documents/0-5949-2.pdf
Minnesota Pollution Control Agency. 8 November 2013. Minnesota Stormwater Manual: Requirements, recommendation and
information using green roofs as a BMP in the MIDS calculator.
http://stormwater.pca.state.mn.us/index.php/Requirements,_recommendations_and_information_for_using_green_roofs_as_
a_BMP_in_the_MIDS_calculator
Narayana, Arvind and Pitt, Robert. June 18, 2006. Costs of Urban Stormwater Control Practices.
http://www.water.ca.gov/irwm/grants/docs/Archives/Prop84/Submitted_Applications/P84_Round1_Implementation/San%20
Diego%20County%20Water%20Authority/Bannock%20Ave_Tecolote%20Watershed%20Protection/Arvind_and_Pitt_stormwat
er_cost_report.pdf
New York State Department of Environmental Conservation. New York State Stormwater Management Design Manual:
Appendix A—The Simple Method to Calculate Urban Stormwater Loads. http://www.dec.ny.gov/docs/water_pdf/simple.pdf
New York State Department of Environmental Conservation. New York State Stormwater Management Design Manual:
Chapter 4 -- Unified Stormwater Sizing Criteria. http://www.dec.ny.gov/docs/water_pdf/chapter4p18.pdf
Prince George's County, Maryland, Environmental Services Division, Department of Environmental Resources. December 2007.
Bioretention Manual. http://www.aacounty.org/DPW/Highways/Resources/Raingarden/RG_Bioretention_PG%20CO.pdf
City of Austin Urban Design Division
25
Envision Tomorrow+ Green Infrastructure App
Scenario Builder
Randolph, John. 2004. Environmental Land Use Planning and Management. Island Press.
Rowe, Bradley. 2010. Green roofs as a means of pollution abatement. Environmental Pollution, Volume 159, Issue 8-9.
http://www.sciencedirect.com/science/article/pii/S0269749110004859
Rusciano and Opropta. 2007. Bioretention column study: fecal coliform and total suspended solids reductions. American
Society of Agricultural and Biological Engineers. http://www.prairieswine.com/pdf/3049.pdf
Stormwater Manager’s Resource Center. The simple method to calculate urban stormwater loads. Center for Watershed
Protection. http://www.stormwatercenter.net/monitoring%20and%20assessment/simple%20meth/simple.htm
Stormwater Manager’s Resource Center. Water quality sizing. Center for Watershed Protection.
http://www.stormwatercenter.net/Manual_Builder/Sizing_Criteria/Water%20quality/Options%20for%20Water%20Quality%20
Volumes.htm
University of Florida, IFAS Extension. 2008. Florida field guide to low impact development: Biorentention Basins/ Rain Gardens.
http://buildgreen.ufl.edu/Fact_sheet_Bioretention_Basins_Rain_Gardens.pdf
US Environmental Protection Agency. Clean Energy: eGRIDweb. http://cfpub.epa.gov/egridweb/
US Environmental Protection Agency. September 1999. Storm water technology fact sheet: sand filters.
http://water.epa.gov/scitech/wastetech/upload/2002_06_28_mtb_sandfltr.pdf
US Environmental Protection Agency. September 1999. Storm water technology fact sheet: bioretention.
http://water.epa.gov/scitech/wastetech/upload/2002_06_28_mtb_biortn.pdf
US Environmental Protection Agency, National Pollutant Discharge Elimination System. July 2012. Sand and Organic Filters.
http://cfpub.epa.gov/npdes/stormwater/menuofbmps/index.cfm?action=browse&Rbutton=detail&bmp=73
US Environmental Protection Agency. 2012. Stormwater Management. http://www.epa.gov/oaintrnt/stormwater/index.htm
US Federal Highway Administration. Stormwater best management practices in an ultra-urban setting: selection and
monitoring fact sheet – surface sand filters. http://environment.fhwa.dot.gov/ecosystems/ultraurb/3fs8.asp
US National Climatic Data Center: Heating & cooling degree day data. National Oceanic and Atmospheric Administration.
http://www.ncdc.noaa.gov/oa/documentlibrary/hcs/hcs.html
US Energy Information Administration. April 2010. Annual Energy Outlook 2010 with projections to 2035.
http://www.eia.gov/oiaf/aeo/pdf/0383(2010).pdf
City of Austin Urban Design Division
26