1
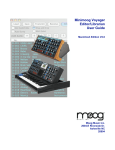
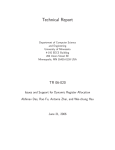
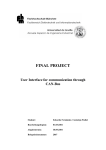
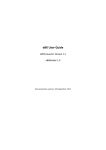
Using Valgrind to detect undefined value errors with bit-precision
Julian Seward
OpenWorks LLP
Cambridge, UK
Nicholas Nethercote
Department of Computer Sciences
University of Texas at Austin
[email protected]
[email protected]
Abstract
We present Memcheck, a tool that has been implemented
with the dynamic binary instrumentation framework Valgrind. Memcheck detects a wide range of memory errors
in programs as they run. This paper focuses on one kind
of error that Memcheck detects: undefined value errors.
Such errors are common, and often cause bugs that are
hard to find in programs written in languages such as C,
C++ and Fortran. Memcheck’s definedness checking improves on that of previous tools by being accurate to the
level of individual bits. This accuracy gives Memcheck
a low false positive and false negative rate.
The definedness checking involves shadowing every
bit of data in registers and memory with a second bit
that indicates if the bit has a defined value. Every valuecreating operation is instrumented with a shadow operation that propagates shadow bits appropriately. Memcheck uses these shadow bits to detect uses of undefined
values that could adversely affect a program’s behaviour.
Under Memcheck, programs typically run 20–30
times slower than normal. This is fast enough to use with
large programs. Memcheck finds many errors in real programs, and has been used during the past two years by
thousands of programmers on a wide range of systems,
including OpenOffice, Mozilla, Opera, KDE, GNOME,
MySQL, Perl, Samba, The GIMP, and Unreal Tournament.
1 Introduction
The accidental use of undefined values is a notorious
source of bugs in programs written in imperative languages such as C, C++ and Fortran. Such undefined
value errors are easy to make, but can be extremely difficult to track down manually, sometimes lurking unfound
for years.
In this paper we describe Memcheck, a practical tool
which detects a wide range of memory errors, including
undefined value errors. Memcheck is implemented using
the dynamic binary instrumentation framework Valgrind
[10, 9].
1.1 Basic operation and features
Memcheck is a dynamic analysis tool, and so checks programs for errors as they run. Memcheck performs four
kinds of memory error checking.
First, it tracks the addressability of every byte of memory, updating the information as memory is allocated and
freed. With this information, it can detect all accesses to
unaddressable memory.
Second, it tracks all heap blocks allocated with
malloc(), new and new[]. With this information it
can detect bad or repeated frees of heap blocks, and can
detect memory leaks at program termination.
Third, it checks that memory blocks supplied as arguments to functions like strcpy() and memcpy() do
not overlap. This does not require any additional state to
be tracked.
Fourth, it performs definedness checking: it tracks the
definedness of every bit of data in registers and memory.
With this information it can detect undefined value errors
with bit-precision.
All four kinds of checking are useful. However, of
the four, definedness checking is easily the most sophisticated, and it is this checking that this paper focuses on.
Memcheck uses dynamic binary instrumentation to instrument the program to be checked (the client) on-thefly at run-time. Execution of the added instrumentation
code is interleaved with the program’s normal execution,
not disturbing normal program behaviour (other than
slowing it down), but doing extra work “on the side” to
detect memory errors. Because it instruments and analyses executable machine code, rather than source code or
object code, it has the following nice properties.
• Wide applicability: it works with programs written
in any language.1
• Total coverage: all parts of the client are executed
under Memcheck’s control, including dynamically
linked libraries and the dynamic linker, even if the
int main(void) {
int x, y, z, *p;
char buf[10];
write(1, buf, 1);
x = ( x == 0 ? y : z );
return *p + x;
}
// bug 1
// bug 2
// bug 3
Figure 1: Example program badprog.c
source code is not available on the system. Indeed, it is only by doing this that Memcheck can
be accurate—partial coverage leads either to lots of
missed errors (false negatives) or lots of invalid errors (false positives).
• Ease of use: unlike many similar tools, it does not
require programs to be prepared (e.g. recompiled or
relinked) in any way.
Memcheck is part of the Valgrind suite, which is free
(GPL) software, and is available for download from the
Valgrind website [14]. It currently runs only on the
x86/Linux platform, although work is currently underway to port it to other platforms such as AMD64/Linux,
PowerPC/Linux, x86/FreeBSD, and PowerPC/MacOSX.
1.2 Using Memcheck
Memcheck is easy to use. As an example, consider the
(contrived) program badprog.c in Figure 1. It contains three undefined value errors. To check the compiled
program badprog the user only has to type:
valgrind --tool=memcheck badprog
The --tool= option specifies which tool in the Valgrind suite is used. The program runs under Memcheck’s control, typically 20–30 times slower than usual.
This slow-down is partly due to Memcheck’s definedness
checking, partly due to its other checking, and partly due
to Valgrind’s inherent overhead. The program’s output
is augmented by Memcheck’s output, which goes by default to standard error, although it can be redirected to a
file, file descriptor, or socket with a command line option.
Figure 2 shows the resulting output. The first three
lines are printed by Memcheck on startup. The middle
section shows three error messages issued by Memcheck.
The final three lines are printed at termination, and summarise Memcheck’s findings. Each line of Memcheck’s
output is prefixed with the client’s process ID, 27607 in
this case.
The three error messages are quite precise. The first
indicates that the memory passed to the system call
write() via the buf argument contains undefined values; its last line indicates that the undefined value is on
void set_bit ( int* arr, int n ) {
arr[n/32] |= (1 << (n%32));
}
int get_bit ( int* arr, int n ) {
return 1 & (arr[n/32] >> (n%32));
}
int main ( void ) {
int* arr = malloc(10 * sizeof(int));
set_bit(arr, 177);
printf("%d\n", get_bit(arr, 178));
return 0;
}
Figure 3: Unsafe use of a bit-array
the stack of thread 1 (the main thread). The second indicates that a conditional jump depends on an undefined
value. The third indicates that an undefined value is used
as a pointer. All three error messages include a stack
trace that indicate precisely where the error is occurring.
In order to get exact line numbers in the stack traces, the
client must be compiled with debugging information. If
this is missing, the code locations are less precise, as can
be seen with the location within the write() function
(not to be confused with the write() system call)—
GNU libc on this system was not compiled with debugging information.
Attentive readers may note that the final line of
badprog.c could cause a segmentation fault due to the
use of the uninitialised variable p as an address. On one
system we tried this test on, exactly that happened, and so
Memcheck issued an additional “Invalid read of size 4”
warning immediately before the memory access, thanks
to its addressability checking. For the run presented, the
memory access (un)luckily hit addressable memory, so
no addressability error message was issued.
1.3 Bit-level precision
Memcheck is the first tool we are aware of that tracks
definedness down to the level of bits. Other tools track
definedness at byte granularity (Purify) or word granularity (Third Degree).
This means Memcheck correctly handles code which
deals with partially-defined bytes. In C and C++, two
common idioms give rise to such bytes: use of bit arrays
and use of bitfields in structures. Tools which track definedness at byte or word granularities necessarily give
inaccurate results in such situations – either they fail to
report genuine errors resulting from uses of uninitialised
bits, or they falsely flag errors resulting from correct uses
of partially defined bytes.
The program shown in Figure 3 uses an uninitialised
bit in a bit-array. Memcheck reports this, but Purify does
not2 . Memcheck is known to have found previously-
==27607== Memcheck, a memory error detector for x86-linux.
==27607== Copyright (C) 2000-2004, and GNU GPL’d, by Julian Seward et al.
==27607== For more details, rerun with: -v
==27607==
==27607== Syscall param write(buf) contains uninitialised or unaddressable byte(s)
==27607==
at 0x420D2473: write (in /lib/tls/libc-2.3.2.so)
==27607==
by 0x8048347: main (badprog.c:6)
==27607== Address 0x52BFE880 is on thread 1’s stack
<junk character printed by write()>
==27607==
==27607== Conditional jump or move depends on uninitialised value(s)
==27607==
at 0x804834F: main (badprog.c:7)
==27607==
==27607== Use of uninitialised value of size 4
==27607==
at 0x804836B: main (badprog.c:8)
==27607==
==27607== ERROR SUMMARY: 3 errors from 3 contexts (suppressed: 11 from 1)
==27607== malloc/free: in use at exit: 0 bytes in 0 blocks.
==27607== malloc/free: 0 allocs, 0 frees, 0 bytes allocated.
Figure 2: Example output for badprog.c
undetected uses of single uninitialised bits in C++ structure bitfields, in at least one large, widely used C++ code
base.
1.4 Contributions
namic binary instrumentation; it does all the hard work of
inserting instrumentation into machine code at run-time.
Tools are created as plug-ins, written in C, to Valgrind’s
core. The basic view is:
Valgrind core + tool plug-in = Valgrind tool.
The rest of this paper is structured as follows. Section 2
describes how Memcheck works, in particular the details
of shadow bit operations, which are crucial in ensuring
Memcheck’s accuracy and speed. Section 3 evaluates
Memcheck by considering the cost of its use—in terms
of how easy it is to obtain and run, the ease of using its
results, and its impact on performance—and the benefits
provided by its bug-finding abilities. Section 4 discusses
related work. Section 5 concludes.
The resulting tool loads the client at start-up, grafting itself onto the process as it does so. It then starts executing
the client, by (re)compiling the client’s code, one basic
block at a time, in a just-in-time, execution-driven fashion. The compilation process involves disassembling the
machine code into an intermediate representation called
UCode. UCode is instrumented by the tool plug-in, and
the instrumented UCode is then converted back into x86
code. The resulting code is stored in Valgrind’s code
cache, to be rerun as necessary.
The core spends most of its execution time making,
finding, and running translations. None of the client’s
original code is run. The core also provides many services to tools, to ease common tasks such as recording
errors and reading debug information. Only one tool can
be used at a time.
The Valgrind distribution contains the core, plus five
tools: Memcheck, Addrcheck (a lightweight version of
Memcheck that omits definedness checking), a cache
profiler, a memory space-use (heap) profiler, and a data
race detector for POSIX pthread-ed programs.
2 How Memcheck works
2.2 Overview
2.1 Valgrind
The basic idea underlying the definedness checking is
straightforward.
Our main contribution is a detailed description of Memcheck’s definedness checking, which has only been
briefly touched upon in previous publications about Valgrind [10, 9]. Memcheck’s definedness checking improves on that performed by previous tools by being accurate to the level of individual bits. Its false positive
and false negative rates are very low. Finally, the runtime overhead of the definedness checking is reasonable
enough that it is practical to use on very large programs.
1.5 Paper structure
Memcheck is implemented as a plug-in to Valgrind [10,
9]. Valgrind is a framework for creating tools that use dy-
• Every single bit of data, b, maintained by a program, in both registers and memory, is shadowed
by a piece of metadata, called a definedness bit. For
historical reasons these are often also referred to as
V bits (V being short for “validity”). Each V bit
indicates whether or not the bit b it shadows is regarded as currently having a properly defined value.
• Every single operation that creates a value is shadowed by a shadow operation that computes the V
bits of any outputs, based on the V bits of all inputs
and the operation. The exact operations performed
by this shadow computation are important, as they
must be sufficiently fast to be practical, and sufficiently accurate to not cause many false positives.
• Every operation that uses a value in such a way that
it could affect the observable behaviour of a program is checked. If the V bits indicate that any of
the operation’s inputs are undefined, an error message is issued. The V bits are used to detect if any of
the following depend on undefined values: control
flow transfers, conditional moves, addresses used in
memory accesses, and data passed to system calls.
Most operations do not directly affect the program’s
observable behaviour. In such cases, the V bits
are not checked. Instead, V bits for the result of
the operation are computed. Hence, for the most
part, Memcheck silently tracks the flow of undefined values, and only issues an error message when
use of such a value is potentially dangerous. This
scheme is required because undefined values are often copied around without any problem, due to the
common practice, used by both programmers and
compilers, of padding structures to ensure fields are
word-aligned.
From this overview, the main overheads of definedness
checking are apparent. First, the use of V bits doubles
the amount of memory in use. Second, most instructions
compute new values, and thus require a shadow operation itself consisting of one or more instructions.
2.3 Details of V bits
6 condition codes individually is expensive and
mostly unnecessary.
• The program counter is not shadowed. Instead, we
regard it as always defined, and emit an error message whenever a conditional jump depends on undefined condition codes. One way to interpret such
a jump is as an attempt to assign an undefined value
to the program counter, but since we are not tracking the program counter’s definedness state, we regard it as always-defined, and so must immediately
report any attempt to “assign” it an undefined value.
• Floating point, MMX and SSE registers are not
shadowed. Memcheck can still perform definedness
checking on code using these registers, but such
checks may produce a higher false positive rate than
would have occurred had the registers been shadowed.
2.4 Instrumentation basics
In principle it is possible to directly state the V bit transformations required to shadow each x86 instruction. In
practice, the x86 instruction set is so complex and irregular that this would be difficult and fragile. Fortunately,
UCode (Valgrind’s intermediate representation) is RISClike and clearly exposes all memory and arithmetic operations, which makes Memcheck’s instrumentation task
much easier.
Another important aspect of UCode is that it supports
the use of an infinite supply of virtual registers. The initial translation from x86 is expressed in terms of such
registers. Memcheck interleaves its own instrumentation
UCode with it, using as many new virtual registers as
required. Valgrind’s core has the job of performing instruction selection and register allocation to convert this
sequence back to executable x86 code.
2.5 Abstract operations on V bits
A V bit of zero indicates that the corresponding data bit
has a properly defined value, and a V bit of one indicates
that it does not. This is counterintuitive, but makes some
of the shadow operations more efficient than they would
be if the bit values were inverted.
Every 32-bit general purpose register is shadowed by
a 32-bit shadow register, and every byte of memory has
a shadow V byte. After that, there are some exceptions
to the basic rule of “one V bit per data bit”.
The V bit instrumentation scheme is best described in
terms of a family of simple abstract operations on V bits.
We will use d1 and d2 to denote virtual registers holding
real values, and v1 and v2 denote virtual shadow registers holding V bits. Also, some operations below use
X and Y indicate the operand and result widths in bytes
(and 0 represents an operand with a width of a single bit).
Those operations for which the width is not specified are
width-independent.
Memcheck uses the following binary operations.
• The x86 condition code register (%eflags) is approximated with a single V bit, since tracking all
• DifD(v1,v2) (“defined if either defined”) returns a V bit vector the same width as v1 and v2.
Each bit of the result indicates definedness if either corresponding operand bit indicates definedness. Since our encoding is zero for defined and
one for undefined, DifD can be implemented using
a bitwise-AND operation.
• UifU(v1,v2) (“undefined if either undefined”)
dually propagates undefinedness from either
operand, again at a bitwise level, and can be
implemented using a bitwise-OR operation.
• ImproveAND(d,v) and ImproveOR(d,v)
are helpers for dealing with AND and OR operations. These have the interesting property
that the resulting V bits depend not only on the
operand V bits, but also on the operand data values. ImproveAND takes a data value (d) and a V
bit value (v), and produces an “improvement value”
bitwise as follows:
ImproveAND(0,
ImproveAND(0,
ImproveAND(1,
ImproveAND(1,
undefined)
defined)
undefined)
defined)
=
=
=
=
undefined
defined
undefined
undefined
The second case is the interesting one. If one of the
arguments is a defined zero bit, we don’t care that
the other argument might be undefined, since the result will be zero anyway. Hence ImproveAND creates a “defined” V-bit, which, as described in Section 2.6, is merged into the final result for AND using DifD. This has the effect of forcing that bit of
the result to be regarded as defined. “undefined” is
the identity value for DifD, so the other three cases
have no effect on the final outcome.
For exactly analogous reasons, ImproveOR behaves similarly, with the interesting case being
ImproveOR(1, defined) = defined.
The following unary operations are also needed.
• Left(v) simulates the worst-case propagation of
undefinedness upwards (leftwards) through a carry
chain during integer add or subtract. Left(v) is
the same as v, except that all bits to the left of the
rightmost 1-bit in v are set. For example, using
8-bit values, Left(00010100) = 11111100.
Left can be implemented in two x86 instructions,
a negation followed by an OR operation.
• PCastXY(v) are a family of size-changing
operations which can be interpreted as “pessimising casts”. If all bits of the operand are zero
(defined), PCast produces a V bit vector at the
new width in which all bits are zero (defined),
else it produces a value with all bits one (undefined). For example, PCast12(00010100)
= 1111111111111111,
and
PCast12(00000000) =
0000000000000000.
These casts are used in various approximations in
which the definedness checking needs to consider
the worst-case across a whole word of bits. It is important to appreciate that the narrowing casts (where
X > Y) do not simply discard the high bits of the
operand. Similarly, the case where X = Y is not
the identity function. In all cases, each result bit depends on all operand bits, regardless of their relative
sizes. PCast can be implemented in at most three
x86 instructions: for narrowing casts, negation followed by subtract-with-borrow; for widening casts,
a shift, a negation, and a subtract-with-borrow.
• ZWidenXY(v) are a family of widening operations which mimic unsigned (zero-extend) widening of data values. As with PCast, X and Y denote argument and result widths, with the additional
requirement that Y ≥ X. Zero-widening a data
value produces zeroes in the new positions, and so
ZWiden needs to indicate these new positions are
defined. Since defined values are encoded as zero
bits, ZWiden can itself be implemented using a
zero-widen instruction. This is the first of several
cases where choosing zero (rather than one) to mean
“defined” simplifies the implementation.
• SWidenXY(v) is the dual family of signed widening operations. A signed widening copies the top
argument bit into all new positions. Therefore
SWiden has to copy the top definedness bit into
all new positions and so can itself be implemented
using a signed-widen instruction.
2.6 The instrumentation scheme proper
Every operation (instruction or system call) that creates
a value must be instrumented with a shadow operation
that computes the corresponding V bits. This section describes these shadow operations in detail.
Recall that for each virtual register d1, d2 . . . in the
incoming UCode, Memcheck allocates a shadow virtual
register v1, v2 . . . to carry the corresponding V bits.
Register and memory initialisation At startup, all
registers have their V bits set to one, i.e. undefined. The
exception is the stack pointer, which has its V bits set to
zero, i.e. defined.
All memory bytes mapped at startup (i.e. code and
data segments, and any shared objects) have their V bits
set to zero (defined).
Memory allocation and deallocation The Valgrind
framework intercepts function and system calls which
cause usable address ranges to appear/disappear. Memcheck is notified of such events and marks shadow memory appropriately. For example, malloc and mmap bring
new addresses into play: mmap makes memory addressable and defined, whilst malloc makes memory addressable but undefined. Similarly, whenever the stack grows,
the newly exposed area is marked as addressable but undefined. Whenever memory is deallocated, the deallocated area also has its values all marked as undefined.
Memcheck also uses such events to update its maps of
which address ranges are legitimately addressable. By
doing that it can detect accesses to invalid addresses,
and so report to the user problems such as buffer overruns, use of freed memory, and accesses below the stack
pointer. Details of this addressability checking are beyond the scope of this paper.
Add with carry and subtract with borrow These
take the CPU’s carry flag as an additional single-bit
operand. Let vfl be the virtual 1-bit-wide register tracking the definedness of the condition codes (%eflags). If
this extra operand is undefined, the entire result is undefined, so the following formulation derives straightforwardly from the Add/Sub case:
Literals All literals are, not surprisingly, considered to
be completely defined.
And and Or These require inspection of the actual
operand values as well as their shadow bits. We start
off with a bitwise UifU of the operands, but fold in, using DifD, “improvements” contributed by defined zeroarguments (for And) or defined one-arguments (for Or).
So, given:
Data copying operations These are straightforward.
Register-to-register moves give rise to a move between
the corresponding shadow registers. Register-to-memory
and memory-to-register transfers are instrumented with
a move between the corresponding shadow register and
shadow memory.
x86 contains a byte-swap (endianness-change) instruction. As this merely rearranges bits in a word, a
byte-swap instruction is also applied to the shadow value.
Addition
and
subtraction Given
d3 =
Add(d1,d2) or d3 = Sub(d1,d2), each result bit can simplistically be considered defined if both
the corresponding argument bits are defined. However,
a result bit could also be undefined due to an undefined
carry/borrow propagating upwards from less significant
bit positions. Therefore Memcheck needs to generate
v3 = Left(UifU(v1,v2)).
The same scheme is used for multiplies. This is
overly conservative because the product of two numbers
with N and M consecutive least-significant defined bits
has N + M least-significant defined bits, rather than
min(N, M ) as the Add/Sub scheme generates. It would
be possible to do a better job here, but the extra expense
does not seem justified given that very few, if any, complaints have arisen over the subject of false positives arising from multiplies.
The shadow operation for Neg (negation) is trivially
derived by constant-folding the shadow operation for
Sub(0,d), giving the result Left(v), where v is the
shadow for d.
v3 = UifU( Left(UifU(v1,v2)),
PCast0X(vfl) )
where X is the width of v1, v2 and v3.
Xor A simple case: given d3 = Xor(d1,d2), generate v3 = UifU(v1,v2).
The rule for Not is trivially derived by constantfolding the rule for Xor(0xFF..FF,d), giving, as one
might expect, the simple result v, where v is the shadow
for d; i.e. the V bits are unchanged.
d3 = And(d1,d2)
d3 = Or(d1,d2)
the resulting instrumentation assignments are, respectively:
v3 = DifD( UifU(v1,v2),
DifD( ImproveAND(d1,v1),
ImproveAND(d2,v2) ) )
v3 = DifD( UifU(v1,v2),
DifD( ImproveOR(d1,v1),
ImproveOR(d2,v2) ) )
This means instrumentation of And/Or is quite expensive. However, such instructions are often used with
one constant operand, in which case Memcheck’s postinstrumentation cleanup pass can fold these expressions
down to a single ImproveAND/OR term.
Shl, Shr, Sar, Rol, Ror (Shift left, Unsigned shift
right, Signed shift right, Rotate left, Rotate right). In
all cases, if the shift/rotate amount is undefined, the entire result is undefined. Otherwise, for reasons which are
somewhat subtle, the result V bits are obtained by applying the same shift/rotate operation to the V bits of the
value to be shifted/rotated.
Given input d3 = OP(d1, d2), where d2 is the
shift/rotate amount, and the sizes of d1/d3 and d2 are
respectively X and Y, the resulting instrumentation assignment is
v3 = UifU( PCastYX(v2), OP(v1,d2) )
In all five cases, the definedness bits are processed using the same operation as the original. For Rol and Ror,
the definedness bits must be rotated exactly as the data
bits are. Shl and Shr shift zeroes into the data, and so
corresponding zeroes—indicating definedness—need to
be shifted into the definedness word. Sar copies the top
bit of the data, and so needs to also copy the top bit of
the definedness word.
Widening and narrowing conversions A narrowing
conversion on data throws away some of the top bits of
the word, and so the same operation can be used to throw
away the top bits of the shadow word.
Signed and unsigned widening conversions give rise
respectively to a single SWiden or ZWiden operation.
Instructions which set flags On x86, most integer
arithmetic instructions set the condition codes (%eflags)
and Memcheck duly tracks the definedness state of
%eflags using a single shadow bit. When an integer operation sets condition codes, it is first instrumented as
described above. Memcheck pessimistically narrows the
result value(s) of the shadow operation using PCastX0
to derive a value for the %eflags shadow bit.
Loads, stores, conditional branches and conditional
moves These are discussed in the next section.
Floating point (FP) and MMX, SSE, SSE2 (SIMD)
operations Valgrind does not disassemble floating
point or SIMD instructions to the same level of detail
as it does integer instructions. Instead, it merely modifies some of the register fields in the instruction, marks
any instructions referencing memory as such, and copies
them otherwise unchanged into the output instruction
stream.
Because of this, Memcheck can only offer crude instrumentation of such instructions. Such instrumentation is safe in the sense that all uses of undefined values,
and all illegitimate memory accesses, will still be caught.
The crudeness of the instrumentation has the effect that
some computations, when done with FP or SIMD registers, may elicit false-positive undefined value errors,
when similar or identical operations done using integer
registers would not. The most notable case is that copying undefined data through the FP or SIMD registers will
elicit false positives.
The instrumentation scheme is as follows. Neither the
FP nor SIMD registers have any associated V bits. When
a value is loaded from memory into such a register, if any
part of the value is undefined, an error message is issued.
When a value is written from such a register to memory,
shadow memory is marked as defined. This is in keeping
with the Eager approximation scheme described shortly.
So far, this crude scheme has proven adequate, mostly
because programmers and compilers rarely copy and manipulate partially-undefined data through FP or SIMD
registers. However, vectorising compilers for SIMD
architectures are becoming increasingly common [8],
and this scheme cannot continue much longer—it is the
biggest weakness of Memcheck. A new version of Memcheck under development will shadow data in floating
point registers and in individual lanes of SIMD registers,
thus remedying this deficiency.
Approximating everything else The above cases give
sufficient accuracy to achieve a near-zero false positive
rate on almost all compiler-generated and handwritten
code. There are a multitude of other cases which could be
tracked accurately, but for which there appears to be no
point. These include: division, rotates through the carry
flag, and calls to helper functions which implement obscure features (CPUID, RDTSC, BCD arithmetic, etc).
In such situations, two approximation schemes are
possible.
• Lazy. The V bits of all inputs to the operation are
pessimistically summarised into a single bit, using
chains of UifU and/or PCastX0 operations. The
resulting bit will indicate “undefined” if any part of
any input is undefined. This bit is duplicated (using PCast0X) so as to give suitable shadow output
word(s) for the operation.
Using this scheme, undefinedness can be made to
“flow” through unknown operations, albeit in a pessimistic manner. No error messages will be issued
when such operations execute.
• Eager. As with Lazy, a summary definedness bit
is pessimistically computed. If the bit is one (undefined), an error message is issued. Regardless
of the bit’s value, shadow output word(s) are created indicating “defined”. Counterintuitive as this
may seem, it stops cascades of undefined value error messages being issued; only the first observation
of such values are reported.
Memcheck currently uses Eager for all floating point
and SIMD operations, as decribed above, and Lazy in all
other situations.
2.7 Deciding when to issue error messages
At every point where an undefined value could be consumed by an operation, Memcheck has a choice: should
it report the error right now, or should it silently propagate the undefinedness into the result? Both approaches
have advantages.
• Reporting the error sooner (the eager strategy mentioned above) makes it easier for users to track down
the root cause of undefined values. Undefined value
errors originate primarily from reading uninitialised
memory. Such values propagate through the computation until they hit a check point. If check points
are rare, that path can be long, and users may have
to trace back though multiple levels of procedure
calls and through their data structures to find the
root cause.
• Deferring error checking and reporting has two
major advantages.
Firstly, error checks are
expensive—a test and conditional jump—and so
minimising them improves performance. Secondly
and more importantly, reporting errors too soon can
lead to false positives: undefined values might be
used in a safe way and then discarded, so an early
check on them would give a pointless error to the
user.
Memcheck mostly takes the second alternative, deferring error reporting as far as it can. Checks for undefined
values are made only when the program is in immediate
danger of performing one of the following actions, which
could change its observable behaviour.
• Taking a memory exception due to use of an undefined address in a load or store.3
• Making a conditional jump based on undefined condition codes.
• Passing undefined values to a system call.
• Loading uninitialised values from memory into a
SIMD or FP register.
Accordingly, instrumentation for such events is as follows.
• Memory access (all kinds): check address for definedness and issue an error message if any address
bit is undefined.
• Conditional jump: check the V bit which shadows
%eflags, and issue an error message if undefined.
• System call: check arguments (scalar and in memory) to the extent possible, and issue an error message if undefined values are being passed to the kernel. This requires in-depth knowledge of the kernel
interface.
• Memory load into a SIMD or FP register: in addition to checking definedness of the address, also
check the loaded data for definedness, and issue an
error message if necessary.
Conditional moves could be handled using either the
eager or lazy scheme. Memcheck handles them eagerly,
testing the condition code and reporting any error immediately.
Each error check consists of testing a shadow virtual
register4 against zero for any undefinedness, and calling
a helper function to issue an error message if so. An
important but non-obvious extra step is that, immediately following the test, the shadow register should be
set to zero (“all defined”). Doing so prevents subsequent
checks on it issuing essentially duplicate errors, which
would confuse users. Consider the following C fragment:
int* p; /* not defined */
... = *p;
*p = ...
For the load, p’s shadow is tested, and an error message
is issued if necessary. Subsequently in the store, reporting another such error for p would not help lead users to
the root cause of the problem.
Loads from invalid addresses One interesting question is how to handle loads from memory which Memcheck regards as not validly addressable. Our solution is
counterintuitive: data loaded from unaddressable memory is marked as defined.
This helps reduce error cascades. A load from an invalid address will in any case cause Memcheck to issue
an invalid-address error message. If the loaded data was
marked as undefined, Memcheck might, as a result, later
issue undefined value error messages. These would confuse users and obscure the true cause of the error—the invalid address. Marking the loaded data as defined avoids
that problem.
2.8 Avoiding false positives
Memcheck has a very low false positive rate. However, a
few hand-coded assembly sequences, and a few very rare
compiler-generated idioms can cause false positives. The
few examples we know of are as follows.
• xor %reg,%reg: %reg is defined after the instruction, even if it is undefined prior to it. This
is solved for Memcheck by Valgrind’s x86-toUCode translation phase, which translates this idiom as if it had instead seen mov $0,%reg; xor
%reg,%reg.
• sbb %reg,%reg: This copies the carry flag
into all bits of %reg, and has no real dependence on %reg’s original value. The instrumentation described above preserves any undefinedness
from %reg’s original value, which is inappropriate.
Again, the front end solves this by instead translating mov $0,%reg; sbb %reg,%reg.
• A more difficult case: GCC occasionally generates
code to do a conditional jump based on the highest
bit in a register by moving the bit to the sign flag
using test %reg,%reg and then doing a conditional jump based on the sign flag. Unfortunately,
if bits below the highest bit in %reg are undefined,
Memcheck’s instrumentation scheme will conclude
that all six condition codes are undefined, and so
complain at the jump. The problem arises because
only one bit is used to approximate the definedness
state of all six condition codes. A possible solution
is to model the sign flag separately from the rest,
but so far we have resisted this extra complexity and
run-time overhead.
• GNU libc contains highly-optimised, hand-written
assembly routines for common string functions,
particularly strlen(). These traverse the string
a word at a time, relying on detailed properties of
carry-chain propagation for correct behaviour. For
such code, Memcheck’s use of the Left operator
to model such propagation is too crude, and leads to
false positives.
Memcheck has a two-part work-around. First, it replaces the standard versions of these functions with
its own less optimised versions that do not cause
problems. But GCC sometimes inlines calls to these
functions, and handling them currently involves a
nasty hack. Such code requires addition/subtraction
of carefully chosen constants, such as 0x80808080.
If Memcheck sees adds/subtracts with such suspect
constants as operands, some undefined value checks
in the containing basic block are omitted.
A better solution would be to use the presence of
such constants as a signal that adds/subtracts in
this block should be instrumented using an alternative, more accurate but more expensive formulation
which properly tracks carry propagation [6]. We are
developing such a scheme.
Finally, Memcheck’s underlying assumptions are occasionally invalid. For example, some programs deliberately use undefined values as an additional source of
entropy when generating random numbers.
2.9 False negatives
We believe there are very few situations in which Memcheck fails to flag uses of undefined values that could
have any observable effect on program behaviour. The
exceptions we are aware of are as follows.
• The abovementioned omission of some checks
in blocks containing magic constants such as
0x80808080. This hack could be removed as suggested above, probably with minimal performance
loss.
• Caller-saved registers in procedures. Ideally, on
entry to a procedure, caller-saved registers should
be marked as undefined, since callees assume that
caller-saved registers are fresh storage available
for use. Memcheck does not currently do so.
Doing this correctly is difficult, both because it
is calling-convention dependent, and because reliably observing procedure entry/exit on x86/Linux
is nearly impossible given the use of tail-call optimisations, leaf-function optimisations, and use of
longjmp().5 As a result, it is possible that registers which should be regarded as undefined at the
start of a callee are marked as defined due to previous activity in the caller, and so some errors might
be missed.
• Programs that switch stacks (usually because they
implement user-space threading). There is no reliable way to distinguish a large stack allocation or
deallocation from a stack-switch. Valgrind uses a
heuristic: any change in the stack pointer greater
than 2MB is assumed to be a stack-switch. When
Valgrind judges that a stack-switch has happened,
Memcheck does not take any further actions. So
if a stack frame exceeding 2MB is allocated, Valgrind considers this a stack switch, and Memcheck
will not mark the newly allocated area as undefined.
The program could then use the values in the allocated area unsafely, and Memcheck will not detect
the problem.6
Finally, Memcheck of course cannot detect errors on
code paths that are not executed, nor can it detect errors
arising from unseen combinations of inputs. This limitation is inherent from the fact that Memcheck uses dynamic analysis. As a result, Memcheck is best used in
conjunction with a thorough test suite. In comparison,
static analysis does not suffer these limitations, but the
power of the analysis is necessarily much lower [1].
2.10 Setting realistic expectations
A system such as Memcheck cannot simultaneously be
free of false negatives and false positives, since that
would be equivalent to solving the Halting Problem. Our
design attempts to almost completely avoid false negatives and to minimise false positives. Experience in practice shows this to be mostly successful. Even so, user
feedback over the past two years reveals an interesting
fact: many users have an (often unstated) expectation
that Memcheck should not report any false positives at
all, no matter how strange the code being checked is.
We believe this to be unrealistic. A better expectation
is to accept that false positives are rare but inevitable.
Therefore it will occasionally necessary to add dummy
initialisations to code to make Memcheck be quiet. This
may lead to code which is slightly more conservative
than it strictly needs to be, but at least it gives a stronger
assurance that it really doesn’t make use of any undefined
values.
A worthy aim is to achieve Memcheck-cleanness, so
that new errors are immediately apparent. This is no different from fixing source code to remove all compiler
warnings, even ones which are obviously harmless.
Many large programs now do run Memcheck-clean,
or very nearly so. In the authors’ personal experience, recent Mozilla releases come close to that, as do
cleaned-up versions of the OpenOffice.org-680 development branch, and much of the KDE desktop environment. So this is an achievable goal.
Finally, we would observe that the most effective use
of Memcheck comes not only from ad-hoc debugging,
but also when routinely used on applications running
their automatic regression test suites. Such suites tend
to exercise dark corners of implementations, thereby increasing their Memcheck-tested code coverage.
3 Evaluation
For a tool such as Memcheck to be worth using, a user
must first be using a language such as C, C++ or Fortran
that is susceptible to the kinds of memory errors Memcheck finds. Then, the benefits of use must outweigh
the costs. This section considers first the costs of using
Memcheck, in terms of its ease of use and performance.
It then considers the benefits, that is, its effectiveness in
helping programmers find real bugs.
As part of this, we refer to a survey of Valgrind users
that we conducted in November 2003, to which 116
responses were received. The results are available on
the Valgrind website [14]. Memcheck’s operation has
changed very little in the time since, so the responses
about it are still relevant.
3.1 Ease of use
Ease of use has a number of facets: how easy Memcheck
is to obtain, how easy it is to run, and how easy it is to
act upon its results.
Obtaining Memcheck Memcheck is very easy to obtain, because the Valgrind suite is free software, is available in source form on the Valgrind website [14], and is
widely available in binary form on the web, packaged for
a number of Linux distributions.
Running Memcheck Memcheck could hardly be easier to run. Using it only requires prefixing a program’s
command line with valgrind --tool=memcheck,
plus any other desired Valgrind or Memcheck options.
Typically, the only further effort a user must make
is to compile her program with debugging information,
to ensure error messages are as informative as possible.
Indeed, 40 of the 116 survey responders praised Valgrind/Memcheck’s ease of running, and another another
14 commented that “it just works”, or similar. Only one
responder complained that it could be easier to use.
Custom allocators There are some cases where the
user needs to expend a little more effort. If a program uses custom memory management rather than
malloc(), new and new[], Memcheck can miss
some errors it would otherwise find. The problem can
be avoided by embedding small number of client requests into the code. These are special assembly code
sequences, encoded as C macros for easy use, that Valgrind recognises, but which perform a cheap no-op if the
client is not running on Valgrind. They provide a way
for the client to pass information to a Valgrind tool. For
example, when using a custom allocator, client requests
can be used to inform Memcheck when a heap block has
been allocated or deallocated, its size and location, etc.
Self-modifying code Extra effort is also needed to handle self-modifying code. Dynamically generated code is
not a problem, but if code that has executed is modified
and re-executed, Valgrind will not realise this, and will
re-run its out-of-date translations. Auto-detecting this is
possible but expensive [7]; the cost is not justified by the
small number of programs that use self-modifying code.
Our compromise solution is to provide another client request which tells Valgrind to discard any cached translations of code in a specified address range.
Different behaviour under Memcheck Client programs sometimes do not behave exactly the same under
Valgrind/Memcheck as they do normally. Programs that
run successfully normally may fail under Memcheck.
This is usually because of latent bugs that are exposed
e.g. by different execution timings, or because Valgrind
provides its own implementation of the Pthreads library.
This can be regarded as a good thing. More rarely, programs that fail normally may succeed under Memcheck
for the same reasons, which can be frustrating for users
who hoped to track down a bug with Memcheck.
Although Valgrind/Memcheck is robust—we have had
feedback from users using it on systems with 25 million
lines of code —it occasionally fails due to its own bugs.
The main source of problems is that Valgrind interacts
closely with the kernel and GNU libc. In particular the
signal and thread handling is fragile and hard to get right
for all Linux distributions, and a maintenance headache.
By comparison, the parts dealing with x86 code and instrumentation cause few problems, because instruction
sets change very slowly. We hope to decrease our level
of interaction with the kernel and GNU libc in the future, and recent development efforts have made major
progress in that area.
Acting upon Memcheck’s results In general, Memcheck’s addressability checking, deallocation checking,
and overlap checking do quite well here, in that Memcheck’s report of the problem is usually close to the root
cause. However, for definedness checking this is often
not the case, as Section 2.7 explained.
To help on this front, Memcheck provides another
client request that can be inserted into the client’s source
code. It instructs Memcheck to check if a particular variable or memory address range is defined, issuing an error
message if not. Judicious uses of this client request can
make identifying root causes of undefined value errors
much easier.
Ideally, error messages would indicate where the undefined value originated from, e.g. from a heap block
whose contents have not been initialised. However, this
would require augmenting each value with extra information about where it came from, and we cannot see how
to do this without incurring prohibitive overheads.
Ease of interpreting error messages is also important.
Ten survey responders complained that the messages are
confusing, but 7 praised them. One issue in particular is
the depth of stack traces: the default is four, but many
users immediately adjust that to a much higher number.
This gives more information, but also makes the error
messages longer. This is a case where a GUI (requested
by 8 responders) would be useful, in that large stack
traces could be gathered, shown to a small depth by default, and then “unfolded” by the user if necessary. Some
users also simply prefer graphical tools over text-based
ones. As it happens, there are several GUI front-ends for
Valgrind, including Alleyoop [17] and Valgui [2].
Program
bzip2
crafty
gap
gcc
gzip
mcf
parser
twolf
vortex
ammp
art
equake
mesa
median
geo. mean
t (s)
10.8
3.5
1.0
1.5
1.8
0.4
3.6
0.2
6.4
19.1
28.6
2.1
2.3
Mem.
13.8
45.3
26.5
35.5
22.7
14.0
18.4
30.1
47.9
24.7
13.0
31.1
43.1
26.5
25.7
Addr.
10.2
27.4
19.2
23.7
17.7
7.1
13.5
20.5
36.5
23.3
10.9
28.8
35.9
20.5
19.0
Nul.
2.5
7.9
5.6
9.2
4.7
2.6
4.2
6.1
8.5
2.2
5.5
5.8
5.6
5.6
4.9
Table 1: Slow-down factors of Memcheck, Addrcheck
and Nulgrind (smaller is better)
3.2 Performance
This section discusses the performance of three Valgrind
tools. Besides Memcheck, it considers two other tools:
Addrcheck, and Nulgrind. Addrcheck is a cut-down version of Memcheck that does not perform definedness
checking. The performance difference between Memcheck and Addrcheck give an indication of the cost
of Memcheck’s definedness checking. Nulgrind is the
“null” Valgrind tool that adds no instrumentation. It
gives an idea of the overhead due to Valgrind’s basic operation.
All measurements were performed using Valgrind
2.1.2 on an 1400 MHz AMD Athlon with 1GB of RAM,
running Red Hat Linux 9, kernel version 2.4.20. The
test programs are a subset of the SPEC CPU2000 suite
[16]. All were tested with the “test” (smallest) inputs.
The time measured was the “real” time, as reported by
/usr/bin/time. Each program was run once normally, and once under each of the Valgrind tools. This is
not a very rigorous approach but that does not matter, as
the figures here are only intended to give a broad idea of
performance.
Table 1 shows the time performance of the three tools.
Column 1 gives the benchmark name, column 2 gives
its normal running time in seconds, and columns 3–5
give the slow-down factor for each tool relative to column 2 (smaller is better). The first nine programs are
integer programs, the remaining four are floating point
programs. The bottom two rows give the median and geometric mean for the slow-down factors.
The slow-down figures for Memcheck are quite high.
This is partly due to the cost of definedness checking,
partly due to the cost of Memcheck’s other kinds of
checking, and partly because of Valgrind’s inherent overhead.
Memcheck also has a large memory cost. Since each
byte is shadowed by a byte holding V bits and also by a
single A bit indicating whether that location is addressable, memory use is increased by a factor of approximately (8 + 1)/8 = 9/8, that is, slightly more than doubled. Shadow storage is allocated on demand, so programs which do not use much memory when running
natively still do not use much when running under Memcheck. Another space cost is that of holding translations:
Valgrind can store translations of approximately 200000
basic blocks, occupying about 70MB of storage. This too
is allocated incrementally. Finally, Memcheck records
on the order of 50 to 100 bytes of administrative information for each block allocated by malloc/new/new[].
As a result of this, programs with large memory footprints (above about 1.5GB) die from lack of address
space. Since V-bit storage is usually the largest component of the overhead, we are considering compressed
representations for V bits. These rely on the observation that about 99.95% of all bytes are all-defined or allundefined, and so their definedness state could be summarised using a single bit. This would be merely a representational change and would not affect Memcheck’s
ability to track definedness with bit-level precision.
Of the various costs to the user of using Memcheck,
for many people the slow-down is the greatest cost.
Among the survey responders, 9 praised Memcheck’s
performance, and 32 complained about it. In general,
we have found that users who have used other, similar, memory checkers praise Memcheck’s performance,
and those who have not used other such tools complain
about it. However, judging from overall feedback, Memcheck’s performance is good enough for the vast majority
of users.
3.3 Evidence of usefulness
It is never easy to convincingly demonstrate in a paper that a tool such as Memcheck, which is designed
to find bugs in programs, works well. To truly appreciate the usefulness of such a tool, one must really use
it “in anger” on a real system. Nonetheless this section
provides two pieces of evidence that Memcheck, particularly its definedness checking, is effective. The first is a
case study of using it on OpenOffice; the second is general information about Memcheck’s popularity.
OpenOffice case study Jens-Heiner Rechtien used
Memcheck with OpenOffice7, and systematically
recorded all the error messages that Memcheck issued
[13]. He ran OpenOffice’s basic “smoke test” (with
Java disabled), which only exercises a fraction of
OpenOffice’s code. Memcheck detected 102 problems
in 26 source files (plus 6 more in system libraries such
as GNU libc). Table 2 (copied from [13]) gives a
breakdown: column 1 numbers the problem category,
column 2 describes the problem, column 3 gives the
number of occurrences, and column 4 gives the number
of distinct source files in which the error occurred.
Of the 11 categories, five (1, 2, 3, 7 and 10) involve
undefined values. This accounts for 96 of 102, or 94%,
of the problems found.
Rechtien estimates that, regarding the consequences
of the detected problems, about one third would never
show up as a program failure for the user, another third
are bugs which have no consequences yet, but might lead
to regressions later if code is changed, and the last third
are plain bugs which might crash the application or lead
to malfunction anytime. The commits made to fix these
errors can be seen in the OpenOffice bugs database [11].
As for false positives, Rechtien states that when compiling with optimisation, he saw “a few”, but none when
compiling without optimisation.
From this example, Memcheck’s usefulness is clear, in
particular the usefulness of its definedness checking.
Popularity Another indication of the usefulness of
Memcheck’s definedness checking is its general popularity. We have received feedback from at least 300 users
in more than 30 countries, and so can conservatively estimate its user base is in the thousands.
A short list of notable projects using Valgrind includes: OpenOffice, StarOffice, Mozilla, Opera, KDE,
GNOME, AbiWord, Evolution, MySQL, PostgreSQL,
Perl, PHP, Mono, Samba, Nasa Mars Lander software,
SAS, The GIMP, Ogg Vorbis, Unreal Tournament, and
Medal of Honour. A longer list is available at the Valgrind website [14]. This includes a huge range of software types, almost anything that runs on x86/Linux.
Our November 2003 survey also found that Memcheck is by far the most commonly used of the Valgrind tools, accounting for approximately 85% of Valgrind use. In comparison, Addrcheck, which is the same
as Memcheck but without the definedness checking, only
accounts for 6% of Valgrind use.
4 Related work
There are a number of tools that detect various kinds of
memory errors in programs, particularly memory leaks
and bounds errors. However, only a small fraction of
them detect undefined values. This section discusses
only work that relates directly to Memcheck’s definedness checking.
Ref. no.
1
2
3
4
5
6
7
8
9
10
11
Error type
not initialized instance data member
not initialized local variables
not initialized variable used as in/out parameter in method call
overlapping buffers in strncpy()
off by one error
unchecked return value of system call
partly initialized struct used in inappropriate ways
no check for potentially invalidated index
use of buffer size instead of content size for writing out data
write not initialized buffer into stream
feed unterminated buffer into method expecting a C-style string
#problems
ca. 76
7
11
1
1
1
1
1
1
1
1
#files
10
5
3
1
1
1
1
1
1
1
1
Table 2: Errors found by Memcheck in OpenOffice
Huang [4] described, very early, the possibility of using dynamic analysis to detect variables that are written
but never read, and reads of undefined variables. However, the proposed instrumentation was at the source code
level rather than the machine code level.
Kempton and Wichmann [5] discussed the detection of
undefined value errors in Pascal programs. They suggest
using one shadow definedness bit per data bit in memory,
just as Memcheck does. They did not discuss how the
shadow bits would be propagated.
Purify [3] is a widely used commercial memory checking tool that can detect several kinds of memory errors
including undefined value errors. It adds instrumentation
to object code at link-time, in order to do checking at
run-time. It shadows every byte of memory with a twobit value that encodes one of three states: unaddressable,
writable, and readable. Reads of writable (i.e. allocated
but undefined) memory bytes may get flagged immediately as errors. This is a form of eager checking, as mentioned in Section 2.6. Because the shadowing is at the
byte-level, it does not feature bit precision.
Third Degree [18] is a memory checking tool built using the ATOM object code instrumentation framework
[15]. As well as detecting some accesses to unaddressable memory, it uses a crude form of definedness checking: when a stack or heap location first becomes addressable, it is written with a special “canary” value. An error
is issued if any loads read this canary value. This could
lead to false positives when undefined values are copied
around, and there is a small chance that the canary value
might occur legitimately, although the value is chosen
carefully to minimise this likelihood. As Third Degree
only ran on Alphas, it is unfortunately now defunct.
Insure++ [12] is a commercial memory checking tool.
It detects various kinds of errors, including undefined
value errors. It adds instrumentation to the source
code (C or C++ only) at compile-time, in order to do
checking at run-time. It has two modes of undefined-
ness checking: the first is eager, immediately reporting any reads of undefined variables; the second is less
eager, allowing copies of undefined variables to occur
without warning (but not other operations). Insure++
also comes with Chaperon, a tool for x86/Linux that
works much like Memcheck—it also uses dynamic binary instrumentation—which can detect reads of uninitialised memory.
The most notable feature of Memcheck compared to
previous tools is that its definedness checking is much
more sophisticated, featuring bit-precision, which means
it can be used reliably with bit-field operations.
5 Conclusion
We have described a tool named Memcheck, built with
the dynamic binary instrumentation framework Valgrind,
which can detect several kinds of memory errors that
are common in imperative programs. In particular, we
described the novel definedness checking that Memcheck performs to detect undefined value errors with bitprecision. We also considered the costs and benefits
of using Memcheck, and concluded that it definitely is
worth using, as shown by the 102 bugs found in OpenOffice by one user, and more generally by the thousands of
programmers who use it on a wide range of software.
Memcheck works well, and is widely used. Our main
challenge is ensuring that this remains true. Work is in
progress to develop a new intermediate representation for
Valgrind, which will provide sufficient description of FP
and SIMD operations to keep up with the increasing capabilities of vectorising compilers. The new intermediate
representation will also be architecture-neutral, in order
to provide a solid foundation for ports to architectures
other than x86, which will help keep Valgrind viable over
the long-term. A key challenge here is that instrumentation should also be architecture-neutral, so that tools do
not have to be partially or wholly re-written for each new
architecture supported. We also are working on ports to
other operating systems, in order to remove Valgrind’s
dependence on Linux. This is a significant task, but one
that is orthogonal to Memcheck’s workings.
If you are developing programs in C, C++, Fortran or
Pascal on the x86/Linux platform, you almost certainly
should be using Memcheck. If you are not, all the bugs
Memcheck would find will have to be found manually,
wasting your development time, or not be found at all,
compromising your code quality.
6 Acknowledgments
Thanks to Donna Robinson for encouragement, and
Jens-Heiner Rechtien for his meticulous record-keeping.
The second author gratefully acknowledges the financial support of Trinity College, University of Cambridge,
UK.
Notes
1 However,
it is useful mostly for languages like C, C++ and Fortran,
which have scant protection against memory errors.
2 Purify 2003a.06.13 Solaris 2 (32-bit, sparc) running on Solaris 2.9.
Compiler was Sun C 5.5. Optimisation level makes no difference: we
tried -xO3, -xO5 and no optimisation, with the same result.
3 Use of an undefined address is different from use of a defined but
invalid address. Memcheck detects both kinds of errors, but only the
former is the subject of this discussion.
4 Or shadow memory byte, for memory arguments to system calls.
5 A common question from aspiring Valgrind hackers is how to write
a simple tool which observes procedure entries/exits. From experience
we know that doing so reliably is extraordinarily difficult. Josef Weidendorfer’s “Callgrind” tool [19] is the best attempt so far, and it is
surprisingly complex.
6 For similar reasons, the stack-switch heuristic can also confuse
Memcheck’s addressability checking.
7 On the 680 branch, which will become OpenOffice 2.0.
References
[1] Michael D. Ernst. Static and dynamic analysis:
synergy and duality. In Proceedings of WODA
2003, pages 6–9, Portland, Oregon, May 2003.
[2] Eric Estievenart. Valgui, a GPL front-end for Valgrind. http://valgui.sf.net/.
[3] Reed Hastings and Bob Joyce. Purify: Fast detection of memory leaks and access errors. In Proceedings of the Winter USENIX Conference, pages
125–136, San Francisco, California, USA, January
1992.
[4] J. C. Huang. Detection of data flow anomaly
through program instrumentation. IEEE Transactions on Software Engineering, 5(3):226–236, May
1979.
[5] Willett Kempton and Brian A. Wichmann. Runtime detection of undefined variables considered
essential. Software—Practice and Experience,
20(4):391–402, April 1990.
[6] Paul Mackerras. Re: Valgrind for PowerPC. Message to the valgrind-developers mailing list, March
2004.
[7] Jonas Maebe and Koen De Bosschere. Instrumenting self-modifying code. In Proceedings of AADEBUG2003, Ghent, Belgium, September 2003.
[8] Dorit Naishlos. Autovectorisation in GCC. In Proceedings of the 2004 GCC Developers’ Summit, Ottawa, Canada, June 2004.
[9] Nicholas Nethercote. Dynamic Binary Analysis and
Instrumentation. PhD thesis, Computer Laboratory, University of Cambridge, United Kingdom,
November 2004.
[10] Nicholas Nethercote and Julian Seward. Valgrind:
A program supervision framework. In Proceedings
of RV’03, Boulder, Colorado, USA, July 2003.
[11] Openoffice.org issue 20184, 2003.
http://www.openoffice.org/
issues/show_bug.cgi?id=20184.
[12] Parasoft. Automatic C/C++ application testing with
Parasoft Insure++. White paper.
[13] Jens-Heiner Rechtien. Validating and debugging
openoffice.org with valgrind, 2003.
http://tools.openoffice.org/
debugging/usingvalgrind.sxw.
[14] Julian Seward, Nicholas Nethercote, Jeremy
Fitzhardinge, et al. Valgrind.
http://www.valgrind.org/.
[15] Amitabh Srivastava and Alan Eustace. ATOM: A
system for building customized program analysis
tools. In Proceedings of PLDI ’94, pages 196–205,
Orlando, Florida, USA, June 1994.
[16] Standard Performance Evaluation Corporation.
SPEC CPU2000 benchmarks.
http://www.spec.org/.
[17] Jeffrey Stedfast. Alleyoop.
http://alleyoop.sf.net/.
[18] Third Degree User Manual, May 1994.
[19] Josef Weidendorfer. KCachegrind.
http://kcachegrind.sf.net/.