1
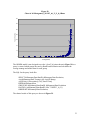
Figure 29
Capacity Curve, Montgomery_WOPC_66_U_N_0_0
300
250
Transit Time (Hrs)
200
150
100
50
0
0
5000
10000
15000
20000
25000
30000
35000
40000
45000
50000
Tonnage (KTons)
tblDetailedData
The WAMBPP creates another Output database table named tblDetailedData. This table
is populated when the WAMBPP is in Production Mode and, like tblSummaryData,
contains data taken from the main WAM output file. The tblDetailedData, however
contains a much more detailed account of what transpired during each WAM run. Over
100 fields of information are included in tblDetailedData.
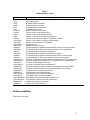
Table 1 shows the types of statistics contained in tblDetailedData, but there are actually
four times as many fields in tblDetailedData as the number of statistics shown in Table 1
because tblDetailedData contains four fields for each statistic. For example, Table 1
shows a Tons statistic. tblDetailedData contains a Tons field for the entire lock and Tons
fields for Chamber 1, Chamber 2, and Chamber 3. This is the case for all other statistics
shown in Table 1. A user does not have to use tblDetailedData to create Tonnage Transit Time curves, so it is not a table that will be used regularly. tblDetailedData is
useful for model validation purposes, during the shipment list calibration process, and
other purposes when the analyst needs to get into the detailed operation of WAM.
34