1
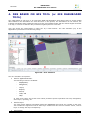
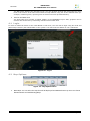
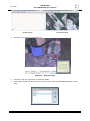
oject: ENORASIS (Grant Agreement282949) “ENVIRONMENTAL OPTIMIZATION OF IRRIGATION MANAGEMENT WITH THE COMBINED USE AND INTEGRATION OF HIGH PRECISION SATELLITE DATA, ADVANCED MODELING, PROCESS CONTROL AND BUSINESS INNOVATION” Funding Scheme: Collaborative Project Theme: FP7-ENV D5.2: ENORASIS User Manual Issued by: DRAXIS ENVIRONMENTAL TECHNOLOGIES Issue date: 01/05/2012 Due date: 30/12/2013 Work Package Leader: DRAXIS ENVIRONMENTAL TECHNOLOGIES Start date of project: 01 January, 2012 Duration: 36 months Document History (Revisions – Amendments) Version and date Changes 01/05/2013 – v0.1 Initial structure 12/09/2013 – v0.2 Added DSS Based on GIS TOOL manual 13/09/2013 – v0.3 Added Android Application User Manual 15/09/2013 – v0.4 Added Web application User Manual 15/09/2013 – v0.5 Added Middleware User Manual 05/10/2013 – v0.6 Revised and added introduction 11/10/2013 – v0.7 Revised Web application chapter 02/12/2013 – v1.0 Final additions Dissemination Level PU Public PP Restricted to other programme participants (including the EC Services) RE Restricted to a group specified by the consortium (including the EC Services) CO Confidential, only for members of the consortium (including the EC) X LEGAL NOTICE Neither the European Commission nor any person acting on behalf of the Commission is responsible for the use, which might be made, of the following information. The views expressed in this report are those of the authors and do not necessarily reflect those of the European Commission © ENORASIS Consortium, 2013 Reproduction is authorised provided the source is acknowledged FP7-ENV “ENORASIS” D5.2 ENORASIS user manual Table of Contents 1. EXECUTIVE SUMMARY _______________________________________________________ 1 2. WEB APPLICATION __________________________________________________________ 2 2.1 Registration _____________________________________________________________________ 2 2.2 Login screen ____________________________________________________________________ 3 2.3 Successful login __________________________________________________________________ 3 2.4 Generic UI and functionalities ______________________________________________________ 5 2.5 Crop types management (admin)____________________________________________________ 8 2.6 Soil types management (admin) ____________________________________________________ 9 2.7 Sensor types management (admin) _________________________________________________ 10 2.8 Users management (admin) _______________________________________________________ 12 2.9 Insert/Update Field______________________________________________________________ 13 2.10 Field view ____________________________________________________________________ 15 2.11 Insert/Update Plot_____________________________________________________________ 17 2.12 Plot View ____________________________________________________________________ 20 2.13 Insert/Update Valves __________________________________________________________ 22 2.14 Valve view ___________________________________________________________________ 23 2.15 Insert/Update Sensors _________________________________________________________ 23 2.16 Sensor view __________________________________________________________________ 24 2.17 Manually insert data for sensor __________________________________________________ 25 2.18 Manually insert data for valve ___________________________________________________ 26 2.19 Assign rights to Users __________________________________________________________ 27 3. MIDDLEWARE _____________________________________________________________ 29 3.1 Login Screen ___________________________________________________________________ 29 3.2 Main Screen ___________________________________________________________________ 29 3.3 Editing Coordinator Information (Details View) _______________________________________ 29 3.4 Edit Coordinator ________________________________________________________________ 30 3.5 Changing Modes ________________________________________________________________ 30 3.6 WhiteListing Devices _____________________________________________________________ 31 3.7 Scanning the Network ___________________________________________________________ 32 3.8 Network View __________________________________________________________________ 33 4. DSS BASED ON GIS TOOL (or GIS DASHBOARD TOOL) _____________________________ 35 4.1 Login _________________________________________________________________________ 36 4.2 Map Options ___________________________________________________________________ 36 4.3 Navigation _____________________________________________________________________ 38 4.4 Layers ________________________________________________________________________ 38 Version – issue date: 1.0 – 2/12/2013 Page i FP7-ENV 4.4.1 4.4.2 4.5 “ENORASIS” D5.2 ENORASIS user manual Add Enorasis Layer ____________________________________________________________________ 39 View Enorasis Layer Details ______________________________________________________________ 40 Reports ________________________________________________________________________ 1 4.5.1 4.5.2 4.5.3 4.5.4 4.5.5 4.5.6 View Sensors Report ____________________________________________________________________ 1 View Valves Report _____________________________________________________________________ 1 View DSS Report _______________________________________________________________________ 1 View Alerts Report ______________________________________________________________________ 2 View Water Report _____________________________________________________________________ 2 View Advanced Report __________________________________________________________________ 3 4.6 Search _________________________________________________________________________ 3 4.7 Tools __________________________________________________________________________ 1 4.8 Help ___________________________________________________________________________ 2 5. ANDROID APPLICATION ______________________________________________________ 4 5.1 Login screen and main menu _______________________________________________________ 4 5.2 View Weather Forecast ___________________________________________________________ 5 5.3 View Reports ____________________________________________________________________ 5 5.4 Retrieve Alarms__________________________________________________________________ 6 5.5 Create field _____________________________________________________________________ 7 5.6 Search field _____________________________________________________________________ 8 5.7 Create plot______________________________________________________________________ 9 5.8 Search plot ____________________________________________________________________ 10 5.9 Create and assign Sensors or Valves ________________________________________________ 12 5.10 Search Sensor_________________________________________________________________ 13 5.11 Search valve __________________________________________________________________ 14 5.12 Manual inserts of data _________________________________________________________ 15 Version – issue date: 1.0 – 2/12/2013 Page ii FP7-ENV “ENORASIS” D5.2 ENORASIS user manual List of figures Figure Figure Figure Figure Figure Figure Figure Figure Figure Figure Figure Figure Figure Figure Figure Figure Figure Figure Figure Figure Figure Figure Figure Figure Figure Figure Figure Figure Figure Figure Figure Figure Figure Figure Figure Figure Figure Figure Figure Figure Figure Figure Figure Figure Figure Figure Figure Figure Figure Figure Figure Figure Figure 1 – Home screen ................................................................................................................. 2 2 – Registration form ........................................................................................................... 2 3 – User Type options .......................................................................................................... 3 4 – Confirmation message of successful registration ................................................................ 3 5 – Login form .................................................................................................................... 3 6 - Login error .................................................................................................................... 3 7 – Home screen of successful login – regular User ................................................................. 4 8 - Home screen of successful login - admin User.................................................................... 4 9 - My Account ................................................................................................................... 5 10 - Overview ..................................................................................................................... 5 11 - Read SOS Sensors ........................................................................................................ 6 12 - DSS Execution - Valves actions ...................................................................................... 6 13 - Rest API ...................................................................................................................... 7 14 - DSS Calculation ........................................................................................................... 7 15 – Map ........................................................................................................................... 7 16 - Map options ................................................................................................................. 8 17 - Map zooming ............................................................................................................... 8 18 - Crop types management ............................................................................................... 8 19 – Create Crop type ......................................................................................................... 9 20 – Delete Crop type.......................................................................................................... 9 21 – Soil types management ................................................................................................ 9 22 – Create Soli type ......................................................................................................... 10 23 – Delete Soil type ......................................................................................................... 10 24 - Sensor types management .......................................................................................... 11 25 – Create Sensor type .................................................................................................... 11 26 – Delete Sensor type .................................................................................................... 12 27 – User management ..................................................................................................... 12 28 – Delete confirmation .................................................................................................... 13 29 – My Fields .................................................................................................................. 13 30 – Create Field .............................................................................................................. 13 31 – Drawing the field ....................................................................................................... 14 32 – Drawing finished ........................................................................................................ 14 33 – My Fields .................................................................................................................. 14 34 – Field view ................................................................................................................. 16 35 – Related Plots ............................................................................................................. 17 36 – Create plot ................................................................................................................ 18 37 – Updated Related Plots ................................................................................................ 18 38 - Delete Plot ................................................................................................................ 19 39 – Plot View .................................................................................................................. 20 40 - View DSS Details ........................................................................................................ 21 41 - Previous DSS Results .................................................................................................. 21 42 - DSS Inputs ................................................................................................................ 22 43 - WRF DSS Inputs ........................................................................................................ 22 44 – Related Valves........................................................................................................... 22 45 – Create Valve ............................................................................................................. 23 46 – Updated Related Valves .............................................................................................. 23 47 - Related Valves ........................................................................................................... 23 49 – Related Sensors......................................................................................................... 24 50 – Create Sensor ........................................................................................................... 24 51 – Updated Related Sensors ............................................................................................ 24 52 – Related Sensors......................................................................................................... 24 53 – Sensor data .............................................................................................................. 25 54 – Related Sensors......................................................................................................... 26 Version – issue date: 1.0 – 2/12/2013 Page iii FP7-ENV Figure Figure Figure Figure Figure Figure Figure Figure Figure Figure Figure Figure Figure Figure Figure Figure Figure Figure Figure Figure Figure Figure Figure Figure Figure Figure Figure Figure Figure Figure Figure Figure Figure Figure Figure Figure Figure Figure Figure Figure Figure Figure Figure Figure Figure Figure Figure Figure Figure Figure Figure Figure Figure Figure “ENORASIS” D5.2 ENORASIS user manual 55 - Add sensor measurements .......................................................................................... 26 56 – Related Valves........................................................................................................... 27 57 – Add water irrigation amount ........................................................................................ 27 58 - Field Permissions ........................................................................................................ 27 59 – Updated Field Permissions .......................................................................................... 28 60 - Main Login Screen ...................................................................................................... 29 61 - Home Screen ............................................................................................................. 29 62 - Edit coordinator Details Screen .................................................................................... 30 63 - Edit Coordinator Screen .............................................................................................. 30 64 - Change Mode Screen .................................................................................................. 31 65 – Whitelisting Devices ................................................................................................... 32 66 – Scanning Network ...................................................................................................... 32 67 – Scan Results View ...................................................................................................... 33 68 – Network View ............................................................................................................ 34 69 - User Interface ............................................................................................................ 35 70 - Log in ....................................................................................................................... 36 71 - Map Options Menu ...................................................................................................... 36 72 - Overview Map ............................................................................................................ 37 73 - Layer Order ............................................................................................................... 37 74 - Navigation Menu ........................................................................................................ 38 75 - Layers Menu .............................................................................................................. 38 76 - Functionalities of Layer’s legend ................................................................................... 39 77 – ArcGIS Layer ............................................................................................................. 39 78 – Available Layers ........................................................................................................ 40 79 – Add Layer Button ....................................................................................................... 40 80 – Layer Details ............................................................................................................. 40 81 – Feature Layer Details ................................................................................................. 41 82 – Reports Menu .............................................................................................................. 1 83 – Sensors Data Report .................................................................................................... 1 84 – Valves Report .............................................................................................................. 1 85 – DSS Report ................................................................................................................. 1 86 – Alarms Report ............................................................................................................. 2 87 – Advanced Report ......................................................................................................... 3 88 – Search Menu ............................................................................................................... 3 89 - Identify ....................................................................................................................... 4 90 - Advanced Search ......................................................................................................... 4 91 - Advanced Search Results .............................................................................................. 5 92 – Tools Menu ................................................................................................................. 1 93 - Print ........................................................................................................................... 1 94 - Measure ...................................................................................................................... 1 95 - Draw .......................................................................................................................... 2 96 – Help Menu .................................................................................................................. 2 97 – Irrigation Management ................................................................................................. 2 98 - About ......................................................................................................................... 3 99 – Help ........................................................................................................................... 3 100 - Login and Main menu screens ...................................................................................... 4 101 - Weather Prediction screen ........................................................................................... 5 102 - Reports menu and Events screens ................................................................................ 6 103 - Alarms screen ............................................................................................................ 7 104 - Field data and GPS points screens ................................................................................ 8 105 - Field list and Field Options screens ............................................................................... 9 106 - Plot Data and Plot Configuration screens ..................................................................... 10 107 - Plot list and Plot map screens ..................................................................................... 11 108 - Plot Options and Irrigation Plan screens ...................................................................... 12 Version – issue date: 1.0 – 2/12/2013 Page iv FP7-ENV Figure Figure Figure Figure 109 110 111 112 - “ENORASIS” D5.2 ENORASIS user manual Sensor Data and Set Plots screens .............................................................................. 13 Sensor Options and Measure Options screens............................................................... 14 Valve Options and Valve Watering screen .................................................................... 15 New Sensor Measure Creation .................................................................................... 16 Version – issue date: 1.0 – 2/12/2013 Page v FP7-ENV “ENORASIS” D5.2 ENORASIS user manual 1. EXECUTIVE SUMMARY This deliverable conaints the ENORASIS user manuals presenting in detail the functionalities of the system and guiding its users through the different modules that were developed by the consortium during WPs 3, 4, and 5. The manuals in this deliverable refer to the final system and were written in English. Screenshots were also taken from the English version of the various applications developed for ENORASIS. A detailed user manual is provided for each created application that provides a “User interface” which are: 1. 2. 3. 4. Web application Middleware DSS based on GIS (GIS dashboard) Android application Version – issue date: 1.0 – 02/12/2013 Page 1 “ENORASIS” D5.2 ENORASIS user manual FP7-ENV 2. WEB APPLICATION The ENORASIS web application can be accessed through the URL http://app.enorasis.eu/ using any web browser. Home screen is shown in Figure 1. ENORASIS project is described in a few sentences and the Users have two options, to login in order to access the web application or to register and get a new account. Figure 1 – Home screen The About the Project menu button will lead you to the ENORASIS Project web site. 2.1 Registration Registration form is shown Figure 2. In order to register, the User need to fill all required fields: Name E-mail Password Retype password Phone User type If any filed remain empty, Save changes button will not take action. Figure 2 – Registration form The User can select one of the predifined options for User Type – shown on Figure 3. Version – issue date: 1.0 – 02/12/2013 Page 2 “ENORASIS” D5.2 ENORASIS user manual FP7-ENV Figure 3 – User Type options After successful registration - Figure 4, the User can log in to ENORASIS system. Figure 4 – Confirmation message of successful registration 2.2 Login screen In order to access ENORASIS system the User need to provide correct email and password. If the User has forgotten his/her valid password, he/she can reset password by clicking on Reset password button. New password will be sent on the User email. Figure 5 – Login form If credentials are wrong, ENORASIS system will generate Error shown in Figure 6. Figure 6 - Login error The User may choose to create a new account by clicking on Create new account button. New account procedure is already described in chapter 2.1. The User may also reset password in case that he/she has forgotten it. A new password will be send on e-mail by pressing the Reset password button. 2.3 Successful login After successful login to the system the screen appears as shown in Figure 7 in case that you are a regular User or Figure 8 if you are an administrator. Version – issue date: 1.0 – 02/12/2013 Page 3 FP7-ENV “ENORASIS” D5.2 ENORASIS user manual Figure 7 – Home screen of successful login – regular User Figure 8 - Home screen of successful login - admin User By clicking on the My account button in the top right corner, the User has the ability to change his/her profile data - Figure 9 Version – issue date: 1.0 – 02/12/2013 Page 4 FP7-ENV “ENORASIS” D5.2 ENORASIS user manual Figure 9 - My Account 2.4 Generic UI and functionalities After successful login the accordion right menu will appear showing brief information for the following options: Overview - Figure 10 Read SOS sensors - Figure 11 DSS executions - Valves actions - Figure 12 Universal connector - Error! Reference source not found. Rest API - Figure 13 DSS Calculations - Figure 14 Figure 10 - Overview Version – issue date: 1.0 – 02/12/2013 Page 5 FP7-ENV “ENORASIS” D5.2 ENORASIS user manual Figure 11 - Read SOS Sensors Figure 12 - DSS Execution - Valves actions Version – issue date: 1.0 – 02/12/2013 Page 6 FP7-ENV “ENORASIS” D5.2 ENORASIS user manual Figure 13 - Rest API Figure 14 - DSS Calculation One of the most important parts of this web application is the map - Figure 15. User can choose between different levels of layers by clicking on the cross sign in the right corner of the map and checking/unchecking appropriate boxes - Figure 16. Figure 15 – Map Version – issue date: 1.0 – 02/12/2013 Page 7 FP7-ENV “ENORASIS” D5.2 ENORASIS user manual Figure 16 - Map options Zooming in and zooming out can be done by clicking on the “+” and “–” signs in the left corner, or by scrolling the mouse - Figure 17. User can move the map by clicking and dragging the map to the wanted position. Figure 17 - Map zooming 2.5 Crop types management (admin) The system administrator has the ability to create, edit or delete the Crop type. Figure 18 - Crop types management The Create button is located in the top right corner - Figure 18. The Create form design is shown in Figure 19. Version – issue date: 1.0 – 02/12/2013 Page 8 FP7-ENV “ENORASIS” D5.2 ENORASIS user manual Figure 19 – Create Crop type The only field which needs to be entered is the Crop name. The administrator can change the Crop type by clicking on the Edit button located at the end of the line with the Crop name. The Crop can be deleted by the administrator by clicking on the Delete button. Message “Are you sure you want to delete this record” will appear on the screen – Figure 20. The administrator needs to confirm his decision by pressing the Delete record button. Figure 20 – Delete Crop type 2.6 Soil types management (admin) The system administrator has the privileges to create, edit or delete the Soil type. Figure 21 – Soil types management Version – issue date: 1.0 – 02/12/2013 Page 9 “ENORASIS” D5.2 ENORASIS user manual FP7-ENV The Create button is located in the top right corner - Figure 21. The Create form design is shown in Figure 22. All form fields are required: Name Bulk Density Saturation Capacity The administrator can change the Soil type data by clicking on the Edit button, which is located at the end of the line of its Soil type’s name. The Soil type can be deleted by the administrator by clicking on the Delete button. Message “Are you sure you want to delete this record?” will appear on the screen – Figure 23. The administrator needs to confirm his decision by pressing the Delete record button. Figure 22 – Create Soli type Figure 23 – Delete Soil type 2.7 Sensor types management (admin) The system administrator has the ability to create, edit or delete the Sensor type. Version – issue date: 1.0 – 02/12/2013 Page 10 “ENORASIS” D5.2 ENORASIS user manual FP7-ENV Figure 24 - Sensor types management The Create button is located in the top right corner - Figure 24. Create form design is shown in Figure 25. The required fields are: Name Observed Property The administrator can change the User data by clicking on the Edit button located at the end of the line of its sensor type’s name. Figure 25 – Create Sensor type The Sensor type can be deleted by the administrator by clicking on the Delete button. Message “Are you sure you want to delete this record?” will appear on the screen – Figure 26. The administrator needs to confirm his decision by pressing the Delete record button. Version – issue date: 1.0 – 02/12/2013 Page 11 FP7-ENV “ENORASIS” D5.2 ENORASIS user manual Figure 26 – Delete Sensor type 2.8 Users management (admin) The system administrator has privileges to create, edit or delete the User. The Users management page is shown in Figure 27. Figure 27 – User management The Create button is located in the top right corner - Figure 27. The Create User procedure is the same as the Registration procedure described in chapter 2.1. The administrator can change the User data by clicking on the Edit button located at the end of the line with the name of the User. The User can be deleted by the administrator by clicking on the Delete button. Message “Are you sure you want to delete this record?” will appear on the screen – Figure 28. The administrator needs to confirm his decision by pressing the Delete record button. Version – issue date: 1.0 – 02/12/2013 Page 12 “ENORASIS” D5.2 ENORASIS user manual FP7-ENV Figure 28 – Delete confirmation 2.9 Insert/Update Field The User can create and update the Fields by clicking on the My Fields menu option, the My Fields grid will appear as shown in Figure 29. Figure 29 – My Fields In order to create a new field, the User needs to click on the Create new field button in the right corner of the screen. New Create Field form will appear as shown in Figure 30. The User is expected to draw the shape of the field on exact location by clicking on the Draw button located under the map. The required fields are: Name Size Figure 30 – Create Field Version – issue date: 1.0 – 02/12/2013 Page 13 “ENORASIS” D5.2 ENORASIS user manual FP7-ENV Optional fields are: Altitude above sea level Sensors server address Valves server address Drawing the Field is very simple. The User needs to place the mouse cursor at the desired place and to click on the left mouse button. When the shape of the Field is satisfactory the User just needs to double click on the left mouse button. In the Modify mode - Figure 31 – the User can change the shape of the Field by clicking on desired point and dragging it to the correct place. If any of points is unnecessary the User can simply delete it by placing mouse cursor over that point and clicking the Delete button on the keyboard. Figure 31 – Drawing the field If the User selects and drags the light colored point, then a new one will appear in the middle of the line, between light colored point and its neighbors and light colored point will become darker. When the User is satisfied with the shape and position of the field he/she just needs to press the Done button or the Reset button if he/she is completely unsatisfied. Figure 32 – Drawing finished If any changes need to be done the User can again switch to the Modify mode by clicking on the Modify button. The new field will appear in the My Fields grid - Figure 33. Figure 33 – My Fields If the User is the owner of the Field he/she can also delete the field by clicking on the Delete button located at the end of the line of its field’s name. Version – issue date: 1.0 – 02/12/2013 Page 14 FP7-ENV “ENORASIS” D5.2 ENORASIS user manual 2.10 Field view In order to view the specific Field, the User needs to select the My Fields in the menu and then to select an appropriate Field. Web application will show five grids: Map of the Field, Related Plots, Related Sensors, Related Valves and Field Permissions as shown in Figure 34. Version – issue date: 1.0 – 02/12/2013 Page 15 FP7-ENV “ENORASIS” D5.2 ENORASIS user manual Figure 34 – Field view Version – issue date: 1.0 – 02/12/2013 Page 16 “ENORASIS” D5.2 ENORASIS user manual FP7-ENV The Map of the Field shows all the details about the Field. The User has two buttons: Edit for editing the shape and the field details and Delete button to delete the selected Field. The Related Plots grid offers the possibility to the User to turn on/off automatic irrigation, create, edit or delete the plot, or to click on the name of the plot and view the plot. The Related Sensors and the Related Valves are similar with their functionalities. The User can create, edit or delete the sensor/valve, or to click on the name of the sensor/valve and view them. The User can use the Field Permissions to give a privilege to any User to Read/Write or just to Read selected plot. 2.11 Insert/Update Plot In order to create the Plot, the User needs to select the Field where the Plot is located and to click on the Create button in the Related Plots grid - Figure 35 Figure 35 – Related Plots The User is expected to draw the shape of the field on exact location by clicking on the Draw button located under the map. Drawing the Plot is very simple. The User needs to place the mouse cursor at the desired place and to click on the left mouse button. When the shape of the Plot is satisfactory the User just needs to double click on the left mouse button. In the Modify mode the User can change the shape of the Plot by clicking on desired point and dragging it to the correct place. If any of points is unnecessary the User can simply delete it by placing mouse cursor over that point and clicking the Delete button on the keyboard. If the User selects and drags the light colored point, then a new one will appear in the middle of the line, between the light colored point and its neighbors and light colored point will become darker. When the User is satisfied with the shape and the position of the Plot he/she just needs to press the Done button or the Reset button if he/she is completely unsatisfied. The required fields are: Name Crop Type – drop list Soil Type – drop list Channel Type – drop list Channel Length – drop list Irrigation Method Efficiency – drop list Size in square meters Slope in degrees (degrees) Day of year of sowing (0-365) Water price (Euro/m³) Crop yield price (Euro/t) Yield without water stress (t/ha) Costs of irrigation system work (Euro/m³) Other costs of production minus subsidies (Euro/ha) Minimal profitable amount of irrigation (mm) Harvest day (0-365) Mandatory field is: Enable automatic irrigation. The new Plot will be shown in the Related Plots grid as shown in Figure 37. The User has option to change the shape of the Plot or any value from the fields listed above by clicking on the Edit button in the Related Plots grid. The User has also the ability to delete the Plot by clicking on the Delete button as Version – issue date: 1.0 – 02/12/2013 Page 17 FP7-ENV “ENORASIS” D5.2 ENORASIS user manual shown in Figure 37. If the User has decided to delete the Plot he/she needs to confirm his/her decision by pressing the Delete record button – Figure 38. Figure 36 – Create plot Figure 37 – Updated Related Plots Version – issue date: 1.0 – 02/12/2013 Page 18 FP7-ENV “ENORASIS” D5.2 ENORASIS user manual Figure 38 - Delete Plot Version – issue date: 1.0 – 02/12/2013 Page 19 FP7-ENV “ENORASIS” D5.2 ENORASIS user manual 2.12 Plot View Figure 39 – Plot View Version – issue date: 1.0 – 02/12/2013 Page 20 FP7-ENV “ENORASIS” D5.2 ENORASIS user manual In order to view the specific Plot, the User needs to click on the My Fields in the menu, to select an appropriate Field and then to click on the Plot. Web application will show five grids: Map of the Plot, DSS Results, Weather Forecast, Related Sensors and Related Valves as shown in Figure 39. The Map of the Plot shows all details about the Plot. The User has four buttons: Edit for editing the shape and the details, End Season to indicate that season is over, Start Season to indicate that season has just begun and the Delete button to delete the selected Plot. DSS Results shows the results of the Decision Support System for current day. Clicking the View DSS Details button will open page like the one shown in Figure 40. The User can go back by clicking on Show plot details button in upper right corner, or to expand grids by clicking on the Show buttons. Figure 40 - View DSS Details The expanded grids will be similar to those shown in Figure 41,Figure 42 and Figure 43. Figure 41 - Previous DSS Results The Previous DSS Results grid shows the DSS results for a previous period. The DSS Input grid shows the inputs for the DSS system coming from sensor measurements deployed from in the fields and the WRF DSS Inputs show the inputs for the DSS system coming from the weather forecast. The input data can be exported by clicking on Export DSS input data or Export WRF data buttons. Version – issue date: 1.0 – 02/12/2013 Page 21 “ENORASIS” D5.2 ENORASIS user manual FP7-ENV Figure 42 - DSS Inputs Figure 43 - WRF DSS Inputs 2.13 Insert/Update Valves The User firstly needs to select a desired Field and belonging Plot. The Related Valves grid is located at the bottom of the page - Figure 44. Figure 44 – Related Valves After clicking on the Create button the Create Valves form will be open as it shown in Figure 45. The required fields are: Name Valve type – drop list Serial number API key Water flow Diameter The mandatory boxes are: Is remotely handled Takes water measurements Plots to which this valve provides data Version – issue date: 1.0 – 02/12/2013 Page 22 FP7-ENV “ENORASIS” D5.2 ENORASIS user manual Figure 45 – Create Valve After filling all the fields and saving the changes, then a new valve will be listed in the Related Valves grid. Figure 46 – Updated Related Valves 2.14 Valve view The User firstly needs to select a desired Field and belonging Plot. The Related Valves grid is located at the bottom of the page – Figure 47 - Related Valves Figure 47 - Related Valves To view the valve readings the User needs to click on its name. The Valve readings are listed as graph as well as table. The User can choose the date interval to display or to export as CSV file. 2.15 Insert/Update Sensors The User firstly needs to select a desired Field and belonging Plot. The Related Sensor grid is located at the bottom of the page - Figure 48. Version – issue date: 1.0 – 02/12/2013 Page 23 FP7-ENV “ENORASIS” D5.2 ENORASIS user manual Figure 48 – Related Sensors After clicking on the Create button the Create Sensor form will be open as it shown in Figure 49. Figure 49 – Create Sensor After filling in all the fields and saving the changes the new sensor will be listed in the Related Sensors grid - Figure 50. Figure 50 – Updated Related Sensors 2.16 Sensor view The User firstly needs to select a desired Field and belonging Plot. The Related Sensor grid is located at the bottom of the page – Figure 51 Figure 51 – Related Sensors Version – issue date: 1.0 – 02/12/2013 Page 24 FP7-ENV “ENORASIS” D5.2 ENORASIS user manual To view the sensor readings the User needs to click on its name. The Sensor readings are listed as graph as well as table. The User can choose the date interval to display or to export as CSV file - Figure 52 – Sensor data Figure 52 – Sensor data 2.17 Manually insert data for sensor If for some reason the sensor readings cannot be sent automatically, the User can do that manually. The User firstly needs to select a desired Field and belonging Plot. The Related Sensor grid is located at the bottom of the page – Figure 53. In order to insert the data manually the User needs to click on the Add measurements button. The User can enter the sensor readings manually on hourly base for that day as it is shown in Figure 54. Version – issue date: 1.0 – 02/12/2013 Page 25 FP7-ENV “ENORASIS” D5.2 ENORASIS user manual Figure 53 – Related Sensors Figure 54 - Add sensor measurements 2.18 Manually insert data for valve If the User has irrigated manually, he needs to fill the data for the water irrigation amount. The User firstly needs to select a desired Field and belonging Plot. The Related Valves grid is located at the bottom of the page – Figure 55. In order to insert the data manually the User needs to click on the Add water irrigation amount button. The User needs to enter the data on hourly base for that day as it is shown in Figure 56. Version – issue date: 1.0 – 02/12/2013 Page 26 FP7-ENV “ENORASIS” D5.2 ENORASIS user manual Figure 55 – Related Valves Figure 56 – Add water irrigation amount 2.19 Assign rights to Users The User firstly needs to select a desired Field. The Field Permissions grid is located at the bottom of the page - Figure 57. On the Field permissions form the User needs to fill in the email of the person that he/she wants to give an access to the selected field. One of the predefined permission options needs to be selected from the drop down menu and finally the Assign button needs to be clicked. Figure 57 - Field Permissions Granted User, its email and role will appear in the Field Permissions grid - Figure 58. Version – issue date: 1.0 – 02/12/2013 Page 27 FP7-ENV “ENORASIS” D5.2 ENORASIS user manual Figure 58 – Updated Field Permissions Version – issue date: 1.0 – 02/12/2013 Page 28 “ENORASIS” D5.2 ENORASIS user manual FP7-ENV 3. MIDDLEWARE 3.1 Login Screen Currently the system supports English and Turkish but has capability to support multiple languages. Figure 59 - Main Login Screen 3.2 Main Screen The Main screen has a very simple and easy to use interface. The interface will only show the coordinators that the User has access to. It will also indicate which ones are online by highlighting the blue drop of water on the screen. If the coordinator is offline, this image will be faded to grey. Click on one of the coordinators to see the devices and change settings of the coordinator. Online Indicator Figure 60 - Home Screen 3.3 Editing Coordinator Information (Details View) This screen is used to update the Basic coordinator information such as Name, IEEE Address (not required), IMEI number of the GSM Modem, notes and other information. Caution: IMEI number is critical, unless it’s defined correctly, the system will not allow this device to connect to the server. Version – issue date: 1.0 – 02/12/2013 Page 29 “ENORASIS” D5.2 ENORASIS user manual FP7-ENV Figure 61 - Edit coordinator Details Screen 3.4 Edit Coordinator This screen enables the User to perform operations such as change mode, change time, scan the network, and purge all devices on the network, change settings and whitelist devices to enable them to join the network. Figure 62 - Edit Coordinator Screen 3.5 Changing Modes The system has two modes. A. Running Mode: Where the system will start sending and recording logs. B. Commissioning mode: Which is used at initial system configuration/scanning and commissioning. Version – issue date: 1.0 – 02/12/2013 Page 30 FP7-ENV “ENORASIS” D5.2 ENORASIS user manual This Screen will allow the User to switch between these two modes. Once the mode change button is clicked, the system will ask the User to wait for an “ACK”. This is basically an acknowledgement message from the system saying that the coordinator actually received the “changemode” request. Unless an “ACK” is received, the User will get a “command failed message” and will have to repeat the request. Figure 63 - Change Mode Screen 3.6 WhiteListing Devices Before performing a network Scan, all devices that will be connected to the coordinator will have to be WhiteListed. This function is required for the controlled configuration of the network, preventing other unwanted devices nearby from connecting to the network. This screen allows the User to add new devices to the list of acceptable devices using their IEEE addresses which are printed on the back of the device enclosures. Version – issue date: 1.0 – 02/12/2013 Page 31 FP7-ENV “ENORASIS” D5.2 ENORASIS user manual Figure 64 – Whitelisting Devices 3.7 Scanning the Network The Scan Network screen lists a series of devices, indicating their types and IEEE addresses. At the initial screen, the User will see this information in small boxes (one per device). Figure 65 – Scanning Network Version – issue date: 1.0 – 02/12/2013 Page 32 FP7-ENV “ENORASIS” D5.2 ENORASIS user manual Upon a successful scan, the boxes of information will “Blossom” as in Figure 66, indicating that these devices actually responded to the scan request and are available for communication. Figure 66 – Scan Results View 3.8 Network View The Network View is a useful administration tool to view the communication details of the network. It will tell the User, the total number of packets received and the number that failed, as well as an overall percentage of dropped network packets. Upon clicking on the Request Network Status button, the User will be asked for a confirmation. Once the User confirms, s/he will be required to wait for an “ACK”. After the ACK is received, the User will have to click on the “Refresh” link to update the view with the new information. Caution: This command returns heavy traffic, and the User may have to repeatedly request until an ack is received. Version – issue date: 1.0 – 02/12/2013 Page 33 FP7-ENV “ENORASIS” D5.2 ENORASIS user manual Figure 67 – Network View Version – issue date: 1.0 – 02/12/2013 Page 34 “ENORASIS” D5.2 ENORASIS user manual FP7-ENV 4. DSS BASED ON GIS TOOL (or GIS DASHBOARD TOOL) The “DSS Based on GIS Tool” is an interactive WEB GIS application that allows Users to access spatial data related to the information for each land zone in the system, the information on the sensors, the irrigation knowledge base parameters derived from using FAO56 model and the meteorological forecasts in a map, in order to create the daily individual irrigation plan for each case. User can access the “DSS Based on GIS Tool” by a web browser. The User Interface (UI) of the application is presented in the following image. Figure 68 - User Interface The UI is divided in four panels: Panel 1: Applicationmenus. The following menus are available: - MapOptions; Navigations; Layers; Reports; Search; Tools; and Help. In each menu there are several tools which performs specific operations like map navigations, add a layer, reporting, etc. Panel2: Layers The Layer panel displays information about the ENORASIS layers that are overlaid on the map. This includes the legend as well as other layer-related tools like zoom to feature extent, remove layer or change the layer transparency. Panel3: Map Version – issue date: 1.0 – 02/12/2013 Page 35 FP7-ENV “ENORASIS” D5.2 ENORASIS user manual The Map panel displays the interactive map. You can navigate through the map using the menu tools or the mouse. It can also interact with the map features using one of the available tools (for example, measuring tools, reporting tools or feature info tools presented below). Panel 4: Grid Data View The Grid Data View provides a tabular display of the ENORASIS layer’s data; graphics can be selected and zoomed to by interacting with the Feature Data Grid. 4.1 Login In order to obtain full access to the “DSS Based on GIS Tool”, the User has to login using his email and password provided by the administrator of the system. The data is filtered based on User credentials. Figure 69 - Log in 4.2 Map Options Figure 70 - Map Options Menu Base Maps: You can select the map that will be displayed as ENORASIS base map. User can choose between Roads and Satellite Bing Maps. Version – issue date: 1.0 – 02/12/2013 Page 36 “ENORASIS” D5.2 ENORASIS user manual FP7-ENV SatelliteBaseMap RoadBaseMap Overview map: Display an overview map. Figure 71 - Overview Map Full Screen: Run the application in Full Screen Mode. Layer Order: Provides an interface to change the order of the available ENORASIS layers on the map. Figure 72 - Layer Order Version – issue date: 1.0 – 02/12/2013 Page 37 FP7-ENV 4.3 “ENORASIS” D5.2 ENORASIS user manual Navigation Figure 73 - Navigation Menu 4.4 Pan: Move map Right, Left, Up, Down. Zoom in: Zoom in or out in the map. Full Extent: Change map extents to full extent. Zoom to XY: Display the coordinates of the map center. You can also enter coordinates in order to navigate to that location. Bookmarks: Bookmarks are predefined map extents of ENORASIS pilots. When you select one bookmark the map zooms to selected ENORASIS pilot extent. Map Rotation: Provide an interface in order to rotate the map. Map Scale: An interactive scale bar. The units are automatically updated each time the map changes. Layers Figure 74 - Layers Menu Available Layers: Provide a list of ENORASIS related layers (Fields, Plots, Sensors, Weather Forecast Today, Weather Forecast Tomorrow and Weather Forecast Day After Tomorrow). You can select an ENORASIS layer in order to be overlaid in the map. The legend is also displayed in Panel 2. From Panel 2, User can remove the ENORASIS layer from the map, open the feature data grid, show the layer’s legend, auto zoom to feature clicking on feature details, change the transparency of the layer using the slider in the ENORASIS layer name or toggle the visibility of the layer. Version – issue date: 1.0 – 02/12/2013 Page 38 FP7-ENV “ENORASIS” D5.2 ENORASIS user manual Figure 75 - Functionalities of Layer’s legend Add ArcGIS Layer: You provide an ArcGIS REST url of a map Service. The map is updated with the requested map layer. Add shp as Graphic: You can add a shapefile stored in your computer to the map viewer. You have to select a zipped file. 4.4.1 Figure 76 – ArcGIS Layer Add Enorasis Layer In order to add an ENORASIS Layer, User has to select the desirable layer (Fields, Plots, Sensors, Weather Forecast Today, Weather Forecast Tomorrow or Weather Forecast Day After Tomorrow) from the drop list in Layers menu and then to click the “add layer button”. The ENORASIS layer is added on the map and its details (feature details and legend) are shown on panel 2. Version – issue date: 1.0 – 02/12/2013 Page 39 FP7-ENV “ENORASIS” D5.2 ENORASIS user manual Figure 78 – Add Layer Button Figure 77 – Available Layers Figure 79 – Layer Details 4.4.2 View Enorasis Layer Details After ENORASIS Layer is added, User can see details about it on panel 2 in table record format or on panel 4 in row format. Clicking on a feature on panel 2, the map zooms on it. Alternatively, User can select a record from tabular view and then click on “Zoom to Selected” button. Version – issue date: 1.0 – 02/12/2013 Page 40 FP7-ENV “ENORASIS” D5.2 ENORASIS user manual Figure 80 – Feature Layer Details Version – issue date: 1.0 – 02/12/2013 Page 41 FP7-ENV 4.5 “ENORASIS” D5.2 ENORASIS user manual Reports From Reports Menu User can get reports for Sensors and Valves data, DSS results, Alerts, Irrigation Water or sensor’s history data. Figure 81 – Reports Menu 4.5.1 View Sensors Report Figure 82 – Sensors Data Report Version – issue date: 1.0 – 02/12/2013 Page 1 FP7-ENV 4.5.2 “ENORASIS” D5.2 ENORASIS user manual View Valves Report Figure 83 – Valves Report 4.5.3 View DSS Report Figure 84 – DSS Report Version – issue date: 1.0 – 02/12/2013 Page 1 FP7-ENV 4.5.4 “ENORASIS” D5.2 ENORASIS user manual View Alerts Report Figure 85 – Alarms Report 4.5.5 View Water Report Figure 86 – Water Report Version – issue date: 1.0 – 02/12/2013 Page 2 FP7-ENV 4.5.6 “ENORASIS” D5.2 ENORASIS user manual View Advanced Report Figure 87 – Advanced Report 4.6 Search Figure 88 – Search Menu Identify: This tool allows you to click on the map in order to get information about features in that location. Identify works on a specific ENORASIS layer which is the active layer. The active layer can be set in the advanced search tool which is located in Panel 2. Version – issue date: 1.0 – 02/12/2013 Page 3 FP7-ENV “ENORASIS” D5.2 ENORASIS user manual Figure 89 - Identify Advanced Search: This tool is located in Panel 2. It provides an interface in order to Query ENORASIS layer features using attributes or spatial selection. - Attribute query: This tool allows you to create a SQL query using the layer attributes (attribute list is automatically populated when selected the target layer for the layer list). Spatial query: This tool provides you with several tools to interact with the map in order to select features. These features include Point, Line Polygon and Rectangle selection. Attribute Query Spatial Selection Figure 90 - Advanced Search Version – issue date: 1.0 – 02/12/2013 Page 4 FP7-ENV “ENORASIS” D5.2 ENORASIS user manual The results of the selection are highlighted on the map. A table with the selected features is also automatically displayed. Figure 91 - Advanced Search Results Version – issue date: 1.0 – 02/12/2013 Page 5 FP7-ENV 4.7 “ENORASIS” D5.2 ENORASIS user manual Tools Figure 92 – Tools Menu Print: Print the Map. You can select print layout from different templates, define the scale and the printing area. Figure 93 - Print Measuring Tools: This tool measures length or area by clicking on the map. Figure 94 - Measure Version – issue date: 1.0 – 02/12/2013 Page 1 FP7-ENV “ENORASIS” D5.2 ENORASIS user manual Drawing tools: This tool draws on the map point, line, free line, circle, polygon, rectangle or text. You can define the line color, the line width and the fill color. Figure 95 - Draw 4.8 Help Figure 96 – Help Menu Irrigation Management App: Through this button the User can access to the “Web Application” (paragraph 2). Figure 97 – Irrigation Management About: Display information about the project. Version – issue date: 1.0 – 02/12/2013 Page 2 FP7-ENV “ENORASIS” D5.2 ENORASIS user manual Figure 98 - About Help: Display a short video explaining the functionality of the “DSS Based on GIS Tool”. Figure 99 – Help Version – issue date: 1.0 – 02/12/2013 Page 3 FP7-ENV “ENORASIS” D5.2 ENORASIS user manual 5. ANDROID APPLICATION 5.1 Login screen and main menu First of all the User has to log into the application with a unique Username and password. If the combination of Username and password matches to a User of the system, the main menu screen will be shown (Figure 100). The main menu allows the User to access the fields he has the appropriate rights to access to. Other options of this menu are: see the weather report for a specific field, check irrigation reports and events, subscribe to an email/SMS system of alarms, setting generic configuration parameters (cost of work, cost of water…) and exit the application. These activities will be further explained in the following chapters. Selecting the “Remember me” option will keep User and password filled by default any time the application is launched, while selecting the “Show password” option the password will be shown in clear characters. Figure 100 - Login and Main menu screens Version – issue date: 1.0 – 02/12/2013 Page 4 FP7-ENV 5.2 “ENORASIS” D5.2 ENORASIS user manual View Weather Forecast Pressing the “Weather” button in the main menu the User can see a weather report for each field. The predictions can be made to a maximum of 1, 2 or 3 days. The data shown in these reports (Figure 101) are: precipitation probability and amount, wind speed, solar radiation, relative humidity and minimum/maximum temperature. Figure 101 - Weather Prediction screen 5.3 View Reports Pressing the “Reports” button in the main menu, the User will obtain access to information about the status of his plots. A submenu (Figure 102) will allow the User to select “Irrigation reports” or “Events”. The former will show a summary of the Irrigation plans of all the plots belonging to a selected field, the latter will show any error event that have taken place into the fields that belong to the User. Version – issue date: 1.0 – 02/12/2013 Page 5 “ENORASIS” D5.2 ENORASIS user manual FP7-ENV Figure 102 - Reports menu and Events screens 5.4 Retrieve Alarms Pressing the “Alarms” button in the main menu, the User can manage which kind of alarms he wants to receive and how to receive them. The possible alarms are: “extreme weather conditions”, “sensor data out of min/max limits”, “irrigation emergency”, “soil moisture below limit”, and “ERP alerts”. For each of the alarm types he can subscribe to receive them by email, SMS or both, pressing the corresponding buttons (Figure 103). Version – issue date: 1.0 – 02/12/2013 Page 6 FP7-ENV “ENORASIS” D5.2 ENORASIS user manual Figure 103 - Alarms screen 5.5 Create field Pressing the “Fields” button in the main menu (Figure 100), the User will access a list of his available fields. Pressing the button “Create” he will obtain a blank form (Figure 104) where he can fill the attributes of the field to create. To add the geographical coordinates of the field the User must press “GPS boundaries”, this way a map will be presented in which the User can select a number of points to define the polygon that defines the field. If the mobile embedded GPS is not active at that moment, the application will ask the User either to activate it or not, if the User decides not to use the GPS the application will try to calculate the position from the network information, although the accuracy will be higher using GPS. To create the boundaries of the field the User must move to one of the corners of the field and press the “Get” button, then move to another corner of the field and press “Get” again, then, a line will be drawn in between those two points. This process will continue till all the corners of the field are defined. The minimum number of points the User should capture is three, whenever three points are selected a polygon will be drawn and any new point will be added as a polygon vertex. At any time the User can delete the last point pressing the “Del” button. Once three points are defined, the User may use the button “Accept” to save the boundaries and get back to the creation interface, where, he should fill the remaining parameters of the field. Finally the User must press the “Save” button to create the field in the system. Version – issue date: 1.0 – 02/12/2013 Page 7 FP7-ENV “ENORASIS” D5.2 ENORASIS user manual Figure 104 - Field data and GPS points screens 5.6 Search field If the User wants to work with an existing field he will select one from the list (Figure 105) obtained after pressing the “Fields” button in the main menu (Figure 100). To find a specific field the User may introduce the name, or part of it, in the Filter text box, the available list of fields will be refreshed any time the User introduce a new letter. The User will choose one single field and press it. To be sure the field selected is the required one, a map will show the boundaries and position of the field. Pressing “Select” the application will show the field menu (see Figure 105), where the User has the following options: See: Shows a read-only interface showing the parameters of the selected field. Update: Shows a read-write interface where changing any of the parameters of the field is possible. Delete: Deletes the selected field. Plots: Gives access to the plots belonging to this field. Sensors: Gives access to the sensors belonging to this field. Valves: Gives access to the valves belonging to this field. Version – issue date: 1.0 – 02/12/2013 Page 8 FP7-ENV “ENORASIS” D5.2 ENORASIS user manual Figure 105 - Field list and Field Options screens 5.7 Create plot The process to create a new plot is very similar to the one used to create a new field. The User must select a field, as explained in chapter 5.6, and press the “Plots” button in the field menu (Figure 105). When the list of the plots belonging to the field is shown (Figure 106), the User must press the “Create” button to access a blank form were the parameters of the plots should be filled. Since the creation of a plot has a lot more attributes than a field, some of them can be preconfigured in the configuration screen (Figure 106) clicking on “Configuration” button in the main menu (Figure 100). These values will be considered as default in the plot creation screen, being the User able to change them if required. To add the geographical coordinates of the plot the User must press “GPS boundaries”, a similar screen than the one described in chapter 5.5 for the creation of a field is shown, the process to define the boundaries of the plot is exactly the same described there for the field. Once three points are created, the User may use the button “Accept” to save the boundaries and get back to the creation interface, where, once all the data are filled, the User must press the “Save” button to finally create the plot in the system. Version – issue date: 1.0 – 02/12/2013 Page 9 “ENORASIS” D5.2 ENORASIS user manual FP7-ENV Figure 106 - Plot Data and Plot Configuration screens 5.8 Search plot Working with an existing plot is also possible. Once the User has accessed the list of plots belonging to a field (Figure 107), pressing the “Plots” button of the field menu (see Figure 105& Figure 106), the User has just to select one of them clicking on it or using the filtering capability as explained in 5.6 for fields. As in the fields’ case, a map will show the plot (a green polygon) inside his field (a blue polygon). If the User accepts the selection clicking on the “Select” button, the application will show the plot menu (see Figure 108), where the User has the following options: See: Shows a read-only interface showing the parameters of the selected plot. Update: Shows a read-write interface where changing any of the parameters of the plot is possible. Delete: Deletes the selected plot. Irrigation: Gives access to the irrigation plan of the selected plot. Sensor-readings: Gives access to the measures obtained by all the sensors of the plot. Valve-values: Gives access to the amount of water poured by all the valves in the plot. In the irrigation plan screen (Figure 108) the User can consult the latest result of the Decision Support System of ENORASIS, which includes the amount of water planned to irrigate and the values for moisture and effective precipitation. Also, information about the status of the irrigation plan, which can be: Inactive Active and immediately executable In progress (water is flowing) Pending (irrigation was interrupted) Version – issue date: 1.0 – 02/12/2013 Page 10 FP7-ENV “ENORASIS” D5.2 ENORASIS user manual Finished The irrigation plan can be “Enabled” or “Disabled” which can be changed with the buttons “ENABLE auto” or “DISABLE auto”. Figure 107 - Plot list and Plot map screens Version – issue date: 1.0 – 02/12/2013 Page 11 FP7-ENV “ENORASIS” D5.2 ENORASIS user manual Figure 108 - Plot Options and Irrigation Plan screens 5.9 Create and assign Sensors or Valves The User can create sensors or valves following a similar procedure of a plot creation, from the field menu (Figure 105), “Sensors” or “Valves” button must be selected. A list of sensors or valves will be shown with the existing ones for the current field. If the User clicks on “Create” button, a blank form will be presented to fill (Figure 109). To add the geographical coordinates of the sensor or valve the User must press “Get GPS location” button, this way a map will be presented in which the User can select only one point to define the location of the sensor or valve. If the mobile embedded GPS is not active at that moment, the application will ask the User either to activate it or not, if the User decides not to use the GPS, the application will try to calculate the position from the network information, although the accuracy will be higher using the GPS. For sensors and valves, only one point is needed, so the User must move to the proper location and press the “Get” button once. The User can delete this point pressing the “Del” button and selecting another point. Once the location is the correct one, the User must use the button “Accept” to save it and get back to the creation interface, where the remaining data must be filled. When creating a sensor or valve, it must be assigned to the plot or plots that they are giving service to. To do this the User must click on the “Set plots” button. Two lists will be presented with the assigned and non-assigned plots (Figure 109). To assign one, the User must click on a plot from the “unsigned plots” list and immediately, the plot will change lists to the “assigned plots” one. To un-assign a plot, the User must do the inverse action and click on a plot from “assigned list”. Once the assignments had finished, the User must click on “Save” button to save the assignations and return to the previous form. Version – issue date: 1.0 – 02/12/2013 Page 12 “ENORASIS” D5.2 ENORASIS user manual FP7-ENV To make effective the changes and save the new sensor or valve, the User must click on the “Save” button in the form to create it on the system. Figure 109 - Sensor Data and Set Plots screens 5.10 Search Sensor Working with an existing sensor is also possible, choosing an existing sensor in a similar way we did for plots in 5.8. After selecting a field, the User must click on the “Sensors” button on the field menu (Figure 105) and a list will be presented with the related sensors. Filtering options are also available. Clicking on one sensor, a map will show its position with a yellow marker. If the User accept the selection clicking on the “Select” button the application will show the sensor menu (Figure 110), where the User can choose between: See: Shows a read-only interface showing the parameters of the selected sensor. Update: Shows a read-write interface where changing any of the parameters of the sensor is possible. Delete: Delete the selected sensor. Measures: Shows the measures of the selected sensor (Figure 110), these data may be filtered by hours, being 12 hours the maximum available. The measures can be deleted, modified or added as explained in section 5.12. Version – issue date: 1.0 – 02/12/2013 Page 13 “ENORASIS” D5.2 ENORASIS user manual FP7-ENV Figure 110 - Sensor Options and Measure Options screens 5.11 Search valve The User can select an existing valve in a similar way we explained how to search a sensor in 5.10. In the field menu (Figure 105), after selecting a field, the User must click on the “Valve” button to access a list of valves belonging to that field. Filtering options are also allowed. When the User selects one of the valves by clicking on it, a map will show the valve position with a magenta marker. If the User accepts the selection by clicking on the “Select” button the application will show the valve menu (Figure 111), where the User has the following options: See: Shows a read-only interface showing the parameters of the selected valve. Update: Shows a read-write interface where changing any of the parameters of the valve is possible. Delete: Deletes the selected valve. Watering: Shows the status of the valve (Unknown, Closed, Open, Error, waiting to be closed or waiting to be opened). The valve can be started or stopped remotely, using the “start watering” or the “stop watering” buttons (Figure 111). Data: Shows the values of the selected valve, these data may be filtered by hours, being 12 hours the maximum available. The values can be deleted, modified or added as explained in section 5.12. Version – issue date: 1.0 – 02/12/2013 Page 14 FP7-ENV “ENORASIS” D5.2 ENORASIS user manual Figure 111 - Valve Options and Valve Watering screen 5.12 Manual inserts of data The User can add manual measures for the sensors and values for the valves. There are two ways of doing so: One is clicking on the “Measures” button in the sensor menu (Figure 110) and on the “Data” button in the valve menu (Figure 111) to see a list of measures and values. If the User selects one of them, he has the possibility of deleting or editing it by clicking on the corresponding buttons. To create a sensor measure or a valve value manually, he must click on the “Add” button to get a blank form for adding a new one (Figure 112). Adding the date and time of the measure may be done manually or by pressing “current time” button to add automatically the current time. After inserting the value, the last step is assigning the measure or the value to a plot, selecting one of the available plots (plots belonging to the initially selected field) in the list at the lower part of the creation screen. The second one is selecting “Sensor-readings“ or “Valve-values” in the plot menu (Figure 108), the User will be presented with a list of measures or values captured by all the devices assigned to the plot. Editing and deleting elements of that list is also possible in this case. Pressing the “Add” button, will show a blank form for creating a sensor measure or a valve value like before, but in this case, a list of sensor/valves belonging to the initial plot will be shown for the User to assign this brand new reading/value to the corresponding device. Finally the User must press the “Save” button for the measure or the value to be created in the system. Version – issue date: 1.0 – 02/12/2013 Page 15 FP7-ENV “ENORASIS” D5.2 ENORASIS user manual Figure 112 - New Sensor Measure Creation Version – issue date: 1.0 – 02/12/2013 Page 16