1
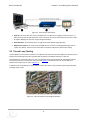
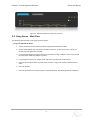
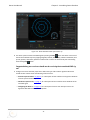
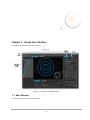
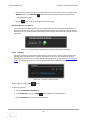
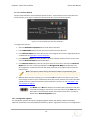
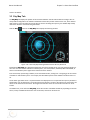
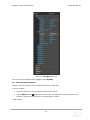
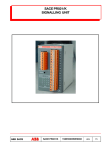
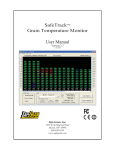
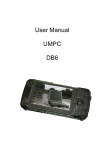
User Guide
Revision Date: 1/20/2015
Genos User Manual
Copyright
Copyright
Copyright © 2013-2015 Frontline Test Equipment. All rights reserved.
-i-
Contents
Genos User Manual
Contents
Table of Contents
Copyright
i
Contents
ii
Chapter 1: About this Guide
1
Chapter 2: Introducing Genos Simulator
3
2.1 Genos Simulator Description
3
2.1.1 Genos Simulator Functionality
4
2.1.2 Genos Simulator Usage
4
2.1.3 Genos Package Contents
4
2.1.4 Genos Simulator Device
5
2.2 Genos System Architecture
5
2.3 Closed Loop Testing
6
2.4 Using Genos - Work Flow
7
Chapter 3: Genos User Interface
9
3.1 Main Window
9
3.1.1 Toolbar
11
3.1.2 Menu
11
3.1.2.1 File Menu
12
3.1.2.2 View Menu
12
3.1.2.3 Tools Menu
12
3.1.2.4 Simulation Menu
14
3.1.2.5 Test Receiver Menu
15
3.1.2.6 Help
15
3.2 Simulator Properties - configuration
15
3.2.1 Configuring the Genos Simulator
15
3.2.1.1 Satellite System Constellation, Ephemeris and Almanac
17
3.2.1.2 Trajectory
18
3.2.1.3 Com Port Options
19
3.2.2 Configuration Options
19
3.3 Sky Map Tab
20
- ii -
Genos User Manual
Contents
3.3.1 Removing/Adding Satellites
21
3.4 Google Earth Map™ Tab
22
3.5 Trajectory difference
22
3.6 Results Tab
23
3.7 Genos Simulator System & Satellite Selection
24
Chapter 4: Testing with the Genos System
25
4.1 Using the Genos Simulator to Test a Receiver
25
4.2 Automatic Test
26
4.2.1 Test Definition
26
4.2.2 Running Tests
27
4.2.3 During the Test
29
4.2.4 After the Test
30
4.3 Defining New Tests
30
4.3.1 Cold Start
32
4.3.2 Start simulation
32
4.3.3 Stop simulation
32
4.3.4 Attenuation
33
4.3.5 Add satellite
33
4.3.6 Remove satellite
33
4.3.7 If event
34
4.3.8 End Of File
35
4.3.9 Loop
35
4.4 Create a test - an example
36
4.5 Creating a Trajectory
40
4.5.1 Syntax of RMF File
44
Chapter 5: Technical Support
45
Appendix A: Google KML Format
47
Table of Figures
Figure 2.1 - Genos Device - Front Panel
5
Figure 2.2 - Genos Device - Rear View
5
Figure 2.3 - Genos System Architecture
6
- iii -
Contents
Genos User Manual
Figure 2.4 - Visual Test Report Using Google Earth Map™
6
Figure 2.5 - Difference Between Trajectories in meters
7
Figure 2.6 - Genos Simulator View Upon Power Up
8
Figure 3.1 - Main Genos Simulator Window
9
Figure 3.2 - Genos Simulator Main Window
10
Figure 3.3 - Menu Bar
11
Figure 3.4 - file Menu Options
12
Figure 3.5 - View Menu Options
12
Figure 3.6 - Tools Menu Options
12
Figure 3.7 - Tools Menu General Properties Settings Window
13
Figure 3.8 - Tools Menu Trajectory file conversion Settings
14
Figure 3.9 - Tools Menu Network Adapter Selection
14
Figure 3.10 - Simulation Menu Options
14
Figure 3.11 - Test Receiver Menu Options
15
Figure 3.12 - Configuration File Save Window
16
Figure 3.13 - Trajectory Time and Date Display
16
Figure 3.14 - Satellite Ephemeris and Almanac Settings.
17
Figure 3.15 - Date Setting for Satellite Ephemeris and Almanac Internet Download
18
Figure 3.16 - Trajectory .rmf File Location
18
Figure 3.17 - Device Under Test Com Port Properties
19
Figure 3.18 - Genos Sky Map Showing Satellite Positions Directly Overhead
20
Figure 3.19 - Sky Map Satellite List
21
Figure 3.20 - Genos Google Earth Map™ Showing Trajectories
22
Figure 3.21 - Genos Simulator Overall Trajectory Difference
23
Figure 3.22 - Genos Simulator LLA Trajectory Difference
23
Figure 3.23 - Results Tab Display
23
Figure 3.24 - Satellite Selection View
24
Figure 4.1 - Genos Test Receiver Menu
27
Figure 4.2 - Genos Test Receiver Scenario Selection
28
Figure 4.3 - Genos Test Receiver Scenario Optional Information
29
Figure 4.4 - Test Results Display
30
- iv -
Genos User Manual
Contents
Figure 4.5 - Building Scenario Screen
31
Figure 4.6 - Start simulation Command Properties Setting
32
Figure 4.7 - Stop simulation Command Properties Setting
32
Figure 4.8 - Attenuation Command Properties Settings
33
Figure 4.9 - Add satellite Command Properties Settings
33
Figure 4.10 - Remove satellite Command Properties Settings
34
Figure 4.11 - If event Command Properties Settings
34
Figure 4.12 - End of file Command Setting
35
Figure 4.13 - Loop Command Setting
35
Figure 4.14 - Command to Cold Start the DUT
36
Figure 4.15 - Commands to set power out to 37dBm with no wait time.
36
Figure 4.16 - Commands to use All Satellites from the Selected GNSS System.
37
Figure 4.17 - Start a Conditional Test to Find Satellites.
37
Figure 4.18 - Continue Conditional Test Should 5 Satellites NOT Be Found
38
Figure 4.19 - Still in the NOT Found leg of the Conditional Statement, Increase Power by 3 dBm.
38
Figure 4.20 - Loop to Repeat the Test with Increased Power Level.
39
Figure 4.21 - Second Conditional Command Set and Test Stop Commands
39
Figure 4.22 - Google Earth Directions Results to Define a New Trajectory
40
Figure 4.23 - Google Earth Places - Route
41
Figure 4.24 - Google Earth Route Save As... Dialog
41
Figure 4.25 - Genos Tools Menu - Trajectory File Conversion
41
Figure 4.26 - Convert Google Earth KLM file to Genos Trajectory RMF file.
42
Figure 4.27 - Conversion from KLM to RMF complete.
42
Figure 4.28 - Simulation Properties Trajectory Selection
43
Figure 4.29 - Genos Default RMF File location.
43
Figure 4.30 - Conversion from KLM to RMF complete.
43
Figure 4.31 - Sample RMF File
44
Figure A.1 - Example Google Earth Route That Can Be Exported as KML File
48
-v-
Chapter 1: About this Guide
This user guide describes how to operate the Genos system. This guide is intended for GNSS technical personnel
that will use Genos to emulate satellite-positioning signalsfor testing receivers.
This guide contains the following chapters:
l
l
l
l
Chapter 1, Introducing the Genos,introduces the Genos functionality , system architecture and package content.
Chapter 2, Using the Genos User Interface, describes the general work flow for using the Genos system and
each of the options in its windows, toolbar and menu bar.
Chapter 3, Testing with Genos, describes predifined and cutomized automatic tests,that could be performed
using the Genos system, the appropriate wayto run tests, to defined them, and the way to retrieve the results.
Chapter 4, Creating a Trajectory, describes the trajectory used by Genos , how to create it and its format
(RMF) .
This user guide describes all Genos user options,according to the license permissions. Some of the features
described in this user guide may or may not be activated.
-1-
Genos User Manual
Chapter 1: About this Guide
-2-
Chapter 2: Introducing Genos Simulator
This chapter describes the Genos Simulator, its system architecture and some of the possibilities for its use.
2.1 Genos Simulator Description
The Genos system is a high-dynamics, flexible, Global Navigation Satellite Systems (GNSS) signal simulator that can
be used, among other things, for testing.of any product that incorporates satellite navigation functionality.
It can be configured to simulate the satellite signals that will be visible to a GNSS receiver in any location in the
world, at any time (both past and future) and along any trajectory.
The Genos system has an extremely high update rate up to every one millisecond, supporting unique highdynamic trajectories.
The flexibility and features of this easy-to-use and intuitively designed software makes it ideal for product development, evaluation and testing environments. Genos system can simulate the signals from one or more of the following satellite systems according to user license:
l
GPS
l
Galileo
l
GLONASS
l
COMPASS
l
QAZZ
l
SBAS
l
WAAS
l
EGNOSS
l
GAGAN
-3-
Genos User Manual
Chapter 2: Introducing Genos Simulator
2.1.1 Genos Simulator Functionality
Genos Simulator accurately simulates the GNSS signals. The specific transmission is determined by the user, either
by using predefined default settings, or by using the easy to use graphical user interface (GUI).
A broad range of configuration options are available to the user in order support a rich variety of test scenarios.
User can use the Genos to simulate signals along a specific trajectory (the route’s longitude, latitude, altitude),
satellite constellation (Almanac or ephemeris), time period (both past and future), signal power, dynamics (plane,
car pedestrian).
Another convenient option for configuring the Genos trajectory is through importing trajectories defined in
Google Earth™ or using a textual script.
2.1.2 Genos Simulator Usage
Genos Simulator helps the user to evaluate the performance and characteristics of a GNSS receiver, including the
following:
l
l
l
l
Time To First Fix (TTFF): Specifies the amount of time required for a GNSS receiver to acquire satellite signals
and navigation data and then to calculate a position solution (also called a fix).
Acquisition Sensitivity: Specifies the minimum signal level (dBm) at which a GNSS receiver can successfully
execute a cold start TTFF within a specified time frame.
Tracking Sensitivity: Specifies the minimum signal level (dBm) at which a specific GNSS receiver can successfully maintain a location fix within a specified degree of accuracy.
Location Accuracy: Specifies the deviation between the positioning information that the Genos simulate and
that the receiver detects. Typically, a GNSS receiver calculates and can be evaluated according to the following
parameters:
o
Position: Longitude, Latitude & Altitude or Earth-Center, Earth-Fix (X Y Z)
o
Velocity: Longitude, Latitude & Altitude or Earth-Center, Earth-Fix (V V V )
o
Time
o
Frequency
o
Dynamics: the receiver dynamics limitations.(velocity, acceleration and jerk)
x
y z
2.1.3 Genos Package Contents
Genos is comprised of a 1U Genos signal simulator and a Genos PC that controls it. Both these devices come
installed and ready to plug-and-play. The following describes the components provided in the Genos package:
l
Genos Simulator Device: 1U 19” satellite RF signal transmission device.
l
Genos PC Computer: 1U 19” PC computer Genos software installed.
l
Ethernet Cable: 1Gbe Ethernet cable to connect between the Genos PC and the Genos Simulator device.
l
AC Cords: Two AC power cords one for the Genos PC and the other for the Genos Simulator.
l
RF Cable
l
Passive antenna
-4-
Chapter 2: Introducing Genos Simulator
Genos User Manual
2.1.4 Genos Simulator Device
Figure 2.1 - Genos Device - Front Panel
The front of the Genos device has the following features:
l
RF OUT Port: Streams the simulated signal to receivers. This port can be connected directly to receivers via a
standard RF cable. A splitter can be used in order to connect to two or three receivers. Future Genos versions
will enable the connection of an antenna that will transmit the emulated signal.
l
Power On Indicator LED: Indicates that the Genos firmware is properly loaded and operational.
l
Reset button
Figure 2.2 - Genos Device - Rear View
The back of the Genos device has the following features:
l
Ethernet Port: Connects to the Genos PC via a Ethernet cable provided in the Genos package.
l
Power Button
l
Power Inlet: Universal AC power (110-230)
2.2 Genos System Architecture
The following depicts the flow of a Genos system:
-5-
Genos User Manual
Chapter 2: Introducing Genos Simulator
Figure 2.3 - Genos System Architecture
1. Genos PC: The Genos GUI runs on the provided Genos. It enables you to configure the Genos system, to
define and execute tests and explore the results. The Genos PC may be connected to the Internet in order
to support displaying the trajectory using a Google Earth Map™.
2. Genos Simulator: The Genos Simulator is a high performance GNSS RF signal generator
3. GNSS Receiver/DUT(Device Under Test):The GNSS receiver receives an ongoing satellite signal and calculates user position. The DUT can be connected to a Genos PC USB port for performance testing.
2.3 Closed Loop Testing
The DUT (GNSS receiver) can be connected via a USB port to the Genos PC. Genos PC displays the deviation (error)
between the positioning information simulated and the position calculated by the device under test.
This information is presented in two ways, one is using Google earth map where both the transmitted trajectory
and received trajectory are marked on the same map (Figure 2.4) and the second is the overall difference
between these trajectories in meters (Figure 2.5).
In addition to the visual difference representation a textual test report is also provided comparing emulated positioning and DUT results.
Figure 2.4 - Visual Test Report Using Google Earth Map™
-6-
Chapter 2: Introducing Genos Simulator
Genos User Manual
Figure 2.5 - Difference Between Trajectories in meters
2.4 Using Genos - Work Flow
The following describes how to start using the Genos system.
l
To get started with the Genos:
1. Connect the Genos PC to the Genos Simulator using the provided Ethernet cable.
2. Connect the RF Output port of the Genos Simulator to the DUT - up to three receivers can be connected using a RF splitter(not provided).
3. For Closed loop option test connect each DUT to the Genos PC using a USB port. Each receiver should
be connected to a different USB port on the PC.
4. For viewing the trajectory on a Google Earth map Connect the Genos PC to the Internet
5. Power on the Genos Simulator. Its power button is shown in Figure 2 on the back of the Genos Simulator.
6. Power on the DUT.
7. Power on the Genos PC. The Genos software automatically loads. The following window is displayed:
-7-
Genos User Manual
Chapter 2: Introducing Genos Simulator
Figure 2.6 - Genos Simulator View Upon Power Up
8. The Genos system transmits simulated signals by clicking the Play
button. The Genos comes out-of-
the-box with a default trajectory (ongoing longitude, latitude, and altitude), satellite constellation, time
period, dynamic, attenuation, Ephemeris and Almanac so that it can automatically start transmitting
when clicking Play
button.
Congratulations, your receivers should now be receiving the transmitted GNSS signal!
9. Configure the Genos Simulator properties to define the type of DUT and the signal that the Genos
should simulate. Please consult the following sections for that:
l
l
l
General Properties Menu on page 12, for a description of how to define various general attributes
of Genos system functionality.
Simulator Properties Tab, on page 15, for a description of how to define various attributes of the
emulated signal.
Configuring the Genos on on page 15, for a description of how to save and open various configurations that define how the Genos operates.
-8-
Chapter 3: Genos User Interface
This chapter describes the main Genos window.
Figure 3.1 - Main Genos Simulator Window
3.1 Main Window
This section describes the Genos main window.
-9-
Genos User Manual
Chapter 3: Genos User Interface
Figure 3.2 - Genos Simulator Main Window
l
l
l
l
l
l
l
Toolbar: Provides various tools for controlling the transmission of the emulated signal, the tool consist of :
start simulation, pause and stop, open and save configuration.
Menu: Provides various options for configuring and controlling the Genos menu can open Satellite System
Selection Pane, Simulator Properties Tab, Automatic test and Help menu.
Configuration Options Tab: Provides a variety of options for configuring the Genos Simulator, receiver connection and emulation behavior. Refer to the Tools Menu - General Properties for more information.
Sky Map Tab: Displays satellite's relative position to the simulated user position
Google Earth Map Tab: Displays the simulated trajectory versus the DUT calculated trajectory (in a Closed
Loop configuration) on a Google Earth map.
Trajectory difference: Displays difference between that transmitted trajectory and the received trajectory (as
was reported by the DUT) in meters.
Results Tab: Results tab has two functions:
1. Displays the results of the closed loop test - compares the emulated position to the DUT results.
2. In case of Automatic Test shows test progress.
l
l
GNSS system & satellite selection: Shows all the satellites that are visible in the currently defined trajectory.
Satellites can be removed or added using the Remove / Add button.
Misc. - Clock and speedometer entries: These entries provide information about the speed that the DUT is set
to travel the specified trajectory and the exact time this trajectory was traveled.
- 10 -
Chapter 3: Genos User Interface
Genos User Manual
3.1.1 Toolbar
Tools enable control of the simulated signal transmission, and selection and saving a simulator configuration file:
Table 3.1 - Toolbar Icons
Icon
Description
Load Button: Load a previously saved con-
figuration XML file. The Load button will activate
and used the new configuration. When you restart
the Genos application, it automatically reverts to its
default configuration, therefore use the Load button
to select and load the required configuration. Save Button: Saves the current loaded con-
figuration (including all the latest changes) as an
XML file that can be reloaded.
Play Button: Starts transmitting a signal via the
Genos Simulator’s RF output port according to the
loaded configuration.
Pause Button: Pauses transmission of the signal.
You can click the Play button to continue along the
same trajectory.
Stop Button: Stops transmission of the simulated
signal. When you click the Play button again, the
loaded configuration starts from the beginning of its
trajectory.
: Use the attenuation button, to invoke the
attenuAttenuation Selectation slider. Attenuation Adjust: Use the attenuation slider, to
select the required attenuation of the selected
antenna. The attenuation (RF signal power) can be
changed at any time, even while the Genos Simulator is playing.
Ethernet speed: Displays the type of Ethernet
connection (100 Mb/s or 1Gb/s) between the PC
and the Genos
3.1.2 Menu
The Menu is located at the top of the window.
Figure 3.3 - Menu Bar
- 11 -
Genos User Manual
Chapter 3: Genos User Interface
3.1.2.1 File Menu
Figure 3.4 - file Menu Options
l
The Open and Save options provide the same functionality as Load Button and Save Button described in
section Toolbar on page 11.
l
Save as: let you save the currently loaded configuration under a different name.
l
Exit: Closes the Genos application and stops Genos Simulator signal transmission.
3.1.2.2 View Menu
Figure 3.5 - View Menu Options
The options in this menu display or hide the specified window pane.
3.1.2.3 Tools Menu
Figure 3.6 - Tools Menu Options
Tools Menu - General Properties
The General Properties menu lets you define various general attributes of Genos system , as described
below. These are the default Genos Simulator settings. These settings will be used in a Cold Start procedure.
- 12 -
Chapter 3: Genos User Interface
Genos User Manual
Figure 3.7 - Tools Menu General Properties Settings Window
Simulator units: Speed: select speed units
Supported devices: Define device under test used.
Simulator Mac Address: Define simulator Mac address. This filed needs to be configured only in the case
of multi-simulator configuration.
Antenna Configuration: This file needs to be configured only in the case of multi-simulator configuration.
Ethernet Speed: Sets the type of Ethernet connection (100 Mb/s or 1 Gb/s) between the PC and the Genos.
Note: User can configure parallel Genos Simulators in order to test multi-antenna systems.
This feature is out of scope for this user guide. Contact Frontline technical support if you are
interested in this option.
Tools Menu - Trajectory file conversion: convert imported KML file from Google earth to Genos Sim-
ulator proprietary format. (RMF File), more detailed explanation will appear in 4.5 Creating a Trajectory.
- 13 -
Genos User Manual
Chapter 3: Genos User Interface
Figure 3.8 - Tools Menu Trajectory file conversion Settings
Tools Menu - Network Adapters: The Genos PC can be equipped with several network interface cards
(NICs). This section presents all the cards that are installed in the PC, the user needs to indicate the appropriate
card that is connected to the Genos. This selection does not affect connection speed or any other NIC's properties. These properties need to be configured using the NIC's attributes in Windows.
Figure 3.9 - Tools Menu Network Adapter Selection
3.1.2.4 Simulation Menu
Figure 3.10 - Simulation Menu Options
The Run, Play and Stop options provide the same functionality as theRun, Play Stop tools in the toolbar,
described in Toolbar on page 11.
- 14 -
Chapter 3: Genos User Interface
Genos User Manual
3.1.2.5 Test Receiver Menu
Figure 3.11 - Test Receiver Menu Options
l
Open:
l
Create file:can be used to define new tests using the script generation options provided by Genos system.
Refer to Defining New Tests on page 30 for more information.
l
RunTest Script: can be used to activate predefined tests provided out-of-the-box, or a test that was created
using the Create file option.
3.1.2.6 Help
Provides information on setting up, configuring, and running the Genos Simulator.
3.2 Simulator Properties - configuration
This section describes how to configure and define Genos simulator properties.
3.2.1 Configuring the Genos Simulator
The Genos Simulator is an out-of-the-box ready-to-use simulation system. Its default transmitted signal is a
route/path from the Lincoln monument in Washington DC to the White House on Capitol Hill on the 4th of July
2012.
The user only needs to modify the Genos configuration to change the default signal that is transmitted and/or to
work in a Closed Loop testing mode (which compares the signal sent by the Genos Simulator with the signal calculated by the GNSS receiver being tested).
Changes in the configuration are applied after using the Play button. Save the configuration for reuse, otherwise
the next time you Initialize the Genos application, it will revert to using the default (or previously defined) configuration again.
To save configuration changes:
1. Configure the Genos as required.
2. Select the Save
tool from the toolbar. The following window is displayed:
- 15 -
Genos User Manual
Chapter 3: Genos User Interface
Figure 3.12 - Configuration File Save Window
3. Assign the configuration file a name with a .xml extension and then click the Save
tool or use the
Save as option in the File menu.
To load a saved configuration:
1. Click the Load
tool.
2. Select the configuration XML file.
3. Click the Load button.
Properties and sub titles:
l
Time and Date
l
Satellite System,
l
Ephemeris and Almanac
l
Downloads Ephemeris and Almanac
l
Trajectory
l
Com port
Time and Date
Defines the time period (start date) of the trajectory. Ensures that the Ephemeris and Almanac files specified
by the current configuration support the relevant dates.
Figure 3.13 - Trajectory Time and Date Display
To specify the time and date of the emulated signal:
- 16 -
Chapter 3: Genos User Interface
Genos User Manual
1. Select the Simulator Properties tab.
2. In the Time and Date area, click the Edit
button to enable the update of the date and time.
3. Change the Date and Time fields, as needed.
4. Click the
button to apply this change to the emulated signal.
3.2.1.1 Satellite System Constellation, Ephemeris and Almanac
Ensures that suitable satellite Ephemeris (RINEX format) and Almanac file exist for each satellite system, for
the time period to be simulated by Genos.
Figure 3.14 - Satellite Ephemeris and Almanac Settings.
Selecting the Satellite System
To enable a satellite system:
1. Check the check box to the left of the satellite system name to include it in the simulated signal, as
shown above.
2. The frequency supported by a satellite system is indicated under the satellite system name. For
example, the screen above shows L1, L2 and L5 for GPS. Select the check boxes of each one to be
included in the simulated signal.
Selecting the Ephemeris and/or the Almanac
The Ephemeris file specifies the latest and most precise satellite orbital data. The Almanac file specifies the
general satellite orbital data for all satellites.
To modify the Ephemeris and/or the Almanac:
1. Select the Simulator Properties tab.
2. Ephemeris files can be downloaded from the Internet to the Genos computer. In the Ephemeris
field, click the Browse
button and select the Ephemeris file that is suited to the currently selected date range.
- 17 -
Genos User Manual
Chapter 3: Genos User Interface
3. Almanac files (file extension .txt) can be downloaded from the Internet to the Genos computer. In the
Almanac field, click the Browse
button and select the Almanac file that is suited to the currently selected date range.
4. Click the
button to apply this change to the emulated signal.
Download Ephemeris and Almanac
In order to determine satellite position the Genos configuration requires an appropriate Ephemeris and
Almanac file set. This information can be downloaded automatically from the Internet. Select the date for
which these files are needed and select download. The Genos PC will download the files and store them at
Deploy/Data
Figure 3.15 - Date Setting for Satellite Ephemeris and Almanac Internet Download
3.2.1.2 Trajectory
The Genos Simulator is provided with a default trajectory (route) which is from the Lincoln monument in
Washington DC to the White House on Capitol Hill on the 4th of July 2012. You also have the option to
define your own trajectories by creating an RMF file using Google Earth, as described in 4.5 Creating a Trajectory. According to your license, you may be provided with various additional trajectory files.
Figure 3.16 - Trajectory .rmf File Location
Select a trajectory using the Add
button.
To define the trajectory
1. Select the Simulator Properties tab.
2. In the Trajectory area, click the Edit
button to display the following window.
3. Click the Browse button and select the new RMF file.
- 18 -
Chapter 3: Genos User Interface
Genos User Manual
3.2.1.3 Com Port Options
Comport option define the communication properties for DUT. - Up to three DUT can be connected to the
Genos Simulator. (If you want to connect an Unknown Genos DUT, set it at General Properties)
Figure 3.17 - Device Under Test Com Port Properties
To configure the Com port:
1. Select the Simulator Properties tab and scroll down to its bottom.
2. In the COM number field, select the port used to connect the DUT to Genos PC
3. In the Receiver Name field, select the receiver to be configured. The receivers supported by Genos
are defined in the Tools Menu - General Properties .
4. In the Receiver baud field, specify the BAUD rate of the COM port connected to the receiver selected in the Receiver Name field, described above.
5. In the Receiver Color field, select the color that represents the receiver selected in the Receiver
Name field. This color is shown in graphically in the Google Earth Map tab and textually in the
Genos application. Furthermore this color will also be used in the error graph to represent the associated receiver.
Note: The trajectory transmitted by the Genos Simulator is represented in green.
6. While the Genos Simulator is playing, you can click the Cold Start button to send the receiver a cold
start message. The Genos comes predefined out-of-the-box with the Cold Start command of the UBlox
and SIRF receivers. To define the Cold Start command of other receivers, use the Tools Menu - General Properties on page 12.
Click Warm start or Hot start button to send a Warm Start command or a Hot Start
command (accordingly) to the receiver in the same manner as the Cold button. The
Warm Start command and the Hot Start command of each receiver must also be
defined in the General Properties menu.
3.2.2 Configuration Options
The configuration specifies the trajectory (ongoing longitude, latitude, and altitude), satellite constellation,
Ephemeris and Almanac, time period (both past and future), dynamic, signal power and more. The configuration is
- 19 -
Genos User Manual
Chapter 3: Genos User Interface
saved in an XML file.
3.3 Sky Map Tab
The Sky Map tab displays the position of the overhead satellites’ azimuth and elevation according to the currently loaded configuration. The satellite constellation reflects their position relative to the user, at the defined
date and time. As the simulated scenario progresses in time and along the trajectory, the Satellite Map visually
reflects the satellites’ movement along their orbits.
Click the Play
button or the Sky Map tab to display the following window:
Figure 3.18 - Genos Sky Map Showing Satellite Positions Directly Overhead
By default the Sky Map tab is displayed showing the orbit of the satellites of the currently selected satellite systems. The color of a satellite indicates its satellite system, such as GPS, Galileo, GLONASS, SBAS and EGNOSS, as
shown in the Satellite System Legend in the bottom left of the window.
Each colored ball, representing a satellite, has an associated number, starting from 1 and going up to the number
of satellites in that satellite systems. For example, the GPS satellite system shows satellites numbered from 1 to
32.
On the lower right-hand corner is a speed odometer that displays the current speed of the trajectory. Below the
speedometer is an accelerometer. The accelerometer has two bars. The bar to the right shows acceleration, and
the bar to the left shows deceleration. The length of the blue bar shows the amount of acceleration or deceleration.
The Satellite List, on the left of the Sky Map, shows the number of available satellites. By expanding a branch on
the list, variety of additional information such as elevation, azimuth can be observed.
- 20 -
Chapter 3: Genos User Interface
Genos User Manual
Figure 3.19 - Sky Map Satellite List
The currently selected satellite appears highlighted in the Sky Map.
3.3.1 Removing/Adding Satellites
Satellites can be removed such that the emulated signal does not include them.
To remove a satellite:
1. Select the satellite to be removed from the Satellite pane on the left.
2. Click the Remove button in the top left of the window. That satellite then appears grayed out in the
Satellite List and the ball representing it in the Satellite Map is removed.
To add a satellite:
- 21 -
Genos User Manual
Chapter 3: Genos User Interface
1. Select a grayed-out satellite that was previously removed from the Satellite pane.
2. Click the Add
button.
3.4 Google Earth Map™ Tab
The Google Earth Map tab displays on a Google Earth map the trajectory of the simulated signal and when in
closed loop mode the output trajectory of the DUT receivers.
Before you click the Play
button the Google Earth Map tab appears as follows:
Figure 3.20 - Genos Google Earth Map™ Showing Trajectories
After you click the Play button, the globe turns to show the position of the current configuration and starts displaying the trajectory path(s) on the map.A yellow line representing the DUT receiver output trajectory when in
closed loop mode.
3.5 Trajectory difference
The Trajectory difference displays the trajectory difference between the path transmitted by the Genos and
the path that was transmitted by the DUT. This difference is presented as an Overall difference (in meters) or
the LLA difference that was calculated separately in every dimension (longitude, latitude, altitude).
Note: Trajectory difference is only displayed when operating Genos Simulator in closed loop
mode.
- 22 -
Chapter 3: Genos User Interface
Genos User Manual
Figure 3.21 - Genos Simulator Overall Trajectory Difference
Figure 3.22 - Genos Simulator LLA Trajectory Difference
3.6 Results Tab
This Tab is functionally divided into two parts, one is addressing test results and the other provides indication
regarding the current state that is executed in automatic testing.
The test results part shows the following:
l
Position transmitted by the Genos Simulator
l
Position calculated by each of up to four receivers
l
Receiver time.
l
Errors between Simulator position and Receiver position in meters.
The bottom of the Results tab shows the commands of the test script as they are executed. The line that is currently running is displayed in red.
Figure 3.23 - Results Tab Display
- 23 -
Genos User Manual
Chapter 3: Genos User Interface
The Automatic test Logger part shows the current status of the test.
3.7 Genos Simulator System & Satellite Selection
The Genos Simulator system and satellite selection tab shows the following:
l
Satellite system that are transmitting.
l
Information regarding specific satellite data (location, velocity etc.)
This tab can also be used to select specific satellite to be highlighted on the Sky Map display
Figure 3.24 - Satellite Selection View
- 24 -
Chapter 4: Testing with the Genos System
This chapter describes the types of tests that you can run using the Genos system, how to run tests, what you can
do during and after a test and the results created for each test. This chapter also describes how to create your
own tests using the Genos system.
4.1 Using the Genos Simulator to Test a Receiver
Configure the test
l
l
l
l
Set the appropriate time and date for the simulation. See Configuring the Genos Simulator Time and Date on
page 16.
Download the appropriate Ephemeris and Almanac files. See Configuring the Genos Simulator Download
Ephemeris and Almanac on page 18 and Selecting the Ephemeris and/or the Almanac on page 17.
Set the required trajectory for the simulation in an RMF format. See Configuring the Genos Simulator Trajectory on page 18.
Connect the DUT for closed loop testing.
Closed Loop Test Comfiguration
Closed Loop tests provide a comparison between the simulated Genos signals to the trajectory calculated by the
DUT. The DUT receives the simulated signals from the Genos Simulator, calculates the position and sends the results to the Genos PC using a NMEA protocol. l
Connect the Port of DUT to the simulator
l
Cold start the DUT.
l
Start Simulation by selecting Run from the Simulation Menu, clicking on the Toolbar Play
by pressing F5 on the Genos PC keyboard.
Test results
l
The calculated sky map is presented.
l
The travel trajectory appears
- 25 -
button, or
Genos User Manual
Chapter 4: Testing with the Genos System
l
Simulation time advance
l
The difference between the transmitted trajectory and the received trajectory is displayed in two ways:
1. Google Map
2. Error Graph
The bottom right of the window displays the Simulation Results pane, which provides the following information:
l
Location by Simulation: Specifies the position of the trajectory in the simulated signal.
l
Location by Receiver: Specifies the position calculated by each of the receivers. Up to three receivers are
supported.
l
Error: Specifies the difference between the signal transmitted by the Genos and the position calculated by
the receiver. This Error indicates the total distance between these two positions in a direct line.
l
Simulator Time: Specifies the time transmitted by the Genos Simulator.
l
Receiver Time: Specifies the time calculated by the receiver.
4.2 Automatic Test
The Genos system is provided with a set of automatic tests for common GNSS simulation.
4.2.1 Test Definition
Genos system is provided out-of-the-box with a variety of tests that you can run immediately, such as: Time to
First Fix (TTFF), Acquisition Sensitivity and Tracking Sensitivity. In addition, it provides you with scripting options for
creating your own test configurations, that start, stop, raise and lower attenuation and simulate various dynamics,
such as a car, airplane, pedestrian and so on. These customized test configurations are defined using the Genos
GUI or through a script file.
You may refer to the Genos Simulator Usage on page 4 for a description of the performance attributes that Genos
enables you to test, such as Time to First Fix (TTFF), Acquisition Sensitivity and Tracking Sensitivity.
All tests run according to the currently loaded configuration. You may refer to Configuring the Genos Simulator on
page 15 for a description of a configuration.
This automatic testing feature allows the user to define a set of tests, execute them and get the results off line
thus analyze DUT performance and produce test reports.
The Genos has the following predefined automatic tests:
l
l
TTFF - This test inspect the time the DUT requires in order to have a preliminary first result assuming that signals are received at 130 dB.
Searching sensitivity– This test inspect DUT search sensitivity, the test starts by transmitting signals at -170 dB
and inspecting if the DUT was able to recognize at least one satellite in this power level. If no satellite was
found, after predefined time frame the Genos increases transmitted power and repeats the search. This test is
repeated until at least one satellite is found and at this transmitted power level the system is looking for a position fix.
- 26 -
Chapter 4: Testing with the Genos System
l
Genos User Manual
Tracking sensitivity - This test inspect the DUT tracking sensitivity and report the positioning error of the DUT
at every transmitted power level up to the point the DUT looses position.
4.2.2 Running Tests
The following describes how to run Genos Simulator preconfigured tests or custom defined tests. Each test that
you run is executed four times. The first test starts running immediately. Each subsequent test, runs at an offset of
an additional three hours.
To run a test:
1. From the TestReceiver menu, select the Run Scenario option.
Figure 4.1 - Genos Test Receiver Menu
2. To run a preconfigured test, select the Run Scenario option to display the list of predefined tests provided
with the Genos or custom user defined test. Each option performs the test suggested by its name, for
example, Time to First Fix tests how long it takes the receiver to get first fix. The user can select one or all
tests to execute by checking the box next to the test. Click on the Next button to proceed.
- 27 -
Genos User Manual
Chapter 4: Testing with the Genos System
Figure 4.2 - Genos Test Receiver Scenario Selection
The user can select one or all tests to execute by checking the box next to the test.
3. You can then optionally fill in the test information window. This information is then included in the Genos
results report.
- 28 -
Chapter 4: Testing with the Genos System
Genos User Manual
Figure 4.3 - Genos Test Receiver Scenario Optional Information
l
Produced by: Specifies the name of the person or business running the test.
l
Results File Name: Specifies the name of the text file (.txt )into which the results are to be saved.
l
Unit under Test Name: Select the name of the receiver from the drop down list of available receivers.
l
Loop Scenario: The number of times to execute the test .
l
decrease power level - in case of multiple tests transmitted signal power can be decreased by 30 dB
following an additional 69 dB reduction. l
RMF File: selected RMF trajectory file for the test.
l
Comments: added comments will be appeared in the result file.
4. Click the Start Test button to start running the test.
While the test is running the results are visually displayed in the Google Map™ tab, the Trajectory difference, and
the Results tab.
4.2.3 During the Test
The following describes what the Genos PC shows during a test:
- 29 -
Genos User Manual
l
l
l
l
Chapter 4: Testing with the Genos System
3.3 Sky Map Tab on page 20: Displays the active satellites in the simulation.
Google Earth Map™ Tab on page 22: Displays on Google Earth™ the real-time trajectory simulated by Genos . In
closed loop testing the trajectory being generated by the Device Under Test (DUT) is also shown in a contrasting color.
Trajectory difference on page 22: Graphically displays the real-time trajectory error as well as the Longitude,
Latitude, and Altitude (LLA) errors.
Results Tab on page 23: Numerically displays in real-time the Simulator LLA position, the receiver or DUT
NMEA LLA position, the LLA error and Range error in meters.
4.2.4 After the Test
The following describes what is displayed after a predefined out-of-the-box test is run. This section does not apply
to customized tests that you create (using the Create File option).
After the test is completed, the results are displayed at the bottom of the window, as shown below:
Figure 4.4 - Test Results Display
4.3 Defining New Tests
The following describes how to write your own Genos test script using the script generator provided in the Genos
PC application. In addition, you can edit a text file and create your own script.
To define a new test
- 30 -
Chapter 4: Testing with the Genos System
Genos User Manual
1. From the Test Receiver menu, select the Create File option. The following window is displayed:
Figure 4.5 - Building Scenario Screen
2. From the List menu field shown above, select one of the commands to be executed by the Genos Simulator.
The following describes each of the Genos Simulator commands that you can add to the test and the fields
to be filled out in order to define it.
l
Cold Start, on page 32
l
Start simulation, on page 32
l
Stop simulation, on page 32
l
Attenuation, on page 33
l
Add satellite, on page 33
l
Remove satellite, on page 33
l
If event, on page 34
l
End of file, on page 35
l
Loop, on page 35
3. Click the Add button to display the command in the right side of this window. Repeat for each command
and the command sequence you want for your test.
- 31 -
Genos User Manual
Chapter 4: Testing with the Genos System
4. Click the Save as button in the bottom right of the window to save this script as a text file.
5. Click the Save button in the bottom right of the window to save this script as a text file.
4.3.1 Cold Start
Specifies that the receiver’s Cold Start message is sent at the beginning of the test. Cold Start is the default configuration for the Genos Simulator with settings for Sif4, Ublox5, and user defined receivers. Refer to the configuration menu description in Tools Menu - General Properties on page 12.
4.3.2 Start simulation
Starts the transmitting the emulated signal (playing) - according to the currently loaded configuration.
Figure 4.6 - Start simulation Command Properties Setting
With X satellites/All Satellites: Select All satellites or specify the number of satellites to be included in the test.
The Genos Simulator automatically selects all or this number of satellites from those that were overhead the trajectory at the time that you specified.
4.3.3 Stop simulation
Stops transmitting the emulated signal that is currently playing.
Figure 4.7 - Stop simulation Command Properties Setting
After X seconds: Specifies the number of seconds after this command is activated.
- 32 -
Chapter 4: Testing with the Genos System
Genos User Manual
4.3.4 Attenuation
Sets the receiver transmitted signal strength by increasing or decreasing the current setting or setting a new signal
strength.
Figure 4.8 - Attenuation Command Properties Settings
l
After X seconds Specifies the number of seconds after this command is issued to change the signal strength
creating a delay. The minimum value is "0".
l
Up increases the signal strength from the current setting.
l
Down decreases the signal strength from the current setting.
l
Put sets the attenuation to a new setting.
l
The upload volume level: Specifies the signal strength in dBm.
4.3.5 Add satellite
Adds the specified number of satellites, after the specified number of seconds.
Figure 4.9 - Add satellite Command Properties Settings
l
After X seconds: Specifies the number of seconds after this command is issued creating a delay. The min-
imum value is "0".
l
Number of satellites to Specifies the number satellites to add..
4.3.6 Remove satellite
Removes the specified number of satellites after the specified number of seconds.
- 33 -
Genos User Manual
Chapter 4: Testing with the Genos System
Figure 4.10 - Remove satellite Command Properties Settings
l
After X seconds:Specifies the number of seconds after this command is issued.
l
Number of satellites toSpecifies the number of satellites to remove.
4.3.7 If event
Genos allows you to set conditions, if the previous event happened do X, else do Y. If the previous event occurred
the next command is issued. If the event did not occur withing the Time out period you have the option of recording the fix that was found or the number of satellites that were found. In the following image the Properties can
be read as "If the DUT did NOT find a 'fix' or did NOT find x satellites within a defined period of time, then execute
the indented commands. Otherwise execute the next command at this level". An example appears in Create a
test - an example on page 36.
Figure 4.11 - If event Command Properties Settings
Selected the event that you want to test:
l
Found fix-Did the DUT obtain a valid location fix.
l
Found sats –Did the DUT find a minimum number of satellites.
l
Time out - Sets the time for the DUT to find either a "fix" or a minimum number of satellites. If the "fix" or
satellites are not found by the end of the Time out period the conditional statement will enter the NOT or
False branch of the condition.
- 34 -
Chapter 4: Testing with the Genos System
Genos User Manual
When an If event command is selected and you click on the Add> button, commands are entered indented
below the first If event command. You can enter any command in the indented branch of the If event statements. To end command entry in the indented conditional statements click on the End if button, and following
commands will not be indented and will occur in the unconditional flow of the test. See the example in Create a
test - an example on page 36.
All commands that you fill bellow appear should the event not happened in TO. When you select End IF button the
commands occurred when the event happened.
4.3.8 End Of File
Sets the point where the test ends. This command does not have to appear as the last command but can appear in
a conditional statement should you want to end the test.
Note: Ending the test is not the same as ending the simulation. Stop simulation will suspend
the DUT from actively searching for satellites and obtaining a location fix. End of File will stop
all testing.
Figure 4.12 - End of file Command Setting
4.3.9 Loop
Begins executing commands from the beginning of the test file.
Figure 4.13 - Loop Command Setting
- 35 -
Genos User Manual
Chapter 4: Testing with the Genos System
4.4 Create a test - an example
First reset the DUT using a cold start command. The cold start configuration is defined in the General Properties of
the Tools menu.
Figure 4.14 - Command to Cold Start the DUT
Next set the transmitted power to 37 dBm with no wait time.
Figure 4.15 - Commands to set power out to 37dBm with no wait time.
With the initial conditions set issues the commands to start the simulation using the previously set trajectory and
Ephemeris and Almanac. For this test use all satellites from the previously selected GNSS system.
- 36 -
Chapter 4: Testing with the Genos System
Genos User Manual
Figure 4.16 - Commands to use All Satellites from the Selected GNSS System.
The test will now look for DUT reception from at least 5 satellites. A conditional "If event" command will look for
the at least 5 satellites but if less than 5 satellites are found after 150 seconds another set of commands are
issued.
Figure 4.17 - Start a Conditional Test to Find Satellites.
If at least 5 satellites are NOT found, then stop the simulation without delay. Note the simulation will stop not the
test.
- 37 -
Genos User Manual
Chapter 4: Testing with the Genos System
Figure 4.18 - Continue Conditional Test Should 5 Satellites NOT Be Found
If the 5 satellites were NOT found, then we stop the simulation, and now we increase the power level by 3 dBm
from 37 dBm to 40 dBm.
Figure 4.19 - Still in the NOT Found leg of the Conditional Statement, Increase Power by 3 dBm.
Issuing the "Loop" command will return to the beginning of the test—Cold start command—and execute again.
The conditional statement will again see if the DUT finds at least 5 satellites, but with the increased power. This if
the minimum 5 satellites are again NOT found the power will be increased another 3 dBm and the test repeated.
This loop will continue with the power increasing 3 dBm at each pass of the loop until the 5 satellites are found.
- 38 -
Chapter 4: Testing with the Genos System
Genos User Manual
Figure 4.20 - Loop to Repeat the Test with Increased Power Level.
After the DUT found five satellites, another set of conditional commands will execute looking for the DUT to
obtain a valid location "fix". Again the simulation will wait 150 seconds for the DUT to obtain the "fix", and if it does
NOT obtain the "fix" the simulation will stop, power will be increased by 3 dBm, and it will loop back to the "Cold
Start" command. Note that all commands will may be repeated through the second "loop" command. That is, the
DUT must again find at least 5 satellites before it can enter the second set of conditional statements.
Finally, when the DUT has successfully found at least 5 satellites and obtained a valid location "fix",the simulation
will wait for 20 seconds and then stop the simulation. The EOF command will stop the test.
Figure 4.21 - Second Conditional Command Set and Test Stop Commands
- 39 -
Genos User Manual
Chapter 4: Testing with the Genos System
4.5 Creating a Trajectory
The Genos PC is provided with Google Earth™ installed. This chapter describes how to use Google Earth™ to create
a new trajectory and to convert it into Galileo’s proprietary trajectory format (RMF – RGSN100 MGSN100
FGSN100).
To create a new trajectory:
1. Launch Google Earth, by selecting Start Google Earth
from the Genos PC Desktop.
2. Select the Directions tab.
3. In the Destinations tab, in the From field, enter the starting location of the trajectory and in the To
field, enter the destination.
4. Click the Search button. Goggle-Earth then draws the trajectory on the map, as shown below as a purple
line.
Figure 4.22 - Google Earth Directions Results to Define a New Trajectory
5. In Google Earth expand the Places and scroll to Route. Rigth-click on Route and then on Save As....
- 40 -
Chapter 4: Testing with the Genos System
Genos User Manual
Figure 4.23 - Google Earth Places - Route
6. In the Save file... window that is displayed, save the route as a KML file anywhere on the Genos PC, and
record or remember the location.
Figure 4.24 - Google Earth Route Save As... Dialog
7. In the Genos Simulator Menu select Tools, Trajectory File Conversion.
Figure 4.25 - Genos Tools Menu - Trajectory File Conversion
8. In the Genos Simulator Trajectory File Conversion dialog provide the Trajectory and Fix Point
- 41 -
Genos User Manual
Chapter 4: Testing with the Genos System
information. At the klm file field click the browser
button. Navigate to the saved KLM file.
Figure 4.26 - Convert Google Earth KLM file to Genos Trajectory RMF file.
9. When the KLM file is selected click on Convert to rmf file. The RMF file is stored on the Genos PC
Desktop in folder Simulator-Install-release\Simulator_Installed64\deploy\data\RMF\. This is the default
RMF file location. Once the conversion is completed you will be notified by the following window. Click the
OK button.
Figure 4.27 - Conversion from KLM to RMF complete.
10. In the Genos Simulator Properties tab expand the Trajectory pane. Click inside the trajectory field
- 42 -
Chapter 4: Testing with the Genos System
and click the Edit icon
Genos User Manual
.
Figure 4.28 - Simulation Properties Trajectory Selection
11. Select the trajectory RMF file that you just created, or what ever trajectory you want to simulate.
Figure 4.29 - Genos Default RMF File location.
Figure 4.30 - Conversion from KLM to RMF complete.
The RMF file is saved in the same folder as the KML file that you selected.
This RMF file can now be selected in the same way as any other trajectory in the Trajectory area of the Simulator
Properties - configuration on page 15
- 43 -
Genos User Manual
Chapter 4: Testing with the Genos System
4.5.1 Syntax of RMF File
The following describes the format that is automatically generated when you follow the procedure described
Creating a Trajectory on page 40.
You can also simply create a new text file according to this format description and enter the values that you
require into the file.
Each row of this file specifies a change of direction and the number of milliseconds that the trajectory continues
in that direction.
Position (in X, Y, Z) Velocity (in X, Y, Z) Acceleration (X, Y, Z) Time in milliseconds are the basic data for a trajectory.
Imagine a point on the Earth. Position is the point starting position for each line. From that position the point
moves at the specified velocity (meters/msec) vector, and at the specified acceleration (meters/msec2) vector.
This movement takes place for the specified time resulting in a new position.
For example, as shown below:
Figure 4.31 - Sample RMF File
The first four lines shown above must be in the file exactly as they are shown. If required, copy them from this
user guide from the following text:
01/01/0001 00:00:00
ANTENNA_PAN_ANGLE 0
ANTENNA_TILT_ANGLE 0
RECEIVER_ORIENTATION 1,0,0
- 44 -
Chapter 5: Technical Support
Technical support is available in several ways. The online help system provides answers to many user related questions. Frontline’s website has documentation on common problems, as well as software upgrades and utilities to
use with our products.
Web: http://www.fte.com, click Support
Email: [email protected]
If you need to talk to a technical support representative, support is available between 9am and 5pm, U.S. Eastern
time, Monday through Friday. Technical support is not available on U.S. national holidays.
Phone: +1 (434) 984-4500
Fax: +1 (434) 984-4505
- 45 -
Genos User Manual
Chapter 5: Technical Support
- 46 -
Appendix A: Google KML Format
Keynote Markup Language (KML) is a file format used to display geographic data in an Earth browser such as
Google Earth, Google Maps, and Google Maps for Mobile.KML is based on the XML (Extensible Markup Language)
using a tag-based structure. A "route" set in an Earth browser can be exported in the KML format and used for
extracting information about the display. Of particular interest is the longitude, latitude, and altitude (LLA) data
that can be used in testing of GPS devices. One advantage of exporting an Earth browser KML file is that one does
not have to write the KML code; the browser does all the work.
Detailed information about KML can be found in the KML Reference . Only KML elements that may be significant
for GPS testing appear in this document. In the code shown below is an example of a simple Placemark and Point
usage. A Placemark is a KML Feature parameter with associated KLM Geometry parameter. In Google Earth, a
Placemark appears as a list item in the Places panel. A Placemark with a Point has an icon associated with it that
marks a point on the Earth
<?xml version="1.0" encoding="UTF-8"?>
<kml xmlns="http://www.opengis.net/kml/2.2" xmlns:gx="http://www.google.com/kml/ext/2.2"
xmlns:kml="http://www.opengis.net/kml/2.2" xmlns:atom="http://www.w3.org/2005/Atom">
<Placemark>
<name>Simple placemark</name>
<description>Attached to the ground. Intelligently places itself at the height of the underlying
terrain.</description> <gx:balloonVisibility>1</gx:balloonVisibility>
<Point>
<coordinates>-122.0822035425683,37.42228990140251,0</coordinates>
</Point>
</Placemark>
</kml>
The Point parameter includes required coordinates tags containing a single tuple consisting of floating point values
for longitude, latitude, and altitude (in that order). Longitude and latitude values are in degrees, where
l
longitude ≥ −180 and <= 180,
l
latitude ≥ −90 and ≤ 90,
l
altitude values (optional) are in meters above sea level.
- 47 -
Genos User Manual
Appendix A: Google KML Format
Thus data from a KML file Placement and Point parameters can be used in another application to define a place on
the Earth.
Figure A.1 - Example Google Earth Route That Can Be Exported as KML File
- 48 -