1
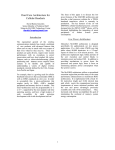
Freescale Semiconductor, Inc.
ARCHIVED BY FREESCALE SEMICONDUCTOR, INC. 2005
SECTION 10
ARCHIVED BY FREESCALE SEMICONDUCTOR, INC. 2005
Freescale Semiconductor, Inc...
ON-CHIP EMULATION MODULE
MOTOROLA
DSP56602 User’s Manual
For More Information On This Product,
Go to: www.freescale.com
10-1
Freescale Semiconductor, Inc.
On-Chip Emulation Module
ARCHIVED BY FREESCALE SEMICONDUCTOR, INC. 2005
Freescale Semiconductor, Inc...
ARCHIVED BY FREESCALE SEMICONDUCTOR, INC. 2005
10.1
10.2
10.3
10.4
10.5
10.6
10.7
10.8
10.9
10.10
10.11
10.12
10-2
INTRODUCTION . . . . . . . . . . . . . . . . . . . . . . . . . . . . . . . . . . . .10-3
ONCE MODULE PINS. . . . . . . . . . . . . . . . . . . . . . . . . . . . . . . .10-3
ONCE CONTROLLER. . . . . . . . . . . . . . . . . . . . . . . . . . . . . . . .10-4
ONCE MEMORY BREAKPOINT LOGIC. . . . . . . . . . . . . . . . .10-10
ONCE TRACE LOGIC . . . . . . . . . . . . . . . . . . . . . . . . . . . . . . .10-15
METHODS OF ENTERING THE DEBUG MODE . . . . . . . . . .10-16
PIPELINE INFORMATION AND OGDBR . . . . . . . . . . . . . . . .10-18
TRACE BUFFER . . . . . . . . . . . . . . . . . . . . . . . . . . . . . . . . . . .10-20
ONCE COMMANDS AND SERIAL PROTOCOL . . . . . . . . . .10-23
TARGET SITE DEBUG SYSTEM REQUIREMENTS . . . . . . .10-24
EXAMPLES OF USING THE ONCE . . . . . . . . . . . . . . . . . . . .10-24
EXAMPLES OF JTAG AND ONCE INTERACTION . . . . . . . .10-29
DSP56602 User’s Manual
For More Information On This Product,
Go to: www.freescale.com
MOTOROLA
Freescale Semiconductor, Inc.
On-Chip Emulation Module
ARCHIVED BY FREESCALE SEMICONDUCTOR, INC. 2005
ARCHIVED BY FREESCALE SEMICONDUCTOR, INC. 2005
Freescale Semiconductor, Inc...
10.1
Introduction
INTRODUCTION
The DSP56600 core On-Chip Emulation (OnCE™) module provides a means of
interacting with the DSP56600 core and its peripherals non-intrusively so that a user can
examine registers, memory, or on-chip peripherals, thus facilitating hardware and
software development on the DSP56600 core processor. To achieve this, special circuits
and dedicated pins on the DSP56602 are defined to avoid sacrificing any user-accessible
on-chip resource. The OnCE module resources can be accessed only after executing the
JTAG instruction ENABLE_ONCE (these resources are accessible even when the chip is
operating in Normal mode). See Section 12, JTAG Port, for a description of the JTAG
functionality and its relation to the OnCE. Figure 10-1 shows the block diagram of the
OnCE module.
PDB PIL GDB
Pipeline
Information
Trace Logic
TCK
Control Bus
TDI
OnCE
Controller
XAB
YAB
PAB
TDO
TRST
DE
Trace
Buffer
Breakpoint
Logic
Tags
Buffer
AA0702
Figure 10-1 OnCE Module Block Diagram
10.2
OnCE MODULE PINS
The OnCE module controller functionality is accessed through the JTAG Test Access
Port (TAP). There are no dedicated OnCE module pins for clock, data in, or data out. The
JTAG pins TCK, TDI, and TDO are used to shift in and out data and instructions. See
JTAG Pins on page 11-5 for the description of the JTAG pins. To facilitate
emulation-specific functions, one additional pin, called DE, is provided on the
DSP56602.
MOTOROLA
DSP56602 User’s Manual
For More Information On This Product,
Go to: www.freescale.com
10-3
Freescale Semiconductor, Inc.
On-Chip Emulation Module
ARCHIVED BY FREESCALE SEMICONDUCTOR, INC. 2005
The bidirectional open drain Debug Event pin (DE) provides a fast means of entering the
Debug mode of operation from an external command controller (when input), as well as
a fast means of acknowledging the entering of the Debug mode of operation to an
external command controller (when output). The assertion of this pin by a command
controller causes the DSP56600 core to finish the current instruction being executed, save
the instruction pipeline information, enter the Debug mode, and wait for commands to
be entered from the TDI line. If the DE pin is used to enter the Debug mode, then it must
be deasserted after the OnCE port responds with an acknowledge and before sending
the first OnCE command. The assertion of this pin by the DSP56600 core indicates that
the DSP has entered the Debug mode and is waiting for commands to be entered from
the TDI line. The DE pin also facilitates multiple processor connections, as shown in
Figure 10-2.
ARCHIVED BY FREESCALE SEMICONDUCTOR, INC. 2005
Freescale Semiconductor, Inc...
OnCE Controller
DE
RESET
(Optional)
TDI
TDI
TDO
TDI
TDO
TDI
TDO
TDO
TMS
TCK
TRST
AA0703
Figure 10-2 OnCE Module Multiprocessor Configuration
In this way, the user can stop all the devices in the system when one of the devices enters
the Debug mode. The user can also stop all the devices synchronously by asserting the
DE line.
10.3
OnCE CONTROLLER
The OnCE controller contains the following blocks: OnCE Command Register (OCR),
OnCE Decoder, and the status/control register. Figure 10-3 illustrates a block diagram
of the OnCE controller.
10-4
DSP56602 User’s Manual
For More Information On This Product,
Go to: www.freescale.com
MOTOROLA
Freescale Semiconductor, Inc.
On-Chip Emulation Module
ARCHIVED BY FREESCALE SEMICONDUCTOR, INC. 2005OnCE Controller
TDI
TCK
OnCE Command Register
ISBKPT
Update
OnCE Decoder
ISDEBUG
ISSWDBG
ARCHIVED BY FREESCALE SEMICONDUCTOR, INC. 2005
Freescale Semiconductor, Inc...
ISTRACE
ISDR
Status and Control
Register
Register Read
Register Write
TDO
Mode Select
AA0704
Figure 10-3 OnCE Controller Block Diagram
10.3.1
OnCE Command Register (OCR)
The OnCE Command Register (OCR) is an 8-bit shift register that receives its serial data
from the TDI pin. It holds the 8-bit commands to be used as input for the OnCE
Decoder. The OCR is shown in Figure 10-4.
OCR
OnCE Command
Register
Reset = $00
Write Only
7
6
5
R/W
GO
EX
4
3
2
1
0
RS4 RS3 RS2 RS1 RS0
AA0106
Figure 10-4 OnCE Command Register
10.3.1.1
Register Select (RS[4:0])—Bits 0–4
The Register Select (RS[4:0]) bits define which register is source/destination for the
read/write operation. Table 10-1 shows the OnCE register addresses.
MOTOROLA
DSP56602 User’s Manual
For More Information On This Product,
Go to: www.freescale.com
10-5
Freescale Semiconductor, Inc.
On-Chip Emulation Module
OnCE Controller
ARCHIVED BY FREESCALE SEMICONDUCTOR, INC. 2005
Table 10-1 OnCE Register Select Encoding
ARCHIVED BY FREESCALE SEMICONDUCTOR, INC. 2005
Freescale Semiconductor, Inc...
RS[4:0]
10-6
Register Selected
00000
OnCE Status and Control Register (OSCR)
00001
OnCE Memory Breakpoint Counter (OMBC)
00010
OnCE Breakpoint Control Register (OBCR)
00011
(Reserved)
00100
(Reserved)
00101
Memory Limit Register 0 (OMLR0)
00110
Memory Limit Register 1 (OMLR1)
00111
(Reserved)
01000
(Reserved)
01001
OnCE Global Data Bus Register (OGDBR)
01010
OnCE Program Data Bus Register (OPDBR)
01011
OnCE PIL Register (OPILR)
01100
OnCE Program Data Bus GO-TO Register (for GO TO command)
01101
OnCE Trace Counter (OTC)
01110
(Reserved)
01111
OnCE PAB Register for Fetch (OPABFR)
10000
OnCE PAB Register for Decode (OPABDR)
10001
OnCE PAB Register for Execute (OPABEX)
10010
Trace Buffer and Increment Pointer
10011
(Reserved)
101xx
(Reserved)
11xx0
(Reserved)
11x0x
(Reserved)
110xx
(Reserved)
11111
No Register Selected
DSP56602 User’s Manual
For More Information On This Product,
Go to: www.freescale.com
MOTOROLA
Freescale Semiconductor, Inc.
On-Chip Emulation Module
ARCHIVED BY FREESCALE SEMICONDUCTOR, INC. 2005OnCE Controller
10.3.1.2
Exit Command (EX)—Bit 5
If the EX bit is set, leave Debug mode and resume normal operation. The EXIT command
is executed only if the GO command is issued, and the operation is write to OPDBR or
read/write to “No Register Selected”. Otherwise the EX bit is ignored. Table 10-2 shows
the definition of the EX bit.
ARCHIVED BY FREESCALE SEMICONDUCTOR, INC. 2005
Freescale Semiconductor, Inc...
Table 10-2 EX Bit Definition
EX
Action
0
Remain in Debug mode
1
Leave Debug mode
10.3.1.3
GO Command (GO)—Bit 6
If the GO bit is set, execute the instruction that resides in the PIL register. To execute the
instruction, the core leaves the Debug mode. The core returns to the Debug mode
immediately after executing the instruction if the EX bit is cleared. The core goes on to
normal operation if the EX bit is set. The GO command is executed only if the operation
is write to OPDBR or read/write to “No Register Selected”. Otherwise, the GO bit is
ignored. Table 10-3 shows the definition of the GO bit.
Table 10-3 GO Bit Definition
GO
Action
0
Inactive—no action taken
1
Execute instruction in PIL
10.3.1.4
Read/Write Command (R/W)—Bit 7
The R/W bit specifies the direction of data transfer. Table 10-4 shows the definition of
the R/W bit.
Table 10-4 R/W Bit Definition
R/W
Action
0
Write the data associated with the command into the register specified by RS[4:0].
1
Read the data contained in the register specified by RS[4:0].
MOTOROLA
DSP56602 User’s Manual
For More Information On This Product,
Go to: www.freescale.com
10-7
Freescale Semiconductor, Inc.
On-Chip Emulation Module
ARCHIVED BY FREESCALE SEMICONDUCTOR, INC. 2005
OnCE Controller
10.3.2
OnCE Decoder (ODEC)
The OnCE Decoder (ODEC) supervises the entire OnCE module activity. It receives as
input the 8-bit command from the OCR, a signal from JTAG Controller (indicating that
8/24 bits have been received and update of the selected data register must be
performed), and a signal indicating that the core was halted. The ODEC generates all the
strobes required for reading and writing the selected OnCE registers.
ARCHIVED BY FREESCALE SEMICONDUCTOR, INC. 2005
Freescale Semiconductor, Inc...
10.3.3
OnCE Status and Control Register (OSCR)
The OnCE Status and Control Register (OSCR) is a 24-bit register used to enable the
Trace mode of operation and to indicate the cause of entering the Debug mode. The
control bits are read/write while the status bits are read-only. The OSCR bits are cleared
on hardware reset. The OSCR is shown in Figure 10-5.
23
OnCE Status and
Control Register
Read/Write
*
*
*
*
*
*
9
8
*
*
7
6
OS1 OS0
5
*
4
3
2
1
0
TO MBO SWO IME TME
* Indicates reserved bits, written as 0 for future compatibility
AA0705
Figure 10-5 OnCE Status and Control Register (OSCR)
10.3.3.1
Trace Mode Enable (TME)—Bit 0
When the Trace Mode Enable (TME) control bit is set, the Trace mode of operation is
enabled.
10.3.3.2
Interrupt Mode Enable (IME)—Bit 1
The Interrupt Mode Enable (IME) control bit, when set, causes the chip to execute a
vectored interrupt to the address VBA:$06 instead of entering the Debug mode.
10.3.3.3
Software Debug Occurrence (SWO)—Bit 2
The Software Debug Occurrence (SWO) bit is a read-only status bit that is set when the
Debug mode of operation is entered because of the execution of the DEBUG or
DEBUGcc instruction with condition true. This bit is cleared when leaving the Debug
mode.
10-8
DSP56602 User’s Manual
For More Information On This Product,
Go to: www.freescale.com
MOTOROLA
Freescale Semiconductor, Inc.
On-Chip Emulation Module
ARCHIVED BY FREESCALE SEMICONDUCTOR, INC. 2005OnCE Controller
10.3.3.4
Memory Breakpoint Occurrence (MBO)—Bit 3
The Memory Breakpoint Occurrence (MBO) bit is a read-only status bit that is set when
the Debug mode of operation is entered because a memory breakpoint has been
encountered. This bit is cleared when leaving the Debug mode.
ARCHIVED BY FREESCALE SEMICONDUCTOR, INC. 2005
Freescale Semiconductor, Inc...
10.3.3.5
Trace Occurrence (TO)—Bit 4
The Trace Occurrence (TO) bit is a read-only status bit that is set when the Debug mode
of operation is entered when the Trace Counter is zero while Trace mode is enabled. This
bit is cleared when leaving the Debug mode.
10.3.3.6
Reserved Bit—Bit 5
Bit 5 of the OSCR is reserved for future use. It is read as 0 and should be written with 0
for future compatibility.
10.3.3.7
Core Status (OS[1:0])—Bits 6-7
The Core Status (OS[1:0]) bits are read-only status bits that provide core status
information. By examining the status bits, the user can determine whether the chip has
entered the Debug mode. Examining SWO, MBO, and TO identifies the cause of entering
the Debug mode. The user can also examine these bits and determine the cause why the
chip has not entered the Debug mode after debug event assertion (DE) or as a result of
the execution of the JTAG DEBUG_REQUEST instruction (core waiting for the bus,
STOP or WAIT instruction, etc.). These bits are also reflected in the JTAG Instruction
shift Register (IR), which allows the polling of the core status information at the JTAG
level. This is useful when the DSP56600 core executes the STOP instruction (and
therefore there are no clocks) to allow the reading of OSCR. See Table 10-5 for the
definition of the OS[1:0] bits.
Table 10-5 Core Status Bits Description
OS[1:0]
Description
00
DSP56600 core is executing instructions
01
DSP56600 core is in Wait or Stop mode
10
DSP56600 core is waiting for bus
11
DSP56600 core is in Debug mode
10.3.3.8
Reserved Bits—Bits 8–23
Bits 8–23 of the OSCR are reserved for future use. They are read as 0 and should be
written with 0 for future compatibility.
MOTOROLA
DSP56602 User’s Manual
For More Information On This Product,
Go to: www.freescale.com
10-9
Freescale Semiconductor, Inc.
On-Chip Emulation Module
ARCHIVED
OnCE Memory Breakpoint
Logic BY FREESCALE SEMICONDUCTOR, INC. 2005
10.4
OnCE MEMORY BREAKPOINT LOGIC
TCK
ARCHIVED BY FREESCALE SEMICONDUCTOR, INC. 2005
Freescale Semiconductor, Inc...
Memory breakpoints can be set on program memory or data memory locations. In
addition, the breakpoint does not have to be in a specific memory address, but within an
approximate address range of where the program may be executing. This significantly
increases the programmer’s ability to monitor what the program is doing in real-time.
The breakpoint logic, described in Figure 10-6, contains a latch for the addresses,
registers that store the upper and lower address limit, address comparators, and a
breakpoint counter.
PAB
XAB
YAB
TDO TDI
Memory Address Latch
Memory Bus Select
TDI TCK TDO
N,V
Address Comparator 0
Breakpoint Control
Memory Limit Register 0
Address Comparator 1
N,V
Memory
Breakpoint
Selection
Memory Limit Register 1
Breakpoint Counter
DEC
Breakpoint
Occurred
Count = 0
ISBKPT
AA0706
Figure 10-6 OnCE Memory Breakpoint Logic 0
Address comparators are useful in determining where a program may be getting lost or
when data is being written where it should not be written. They are also useful in halting
a program at a specific point to examine/change registers or memory. Using address
comparators to set breakpoints enables the user to set breakpoints in RAM or ROM and
while in any operating mode. Memory accesses are monitored according to the contents
of the OBCR as specified in OnCE Breakpoint Control Register (OBCR) on page 10-12.
10-10
DSP56602 User’s Manual
For More Information On This Product,
Go to: www.freescale.com
MOTOROLA
Freescale Semiconductor, Inc.
On-Chip Emulation Module
ARCHIVED BY FREESCALE SEMICONDUCTOR,
INC. 2005Breakpoint Logic
OnCE Memory
10.4.1
OnCE Memory Address Latch (OMAL)
The OnCE Memory Address Latch (OMAL) is a 16-bit register that latches the PAB, XAB
or YAB on every instruction cycle according to the MBS1–MBS0 bits in OBCR.
ARCHIVED BY FREESCALE SEMICONDUCTOR, INC. 2005
Freescale Semiconductor, Inc...
10.4.2
OnCE Memory Limit Register 0 (OMLR0)
The OnCE Memory Limit Register 0 (OMLR0) is a 16-bit register that stores the memory
breakpoint limit.Before enabling breakpoints, OMLR0 must be loaded by the external
command controller. OMLR0 can be read or written through the TAP.
10.4.3
OnCE Memory Address Comparator 0 (OMAC0)
The OnCE Memory Address Comparator 0 (OMAC0) compares the current memory
address (stored in OMAL0) with the OMLR0 contents.
10.4.4
OnCE Memory Limit Register 1 (OMLR1)
The OnCE Memory Limit Register 1 (OMLR1) is a 16-bit register that stores the memory
breakpoint limit. OMLR1 can be read or written through the TAP. Before enabling
breakpoints, OMLR1 must be loaded by the external command controller.
10.4.5
OnCE Memory Address Comparator 1 (OMAC1)
The OnCE Memory Address Comparator 1 (OMAC1) compares the current memory
address (stored in OMAL0) with the OMLR1 contents.
MOTOROLA
DSP56602 User’s Manual
For More Information On This Product,
Go to: www.freescale.com
10-11
Freescale Semiconductor, Inc.
On-Chip Emulation Module
ARCHIVED
OnCE Memory Breakpoint
Logic BY FREESCALE SEMICONDUCTOR, INC. 2005
10.4.6
OnCE Breakpoint Control Register (OBCR)
15
14
13
12
*
*
*
*
OnCE Breakpoint
Control Register
Reset = $0010
Read/Write
11
10
BT1 BT0
9
8
7
6
5
4
3
2
1
0
CC
11
CC
10
RW
11
RW
10
CC
01
CC
00
RW
01
RW
00
MB
S1
MB
S0
* Indicates reserved bits, written as 0 for future compatibility
ARCHIVED BY FREESCALE SEMICONDUCTOR, INC. 2005
Freescale Semiconductor, Inc...
The OnCE Breakpoint Control Register (OBCR) is a 16-bit register used to define the
memory breakpoint events. OBCR can be read or written through the JTAG TAP. All the
bits of the OBCR are cleared on hardware reset. The OBCR is described in Figure 10-7.
AA0707
Figure 10-7 OnCE Breakpoint Control Register (OBCR)
10.4.6.1
Memory Breakpoint Select Bits (MBS[1:0])—Bits 0–1
The Memory Breakpoint Select (MBS[1:0]) bits enable memory Breakpoint0 and
Breakpoint1, allowing them to occur when a memory access is performed on P, X, or Y
space access is performed. See Table 10-6 for the definition of the MBS[1:0] bits.
Table 10-6 Memory Breakpoint Select Table
MBS1
MBS0
Description
0
0
Reserved
0
1
Breakpoint on P access
1
0
Breakpoint on X access
1
1
Breakpoint on Y access
10.4.6.2
Breakpoint0 Read/Write Select (RW0[1:0])—Bits 2–3
The Breakpoint 0 Read/Write Select (RW0[1:0]) bits define the memory Breakpoint0 to
occur when a memory address accesses is performed for read, write or both. See
Table 10-7 for the definition of the RW0[1:0] bits.
10-12
DSP56602 User’s Manual
For More Information On This Product,
Go to: www.freescale.com
MOTOROLA
Freescale Semiconductor, Inc.
On-Chip Emulation Module
ARCHIVED BY FREESCALE SEMICONDUCTOR,
INC. 2005Breakpoint Logic
OnCE Memory
ARCHIVED BY FREESCALE SEMICONDUCTOR, INC. 2005
Freescale Semiconductor, Inc...
Table 10-7 Breakpoint0 Read/Write Select Table
RW01
RW00
Description
0
0
Breakpoint disabled
0
1
Breakpoint on write access
1
0
Breakpoint on read access
1
1
Breakpoint on read or write access
10.4.6.3
Breakpoint0 CC Select (CC0[1:0])—Bits 4–5
The Breakpoint0 Condition Code Select (CC0[1:0]) bits define the condition of the
comparison between the current Memory Address (OMAL0) and the Memory Limit
Register 0 (OMLR0). See Table 10-8 for the definition of the CC0[1:0] bits.
Table 10-8 Breakpoint0 Condition Select Table
CC01
CC00
Description
0
0
Breakpoint on not equal
0
1
Breakpoint on equal
1
0
Breakpoint on less than
1
1
Breakpoint on greater than
10.4.6.4
Breakpoint1 Read/Write Select (RW1[1:0])—Bits 6–7
The Breakpoint1 Read/Write Select (RW1[1:0]) bits control define memory Breakpoints1
to occur when a memory address accesses is performed for read, write or both. See
Table 10-9 for the definition of the RW1[1:0] bits.
Table 10-9 Breakpoint1 Read/Write Select Table
RW11
RW10
0
0
Breakpoint disabled
0
1
Breakpoint on write access
1
0
Breakpoint on read access
1
1
Breakpoint read or write access
MOTOROLA
Description
DSP56602 User’s Manual
For More Information On This Product,
Go to: www.freescale.com
10-13
Freescale Semiconductor, Inc.
On-Chip Emulation Module
ARCHIVED
OnCE Memory Breakpoint
Logic BY FREESCALE SEMICONDUCTOR, INC. 2005
10.4.6.5
Breakpoint1 CC Select (CC1[1:0])—Bits 8–9
The Breakpoint1 Condition Code Select (CC1[1:0]) bits define the condition of the
comparison between the current memory address (OMAL0) and the OnCE Memory
Limit Register 1 (OMLR1). See Table 10-10 for the definition of the CC1[1:0] bits.
ARCHIVED BY FREESCALE SEMICONDUCTOR, INC. 2005
Freescale Semiconductor, Inc...
Table 10-10 Breakpoint1 Condition Select Table
CC11
CC10
Description
0
0
Breakpoint on not equal
0
1
Breakpoint on equal
1
0
Breakpoint on less than
1
1
Breakpoint on greater than
10.4.6.6
Breakpoint Event Select Bits (BT[1:0])—Bits 10–11
The Breakpoint Event Select (BT[1:0]) bits define the sequence between Breakpoint0 and
Breakpoint1. If the condition defined by BT[1:0] is met, then the Breakpoint Counter
(OMBC) is decremented. See Table 10-11 for the definition of the BT[1:0] bits.
Table 10-11 Breakpoint0 and Breakpoint1 Event Select Table
BT1
BT0
Description
0
0
Breakpoint0 and Breakpoint1
0
1
Breakpoint0 or Breakpoint1
1
0
Breakpoint1 after Breakpoint0
1
1
Breakpoint0 after Breakpoint1
10.4.6.7
Reserved Bits—Bits 12–15
Bits 12–15 of the OBCR are reserved for future use. They are read as 0 and should be
written with 0 for future compatibility.
10.4.7
OnCE Memory Breakpoint Counter (OMBC)
The OnCE Memory Breakpoint Counter (OMBC) is a 16-bit counter that is loaded with a
value equal to the number of times minus one that a memory access event should occur
before a memory breakpoint is declared. The memory access event is specified by the
OBCR and by the memory limit registers. On each occurrence of the memory access
10-14
DSP56602 User’s Manual
For More Information On This Product,
Go to: www.freescale.com
MOTOROLA
Freescale Semiconductor, Inc.
On-Chip Emulation Module
ARCHIVED BY FREESCALE SEMICONDUCTOR, INC. 2005
OnCE Trace Logic
event, the breakpoint counter is decremented. When the counter reaches 0 and a new
occurrence takes place, the chip enters the Debug mode. The OMBC can be read or
written through the TAP. Every time that the limit register is changed, or a different
breakpoint event is selected in the OBCR, the breakpoint counter must be written
afterwards. This ensures that the OnCE breakpoint logic is reset and that no previous
events can affect the new breakpoint event selected. The breakpoint counter is cleared by
hardware reset.
ARCHIVED BY FREESCALE SEMICONDUCTOR, INC. 2005
Freescale Semiconductor, Inc...
10.5
OnCE TRACE LOGIC
Using the OnCE Trace Logic, execution of instructions in single or multiple steps is
possible. The OnCE Trace Logic causes the chip to enter the Debug mode of operation
after the execution of one or more instructions and wait for OnCE commands from the
debug serial port. The OnCE Trace Logic block diagram is shown in Figure 10-8.
End of Instruction
TDI
TDO
Trace Counter
DEC
TCK
Count = 0
ISTRACE
AA0708
Figure 10-8 OnCE Trace Logic Block Diagram
The Trace mode has a counter associated with it so that more than one instruction can be
executed before returning back to the Debug mode of operation. The objective of the
counter is to allow the user to take multiple instruction steps real-time before entering
the Debug mode. This feature helps the software developer debug sections of code that
do not have a normal flow or are getting hung up in infinite loops. The Trace Counter
also enables the user to count the number of instructions executed in a code segment.
The OnCE Trace Counter (OTC) is a 16-bit counter that can be read or written through
the TAP. If N instructions are to be executed before entering the Debug mode, the Trace
Counter should be loaded with N – 1. The Trace Counter is cleared by hardware reset.
MOTOROLA
DSP56602 User’s Manual
For More Information On This Product,
Go to: www.freescale.com
10-15
Freescale Semiconductor, Inc.
On-Chip Emulation Module
ARCHIVED
BY FREESCALE SEMICONDUCTOR, INC. 2005
Methods of Entering the
Debug Mode
To enable the Trace mode of operation, do the following:
1. Load the counter with a value.
2. Set the program counter to the start location of the instruction(s) to be executed
real-time.
3. Set the TME bit in the OSCR.
ARCHIVED BY FREESCALE SEMICONDUCTOR, INC. 2005
Freescale Semiconductor, Inc...
4. Cause the DSP56600 core to exit the Debug mode by executing the appropriate
command issued by the external command controller.
Upon exiting the Debug mode, the counter is decremented after each execution of an
instruction. Interrupts are serviceable and all instructions executed, including fast
interrupt services and the execution of each repeated instruction, cause the Trace
Counter to be decremented. Upon decrementing to 0, the DSP56600 core re-enters the
Debug mode, the Trace Occurrence bit (TO) in the OSCR register is set, the core Status
bits OS[1:0] are set to 11, and the DE pin is asserted to indicate that the DSP56600 core
has entered Debug mode and is requesting service.
10.6
METHODS OF ENTERING THE DEBUG MODE
Entering the Debug mode is acknowledged by the chip by setting the OS[1:0] bits and
asserting the DE line. This informs the external command controller that the chip has
entered the Debug mode and is waiting for commands.The DSP56600 core can disable
the OnCE module if the ROM Security option is implemented. If the ROM Security is
implemented, the OnCE module remains inactive until a write operation to the OGDBR
is executed by the DSP56600 core.
10.6.1
External Debug Request During RESET Assertion
Holding the DE line asserted during the assertion of RESET causes the chip to enter the
Debug mode. After receiving the acknowledge, the external command controller must
negate the DE line before sending the first command.
Note:
10-16
In this case, the chip does not execute any instruction before entering the
Debug mode.
DSP56602 User’s Manual
For More Information On This Product,
Go to: www.freescale.com
MOTOROLA
Freescale Semiconductor, Inc.
On-Chip Emulation Module
ARCHIVED BY FREESCALE SEMICONDUCTOR,
2005the Debug Mode
Methods of INC.
Entering
10.6.2
External Debug Request During Normal Activity
Holding the DE line asserted during normal chip activity causes the chip to finish the
execution of the current instruction and then enter the Debug mode. After receiving the
acknowledge, the external command controller must negate the DE line before sending
the first command. This process is the same for any newly fetched instruction, including
instructions fetched by the interrupt processing or instructions that will be aborted by
the interrupt processing.
ARCHIVED BY FREESCALE SEMICONDUCTOR, INC. 2005
Freescale Semiconductor, Inc...
Note:
10.6.3
In this case the chip completes the execution of the current instruction and
stops after the newly fetched instruction enters the instruction latch.
Executing the JTAG DEBUG_REQUEST Instruction
Executing the JTAG instruction DEBUG_REQUEST asserts an internal debug request
signal. Consequently, the chip finishes the execution of the current instruction and stops
after the newly fetched instruction enters the instruction latch. After entering the Debug
mode, the Core Status bits OS1 and OS0 are set and the DE line is asserted, thus
acknowledging the external command controller that the Debug mode of operation has
been entered.
10.6.4
External Debug Request During Stop Mode
Executing the JTAG instruction DEBUG_REQUEST (or asserting DE) while the chip is in
the Stop state (i. e., has executed a STOP instruction) causes the chip to exit the Stop state
and enter the Debug mode. After receiving the acknowledge, the external command
controller must negate DE before sending the first command.
Note:
10.6.5
In this case, the chip completes the execution of the STOP instruction and halts
after the next instruction enters the instruction latch.
External Debug Request During Wait Mode
Executing the JTAG instruction DEBUG_REQUEST (or asserting DE) while the chip is in
the Wait state (i. e., has executed a WAIT instruction) causes the chip to exit the Wait
state and enter the Debug mode. After receiving the acknowledge, the external
command controller must negate DE before sending the first command.
MOTOROLA
DSP56602 User’s Manual
For More Information On This Product,
Go to: www.freescale.com
10-17
Freescale Semiconductor, Inc.
On-Chip Emulation Module
ARCHIVED
Pipeline Information and
OGDBR BY FREESCALE SEMICONDUCTOR, INC. 2005
Note:
10.6.6
In this case, the chip completes the execution of the WAIT instruction and
halts after the next instruction enters the instruction latch.
Software Request During Normal Activity
ARCHIVED BY FREESCALE SEMICONDUCTOR, INC. 2005
Freescale Semiconductor, Inc...
Upon executing the DEBUG instruction (or DEBUGcc when the specified condition is
true), the chip enters the Debug mode after the instruction following the DEBUG
instruction has entered the instruction latch.
10.6.7
Enabling Trace Mode
When the Trace mode mechanism is enabled and the Trace Counter is greater than zero,
the Trace Counter is decremented after each instruction execution. Execution of an
instruction when the value in the Trace Counter is 0 causes the chip to enter the Debug
mode after completing the execution of the instruction. Only instructions actually
executed cause the Trace Counter to decrement. An aborted instruction does not
decrement the Trace Counter and does not cause the chip to enter the Debug mode.
10.6.8
Enabling Memory Breakpoints
When the memory breakpoint mechanism is enabled with a Breakpoint Counter value of
0, the chip enters the Debug mode after completing the execution of the instruction that
caused the memory breakpoint to occur. In case of breakpoints on executed Program
memory fetches, the breakpoint is acknowledged immediately after the execution of the
fetched instruction. In case of breakpoints on accesses to X, Y, or P memory spaces by
MOVE instructions, the breakpoint is acknowledged after the completion of the
instruction following the instruction that accessed the specified address.
10.7
PIPELINE INFORMATION AND OGDBR
To restore the pipeline and to resume normal chip activity upon returning from the
Debug mode, a number of on-chip registers store the chip pipeline status. Figure 10-9
shows the block diagram of the Pipeline Information Registers, with the exception of the
PAB registers, which are shown in Figure 10-10 on page 10-22.
10-18
DSP56602 User’s Manual
For More Information On This Product,
Go to: www.freescale.com
MOTOROLA
Freescale Semiconductor, Inc.
On-Chip Emulation Module
ARCHIVED BY FREESCALE SEMICONDUCTOR,
2005
PipelineINC.
Information
and OGDBR
GDB Register (OGDBR)
GDB
PDB Register (OPDBR)
TDI
PDB
TDO
ARCHIVED BY FREESCALE SEMICONDUCTOR, INC. 2005
Freescale Semiconductor, Inc...
PIL Register (OPILR)
TCK
PIL
AA0709
Figure 10-9 OnCE Pipeline Information and GDB Registers
10.7.1
OnCE PDB Register (OPDBR)
The OnCE Program Data Bus Register (OPDBR) is a 24-bit latch that stores the value of
the Program Data Bus generated by the last program memory access of the core before
the Debug mode is entered. The OPDBR register can be read or written through the TAP.
This register is affected by the operations performed during the Debug mode and must
be restored by the external command controller when returning to Normal mode.
10.7.2
OnCE PIL Register (OPILR)
The OnCE PIL Register (OPILR) is a 24-bit latch that stores the value of the Instruction
Latch before the Debug mode is entered. OPILR can only be read through the TAP.
Note:
Since the Instruction Latch is affected by the operations performed during the
Debug mode, it must be restored by the external command controller when
returning to Normal mode. Since there is no direct write access to the
Instruction Latch, the task of restoring is accomplished by writing to OPDBR
with no-GO and no-EX. In this case, the data written on PDB is transferred
into the Instruction Latch.
MOTOROLA
DSP56602 User’s Manual
For More Information On This Product,
Go to: www.freescale.com
10-19
Freescale Semiconductor, Inc.
On-Chip Emulation Module
Trace Buffer
10.7.3
ARCHIVED BY FREESCALE SEMICONDUCTOR, INC. 2005
OnCE GDB Register (OGDBR)
ARCHIVED BY FREESCALE SEMICONDUCTOR, INC. 2005
Freescale Semiconductor, Inc...
The OnCE GDB Register (OGDBR) is a 16-bit latch that can only be read through the
TAP. The OGDBR is not actually required from a pipeline status restore point of view,
but is required as a means of passing information between the chip and the external
command controller. The OGDBR is mapped on the X internal I/O space at address
$FFFB. Whenever the external command controller needs the contents of a register or
memory location, it forces the chip to execute an instruction that brings that information
to the OGDBR. Then the contents of the OGDBR are delivered serially to the external
command controller by the command “READ GDB REGISTER”.
10.8
TRACE BUFFER
To ease debugging activity and keep track of program flow, the DSP56600 core provides
a number of on-chip dedicated resources. There are three read-only PAB registers that
give pipeline information when the Debug mode is entered, and a Trace buffer that
stores the address of the last instruction that was executed, as well as the addresses of
the last eight change of flow instructions.
10.8.1
OnCE PAB Register for Fetch (OPABFR)
The OnCE PAB Register for Fetch Register (OPABFR) is a 16-bit register that stores the
address of the last instruction whose fetch was started before the Debug mode was
entered.The OPABFR can only be read through the TAP. This register is not affected by
the operations performed during the Debug mode.
10.8.2
PAB Register for Decode (OPABDR)
The OnCE PAB Register for Decode Register (OPABDR) is a 16-bit register that stores
the address of the instruction currently on the PDB. This is the instruction whose fetch
was completed before the chip has entered the Debug mode. The OPABDR can only be
read through the TAP. This register is not affected by the operations performed during
the Debug mode.
10-20
DSP56602 User’s Manual
For More Information On This Product,
Go to: www.freescale.com
MOTOROLA
Freescale Semiconductor, Inc.
On-Chip Emulation Module
ARCHIVED BY FREESCALE SEMICONDUCTOR, INC. 2005
10.8.3
Trace Buffer
OnCE PAB Register for Execute (OPABEX)
The OnCE PAB Register for Execute (OPABEX) is a 16-bit register that stores the address
of the instruction currently in the Instruction Latch. This is the instruction that would
have been decoded and executed if the chip had not entered the Debug mode. The
OPABEX register can be read only through the TAP. This register is not affected by the
operations performed during the Debug mode.
ARCHIVED BY FREESCALE SEMICONDUCTOR, INC. 2005
Freescale Semiconductor, Inc...
10.8.4
Trace Buffer
The Trace buffer stores the addresses of the last eight change of flow instructions that
were executed, as well as the address of the last executed instruction. The Trace buffer is
implemented as a circular buffer containing eight 17-bit registers and one 4-bit counter.
All the registers have the same address, but any read access to the Trace buffer address
causes the counter to increment, thus pointing to the next Trace buffer register. The
registers are serially available to the external command controller through their common
Trace buffer address. Figure 10-10 shows the block diagram of the Trace buffer. The
Trace buffer is not affected by the operations performed during the Debug mode except
for the Trace buffer pointer increment when reading the Trace buffer. When entering the
Debug mode, the Trace buffer counter is pointing to the Trace buffer register containing
the address of the last executed instructions. The first Trace buffer read obtains the
oldest address and the following Trace buffer reads get the other addresses from the
oldest to the newest, in order of execution.
MOTOROLA
DSP56602 User’s Manual
For More Information On This Product,
Go to: www.freescale.com
10-21
Freescale Semiconductor, Inc.
On-Chip Emulation Module
Trace Buffer
ARCHIVED BY FREESCALE SEMICONDUCTOR, INC. 2005
PAB
Fetch Address (OPABFR)
Execute Address (OPABEX)
ARCHIVED BY FREESCALE SEMICONDUCTOR, INC. 2005
Freescale Semiconductor, Inc...
Decode Address (OPABDR)
Trace Buffer Register 0
Circular
Buffer
Pointer
Trace Buffer Register 1
Trace Buffer Register 2
Trace Buffer Register 7
TDI
Trace Buffer Shift Register
TCK
TDO
AA0710
Figure 10-10 OnCE Trace Buffer
Notes:
10-22
1. To ensure Trace buffer coherence, a complete set of eight reads of the Trace
buffer must be performed. This is necessary because each read increments
the Trace buffer pointer, thus pointing to the next location. After eight
reads, the pointer indicates the same location as before starting the read
procedure.
DSP56602 User’s Manual
For More Information On This Product,
Go to: www.freescale.com
MOTOROLA
Freescale Semiconductor, Inc.
On-Chip Emulation Module
2. On any change of flow instruction, the Trace buffer stores both the address
of the change of flow instruction, as well as the address of the target of the
change of flow instruction. In the case of conditional change of flows, the
address of the change of flow instruction is always stored (regardless of the
fact that the change of flow is true or false), but if the conditional change of
flow is false (that is, not taken) the address of the target is not stored. In
order to facilitate the program trace reconstruction every Trace buffer
location has an additional “invalid bit” (the 25th bit). If a conditional
change of flow instruction has a “condition false”, the “invalid bit” is set,
thus marking this instruction as “not taken”. Therefore, it is imperative to
read seventeen bits of data when reading the eight Trace buffer registers.
Since data is read LSB first, the “invalid bit” is the first bit to be read.
ARCHIVED BY FREESCALE SEMICONDUCTOR, INC. 2005
Freescale Semiconductor, Inc...
ARCHIVED BY FREESCALE SEMICONDUCTOR,
INC. 2005
OnCE Commands
and Serial Protocol
10.9
OnCE COMMANDS AND SERIAL PROTOCOL
To permit an efficient means of communication between the external command
controller and the DSP56602, the following protocol is adopted. Before starting any
debugging activity, the external command controller waits for an acknowledge on the
DE line indicating that the chip has entered the Debug mode (optionally the external
command controller can poll the OS1 and OS0 bits in the JTAG instruction shift register).
The external command controller communicates with the chip by sending 8-bit
commands that can be accompanied by 24 bits of data. Both commands and data are sent
or received Least Significant Bit first. After sending a command, the external command
controller waits for the DSP56602 to acknowledge execution of the command. The
external command controller sends a new command only after the chip has
acknowledged execution of the previous command.
The OnCE commands are classified as follows:
• Read commands (when the chip delivers the required data)
• Write commands (when the chip receives data and writes the data in one of the
OnCE registers)
• Commands that do not have data transfers associated with them
The commands are 8 bits long and have the format shown in Figure 10-4 on page 10-5.
MOTOROLA
DSP56602 User’s Manual
For More Information On This Product,
Go to: www.freescale.com
10-23
Freescale Semiconductor, Inc.
On-Chip Emulation Module
ARCHIVED
BY FREESCALE SEMICONDUCTOR, INC. 2005
Target Site Debug System
Requirements
ARCHIVED BY FREESCALE SEMICONDUCTOR, INC. 2005
Freescale Semiconductor, Inc...
10.10 TARGET SITE DEBUG SYSTEM REQUIREMENTS
A typical debug environment consists of a target system where the DSP56600 core-based
device resides in the user defined hardware. The TAP interfaces to the external
command controller through a 14-pin connector that provides connections for the five
JTAG port lines, one OnCE module control line, a ground, a RESET line, and a target
power input line. The RESET line is optional and is only used to reset the DSP56600
core-based device and its associated circuitry. The external command controller acts as
the medium between the DSP56600 core target system and a host computer. The external
command controller circuit acts as a JTAG TAP driver and host computer command
interpreter. The controller issues commands based on the host computer inputs from a
user interface program that communicates with the user.
10.11 EXAMPLES OF USING THE OnCE
All the following examples of debugging procedures assume that the DSP is the only
device in the JTAG chain. If the chain has more than one device, the other devices can be
forced to execute the JTAG BYPASS instruction such that their effect in the serial stream
will be one bit per additional device. The select-DR, select-IR, update-DR, and shift-DR
events refer to bringing the JTAG TAP in the corresponding state. Please refer to Section
11, JTAG, for a detailed description of the JTAG protocol.
10.11.1
Checking Whether the Chip has Entered the Debug Mode
There are two methods to verify that the chip has entered the Debug mode:
1. Every time the chip enters the Debug mode, a pulse is generated on the DE pin. A
pulse is also generated every time the chip acknowledges the execution of an
instruction while in Debug mode. An external command controller can connect
the DE line to an interrupt pin in order to sense the acknowledge.
2. An external command controller can poll the JTAG instruction shift register for
the status bits OS[1:0]. When the chip is in Debug mode, these bits are set to the
value 11.
Note:
10-24
In the following paragraphs, “ACK” denotes the operation performed by the
command controller to see if the Debug mode has been entered, either by
sensing DE or by polling the JTAG instruction shift register.
DSP56602 User’s Manual
For More Information On This Product,
Go to: www.freescale.com
MOTOROLA
Freescale Semiconductor, Inc.
On-Chip Emulation Module
ARCHIVED BY FREESCALE SEMICONDUCTOR,
INC. 2005
Examples
of Using the OnCE
10.11.2
Polling the JTAG Instruction Shift Register
To poll the core status bits in the JTAG Instruction Shift register, do the following:
1. Select shift-IR. Passing through capture-IR loads the core status bits into the
instruction shift register.
2. Shift in ENABLE_ONCE. While shifting in the new instruction, the captured
status information is shifted out. Pass through update-IR.
ARCHIVED BY FREESCALE SEMICONDUCTOR, INC. 2005
Freescale Semiconductor, Inc...
3. Return to Run-Test/Idle.
The external command controller can analyze the information shifted out and detect
whether the chip has entered the Debug mode.
Note:
10.11.3
JTAG compliance requires a preamble of “01” prior to shifting out status
information.
Saving Pipeline Information
Debugging is accomplished with DSP56600 core instructions supplied from the external
command controller. Therefore, the current state of the DSP56600 core pipeline must be
saved prior to starting the debug activity, and the state must be restored prior to
returning to the Normal mode of operation. The following describes the saving
procedure:
1. Select shift-DR. Shift in the “Read PDB”. Pass through update-DR.
2. Select shift-DR. Shift out the 24-bit OPDB register. Pass through update-DR.
3. Select shift-DR. Shift in the “Read PIL”. Pass through update-DR.
4. Select shift-DR. Shift out the 24-bit OPILR register. Pass through update-DR.
Before starting the procedure, ensure that ENABLE_ONCE has been executed, and
Debug mode has been entered and verified, as described in Checking Whether the Chip
has Entered the Debug Mode on page 10-24. There is no need to verify acknowledge
between steps 1 and 2, as well as 3 and 4, because completion is guaranteed by design.
10.11.4
Reading the Trace Buffer
An optional step during debugging activity is reading the information associated with
the Trace buffer in order to enable an external program to reconstruct the full trace of the
MOTOROLA
DSP56602 User’s Manual
For More Information On This Product,
Go to: www.freescale.com
10-25
Freescale Semiconductor, Inc.
On-Chip Emulation Module
BY FREESCALE SEMICONDUCTOR, INC. 2005
Examples of Using theARCHIVED
OnCE
executed program. Following is the description of the read Trace buffer procedure
(assume that all actions described in Saving Pipeline Information have been executed):
1. Select shift-DR. Shift in the “Read PABFR”. Pass through update-DR.
2. Select shift-DR. Shift out the 16-bit OPABFR register. Pass through update-DR.
3. Select shift-DR. Shift in the “Read PABDR”. Pass through update-DR.
4. Select shift-DR. Shift out the 16 bit OPABDR register. Pass through update-DR.
6. Select shift-DR. Shift out the 16-bit OPABEX register. Pass through update-DR.
ARCHIVED BY FREESCALE SEMICONDUCTOR, INC. 2005
Freescale Semiconductor, Inc...
5. Select shift-DR. Shift in the “Read PABEX”. Pass through update-DR.
7. Select shift-DR. Shift in the “Read FIFO”. Pass through update-DR.
8. Select shift-DR. Shift out the 17-bit FIFO register. Pass through update-DR.
9. Repeat steps 7 and 8 for the entire FIFO (8 times).
Note:
The user must read the entire FIFO, since each read increments the FIFO
pointer, thus pointing to the next FIFO location. At the end of this procedure,
the FIFO pointer points back to the beginning of the FIFO.
The information that has been read by the external command controller now contains
the address of the newly fetched instruction, the address of the instruction currently on
the PDB, the address of the instruction currently on the instruction latch, as well as the
addresses of the last eight instructions that have been executed and are change of flow. A
user program can now reconstruct the flow of a full trace based on this information and
on the original source code of the currently running program.
10.11.5
Displaying a Specified Register
The DSP56602 must be in Debug mode and all actions described in Saving Pipeline
Information on page 10-25 have been executed. The sequence of actions is:
1. Select shift-DR. Shift in the “Write PDB with GO no-EX”. Pass through
update-DR.
2. Select shift-DR. Shift in the 24-bit opcode: “MOVE reg, X:OGDB”. Pass through
update-DR to actually write OPDBR and thus begin executing the MOVE
instruction.
3. Wait for DSP to reenter Debug mode (wait for DE or poll core status).
4. Select shift-DR and shift in “READ GDB REGISTER”. Pass through update-DR
(this selects OGDBR as the data register for read).
10-26
DSP56602 User’s Manual
For More Information On This Product,
Go to: www.freescale.com
MOTOROLA
Freescale Semiconductor, Inc.
On-Chip Emulation Module
ARCHIVED BY FREESCALE SEMICONDUCTOR,
INC. 2005
Examples
of Using the OnCE
5. Select shift-DR. Shift out the OGDBR contents. Pass through update-DR. Wait for
next command.
10.11.6
Displaying X Memory Area Starting at Address $xxxx
ARCHIVED BY FREESCALE SEMICONDUCTOR, INC. 2005
Freescale Semiconductor, Inc...
The DSP56602 must be in Debug mode and all actions described in Saving Pipeline
Information on page 10-25 must have been executed. Since R0 is used as pointer for the
memory, R0 is saved first. The sequence of actions is:
1. Select shift-DR. Shift in the “Write PDB with GO no-EX”. Pass through
update-DR.
2. Select shift-DR. Shift in the 24-bit opcode: “MOVE R0, X:OGDB”. Pass through
update-DR to actually write OPDBR and begin executing the MOVE instruction.
3. Wait for DSP to reenter Debug mode (wait for DE or poll core status).
4. Select shift-DR and shift in “READ GDB REGISTER”. Pass through update-DR
(this selects OGDBR as the data register for read).
5. Select shift-DR. Shift out the OGDBR contents. Pass through update-DR. R0 is
now saved.
6. Select shift-DR. Shift in the “Write PDB with no-GO no-EX”. Pass through
update-DR.
7. Select shift-DR. Shift in the 24-bit opcode: “MOVE #$xxxx,R0”. Pass through
update-DR to actually write OPDBR.
8. Select shift-DR. Shift in the “Write PDB with GO no-EX”. Pass through
update-DR.
9. Select shift-DR. Shift in the second word of the 24-bit opcode: “MOVE #$xxxx,R0”
(the $xxxx field). Pass through update-DR to actually write OPDBR and execute
the instruction. R0 is loaded with the base address of the memory block to be
read.
10. Wait for DSP to reenter Debug mode (wait for DE or poll core status).
11. Select shift-DR. Shift in the “Write PDB with GO no-EX”. Pass through
update-DR.
12. Select shift-DR. Shift in the 24-bit opcode: “MOVE X:(R0)+, X:OGDB”. Pass
through update-DR to actually write OPDBR and begin executing the MOVE
instruction.
13. Wait for DSP to reenter Debug mode (wait for DE or poll core status).
MOTOROLA
DSP56602 User’s Manual
For More Information On This Product,
Go to: www.freescale.com
10-27
Freescale Semiconductor, Inc.
On-Chip Emulation Module
BY FREESCALE SEMICONDUCTOR, INC. 2005
Examples of Using theARCHIVED
OnCE
14. Select shift-DR and shift in “READ GDB REGISTER”. Pass through update-DR
(this selects OGDBR as the data register for read).
15. Select shift-DR. Shift out the OGDBR contents. Pass through update-DR. The
memory contents of address $xxxx is read.
16. Select shift-DR. Shift in the “NO SELECT with GO no-EX”. Pass through
update-DR. This re-executes the same “MOVE X:(R0)+, X:OGDB” instruction.
17. Repeat from step 14 to complete the reading of the entire block. When finished,
restore the original value of R0.
ARCHIVED BY FREESCALE SEMICONDUCTOR, INC. 2005
Freescale Semiconductor, Inc...
Note:
10.11.7
Polling for status through the JTAG instruction register is preferable to
reading the OnCE Status Register through the DR path.
Going from Debug to Normal Mode in a Current Program
In this case, the user has finished examining the current state of the machine, changed
some of the registers, and wishes to return and continue execution of its program from
the point where it stopped. Therefore, the user must restore the pipeline of the machine
end enable normal instruction execution. The sequence of actions is:
1. Select shift-DR. Shift in the “Write PDB with no-GO no-EX”. Pass through
update-DR.
2. Select shift-DR. Shift in the 24 bits of saved PIL (instruction latch value). Pass
through update-DR to actually write the Instruction Latch.
3. Select shift-DR. Shift in the “Write PDB with GO and EX”. Pass through
update-DR.
4. Select shift-DR. Shift in the 24 bits of saved PDB. Pass through update-DR to
actually write the PDB. At the same time the internally saved value of the PAB is
driven back from the PABFR register onto the PAB, the ODEC releases the chip
from Debug mode and the normal flow of execution is continued.
10.11.8
Going from Debug to Normal Mode in a New Program
In this case, the user has finished examining the current state of the machine, changed
some of the registers, and wishes to start the execution of a new program (the GOTO
command). Therefore, the user must force a “change of flow” to the starting address of
the new program ($xxxx). The sequence of actions is:
10-28
DSP56602 User’s Manual
For More Information On This Product,
Go to: www.freescale.com
MOTOROLA
Freescale Semiconductor, Inc.
On-Chip Emulation Module
ARCHIVED BY FREESCALE SEMICONDUCTOR,
INC.and
2005OnCE interaction
Examples of JTAG
1. Select shift-DR. Shift in the “Write PDB with no-GO no-EX”. Pass through
update-DR.
1. Select shift-DR. Shift in the 24-bit “$0AF080”, which is the opcode of the JUMP
instruction. Pass through update-DR to actually write the Instruction Latch.
2. Select shift-DR. Shift in the “Write PDB-GO-TO with GO and EX”. Pass through
update-DR.
Note:
ARCHIVED BY FREESCALE SEMICONDUCTOR, INC. 2005
Freescale Semiconductor, Inc...
3. Select shift-DR. Shift in the 16 bits of “$xxxx”. Pass through update-DR to actually
write the PDB. At this time the ODEC releases the chip from Debug mode and the
execution is started from the address $xxxx.
If the Debug mode is entered during a DO LOOP, REP instruction, or other
special cases such as interrupt processing, STOP, WAIT, or conditional
branching, the user must first reset the DSP56602 before proceeding with the
execution of the new program.
10.12 EXAMPLES OF JTAG AND OnCE INTERACTION
This subsection lists the details of the JTAG port/OnCE module interaction and TMS
sequencing required to achieve the communication described in Examples of Using the
OnCE on page 10-24.
The external command controller can force the DSP56602 into Debug mode by executing
the JTAG instruction DEBUG_REQUEST. In order to check that the DSP56602 has
entered the Debug mode, the external command controller must poll the status by
reading the OS[1:0] bits in the JTAG instruction shift register. After executing the JTAG
instructions DEBUG_REQUEST and ENABLE_ONCE and after the core status was
polled to verify that the chip is in Debug mode, the pipeline saving procedure must take
place. The TMS sequencing for this procedure is depicted in Table 10-12. The
sequencing of enabling the OnCE module is described in Table 10-13 on page 10-30.
Table 10-12 TMS Sequencing for DEBUG_REQUEST
Step
TMS
JTAG Port
OnCE Module
a
0
Run-Test/Idle
Idle
b
1
Select-DR-Scan
Idle
c
1
Select-IR-Scan
Idle
d
0
Capture-IR
Idle
MOTOROLA
Note
The status is sampled in the shifter.
DSP56602 User’s Manual
For More Information On This Product,
Go to: www.freescale.com
10-29
Freescale Semiconductor, Inc.
On-Chip Emulation Module
BY FREESCALE SEMICONDUCTOR, INC. 2005
Examples of JTAG andARCHIVED
OnCE interaction
Table 10-12 TMS Sequencing for DEBUG_REQUEST (continued)
Step
TMS
JTAG Port
OnCE Module
Note
e
0
Shift-IR
Idle
The four bits of the JTAG
DEBUG_REQUEST (0111) are
shifted in while status is
shifted out.
ARCHIVED BY FREESCALE SEMICONDUCTOR, INC. 2005
Freescale Semiconductor, Inc...
..................................................................
e
0
Shift-IR
Idle
f
1
Exit1-IR
Idle
g
1
Update-IR
Idle
h
1
Select-DR-Scan
Idle
i
1
Select-IR-Scan
Idle
j
0
Capture-IR
Idle
The status is sampled in the shifter.
k
0
Shift-IR
Idle
The four bits of the JTAG
DEBUG_REQUEST (0111) are
shifted in while status is
shifted out.
..................................................................
k
0
Shift-IR
Idle
l
1
Exit1-IR
Idle
m
1
Update-IR
Idle
n
0
Run-Test/Idle
Idle
................................................
n
0
Run-Test/Idle
The debug request is generated.
This step is repeated, enabling an
external command controller to
poll the status.
Idle
In “step n” the external command controller verifies that the OS[1:0] bits have the value
11, indicating that the chip has entered the Debug mode. If the chip has not yet entered
the Debug mode, the external command controller goes to “step b”, “step c” etc. until the
Debug mode is acknowledged.
Table 10-13 TMS Sequencing for ENABLE_ONCE
Step
TMS
JTAG Port
OnCE Module
a
1
Test-Logic-Reset
Idle
b
0
Run-Test/Idle
Idle
c
1
Select-DR-Scan
Idle
d
1
Select-IR-Scan
Idle
10-30
DSP56602 User’s Manual
Note
For More Information On This Product,
Go to: www.freescale.com
MOTOROLA
Freescale Semiconductor, Inc.
On-Chip Emulation Module
ARCHIVED BY FREESCALE SEMICONDUCTOR,
INC.and
2005OnCE interaction
Examples of JTAG
ARCHIVED BY FREESCALE SEMICONDUCTOR, INC. 2005
Freescale Semiconductor, Inc...
Table 10-13 TMS Sequencing for ENABLE_ONCE (continued)
Step
TMS
JTAG Port
OnCE Module
Note
e
0
Capture-IR
Idle
The core status bits are captured.
f
0
Shift-IR
Idle
g
0
Shift-IR
Idle
h
0
Shift-IR
Idle
The four bits of the JTAG
ENABLE_ONCE instruction
(0110) are shifted into the JTAG
instruction register while status is
shifted out.
i
0
Shift-IR
Idle
j
1
Exit1-IR
Idle
k
1
Update-IR
Idle
The OnCE module is enabled.
l
0
Run-Test/Idle
Idle
This step can be repeated, enabling
an external command controller to
poll the status.
................................................
l
0
Run-Test/Idle
Idle
Table 10-14 TMS Sequencing for Reading Pipeline Registers
Step
TMS
JTAG Port
OnCE Module
a
0
Run-Test/Idle
Idle
b
1
Select-DR-Scan
Idle
c
0
Capture-DR
Idle
d
0
Shift-DR
Idle
..................................................................
d
0
Shift-DR
Idle
e
1
Exit1-DR
Idle
f
1
Update-DR
Execute “Read PIL”
g
1
Select-DR-Scan
Idle
h
0
Capture-DR
Idle
MOTOROLA
DSP56602 User’s Manual
Note
The eight bits of the OnCE
command “Read PIL”
(10001011) are shifted in.
The PIL value is loaded in
the shifter.
For More Information On This Product,
Go to: www.freescale.com
10-31
Freescale Semiconductor, Inc.
On-Chip Emulation Module
BY FREESCALE SEMICONDUCTOR, INC. 2005
Examples of JTAG andARCHIVED
OnCE interaction
Table 10-14 TMS Sequencing for Reading Pipeline Registers (continued)
Step
TMS
JTAG Port
OnCE Module
Note
i
0
Shift-DR
Idle
The 24 bits of the PIL are
shifted out (24 steps).
ARCHIVED BY FREESCALE SEMICONDUCTOR, INC. 2005
Freescale Semiconductor, Inc...
..................................................................
i
0
Shift-DR
Idle
j
1
Exit1-DR
Idle
k
1
Update-DR
Idle
l
1
Select-DR-Scan
Idle
m
0
Capture-DR
Idle
n
0
Shift-DR
Idle
..................................................................
n
0
Shift-DR
Idle
o
1
Exit1-DR
Idle
p
1
Update-DR
Execute “Read PDB”
q
1
Select-DR-Scan
Idle
r
0
Capture-DR
Idle
s
0
Shift-DR
Idle
..................................................................
s
0
Shift-DR
Idle
t
1
Exit1-DR
Idle
u
1
Update-DR
Idle
v
0
Run-Test/Idle
Idle
................................................
v
0
Run-Test/Idle
Idle
The eight bits of the OnCE
command “Read PDB”
(10001010) are shifted in.
PDB value is loaded in
shifter
The 24 bits of the PDB are
shifted out (24 steps).
This step can be repeated,
enabling an external
command controller to
analyze the information.
During “step v” the external command controller stores the pipeline information and
afterwards it can proceed with the debug activities as requested by the user.
10-32
DSP56602 User’s Manual
For More Information On This Product,
Go to: www.freescale.com
MOTOROLA