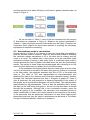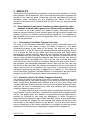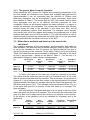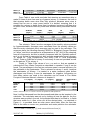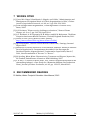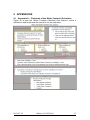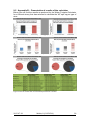
1
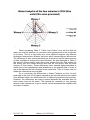
WATER FOOTPRINT OF WINE PRODUCTION IN WINERIES IN CHILE: The Creation of a Water Footprint Calculator Name: Student Number: Date: Assignment period: Maltha, Rutger S1256564 2015-07-29 2015-04-27 – 2015-06-28 PREFACE After four years of studying at the University of Twente the time came for me to do my thesis in order to finish the Bachelor Programme of Civil Engineering. Thanks to the contacts that the University of Twente has with the Water Footprint Network I was able to do the research for my thesis in Chile. So I would like to take this opportunity to thank both the University of Twente as the Water Footprint Network for giving me this opportunity. I would also like to thank both Oterra and the Universidad Mayor for accepting me in Chile and the guidance and help I have received from them. The goal of the final bachelor thesis is being able to perform research in a professional fashion and present comprehensive results in a report. To do this I have had the pleasure to be supervised by Mesfin Mekonnen of the University of Twente and Javier Cano of the Universidad Mayor/Oterra. They have given me feedback on the work that I did and offered me help when I needed it. They have been of great assistance to me and I am grateful for that. Doing my bachelor research abroad has also given me the opportunity to not only get a small taste of what it is like to work for a professional institution, but also to have the sense of what it is like to live and work in a different culture. It has at times been challenging to live and work in a country where they speak a language I had not had any experience with, but overall it has been a great pleasure. I have learned a lot and, both on a professional level and a personal level, and I saw a lot of beautiful and intriguing places in Chile. Javier Cano and the people of Oterra have been very kind to me and helped me a lot during my time in Chile. They have also taken me with them on field trips if possible, which I greatly enjoyed. Finally I would like to thank Agrosustentable for providing me with the data on the four wineries and helping me with figuring out what the data meant and how to use it. For understanding the data Daniel Chico from the Water Footprint Network has also been of help especially when I was figuring out which data was used to calculate the Grey Water Footprint. 2015-07-29 Maltha, R (S1256564) 1 ACRONYMS Acronym WF BWF GWF WFC BOD5 NH3 TP TSS WFN UT WoC 2015-07-29 Meaning Water Footprint Blue Water Footprint Grey Water Footprint Water Footprint Calculator Biological Oxygen Demand in 5 days Ammonia/Kjeldahl nitrogen Total Phosphorous Total Suspended Solids Water Footprint Network University of Twente Wines of Chile Maltha, R (S1256564) 2 ABSTRACT Due to the increasing awareness of finite resources and the expected increase in world population both the media and consumers are increasing pressure to make products more sustainable. This causes companies to analyse their water use along the supply chain and take measures to improve water efficiency where necessary and/or possible. This is also true for wineries in Chile, especially wineries associated under the consortium Wines of Chile. This consortium prides itself with having sustainable products and started a project to research the water efficiency in vineyards and wineries. The research first focuses on gathering data of four different vineyards and wineries before having implemented any changes in protocols and equipment and the goal is to compare the results of this against the results of data gathered after implementing changes in protocols and equipment. This has led to the demand for the development of a calculator to determine the water efficiency for wineries. In this report you will find the findings of a research into developing a Water Footprint Calculator to provide for said demand. The objective of the research therefore was: “The Creation of a Water Footprint Calculator to be used in the main project”. To set up the calculator it was necessary to first make a clear truncation as to what to include and what not. The truncation was made such that the calculator only includes water use and water pollution in the wineries itself. Up next the governing theories and formulas were looked up that are necessary to transform the provided data into results. The Water Footprint Assessment Manual (2011) provided these and since in the truncation it was decided to only consider water use in the wineries. The Green Water Footprint could be left out. In other words, only the Blue and Grey Water Footprint were considered in setting up the calculator. Also, an assumptions was made about wine being the only output product in order to use the chain-summation approach as described in the Water Footprint Assessment Manual. The result of this research is a Water Footprint Calculator that successfully produces results from a given data input. The way data is inserted in the calculator is based on how and what data was provided by one of the consulting companies. The calculator was showed to two of the four wineries of which data was available during the research and their reaction was positive. The data of the four wineries was inserted in the calculator to see what the differences between them are. What was found was that there is a large differences between them. It is however hard to exactly tell how this difference is caused because not all wineries provided equally detailed data. After having set up the calculator and having the calculator produce results, the results were validated and the differences were explained. First, the validation showed some large deviations between the results that were produced by the company that provided the data and the results of the calculator. The differences were related to the Grey Water Footprint and could be explained. The reason for the deviation was the fact that the company that provided the data used different data, but also a slightly different calculation. The company calculated the Grey Water Footprint per month, and summed up the results for each month in a year whilst the calculator instantly calculates the result for a year. The deviations were however small except for one winery. 2015-07-29 Maltha, R (S1256564) 3 It is important to bare in mind that the Water Footprint Calculator was set up and validated with data from four wineries only. Therefore the validation is not completely reliable. What is more is that the data that was provided is not consistent in the sense that one winery had a lot of flowmeters to measure the water (more accurately) whilst the others had comparably few flowmeters. Keeping these shortcomings in mind, it was concluded that a Water Footprint Calculator has been successfully set up and that the calculator has more features than it was possible to validate given the limited amount of data. 2015-07-29 Maltha, R (S1256564) 4 TABLE OF CONTENTS PREFACE .............................................................................................................................................. 1 ACRONYMS .......................................................................................................................................... 2 ABSTRACT ........................................................................................................................................... 3 1 INTRODUCTION ......................................................................................................................... 6 1.1 PROBLEM STATEMENT ......................................................................................................................... 6 1.2 OBJECTIVE OF THE RESEARCH ............................................................................................................ 7 1.3 RESEARCH QUESTIONS ......................................................................................................................... 7 1.3.1 Main question ................................................................................................................................... 7 1.3.2 Sub questions .................................................................................................................................... 7 1.4 SCOPE OF THE WATER FOOTPRINT CALCULATOR .......................................................................... 7 1.5 SET-UP OF THE REPORT ....................................................................................................................... 8 2 METHOD AND DATA ................................................................................................................. 9 2.1 PROCESSES PERFORMED IN THE WINERIES ...................................................................................... 9 2.2 INFORMATION ON THE WINERIES ................................................................................................... 10 2.3 BLUE, GREEN AND GREY WATER FOOTPRINT.............................................................................. 11 2.3.1 Green Water Footprint ...............................................................................................................11 2.3.2 Blue Water Footprint ..................................................................................................................11 2.3.3 Grey Water Footprint .................................................................................................................12 2.4 DATA GATHERING .............................................................................................................................. 12 2.5 ASSUMPTIONS MADE IN CALCULATIONS ........................................................................................ 13 3 RESULTS .....................................................................................................................................14 3.1 HOW SHOULD THE CALCULATOR FUNCTION SO THAT IT GIVES THE RIGHT AMOUNT OF DETAIL AND IS GENERIC FOR CHILEAN WINE COMPANIES? .................................................................................. 14 3.1.1 Functioning of the Water Footprint Calculator .............................................................14 3.1.2 Amount of detail of the Water Footprint Calculator ...................................................14 3.1.3 The generic Water Footprint Calculator ...........................................................................15 3.2 WHAT DATA IS AVAILABLE AND HOW CAN IT BE USED IN THE CALCULATOR? ........................ 15 3.3 HOW CAN THE FUNCTIONALITY OF THE CALCULATOR BE TESTED? .......................................... 17 3.4 DOES THE CALCULATOR PRODUCE VALID RESULTS?.................................................................... 18 3.5 WHAT IS THE DIFFERENCE BETWEEN THE FOUR WINERIES AND HOW CAN THIS BE EXPLAINED?.................................................................................................................................................... 19 4 DISCUSSION OF RESULTS ......................................................................................................22 4.1 PERFORMANCE OF THE WATER FOOTPRINT CALCULATOR ....................................................... 22 4.2 RELIABILITY OF THE WATER FOOTPRINT CALCULATOR ............................................................ 23 5 CONCLUSION .............................................................................................................................24 5.1 RECOMMENDATIONS ......................................................................................................................... 24 6 LIMITATIONS OF THE WATER FOOTPRINT CALCULATOR .......................................25 7 WORKS CITED ...........................................................................................................................26 8 RECOMMENDED READING ...................................................................................................26 9 APPENDICES ..............................................................................................................................27 9.1 APPENDIX A – FLOWCHART OF THE WATER FOOTPRINT CALCULATOR ................................. 27 9.2 APPENDIX B – PRESENTATION OF RESULTS OF THE CALCULATOR ........................................... 28 2015-07-29 Maltha, R (S1256564) 5 1 INTRODUCTION Water resources must meet multiple demands: drinking water, food production, energy, industrial goods and the maintenance of natural ecosystems. Of these categories food production is the largest consumer of water; irrigation represents about 85% of the water consumption in Chile [1]. This is already a large number and since global population is only expected to increase this will result in a 70% larger food demand by 2050 putting further pressure on water resources [2]. Water scarcity is starting to challenge businesses more and more. Water shortage and pollution pose a physical risk to business. Also, the media and public are becoming increasingly aware of unsustainable water use so brands have their reputation to worry about too [3]. This emphasizes the need for companies and businesses that have water-consuming activities in their supply chain to accurately know their water use and undertake activities to minimize business risk whilst ensuring environmental sustainability. The Water Footprint is currently the best tool to describe the stress of a product or service on fresh water availability. It assesses the amount of fresh water that is needed to produce a certain amount of product or service. Through incorporating not only direct water uses, but also indirect water use and waste production. The WF of a product is defined as the total amount of fresh water that is used directly or indirectly to produce the product, split up in the Blue Water Footprint, Green Water Footprint and Grey Water Footprint. The Water Footprint can be expressed in volume of water used per unit produced in the case of the WF of a product [4]. 1.1 Problem statement The consortium Wines of Chile represent about 90% of Chile´s bottled wine export [5] and have started a project to analyse and improve the water use in both stages of wine production, i.e. the agricultural stage and the industrial stage. The project is named: “Project 12CTI-16788-P7 Sustainable Water Use and Management in Vineyards and Wineries” and is carried out by the institute Oterra of the Universidad Mayor with Agrosustentable and the WFN as consulting companies. The project focuses on quantifying and improving water use throughout the entire production line of wine, meaning both the agricultural and the industrial stage of wine production. To quantify the water use and the water efficiency before and after implementing changes in protocol and equipment against each other, data of the water use is needed. This data is gathered from four different vineyards and wineries over two consecutive years of growing grapes and producing wine, one before implementation of water management measures and one after. This has led to the demand for the development of a calculator to determine the water efficiency for wineries. This report describes the findings of setting up a calculator that provides for said demand. The calculator gives a value for the water efficiency of a winery for a given data entry. This value can be used to compare the efficiency with other wineries in an objective fashion, because the Water Footprint is used to express the degree of efficiency. 2015-07-29 Maltha, R (S1256564) 6 1.2 Objective of the research To make it easier to process all the data that is gathered in the main project that was discussed in the problem statement and also to save work in the future it is desirable to have a Water Footprint Calculator that automatically gives a value for the efficiency of water use in the production of wine for a given data input. Therefore the objective of this research is: “The creation of a Water Footprint Calculator to be used in the main project”. 1.3 Research questions Research questions have been formulated before starting the research, they serve as a guide to successfully create the Water Footprint Calculator. The formulated research questions are displayed below. 1.3.1 Main question How should the calculator function so that it gives the right amount of detail and is generic for Chilean wine companies? 1.3.2 Sub questions What data is available and how can it be used in the calculator? How can the calculator its functionality be tested? Does the calculator produce valid results? What is the difference between the four wineries and how can this be explained? 1.4 Scope of the Water Footprint Calculator The WFC is designed for Chilean wine companies, therefore the way that Chilean wineries go from grapes that arrive to the production grounds to bottles of wine leaving the grounds was determinative in how the WFC is set up. Also, since the main project is performed by Oterra with Agrosustentable and the WFN as consulting companies, it is assumed that the way data is provided by them is the standard for how data will be generally acquired. For the calculator to be used in the main project it needs to be easy in use, be able to handle the data in the form that it is generally provided and be user friendly. Moreover, the calculator has to produce valid results for a given data input. Therefore, the data that has already been gathered in the project can be used to see if the calculator produces the same results as the ones that have already been calculated. To ensure the user friendliness of the calculator two choices have been made regarding where to truncate the requested data. The first is a temporal truncation, the calculator requests yearly data. For this there are two reasons, the first reason is that it saves the user time not having to enter data for each month separately and the second is that the data can vary strongly between months. The second truncation is a spatial one, the calculator calculates the WF of the industrial stage rather than both the industrial stage, the agricultural stage and including everything in between. Figure 1 summarises these two truncations. 2015-07-29 Maltha, R (S1256564) 7 Figure 1: Visualization of what is included in the calculator The calculator should not at some point be out-dated, meaning that as long as the governing theories and formulas that are used have not been proven wrong there is no reason why the WFC should at some point no longer function. This does not include the fact that at some point the software with which the calculator was build could no longer be supported or there is a new version. Finally, it is chosen to set up the calculator in Microsoft Excel, this makes it easier to share the calculator whilst it is still in development since a lot of people use Microsoft Office. For creating the calculator Microsoft Excel 2011 is used for no other reason than that it is available. The calculator will be thoroughly tested on Microsoft Excel 2010 and also tested on Microsoft Excel 2007 and 2013. It is assumed that the eventual user(s) at least have Microsoft Excel 2007 installed. 1.5 Set-up of the report First the necessary method and data for setting up the calculator are described in chapter 2. After this the research questions proposed before will be answered in chapter 3. Answering the research questions will also provide an analysis of how the calculator performs. The acquired results will be discussed in chapter 4 after which a conclusion can be found in chapter 5 accompanied by a recommendation. Finally, in chapter 6 the limitations of the calculator will be presented. 2015-07-29 Maltha, R (S1256564) 8 2 METHOD AND DATA This chapter first discusses some general information on the processes and activities performed by companies that produce wine and it gives basic information on the four wineries on which data was made available. Then the methods used to create the WFC are discussed, also theories that are necessary to know before starting are explained. Finally, this chapter also highlights some assumptions the calculator uses to produce answers, these assumptions are relevant to remember when looking at the results. 2.1 Processes performed in the wineries As noted in chapter 1.4, the WFC analyses the Water Footprint of the wineries and leaves the Water Footprint for growing grapes aside. Therefore the WF is calculated for processing grapes into wine only and the indirect WF (for example transport of grapes) is left out. In general, all the activities performed in the wineries can be summarised in three processes. In the first process, harvesting, the grapes enter the production line of the winery and are pressed to extract the juice from the grapes. The second process, wine making, stores the juice in fermentation vats until the juice that is made in the first process can be called wine. Then the wine is stored in barrels to age. In the third process, bottling and labelling, the aged wine is bottled and the bottles are labelled. The activities differ per winery, but in general the activities that take place are displayed in Table 1 and relate to one of the three processes. Process 1 - Harvesting Process 2 – Wine making Grape reception Juice is transported through pipes to fermentation vats Fermenting juice Pressing and crushing grapes Wash containers in which grapes were transported Wash machinery Wash filtres, pipes, floor, vats and containers Quality control laboratory Process 3 – Bottling and Labelling Filtration of wine Bottling of wine Wash the bottling and labelling machine Wash the bottles Table 1: Summary of activities that take place per process As an example, Figure 2 and Figure 3 are photos of flow diagrams taken from one of the wine companies of which data was made available, the flow diagrams indicate the processes in that winery to make white and red wine respectively. 2015-07-29 Maltha, R (S1256564) 9 Figure 2: Processes performed for making white wine in Winery 1 Figure 3: Processes performed for making red wine in Winery 1 2.2 Information on the wineries As mentioned in chapter 1.1, there are four wineries of which data was gathered. The data that is made available from these four wineries has been used in setting up and testing the WFC. These wineries will in this report be called: Winery 1, Winery 2, Winery 3 and Winery 4. The data was collected and provided by the consulting company in the project, Agrosustentable. They indicated that not all wineries put the same amount of flow meters in place. Also, the wineries differ in processes that take place, size of facility and location. A summary of the available information on the four wineries is displayed in Table 2. Winery 1 Winery 2 Winery 3 Winery 4 [6] Number of production plants Maximum production capacity Location Data acquired of # facilities Number of flowmeters 2 7,5 million litres of wine Curico Valley 2 9 2 21 million litres of wine Colchagua Valley 1 2 5 17 million litres of wine 1 24 million litres of wine Maipo Valley Maipo Valley 1 2 1 3 Table 2: Available information on the four wineries 2015-07-29 Maltha, R (S1256564) 10 2.3 Blue, Green and Grey Water Footprint The WF will be calculated as described in the Water Footprint Assesment Manual [4], the Water Footprint Assessment Manual (from the WFN) explains that the Water Footprint of a product can be calculated in two alternative ways: with the chain-summation approach or the stepwise accumulative approach. If it is assumed that wine is the only output product when grapes are processed, than the chain-summation approach can be used. This approach associates the Water Footprint of all the various process steps with the product that results from the system. The calculation of the product Water Footprint then becomes: ∑𝑘𝑠=1 𝑊𝐹𝑝𝑟𝑜𝑐 [𝑠] 𝑣𝑜𝑙𝑢𝑚𝑒 [𝑝] 𝑊𝐹𝑝𝑟𝑜𝑑 = [ ] (1) 𝑃[𝑝] 𝑚𝑎𝑠𝑠 So the WF of the product bottled wine (either in litres wine bottled or in bottles of wine) can be calculated through dividing the sum of the Water Footprints (as shown in equation 2) divided by the amount of end product. 𝑣𝑜𝑙𝑢𝑚𝑒 𝑊𝐹𝑝𝑟𝑜𝑐 = 𝑊𝐹𝑝𝑟𝑜𝑐,𝑏𝑙𝑢𝑒 + 𝑊𝐹𝑝𝑟𝑜𝑐,𝑔𝑟𝑒𝑒𝑛 + 𝑊𝐹𝑝𝑟𝑜𝑐,𝑔𝑟𝑒𝑦 [ ] (2) 𝑚𝑎𝑠𝑠 However, the total WF is not the only thing that is interesting for a winery. After gathering data a winery may find that it has a high WF, but this high WF could possibly be caused by mainly one process. So the wineries also need to be able to get the Water Footprint of each process in order to make a proper assessment on the water efficiency of the company. The Water Footprint of the processes and the WF of the end product can be calculated with the same formulas. 2.3.1 Green Water Footprint As mentioned in chapter 1.4 the WFC focuses on the industrial stage of wine production, i.e.: processing the grapes that have arrived at a winery into wine. As such it does not calculate the Water Footprint of the crops, in this case the grapes. This means that the Green Water Footprint of a bottle of wine will be zero, while in reality this is of course not the case, since the agricultural stage of growing grapes takes up a lot of water. However, since the calculator will be used to assess the water efficiency in wineries and not in growing the grapes, the Green Water Footprint will be left out. 2.3.2 Blue Water Footprint To calculate the BWF data needs to be gathered on the water flows in the wineries. How the data is gathered and how much data is needed is discussed later. This data can then be used to calculate the BWF for the end product or for one of the three processes. For example, a winery might be interested in how much water is used for each kilogram of grapes that the winery processes. The BWF can be calculated with equation 3. 𝑊𝐹𝑝𝑟𝑜𝑐,𝑏𝑙𝑢𝑒 = 𝐵𝑙𝑢𝑒𝑊𝑎𝑡𝑒𝑟𝐸𝑣𝑎𝑝𝑜𝑟𝑎𝑡𝑖𝑜𝑛 + 𝐵𝑙𝑢𝑒𝑊𝑎𝑡𝑒𝑟𝐼𝑛𝑐𝑜𝑟𝑝𝑜𝑟𝑎𝑡𝑖𝑜𝑛 𝑣𝑜𝑙𝑢𝑚𝑒 + 𝐿𝑜𝑠𝑡𝑅𝑒𝑡𝑢𝑟𝑛𝐹𝑙𝑜𝑤 [ ] (3) 𝑡𝑖𝑚𝑒 Equation 3 calculates the BWF in volume over time, in the case of the wineries this might be in litres/year. When the winery wants to know what his BWF for each kg grape that it processes is, equation 3 is transformed in equation 4. 2015-07-29 Maltha, R (S1256564) 11 𝑊𝐹𝑝𝑟𝑜𝑐,𝑏𝑙𝑢𝑒 𝑣𝑜𝑙𝑢𝑚𝑒 [ ] (4) 𝑃[𝑝] 𝑚𝑎𝑠𝑠 Equation 4 can be used for the example explained above, but also for the total Blue Water Footprint. In that case, the calculator uses the total water flows and total production instead of the water flows and production related to one process. 𝑊𝐹𝑝𝑟𝑜𝑑,𝑏𝑙𝑢𝑒 = 2.3.3 Grey Water Footprint To calculate the GWF, the winery needs to know how much pollutants are inside the water that it returns to the catchment. Just as with the BWF, the GWF can also differentiate between processes or end product. If a winery wants to know what the GWF of each process is, then it needs to measure the amount of pollutant in the water at the end of each process. The Grey Water Footprint is calculated with equation 5. 𝐿 𝑣𝑜𝑙𝑢𝑚𝑒 𝑊𝐹𝑝𝑟𝑜𝑐,𝑔𝑟𝑒𝑦 = [ ] (5) 𝑐𝑚𝑎𝑥 − 𝑐𝑛𝑎𝑡 𝑡𝑖𝑚𝑒 𝐿 = 𝐸𝑓𝑓𝑙 × 𝑐𝑒𝑓𝑓𝑙 − 𝐴𝑏𝑠𝑡𝑟 × 𝑐𝑎𝑐𝑡 [𝑚𝑎𝑠𝑠] (6) In equation 5, “Effl” and “Abstr” stand for the amount of discharge – or Effluent –, and intake – or Abstraction – respectively and are given in volume over time. The “ceffl” and “cact” are the concentration in the Effluent and Abstraction water respectively, given in mass/volume. Finally the “cmax” and “cnat” stand for the maximum allowed concentration and the natural concentration in the water catchment where the effluent water is returned, given also in mass/volume. cmax is the maximum allowable concentration in the water and the values the calculator uses for this are from a Chilean law [7]. cnat is often more difficult to find, the calculator uses values that have been provided by Agrosustentable [6]. The difference between cmax and cnat indicates the amount of pollutant that can be assimilated by one unit of volume water. So equation 5 results in the volume of water that is needed to assimilate the amount of pollutants “L” that the winery produces. The values for cmax, cnat and cact can be found in Table 6. Again, to calculate the GWF for the end product or to see how much the GWF is for one process, equation 5 is transformed in equation 7. 𝑊𝐹𝑝𝑟𝑜𝑐,𝑔𝑟𝑒𝑦 𝑣𝑜𝑙𝑢𝑚𝑒 𝑊𝐹𝑝𝑟𝑜𝑑,𝑔𝑟𝑒𝑦 = [ ] (7) 𝑃[𝑝] 𝑚𝑎𝑠𝑠 The calculator uses equation 6 to calculate the Grey Water Footprint for either one process and for the total end product. However, almost always there is more than one pollutant present in wastewater. In these cases the GWF is determined by the pollutant that is most critical, “that is the one that is associated with the largest pollutant specific Grey Water Footprint” [4]. 2.4 Data gathering The calculator needs input to produce the results needed for making an assessment on the water efficiency of a winery. If for example the winery wants a less detailed (rough) analysis, data can be gathered for only the total water that goes in and out, to calculate the Total WF. However, if a winery wants to make a good assessment about its water efficiency it will need to gather data on the water that goes in and out of the winery, but also the water that goes in and out each of the processes. If a winery wants the most 2015-07-29 Maltha, R (S1256564) 12 accurate results on its water efficiency it will need to gather extensive data, as shown in Figure 4. Figure 4: Overview of gathering data for extensive results As can be seen in Table 2, none of the four wineries have the amount of flowmeters as proposed in Figure 4. Because the project mentioned in chapter 1.1 has only begun recently it should be seen as a pilot. Therefore the consortium WoC might in the future help wineries in acquiring the necessary equipment for extensive measuring. 2.5 Assumptions made in calculations As was shown in Figure 4 it is desired to have as much data as possible to produce accurate results. However, when not all the desired data is available the calculator makes estimations to fill in the data that is missing and still come to a result. The reason why it was chosen to let the calculator make estimations instead of having it stop when there is insufficient data is that it should stimulate the user to gather more data when he sees the (preliminary) results. The results in those cases are accompanied with a warning to let the user know the results are not reliable due to insufficient data. A few examples of the assumptions that are made; when a winery does not have a flowmeter to measure the water that goes out (either for a process or the total water), the calculator assumes that this is 70% of the water that goes in. The value of 70% was approximated by Agrosustentable who gathered the data on the wineries and is therefore assumed correct. Another example: the calculator assumes that from 1 kilogram of grapes 0,7 litres of juice is produced, the real production is however depended of the quality of the grapes, but it should still be between 0,6 and 0,8 litres. This has also been approximated by Agrosustentable. There is also the possibility that a winery has data on the total water that goes in, but not on how that water is divided through the processes. Although this is not a desirable situation, since the results are going to be unreliable, the calculator uses standard factors to make a distribution of water in the winery based on the intensity of the activity of the processes that are performed. Information on how these factors were determined and how they are used in calculations can be found in The Water Footprint Calculator Manual, reference in chapter 8. 2015-07-29 Maltha, R (S1256564) 13 3 RESULTS The results will be presented as answers to the research questions. First the main question will be answered, this is the most important part and shows the results of the research done. Continuing, the sub questions will each be answered, when answering the sub questions the results of the Water Footprint Calculator will be reviewed and the WF of the four wineries will be presented. 3.1 How should the calculator function so that it gives the right amount of detail and is generic for Chilean wine companies? To be used in the main project, the Water Footprint Calculator needs to produce answers that are correct, but also gives the right amount of detail and should be generic for Chilean wine producing companies. The validation of the calculator will be done at the sub questions. First, the functioning of the WFC will be presented. 3.1.1 Functioning of the Water Footprint Calculator The user of the calculator starts with filling in basic information about the winery that he or she wants to know the Water Footprint of. This basic information consists of: the name of the winery, the year the user want to know the WF of, if the WF should be calculated for the total production of wine or if it should be split up per white wine and red wine and finally which processes the winery performs. Next the user indicates the data that he/she has available and fill in this data. After this, the calculator summarizes all the values it has got, both through the data that was filled in by the user and the missing data that it calculated itself. This is for the user to review and make sure that he/she did not make any mistakes filling in the data and to check if the calculator has calculated reasonable values. After this the user can view the results of the calculator, the results are presented (for one year) both as values and in the form of graphs in the next sheet. A flowchart of how the calculator functions can be found in Appendix A in chapter 9.1. This flowchart is from the Water Footprint Calculator Manual, it is advised for any user that is going to use the WFC to read the manual referenced to in chapter 8. 3.1.2 Amount of detail of the Water Footprint Calculator The amount of detail in the results of the WFC should be sufficient to be used as an assessment on the water efficiency of the winery and also to be able to make comparisons between both different years of the same winery and compare between different wineries, but the amount of detail should not be so vast that the user is overwhelmed by data and numbers and is therefore unable to make any sense of it all. To make sure that both a layman and a professional are able to get useful results from the calculator, it presents the results both in graphs and in values. The graphs show the results in a comprehensive way that makes it possible for anybody to see what the differences in Water Footprint in processes are and what the ratio of BWF and GWF are for a given production. If after reviewing the graphs the user decides that he/she would like a little more detail in the results he/she can go back to the first sheet and take a more in depth look at the values presented. An example of what the results look like for a fictional winery is displayed in Appendix B in chapter 9.2. 2015-07-29 Maltha, R (S1256564) 14 3.1.3 The generic Water Footprint Calculator What makes the WFC generic for Chilean wine producing companies is the fact that based on information from Oterra and available data gathered by Agrosustentable it can be concluded that the activities of Chilean wine producing companies can be summarized in three processes, these have been showed in Table 1. This means that the WFC only needs input on these three processes and not on all different activities performed by wine companies. Since not all wineries perform the same activities, it is easier to bundle the activities into processes. This means that wineries with different activities insert the data in the calculator in the same way. Also, not all wineries necessarily perform three processes. For example, some wineries only extract juice out of the grapes and transport the produced juice to other wineries that make wine out of it and bottle it. The calculator allows a user to indicate which processes are performed and which are not, so the processes that are performed do not influence the use of the WFC. 3.2 What data is available and how can it be used in the calculator? The consulting company of the main project, Agrosustentable, has made the data available. The data that they produced has been used to figure out how to set up the calculator so that it is generic for Chilean wineries, but also to test the functioning of the calculator. In the tables Table 3 up to and including Table 5 the data that was made available is displayed. The data is the same as how it got provided – except for the data in Table 5 –, but the way it is tabulated is changed to make it better understandable. Win Process Wout Win Process Win Total Win in [6] 1 (m3) Winery 1 Winery 2 Winery 3 Winery 4 7.281,6 8.716,8 21.015,8 12.244,0 Process 1 (m3) 5.097,1 6.101,8 14.711,1 8.570,8 2 (ltrs.) 9.564.810 7.984.369 22.561.985 7.090.000 Process 3 (ltrs.) 11.903.110 7.296.802 8.244.007 12.947.000 year (ltrs.) 34.787.420 48.306.000 60.385.000 36.415.000 Table 3: Provided data on water use of the four wineries In Table 3 the data on the water use of the four wineries is provided. The reason that the water that goes out (W out) of Process 2 and 3 is not in the table is because that data was not provided. This is because, as mentioned in chapter 2.2, not all wineries had flow meters in the desired places. So instead Agrosustentable calculated an average value for the Water that goes out from the Water that goes in (W in). This average value was determined as 70%, so of the water that goes into a process, or the total water in, on average 70% goes out again. Also note that the Total water that goes in is not equal to the sum of the water that goes into the three Processes. This is because the total water that goes in is also used in other parts of the wineries, for example: in the canteen, in the offices, in the gardens (not to be mistaken by vineyards) and in the bathrooms. Grapes Wine Wine Total wine Wine bottled [6] Winery 1 Winery 2 2015-07-29 processed (kg) 8.084.833 6.664.488 produced (ltrs.) 5.659.383 4.665.142 available (ltrs.) 5.400.797 16.045.744 Maltha, R (S1256564) in year (ltrs.) 11.060.180 20.714.886 (ltrs.) 4.688.631 12.202.011 15 Winery 3 Winery 4 3.240.152 10.039.950 2.268.106 7.027.965 64.100.000 8.253.991 66.368.106 15.281.956 60.175.230 7.604.125 Table 4: Provided data on the production of the four wineries From Table 4 one could conclude that wineries are somehow able to make 22 litres of wine from one kg of grapes (winery 3). However, the truth is that wineries bottle more wine than they produce, because some wine is stored first for one or more years before it is bottled, meaning that it is possible for a winery to bottle more than it produces, because it still has wine on stock. Also, wineries often buy wine form another winery and bottle that as well. Oil&Fats (mg/ltr.) 8,58 6,74 No data! No data! Winery 1 Winery 2 Winery 3 Winery 4 BOD5 (mg/ltr.) 756,98 68,75 6,77 228,40 NH3 (mg/ltr.) 0,73 9,22 4,91 3,10 TP (mg/ltr.) 0,72 3,63 2,20 No Data! TSS (mg/ltr.) 105,75 37,40 14,96 41,30 Table 5: Average of provided data on pollutant loads (mg/litre) in the water leaving the winery The values in Table 5 are the averages of the monthly values provided by Agrosustentable. Averages were calculated from the monthly values so that the newly calculated yearly averages can be used in the calculator. The acronyms have the following meaning: BOD5 is “Biological Oxygen Demand in 5 days” and this is measured at a temperature of 20°, NH3 is the chemical formula of ammonia, but this is actually measured with the “Kjeldahl method” so it is not limited to ammonia but also includes organically bound nitrogen, TP stands for “Total Phosphorous” and finally TSS is “Total Suspended Solids”. Data on Oil&Fats for winery 3 and winery 4 were not provided as well as the data on TP for winery 4. Finally, in Table 6 the values of cmax, cnat and cact that are needed to calculate the Grey Water Footprint as described in equation 5 and 6 can be found. The percentages in the last two columns mean a removal efficiency for the pollutants in the wastewater. This is relevant for winery 1 and 4, because the wastewater of Winery 1 is treated in a water treatment plant before discharged and Winery 4 uses its wastewater for irrigation. Information on how these values are used in the calculator can be found in The Water Footprint Calculator Manual, reference in chapter 8. 1 cmax (mg/ltr.) Oil&Fats BOD5 NH3 TP TSS 20,0 35,0 50,0 10,0 80,0 cnat (mg/ltr.) 0,001 0,000 0,001 0,001 0,000 cact (mg/ltr.) 0,001 0,000 0,001 0,001 0,000 Removal W.1 (%) 0,000 90,00 60,00 35,00 90,00 Removal W.4 (%) 0,000 95,00 90,00 97,00 99,99 Table 6: Values for cmax, cnat and cact for use in equation 5 and equation 6 Now it will be discussed how the abovementioned data can be inserted in the calculator. The calculator was set up by looking at how the data for the four wineries was provided. As such, the provided data has to be filled in, in fields that were made for it. Also, since not all the desired data – as depicted in Figure 4 – is provided there are also some extra fields. After the user has filled in the data on water use, production and water pollution the calculator 1 cmax, cnat and cact from [6]/ [7], both removal factors from [6] 2015-07-29 Maltha, R (S1256564) 16 does everything else automatically. The available data is displayed in tables: Table 3, Table 4 and Table 5. As an example the data is filled in for Winery 1, displayed in figures Figure 5 and Figure 6. Figure 5: First part of filling in data Note that one can see that “Total” is filled in for data on wine production. In Appendix B in chapter 9.2 an example is given for a fictional winery that wants to calculate the Water Footprint for White and Red wine separately. Figure 6: Second part of filling in data 3.3 How can the functionality of the calculator be tested? To answer this question it is necessary to judge if the calculator is easy to use and if it is understandable for its users. As the creator of the calculator it is difficult to judge this myself, still the features that make the calculator user friendly and understandable will be described first. Though there are a lot of limitations when using Microsoft Excel concerning guiding a user through filling in data in such a way that the Excel file can handle it, the WFC does so by using a combination of normal formatting and conditional formatting. A colour scheme is used to help the user find the fields that he needs to fill in, the colour scheme is explained in the top left of the second sheet. The conditional formatting makes fields visible/invisible, this helps the user to find out what needs to be filled in. Finally, protection of the excel file is enable, to ensure a user cannot accidentally delete a cell formula. More on the normal and conditional formatting can be found in the reference in chapter 8. The calculator has been reviewed by two supervisors, someone from Agrosustentable and by two different wineries. The first winery that reviewed the calculator reviewed it when it was not yet completely ready. They were enthusiastic, but at that time the calculations for the GWF did not yet function properly. The second winery was positive about the calculator, since at was almost completely finished at that time. They asked for a Spanish version of 2015-07-29 Maltha, R (S1256564) 17 the calculator. From Agrosustentable I received a compliment about how it worked. All the parties that have been involved in setting up the calculator have been positive about it. 3.4 Does the calculator produce valid results? To check this the data provided by as well as the WF results produced by Agrosustentable are used. Thanks to Agrosustentable having calculated the WF with their own data the results can now be used to validate the calculator. Agrosustentable has used the same calculations as discussed in chapter 2.3 and therefore the results that the WFC produces should be the same as their results. As an example to see what the results look like, the data for Winery 1 has been entered in the calculator as displayed in the figures Figure 5 and Figure 6, this produced the graphs as displayed in the figures Figure 7, Figure 8 and Figure 9. Figure 7: Results for Winery 1, Process 1 Figure 8: Results for all processes Winery 1 Note that in Figure 7 and Figure 8 there is no Grey Water Footprint. This is because all the wineries of which data was available only measured the water contents of the total water that goes out of the winery and these two figures are about respectively process one only or all the three processes. Figure 9: Contribution of Blue and Grey Water Footprint to Total Water Footprint for Winery 1 The results produced by the WFC now need to be compared with the results of Agrosustentable to see if the calculator produces valid results. The comparisons is done in the tables Table 7, Table 8 and Table 9. Values in litres water per (…) BWF Process 1 (/kg grapes) BWF Process 1 (/ltr. juice) BWF Process 2 (/ltr. wine) 2015-07-29 Winery 1 0,270 0,386 0,259 Results by Agrosustentable Winery 2 Winery 3 Winery 4 0,392 1,946 0,366 0,561 2,780 0,523 0,116 0,102 0,139 Maltha, R (S1256564) 18 BWF Process 3 (/ltr. wine) BWF Total (/ltr. wine prcsd.) GWF Total (/ltr. wine prcsd.) Total WF (/ltr. wine prcsd.) 0,762 0,944 4,620 5,564 0,179 0,700 1,820 2,520 0,041 0,273 0,160 0,433 0,511 0,715 0,490 1,205 Table 7: Water Footprint results as produced by Agrosustentable Values in litres water per (…) Results by Water Footprint Calculator Winery 1 Winery 2 Winery 3 Winery 4 0,270 0,392 1,946 0,366 0,386 0,561 2,780 0,523 0,259 0,116 0,102 0,139 0,762 0,179 0,041 0,511 0,944 0,700 0,273 0,715 4,762 3,206 0,140 0,544 5,705 3,906 0,413 1,259 BWF Process 1 (/kg grapes) BWF Process 1 (/ltr. juice) BWF Process 2 (/ltr. wine) BWF Process 3 (/ltr. wine) BWF Total (/ltr. wine prcsd.) GWF Total (/ltr. wine prcsd.) Total WF (/ltr. wine prcsd.) Table 8: Water Footprint results as produced by Water Footprint Calculator Deviations are percentage from the values of Agrosustentable BWF Process 1 (%) BWF Process 1 (%) BWF Process 2 (%) BWF Process 3 (%) BWF Total (%) GWF Total (%) Total WF (%) Winery 1 0,0 0,0 0,0 0,0 0,0 3,1 2,5 Deviation in results Winery 2 Winery 3 0,0 0,0 0,0 0,0 0,0 0,0 0,0 0,0 0,0 0,0 76,2 -12,5 55,0 -4,6 Winery 4 0,0 0,0 0,0 0,0 0,0 11,0 4,5 Table 9: Deviation in Water Footprint results From these tables it can be seen that the calculator produces valid results for the Blue Water Footprint. The Grey Water Footprint however shows deviations, albeit small ones except for Winery 3. How these differences are caused and what it means for the reliability of the calculator will be discussed in chapter 4.2. Two more small notes on the results; the deviations in the total Water Footprint is always smaller than the difference in the Grey Water Footprint, this is because the difference in the Blue Water Footprint is always 0, this compensates for the difference in the Grey Water Footprint. From the results one can see that the sum of the WF of the three processes is not equal to the total WF. This is because there is more water use involved in the winery than just the three processes. So while it is interesting for a winery to see which processes have the highest impact on freshwater availability, the Total Water Footprint indicates the real impact. The reason why the Total Water Footprint is given /litre of wine produced and not /litre of wine bottled or /bottle of wine is because wineries tend to sell wine without bottling it. So by using the amount of wine processed it is a complete representation of the activities of a winery. 3.5 What is the difference between the four wineries and how can this be explained? The differences in Water Footprint were acquired through entering the data in the Water Footprint Calculator for each of the wineries separately. Not only provided this the results, but it is also a good way to see how a user would use the calculator. The results are generated from data of the year 2014 and the data has not been modified, except for the data on the pollutants. The modification for this and its effects will be discussed in chapter 4.2. The 2015-07-29 Maltha, R (S1256564) 19 generated results were stored in a separate excel file to make comparisons. The differences can be seen in Figure 10 and Figure 11. Figure 10 shows the amount of total WF per winery and also shows the contribution of BWF and GWF to the total WF of a winery. Though the differences in WF can also be seen in Figure 10 it becomes really clear in Figure 11. Figure 11 shows that the WF of winery 3 and 4 are small compared to winery 1 and 2. Note that the Water Footprint in both figures is expressed as litre water over litre wine processed, so the Water Footprints of all four wineries are for one litre of wine processed in the year 2014. Figure 10: Difference in Water Footprint per winery Figure 11 shows the same data as Figure 10 does, but it visualises better how large the difference between the wineries is. 2015-07-29 Maltha, R (S1256564) 20 Figure 11: Differences in Water Footprint between wineries When comparing Table 3, Table 4 and Table 5 one will find that the water use and the pollution do not seem to be proportional to the production of a winery. This is in fact partly true, since different wineries use different techniques and perform different activities, which cause different efficiencies. The difference is also caused because not all wineries had the same amount of data available to analyse the water efficiency. As was displayed in Table 2, the amount of flow meters each winery has ranges from two flow meters for the winery with the lowest amount and nine for the winery with the most amount of flow meters. These differences have caused Agrosustentable to make quite a few assumptions and alterations to the original data in order to get all the data on the four wineries to the same level. This, of course, has not made the calculations more reliable. So in conclusion the differences in Water Footprint per litre of wine produced in the year 2014 is partly caused by the fact that wineries do indeed have different water use efficiencies due to different processes and activities. However, the differences are mainly caused because the available data for each winery was not the same. This caused the necessity to use average factors in the calculations to get to results, which decreases the reliability and accuracy of results. 2015-07-29 Maltha, R (S1256564) 21 4 DISCUSSION OF RESULTS This chapter will discuss the results of the research. This does not mean that all the answers of the research questions will be discussed, but the chapter focuses on discussing the performance and reliability of the calculator. This allows for a critical view on the performance and reliability of the Water Footprint Calculator. 4.1 Performance of the Water Footprint Calculator As explained in chapter 3.1.1 the WFC does what it was proposed to be able to do in chapter 1.4. Calculating the Water Footprint yearly instead of monthly is a sensible decision, because the monthly Water Footprints are high in the harvest months and comparably low in the other months. Also, it is less work to fill in the total water consumed or average pollutant concentration for a year than it is to fill in data for every month for each process. So it is a good thing that the calculator requests the data in this way. The way the calculator is set up makes it that a user could fill in the data and then view the results presented in the various graphs. This gives a basic idea of the composition of the Total Water Footprint and how the different processes compare to each other for a given data input. This can be useful, but to get a little more detail out of it a user can look at the table and view all the different values. In here the user will also find the Water Footprint per bottle of wine, which might be useful for marketing reasons. What makes the calculator generic is that the approach it uses to get from data to results. Instead of requesting data that is specific, treats activities separately and for example monthly differences, it requests data that covers the totals for processes and totals in a year. If a winery does not perform the three processes indicated in chapter 2.1 then the calculator ignores these processes. Also, the processes have been defined as general as possible, so that they are not limited to special wineries. This means that the calculator should not only be able to handle data from Chilean wineries, but from wineries all over the world. This, however, has not been tested so is unconfirmed, of course certain values that do not change for Chilean wineries have to be adapted to the situation the new wineries are in. Although it might require some experimentation for anyone first using the calculator, it is still easy to understand. Thanks to the conditional formatting used and colours present the calculator guides the user towards what needs to be filled in and what does not. Also, the cells are protected, so it is not possible for a user to accidentally delete formulas after which the calculator would be useless. Finally, the features of the WFC are more elaborate than discussed in this report. Most of these features are there to improve flexibility, for example; the calculator can handle situations in which less data is available than discussed in this report. Although the results it produces in these cases are less accurate, it is useful to interest a winery into gathering more data to accurately calculate its WF. The results the calculator produces in these cases are accompanied by a warning to emphasize that the results should only serve as an indication and not as a definitive result. For more information on this see chapter 8 for recommended reading. 2015-07-29 Maltha, R (S1256564) 22 4.2 Reliability of the Water Footprint Calculator From Table 9 it can be seen that the values that Agrosustentable has calculated for the Blue Water Footprint are the same as what the Water Footprint Calculator produces. The values for the Grey Water Footprint are however different, this difference is caused by two reasons. The first reason is that Agrosustentable calculates the Grey Water Footprint in volume over time for each month. Then they select the largest GWF for each month and sum the maximum values to get to a GWF in volume/time for a year. This is then consequently divided by the amount of wine processed in a year to get the GWF in volume/litre of wine processed. The calculator however requests the user to fill in the average concentration in one year of the pollutant that causes the highest Grey Water Footprint. The calculation of Agrosustentable allows different pollutants to be taken into account for different months whilst the calculator allows only one for one year. The second reason is that the calculator uses the data on water use (Table 3) for filling in the amount of effluent and abstraction water. Agrosustentable on the other hand does use these same values for calculating the BWF, but uses different values for calculating the GWF. Their calculation is specific for each winery, since trying to make the same calculations in the WFC would make it less generic and also less user friendly, it was chosen to accept these deviations. The deviation is only 3,1% for Winery 1 and -12,5% and 11,0% for Winery 3 and 4 respectively, which is still reasonable. The reason that Winery 2 differs so much from the calculated value is almost solely because of the second reason, mentioned above. The monthly values Agrosustentable uses on the amount of abstraction sum up to a total of 23.998.000 litre. The WFC uses a total amount of abstraction of 48.306.750 litre (Table 3). When this same amount of abstraction of 23.998.000 litre is entered into the calculator the deviation is only -12,8%. The rest of the difference is caused by the first reason, mentioned above. In Table 10 the deviation in Grey Water Footprint is displayed for when the same amount of abstraction that Agrosustentable uses is entered in the WFC. Winery 1 Deviation in GWF (%) Winery 2 -14,85 Winery 3 -12,80 Winery 4 -24,99 -1,54 Table 10: Deviation in GWF with the values from Agrosustentable as base numbers Now the differences are all caused to the fact that Agrosustentable calculates the GWF monthly and it shows that this is more accurate than the way the WFC calculates it. Interestingly enough the deviations are now all negative, indicating a lower GWF than Agrosustentable and now the deviations in Winery 1 and 2 is acceptable, Winery 4 is really good and Winery 3 is high. The reason why the difference for Winery 3 is so high is that Winery 3 has three pollutants that have a lot of influence on the GWF where the other wineries have one pollutant that makes up for at least half of the GWF. Finally, the reason that the deviation of Winery 1 is now so large is because the concentration of its main pollutant varies a lot throughout the months. 2015-07-29 Maltha, R (S1256564) 23 5 CONCLUSION It is important to bare in mind that the Water Footprint Calculator has been validated for four wineries only and that there are extra functions that the calculator has that have been tested, but not been validated. This is because the available data did not allow validating every aspect of the calculator. However, for the given data it can be concluded that the calculator produces valid answers. Even the Grey Water Footprint, that has caused all the deviations in this research is limited to deviations of around 10%, which is reasonable and the differences can and have been explained. An extensive research to the user friendliness has not been done, but the people involved in this research while setting up the calculator have been positive about how it has ended up and commented that they liked it. One of the companies asked for a Spanish version of the calculator which can be considered a compliment. Just like any computer program it might take some time for someone to figure out how it works, but anybody should be able to understand it. Thus, for now, it can be concluded that the calculator is understandable, easy to use and user friendly. 5.1 Recommendations The calculator has been made in excel, because I do not have the knowledge to make a webpage with the same functionality – or more – as the calculator has as it is. However, it has advantages to have the calculator in the form of a webpage. First, the performance would not depend on the spreadsheet software the user has on its computer. Second, when setting it up as a webpage, it is possible to guide the user more in what needs to be filled in and as such the calculator could be made more user friendly. Finally, at the moment the biggest disadvantage of the calculator is that data has to be filled in separately for each year and/or each winery and afterwards, the results have to be copied to a separate file if the user wants to compare values between years/wineries. I have had to do this multiple times when doing the validation, so I know that it is not that much work to do. Still when implementing the calculator as a webpage, this can be made easier. As said in chapter 1.1, in the existing project of WoC the data is gathered for four wineries. It would however be really good, if at one point more wineries get involved and their data can be used to validate the calculator again. Because a validation based on a data set of four wineries is not a completely reliable validation and also the data set itself for these four wineries were not completely reliable, as discussed in Error! Reference source not found.. 2015-07-29 Maltha, R (S1256564) 24 6 LIMITATIONS OF THE WATER FOOTPRINT CALCULATOR The first and maybe most import limitation to the calculator is where on the production line of producing wine a truncation was made. The calculator very explicitly only calculates the Water Footprint for the industrial stage of producing wine, leaving out the WF of growing grapes and transporting them to the winery. Also, when a winery buys a lot of wine from another winery, the WF of the wine that was bought is not visible in the Water Footprint of the winery that. While the wine that is bought does influence the Water Footprint of the wine that is bottled and labelled – and therefore slightly influences the Total Water Footprint – the Water Footprint of producing said wine is left out. Secondly, when the user puts in data and the data shows that the sum of the water that goes in to each of the processes is more than the total water that enters the winery, the WFC does not produce an error. While this is a shortcoming of the calculator, it was a deliberate choice not to incorporate this. Since it would make the formulas used more complicated, but also because the WFC is currently quite flexible and user friendly. Taking away user responsibility to make sure correct data is entered might make the calculator more reliable, but at the cost of making it less user friendly. When calculating the Grey Water Footprint the concentration of pollutant in the effluent water is asked. However, some wineries process wastewater themselves or the wastewater goes to a water treatment plant before it is discharged in the natural system. To compensate for this removal factors have been applied in the calculator, which are based on either the research of Agrosustentable for Winery 4 or from a report of Marcos von Sperling [8] for Winery 1. When these factors are used, one should always be careful that they are not estimated to high in order to make it seem the Grey Water Footprint is low. One last note on the calculator is that the performance and the user experience as described in this document largely rely on the version of excel that the user tries it on. The calculator was made and tested in Microsoft Excel 2011 for mac and it was then tested on multiple versions of Microsoft Excel. The compatibility report of Excel indicates that the WFC might have problems running on versions of Excel older than 2007, but should work fine on 2007 and newer. When testing the calculator on Microsoft Excel 2007 and 2010, the calculator works, but there is a problem with the conditional formatting rules. However, a solution to this problem is in the Water Footprint Calculator user manual. 2015-07-29 Maltha, R (S1256564) 25 7 WORKS CITED [1] J. Jara, M.A. López, Á San Martin, L Salgado, and L Melo, "Administration and Management of Irrigation Water in 24 User Organizations in Chile," Chilean journal of agricultural research, vol. 69, no. 2, pp. 224-234, 2009. [2] Food and Agriculture Organization, "Global Agriculture Towards 2050," Rome, 2009. [3] A.Y. Hoekstra, "Water scarcity challenges to business," Nature Climate Change, vol. 4, no. 5, pp. 318-320, April 2014. [4] A. Y. Hoekstra, A. K. Chapagain, M. M. Aldaya, and M. M. Mekonnen, The Water Footprint Assessment Manual. Padstow, Cornwall, England: Earthscan, 2011. [5] Wines of Chile. (2013) Wines of Chile. [Online]. http://www.winesofchile.org/about-wines-of-chile/ [6] Agrosustentable, "Informe Calculo Huella H Abril Final," Santiago, Internal Report 2015. [7] Ministerio Secretaria General De La Presidencia, Establece Norma De Emision Para La Regulacion De Contaminantes Asociados A Las Descargas De Residuas Liquidos A Aguas Marina Y Continentales Superficiales, March 7, 2001, Literal translation of "Decreto" is "Decree".. [8] M. Sperling, Waste Water Characteristics, Treatment and Disposal, Aptara Inc., Ed. London, United States of America: IWA Publishing, 2007. [9] S. A. Ene, C. Teodosiu, B. Robu, and I. Volf, "Water Footprint Assessment in the winemaking industry: a Case Study for a Romanian Medium Size Production Plant," Journal of Cleaner Production, vol. 43, pp. 122-135, March 2013. 8 RECOMMENDED READING R. Maltha, Water Footprint Calculator User Manual, 2015 2015-07-29 Maltha, R (S1256564) 26 9 APPENDICES 9.1 Appendix A – Flowchart of the Water Footprint Calculator Figure 12 is from the “Water Footprint Calculator User Manual”, which is advised to read for anyone who wants to use the calculator. Figure 12: Detailed overview of how the calculator operates 2015-07-29 Maltha, R (S1256564) 27 9.2 Appendix B – Presentation of results of the calculator Below you will find the results as produced by the Water Footprint Calculator for a fictional winery that has selected to calculate the WF split up per type of wine. Figure 13: Water Footprint results of processing grapes into juice Figure 14: Water Footprint results of the three processes Figure 15: Water Footprint result of the ratio of Blue and Grey Water Footprint Figure 16: All the results that are calculated presented in one table 2015-07-29 Maltha, R (S1256564) 28