1
ROOT: A Data Analysis and Data Mining Tool from CERN
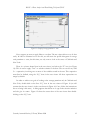
Figure 21: The structure of the neural network obtained by training it on the simulated data set. The
thickness of lines is proportional to the weight for the corresponding connection.
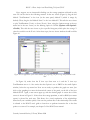
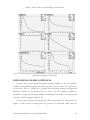
Figure 22 shows a profile of the residuals for different values of the output (LossRatio)
for the independent test data set.
The optimized neural network can be automatically exported to a C++ class, to be used
elsewhere, e.g., for implementation.
Figure 22: Residual profile for various values of the neural network (NN) output (LossRatio) on the test
data set. The Y-axis is the mean value of the NN output minus the true LossRatio, for a given value of the
true LossRatio. The true loss ratio has been normalized, so that it takes on values between 0 and 1.
Casualty Actuarial Society E-Forum, Winter 2008
23