1
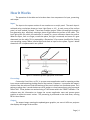
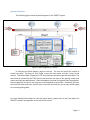
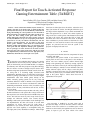
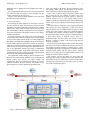
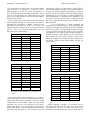
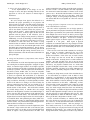
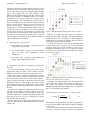
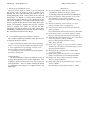
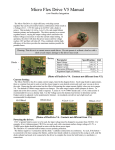
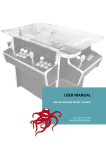
Table of Contents
About TARGET
3
The Team
3
About This Manual
3
How It Works
4
Input
Processing
Output
System Operation
Setting Up The Table
6
Using TARGET
6
Calibrating CCV
7
Using CCV
7
Aligning the Lasers
7
Other Maintenance
9
Projector
Mirror
Camera
Surface
Lasers
Intel Atom
Appendix
11
Page | 2
About TARGET
In the world of entertainment, anyone who has ever wanted a pool table, an air hockey
table, or similar product has probably been deterred by the cost and difficulty associated with
buying and installing one. These products can cost thousands of dollars and having several
different game tables can take up a lot of space. For those wanting several game tables, there
are existing multi-game systems that save space, but they can be just as costly and difficult to
set up. TARGET, or Touch-Activated Response Gaming Entertainment Table, is an interactive
touch surface table designed for multiple game applications. It is an alternative system that is
not only cost effective and hassle-free, but also provides a fun and innovative way for gamers
to play their favorite games using a unique touch interface. TARGET was created as a Senior
Design Project in 2011 by Team Siqueira.
The Team
Team Siqueira:
o P
o M
o C
D ‘
P
G
E
C
C
E
“
“
E
E
Team Advisor: Paul Siqueira, Associate Professor
About This Manual
As TARGET is meant to serve as an entertainment system, it is important to inform its
users of the important aspects of the system. This manual aims at demonstrating how to set
up, use, and maintain the TARGET system. It will include specific instructions on how to
operate the table normally, fix any problems, and lists warnings and problems to avoid. In this
way, TARGET is sure to provide endless hours of fun to those who use it.
Page | 3
How It Works
The operation of the table can be broken down into components for input, processing,
and output.
Input:
The input to the system consists of user touches on an acrylic panel. The touch input is
achieved using a technique known as Laser Light Plane, or LLP. In each corner of the surface
panel, an laser module is placed. These laser modules project 780nm infrared light through a
line-generating lens, effectively creating a plane of light above the surface of the table. This
laser light plane (for which the technique is named) is a mere millimeter above the surface.
When an object, such as a finger, crosses the plane, the light is scattered, and some of it goes
downward into the table. This is captured by a Playstation 3 Eye camera (modified for filtering
out everything except 780nm infrared light) and used as input to the system. Figure 1 below
shows how LLP is implemented in our system.
Figure 1: Illustration of laser light plane illumination.
Processing:
Community Core Vision, or CCV, is an open-source application used for capturing a video
input stream and outputting tracking data for the touches it captures. It processes the image it
receives from the camera to find the locations of the users' touches in a coordinate space. As it
gathers tracking data, it sends the data as a UDP packet to a local network port using a protocol
called TUIO. These packets are received using a TUIO listener within the TARGET software. The
software uses this information to change the current application state and process game
T
I
A
64-bit Linux Ubuntu.
Output:
The output image, meaning the updated game graphics, are sent via VGA to a projector
that displays the image at the surface.
Page | 4
System Operation:
The following figure shows the block diagram for the TARGET system:
Figure 2: Block Diagram for TARGET
In analyzing the block diagram, begin at the top. The user will touch the surface to
control the game. By doing so, their finger crosses the laser plane and this is seen by the
camera. The camera feed is captured in CCV and processes the feed to get the touch data. The
touch data is received by the TUIO listener and becomes the input to the gaming system (the
menus and the game applications). After the updates are made to the game state and graphics,
the new graphics are sent to the projector to be displayed at the surface. Essentially, the user
will touch the table and see a reaction that is accurate and realistic, just as they would expect
for a normal gaming table.
For more detailed information on how the system works, please refer to the Final Report for
TARGET located in the appendix at the end of this manual.
Page | 5
Setting Up The Table
1. Plug in the chord in the back of the table into a wall outlet.
2. Turn on the Intel Atom and raise the keyboard tray on the left door of the table.
a. Slide the wooden blocks on the sides of the keyboard tray down to hold up the
tray. There is room on the tray for the mouse as well.
3. T
C
on the surface.
4. W
U
5. After logging in, open Community Core Vision and calibrate it (see Calibrating CCV
section).
6. Put CCV into Mini mode by pressing the space bar on the keyboard and minimize the
window.
7. Run the application for TARGET.
8. Enjoy the entertainment it has to offer!
Using TARGET
1. Upon running the TARGET application, you will see a welcome screen that shows the
TARGET logo.
2. To access the game menus, touch your finger to the table and slide it to the left (just as
you would with similar touch devices, such as the iPod touch). There are two games: Air
Hockey and Mash.
3. The first menu is for Air Hockey. In this menu, you can choose what score you would
W
touch prediction. Once you have chosen the options you would like, press play and
have a blast!
a. T
eliminating delay. This option was used mainly to illustrate the difference
between the delay with and without prediction. For the most part, this option
will likely always be on.
4. The next menu is for Mash. In this menu, you can choose how long you would like the
game to last. Then push play and enjoy!
NOTE: In each game, there is a button to start a new game (with the same settings) and a
button to quit the game and return to the menu.
5. There is also another screen after Mash that contains acknowledgments to those who
helped make TARGET a success.
6. T
TA‘GET
Page | 6
Calibrating CCV
1. After
C
C
V
T
CCV
calibration mode.
2. T
For the best
calibration, it is best to have many of these symbols.
a. To change the number of symbols, follow the instructions on the calibration
screen.
3. Before calibrating, make sure there are no touches on the surface.
4. P
T
what CCV tracks against.
5. After placi
6. A
T
T
cle becomes light blue.
D
7. CCV is now calibrated.
8. P
Using CCV
CCV has two modes: Normal mode and Mini mode. In Normal mode, there are two
video feeds. The one on the left is the raw video feed and the one on the right is the tracked
image displaying unique IDs for each tracked object. There are settings under the tracked
image as well as at the bottom of the CCV window for adjusting the tracking. There are also
settings on the right of the CCV window, but the only one to worry about is the option TUIO
UDP. This option should be checked as this is how the tracking data is sent to the TARGET
software. In Mini mode, the video feed displayed is the tracked image. It also displays the
frame rate (which should be 80+ fps). This mode should be used while running the TARGET
software. To toggle between Normal mode and Mini mode, use the space bar on the keyboard.
T
CCV
E
Aligning the Lasers
For the best operation of the table, it is very important that the lasers are adjusted
properly. In the How It Works section of this manual, it was explained that the lasers must be
aligned very closely to the surface of the table.
Page | 7
WARNING: Before doing any adjustments, make sure to TURN OFF THE LASERS as there is a
chance they could be harmful if you look directly at them. The best way to do this is to make
sure the table is unplugged before beginning.
Remove the panels from the top of the table. BE CAREFUL not to touch the nails once
you pull off these panels. You will notice that there is a bank of four switches. They are used to
turn the lasers on and off. You will also notice the four laser mounts on each corner of the
table. These mounts are made of two parts: the tube that holds the laser and the metal plate
used to adjust them. For the tube, you need only make sure that the screws are tight to hold
the laser in place. On the metal plate, there are four screws that can be loosened or tightened
to adjust the height and angle of the laser. There are foam pieces under each mount that allow
this adjustment to happen. Each laser should be aligned properly for the best infrared coverage
of the surface.
When aligning the lasers, make sure all of the switches for the lasers are turned off and
then plug in the table. For safety reasons, stand BEHIND the laser you want to align and turn its
switch on. Place a wood block on the surface in front of the laser. Using a digital camera, such
as a cell phone camera, aim at the wood block. You should be able to see a thin red line of IR
light. This line should be completely level and really close to the surface. Adjust the screws on
the metal plate as needed to make sure the line is adequate. If the line is at a steep angle, you
can turn the line-generating lens attached to the front of the laser to level it out.
WARNING: Never use the lasers without the line-generating lens as the laser is much more
intense without it and can do damage if looked directly into.
F
the line-generating lens to make the line sharper. After aligning the lasers properly, you should
see a thin, clear red line of infrared light at the bottom of the wood block, just barely above the
surface of the table.
REMEMBER: Only adjust one laser at a time for the safety of you and others. Only turn on the
laser when you (and others) are standing out of the way and there is no chance that anybody
will be looking directly at them. Safety first!
Now open CCV so you can check how well the lasers are adjusted. For best results, CCV
should NOT capture and track your touch until you are actually touching the table (or at least
very clos
Y
CCV
I
are satisfied with your results, place the panel back on top and you are ready to go (remember
to recalibrate CCV)!
Page | 8
Other Maintenance
Projector:
The
I
the position is incorrect, the angle that the image hits the mirror will be off and thus the image
at the surface will not be aligned properly. It is also undesirable for the image to look fuzzy.
The position of the projector relies on the straps that hold it to the wall as well as the legs
underneath it. Adjusting these will allow you to properly position the projector should it ever
need to be done. Adjusting the focus, however, can be a little tricky and requires some finesse.
T
T
T
projector, push the lens in with your hand and tighten the screw so that the hook holds it as far
in as possible. Then, SLOWLY begin to loosen the screw, giving the hook more slack, so that the
lens will fall slightly and rest on the hook. Do this very carefully until the lens is in the correct
position to produce a clear image at the surface. Just keep in mind that adjusting the position
and the focus of the projector requires some trial and error.
Mirror:
T
for getting a properly aligned image
at the surface. Both the vertical and horizontal angle of the mirror is controlled using another
mechanism. For the vertical angle, the mirror rests on a mechanism that can raise or lower the
mirror when a nut is tightened or loosened on a metal rod. To raise the mirror, lift the arm that
the mirror rests on and slide the wooden stopper block beneath it forward. Then tighten the
nut behind the block until the block rests on it. To lower the mirror, do the opposite. To adjust
the horizontal angle of the mirror, there are two mechanisms, one under each side of the
mirror. The mirror rests on wooden blocks on these mechanisms. The wooden blocks can be
raised or lowered by loosening or tightening a nut underneath each block (similar to the arm
the mirror is resting on). By raising one and lowering the other, the horizontal angle of the
mirror can be changed. Adjust these mechanisms until you get the image on the surface where
you would like it to be.
Camera:
The camera must be positioned so that it can capture the entire surface of the table so
that all touches on the surface are seen. The camera rests stably on the same arm as the
mirror, but it may need to be realigned at some point. To do so, open CCV, place and object at
each corner of the projected image (or have some friends place their fingers there) and adjust
CCV
O
in the correct position, stabilize it using something such as masking tape.
Page | 9
Surface:
T
with a sheet of
vellum in between. It is important to clean the surface of the table so that the image is clear.
To clean the surface, use water with a cloth that will not cause scratches on the surface (such as
microfiber cloths).
WARNING: Do NOT use Windex on the plexiglass as this may cause it to become foggy or
cloudy.
To replace the vellum, unscrew the metal clips on the surface of the table (under the
top panel) and remove the top piece of plexiglass. Be careful not to hit the laser mounts as this
will knock them out of alignment. Then pull off the bottom piece and remove the vellum. Put
the replacement vellum on the bottom piece and replace both pieces of plexiglass, as well as
the metal clips holding them down.
REMEMBER: Before doing any work under the top panel, be sure to TURN OFF the lasers.
Lasers:
The most common maintenance for the lasers is aligning them. However, should the
lasers ever need to be replaced, you can order them from:
AixiZ Service & International, LLC
1-888-4-AixiZ-1
http://aixiz.globat.com/
The lasers used on the table are 780nm 25mW Laser Modules. You can also order 120
degree line-generating lenses if those need replacement. The lasers are easy enough to
replace. Simply remove them from the mount and replace them with a new one. Be sure to
realign the new one before use. Should the power source for the lasers need to be changed,
each laser needs 3.2V to operate properly.
Intel Atom:
If, for some reason, the OS on the Atom needs to be reinstalled, use 64-bit Linux Ubuntu
and be sure to install the necessary drivers from http://intellinuxgraphics.org/. Also be sure to
download and install Allegro 5 (the graphics library used to make the games) and Box2D (the
physics engine used in Air Hockey). The png and audio development libraries also need to be
downloaded to get Allegro to build. CCV can be downloaded from http://ccv.nuigroup.com/.
Code::Blocks will also be necessary for running and\or modifying the TARGET software.
Page | 10
Final Report for TARGET
Appendix
Page | 11
Final Report – Senior Design 2011
DeRoy, Gorman, Perras
1
Final Report for Touch-Activated Response
Gaming Entertainment Table (TARGET)
Patrick DeRoy (EE), Cory Gorman (CSE), and Marc Perras (CSE)
Department of Electrical and Computer Engineering
Senior Design Project 2011
Abstract— In the world of entertainment, anyone who has ever
wanted a pool table, an air hockey table, or similar product has
probably been deterred by the cost and difficulty associated with
buying and installing one. These products can cost thousands of
dollars and having several different game tables can take up a lot
of space. For those wanting several game tables, there are
existing multi-game systems that save space, but they can be just
as costly and difficult to set up. We are proposing an alternative
system that is not only cost effective and hassle-free, but also
provides a fun and innovative way for gamers to play their
favorite games. TARGET, which stands for Touch-Activated
Response Gaming Entertainment Table, is an interactive touch
screen game table that implements multiple game applications.
For our prototype, our basic structure for the table was built
from wood, PVC pipe, and an acrylic sheet, and the user touch
was implemented by a method known as laser light plane (LLP)
illumination, which will serve as the input to our system.
I. INTRODUCTION
T
OUCH-INTERACTIVE technology has become a very popular
phenomenon used in today’s society. Whether it is a cell
phone, an iPod Touch, your local ATM machine, or computers
at restaurants, more and more people are using this technology
than ever before. It seems as though everyone wants to have
the latest and greatest products that include a touch screen. We
are seeing that it is becoming highly associated with
entertainment. With this project, our team wants to provide an
interactive gaming system that has a lower cost and a higher
entertainment value than similar games already on the
market. Currently, gaming systems can be very costly and
sometimes difficult to install or maintain. This system would
be a solution that is cost effective and hassle-free while still
maximizing entertainment. Because of this, it would be a great
product to have in many environments such as bars, arcades,
or even at home.
There are some multi-touch systems that exist today, such as
the Microsoft Surface. Such systems have a large touch screen
that responds to user touch as input and can handle many users
at once. This suits our needs very well, except for the cost; for
example, the Microsoft Surface costs around $12,500.
Building a multi-touch system includes certain challenges. For
our implementation, the table will consist of several main
components: an acrylic panel used for touch input, a
PlayStation 3 Eye camera, an Intel Atom processor, and a
projector. The touch capability is accomplished using the
laser light plane (LLP) illumination technique. Infrared light
from lasers is shined just above the surface. When the user’s
finger just touches the surface, the IR light will hit the tip of
the finger and the PlayStation 3 Eye camera underneath the
table will register this as a “blob”. The camera captures an
image of the user’s touch (points of IR frustration) and sends
the data to the Atom. The system takes this as input and
determines the X and Y locations of the touch. It compares
these coordinates to previous touches to determine if a move
was made or a new touch has occurred. The newly updated
graphics are processed and sent from the system to the
projector for display at the user level.
II. DESIGN
The system can be broken down into components for input,
processing, and output.
The input to the system consists of user touches on an
acrylic panel. In each corner of the panel, a laser module is
placed. The laser module projects 780nm infrared light
through a line-generating lens, effectively creating a plane of
light above the surface of the acrylic. This laser light plane (for
which the technique is named) is a mere millimeter above the
surface. When an object, such as a finger, crosses the plane,
the light is scattered, and some of it goes downward into the
table. This is picked up by an infrared camera, and used as
input to the system. Figure 1 below shows how LLP is
implemented in our system.
Figure 1. Illustration of laser light plane illumination.
The processing is handled by an Intel Atom unit. It
processes the image it receives from the camera to find the
locations of the users' touches in a coordinate space. These
locations are then used by the applications, such as menus or
games, as input to give the users control. The current
Final Report – Senior Design 2011
application state is updated and some graphics processing is
performed.
The output image is then sent via VGA to a projector which
lies under the table. The image is then projected onto the
surface of the table for the users to see.
Figure 2 below shows the block diagram for our system and
the following section describes it.
A. System Operation
In analyzing the block diagram, we will begin at the top.
The user touches the panel, and in doing so crosses the laser
light plane. The infrared light then travels down to the camera
(bottom left), which sends its image data to the processing
unit. The hardware of the processing unit is not very unique, so
it will not be discussed in detail here. However, the software
should be considered.
For image processing, the system must convert the image
feed from the camera into user actions. Finger touches appear
to the camera as light-colored “blobs” on a dark background.
The image processing then determines the X and Y locations
of these blobs, and also tracks them. It needs to determine
which are new touches, which are fingers being dragged, and
when the user has stopped touching. This information is then
sent to the application software layer using a standardized
protocol known as TUIO. TUIO utilizes UDP packets, so that
communication between the image processing and application
layers can be done with socket programming.
The applications consist mainly of menus and games. The
menus provide a GUI through which the users can navigate the
various games, their options, and table settings and
configuration. The most common menu element is a button,
which is considered “pressed” when the user touches it. The
games interpret user touches differently depending on the
Figure 2:Block Diagram for TARGET
DeRoy, Gorman, Perras
2
game. For example, in air hockey, the user controls his or her
own paddle, which follows the movement of the touches.
Other extraneous touches are disregarded by this game.
There is also a physics engine component, which a game
may or may not use. For example, air hockey uses it for
handling collisions between the game objects; a game like
checkers would not use it. This engine simply needs to
simulate a simple 2D environment and be able to handle things
such as object motion, collisions between multiple objects, and
friction.
The final software component is the graphics processing.
This converts the current application or game state into an
image so that the user can understand what is going on. When
objects move, their positions on the screen should be changed,
for example. The graphics component had to be capable of
drawing simple shapes and text, and also of displaying images.
It draws game objects as different “layers”; there is a
background image, and some objects rest “on top” of others.
However, it needs to output a flat screen image that the
projector can display.
Not shown in the block diagram is the software that handles
the sound. This could be considered to be in the same class as
the graphics processing software. It simply plays a certain
sound when a particular event happens. For example, when the
air hockey puck collides with the wall, it plays a collision
sound, as one would expect in real-life air hockey. This is sent
through the sound card to the speakers.
The projector receives the image via VGA cable and
displays it. The image is displayed on the same panel that the
user touches. A sheet of vellum paper provides a surface where
the image can form. In this way, the entire system is seen by
the user as a touch surface device.
Final Report – Senior Design 2011
III. DETAILED REQUIREMENTS SPECIFICATION
A. The tracking software should be able to run at 60 frames
per second or higher.
If this capture rate is below 60 fps, then the delay can
become too noticeable because it will take too long to get the
touch data and process it in our software. Thus, the system
must be able to receive image information from the camera,
process the input, update the game state, and change the image
on the screen in the smallest possible delay, preferably around
100ms as this is well under the time it takes for a user to react.
This was easily tested using a latency test and we found that
our delay was 64ms, which is acceptable. We will describe the
experiment that tested this requirement later in the report.
B. The height of the table should be between 3ft and 4.5ft.
For the system to be usable, it must be at a comfortable
height for people to play. This, of course, varies because the
heights of people vary; however, we believe that this range
represents the limits of comfortable playing heights for most
people. However, for the shorter heights, it might require tall
people to bend down; and for the taller heights, shorter people
and children would likely need a stool. We have met this
requirement with a table height of around 3.5ft.
C. The size of the playable surface should be large enough to
accommodate multiple players simultaneously
The table is supposed to compete with other many-in-one
game tables, as well as normal air hockey and pool tables.
Thus, the surface of the table should be large to best simulate
the games. The surface size of the table should be maximized
and we believe that the current size of our surface (26”x35”) is
suitable.
D. The system should be able to handle inputs from at least
two players simultaneously without failing.
Many games are played by two players, so the system
should be able to handle at least that many. This means that it
should be able to process at least 20 simultaneous inputs (ten
fingers for each player). Of course, in most games, only a few
touches need to be considered at once, and the extra touches
should be ignored; however, this system must not produce an
error nor considerably slow even if both players decide to use
all their fingers at once. The number of touches that can be
handled should be maximized.
The number of inputs the system can handle can be tested
by increasing the number of touches present until an erroneous
result occurs. We found that, at first, doing this did cause a
failure, but we corrected the problem and now the table can
handle up to 64 touches.
E. The system should be usable in normal office-lighting
conditions.
For any game, it would be extremely frustrating to the
players if the system did not respond to their inputs correctly.
Not only should the response be timely, as mentioned
previously, but it should be the response expected by the
players. There are two factors to consider: the false positive
rate and the responsiveness. False positives are caused by
noise in the environment which makes the system believe a
touch has occurred. The responsiveness can be measured as
the number of actual touches to the number of touches the
DeRoy, Gorman, Perras
3
system registers. Of course, the rate of false positives should
be minimized and the responsiveness should be maximized.
The false positive rate should be no higher than 0.01%, which
at 60fps corresponds to roughly one false touch every 2.25
minutes. We feel that at this frequency, the false touches
would likely not be too annoying to players. The
responsiveness should be greater than 99%.
The performance of the system in this regard can be
measured experimentally. To find the responsiveness, we
count the number of actual touches and the number of touches
registered by the system and compare them. This can vary
between areas of the table, so the surface was divided into
sections and the experiment performed multiple times. Then,
the results were averaged, or the minimum result could be
taken. To find false positives, the experiment was similar,
except that registered touches which did not correspond to an
actual touch would be counted.
In darkness, the noise from the environment should be low,
so the false positive rate should be 0%. Also, the
responsiveness should be close to 100%. The experiments
were also performed in darkness to check that this is true.
We performed these experiments before MDR and again
before FPR. The first time, our results did not meet these
requirements, but after performing them again, we achieved
the results we wanted and thus this requirement is satisfied.
These results will be discussed later in the report.
F. The projector must be bright enough to be visible in
normal lighting without appearing too washed out.
Of course, the amount of wash-out is difficult to quantify, so
the experiment had to be based on our judgment. A test image
was created which showed a range of colors, and this was
projected in a lit room. If the image produced was
unacceptable, then a more powerful projector would be
needed. According to our research, a projector should output
at least 1400 lumens, and preferably higher, for use in normal
lighting conditions. The projector we settled on, which was
generously lent to us by the ECE department, outputs at 2000
lumens. This will be sufficient in any lighting condition.
IV. FINAL PROTOTYPE AND MEASUREMENT RESULTS
A. Final Prototype
In the CDR, our prototype consisted of the almost fully
constructed table as well as a working software example that
drew circles where the user touched. We still had some design
hurdles to overcome such as obtaining a better response from
our lasers for input, fixing the delay between input and output,
and deciding on a final structure for the table itself. We also
stated our goals for FPR. We said that by FPR, we would
have liked to have the finished table and have developed
software for the physics engine, UI, and game applications. At
the bare minimum, we wanted to have at least one solid game
working, namely air hockey. Since CDR, the software has
been our main focus, as well as obtaining a high enough
framerate from our tracking software such that the delay
between input and output was acceptable. The projection
Final Report – Senior Design 2011
setup was still not 100% perfect either, but after a lot of
experimentation and construction for stability, the projection
setup is sufficient and as we desired with a focused image at
the correct size and a stable mirror setup that will not move
around if the table is bumped. To get the correct focus, we
created a mechanism that serves as a fine adjustment for the
lens. We were having trouble with this due to the fact that the
projector is facing downwards and the lens naturally moves
downwards because of gravity. Another issue we were having
was a hot spot in the middle of our table from the projector
which created a problem for input in the center of the table.
Our solution was to place a piece of heat absorbing glass in
front of the projector lens. Luckily this glass was pretty cheap
and after creating a mount to hold it in place, we successfully
minimized this hot spot dramatically. We bought stronger
lasers and built new laser mounts to obtain a stronger input for
the tracking software. Meanwhile, we worked on creating a
prototype for air hockey that could be tested and debugged on
our table. After making these adjustments and modifying the
software for the game as desired, we have a prototype for air
hockey that works quite well.
For software, we continue to use the CCV program for
finger tracking, as it has proved more than sufficient. On the
Atom, after updating graphics drivers and rebuilding the
kernel, we are able to achieve a frame rate of around 100 fps.
To create Air Hockey, we learned how to use the Allegro
graphics library and the Box2D physics engine. We did this by
making iteratively better demo applications in C++: first, a
program which drew circles where the user touched; then one
where the user could drag the circles; a non-interactive physics
demo; a touch-interactive physics demo; an app with audio; an
app with bitmap images; and then Air Hockey. We used an
SVN to keep track of the different versions we had. A TUIO
Listener waits for incoming TUIO packets, and when it
receives one, it generates an event and places it in an event
queue. In our main game loop, the system performs game
logic, such as receiving and processing input, and then
drawing. The inputs, along with framerate timer events, are
processed one after another. The system then loops over all
objects in the game and updates them. For the physics part of
the game, when a touch occurs, a Box2D mouse joint is
created, which forces an in-game object to move towards a
point while still simulating correctly. The physics simulator
then performs very precise collision detection and response for
each object. When drawing, the main game loop calls each
object to draw itself to a backbuffer. When all objects are
finished drawing, the screen image is replaced with that of the
backbuffer. All of this happens 60 times per second, and
essentially this is how the Air Hockey game works.
In general, we are in a good place at this point in time. The
expansion of more applications and games looks like it is right
around the corner. As we said in the last report, part of
designing a system such as this one is determining where
design challenges exist and overcoming them. We believe we
have overcome most of these challenges and come up with
good solutions to stay on track. One of the keys to our success
DeRoy, Gorman, Perras
4
was definitely the experiments we performed and the
measurement data we obtained in these experiments. This is
described, in detail, in the following section.
B. Measurement Data
For our MDR prototype, we developed experiments to
measure the responsiveness and the false positive rate of the
touch surface. For both tests, we split the table surface into
sections as shown in Figure 3. We performed each experiment
in both light and dark environments to ensure that the touch
surface works in any setting.
A
D
E
I
F
B
C
G
H
J
K
Figure 3: Touch surface test sections labeled
A - K (Note: the lasers are mounted in the four
corners of the surface)
For responsiveness testing, we tested each section of the
table by touching it repeatedly a large number of times and
keeping count of how many touches we performed and how
many touches were registered by our system. To find
responsiveness we use the following equation:
Responsiveness =
number of registered touches
(1)
number of actual touches
While testing responsiveness, we simultaneously tested for
false positives. We kept track of the number of false touches
that were registered by the software during the responsiveness
test. To find the false positive percentage we use the following
equation:
False Positive =
number of false positives
number of actual touches
(2)
We expected that the sections on the sides of the table (B,
D, H, J) would have the least responsiveness as they are not
receiving as much IR light. The sections near the lasers (A, C,
I, K) would likely have high responsiveness, as they are closest
to the lasers and have high IR exposure. Similarly, the middle
sections (E, F, G) would likely have high responsiveness, as
this is where the IR light from each of the four lasers meets.
These results also differ in the two different settings (light and
dark) because in a light environment, the touches could be
washed out by ambient lighting, and in a dark environment,
there is a much higher contrast between touches and the
background. The goal is to maximize responsiveness in any
setting.
Final Report – Senior Design 2011
We expected that the false positive test would rely highly
upon the setting. For example, in a setting with a lot of
ambient lighting, we would expect more false positives, as
there can be IR light in the surrounding environment. And of
course in a setting with little or no ambient lighting, we would
expect very few false positives. Clearly we want to minimize
this factor in any setting.
Table 1(a) shows our results for the responsiveness test and
Table 1(b) shows the results of our false positive test when we
performed these experiments for MDR. Recall from our
requirements section that our goals were to have 99%
responsiveness and a false positive rate of one per 5.5 minutes
(0.01%). You can see from these results that we were not
quite meeting our requirements yet.
Responsiveness (%)
Region
Dark Setting Light Setting
A
100
100
B
100
100
C
100
94
D
76
70
E
92
90
F
92
94
G
96
88
H
100
100
I
94
92
J
100
90
K
100
92
Table 1(a). Results of the initial responsiveness test.
Number of False Positives
Region
Dark Setting Light Setting
A
0
0
B
0
0
C
0
0
D
0
2
E
0
0
F
0
0
G
0
0
H
0
0
I
0
0
J
0
0
K
0
0
Table 1(b). Results of the initial false positive
test. (Note: 2 false positives in D account for
0.36%)
Our overall results for this experiment were as follows:
responsiveness was at 91.82% in a light setting and 95.45% in
a dark setting; false positive percentage was 0.36% in a light
setting and 0% in a dark setting. Since our results in this
experiment were not up to our requirements, we needed to
adjust to make them so. First, we were able to focus the lasers
to make them stronger, so we could adjust them to focus more
light in the areas that require it. Also, we tried to focus the
DeRoy, Gorman, Perras
5
camera better so that it was more likely to capture touches.
We could also adjust the settings on our tracking software. If
necessary, we could have switched to 850nm lasers, as they are
unlikely to be more susceptible to noise from ambient lighting
(although they are more expensive), or switch to higher power
lasers (although they are potentially more dangerous). We
also have to note that there are many external factors that
affect this experiment and we had to try to minimize this as
much as possible.
For our final design, we made adjustments and
performed these experiments again. Before performing this
experiment for the FPR, we had replaced the lasers with higher
power ones (25 mW). After adjusting them such that the table
coverage was ideal, focusing the camera to its best potential,
and making sure CCV picks up finger touches accurately, we
obtained much better results. Tables 2(a) and 2(b) show that
when touching the table rapidly 50 times in each section,
whether it was light or dark, we obtained 100% responsiveness
and 0 false positives. These results certainly do meet our
requirements!
Responsiveness (%)
Region
Dark Setting Light Setting
A
100
100
B
100
100
C
100
100
D
100
100
E
100
100
F
100
100
G
100
100
H
100
100
I
100
100
J
100
100
K
100
100
Table 2(a). Results of the final responsiveness test.
Number of False Positives
Region
Dark Setting Light Setting
A
0
0
B
0
0
C
0
0
D
0
0
E
0
0
F
0
0
G
0
0
H
0
0
I
0
0
J
0
0
K
0
0
Table 2(b). Results of the final false positive
test.
Another important experiment we performed was to
measure the input latency of our system. As we began writing
the software for our table, we noticed that there was a
noticeable delay between the input and the output that was
Final Report – Senior Design 2011
unacceptable as it made gameplay seem unrealistic. We did
not even need to measure this delay because it was bad enough
that we could see it with our own eyes. We made several
adjustments to reduce this delay, such as reducing the
resolution, adding touch prediction, and switching from a 32bit operating system to a 64-bit operating system. After doing
so, the delay was dramatically reduced and was almost too
short to notice. Although this is what we wanted, we still
decided to design an experiment to see just how long this delay
was. This experiment involved an additional laser and an
additional Playstation 3 Eye camera. Basically, we would
shine the laser on the table to get a response from the game
and capture this using the high-speed camera. Then we would
look at the captured video and step through it frame by frame.
Once the laser turned on, we counted the number of frames it
took for the object on the table to reach the “touch” created by
the laser. By doing so, we could divide this number by the
framerate of the camera (125 fps) to get the delay from input
to output. We performed this experiment with CCV, our
tracking software, capturing touches at 20 fps, 30 fps, 75 fps
and 100 fps. The results from this experiment can be seen in
Figure 4 below.
Figure 4: Results of the input latency experiment.
As you can see from the results above, we found the the
delay got smaller as CCV’s capturing rate grew larger. By
running CCV at 100 fps, the delay is about 64ms. This is an
acceptable delay because it will not affect the user’s gaming
experience.
V. PROJECT MANAGEMENT
A. Team Roles
Our first step in beginning this project was visualizing the
table that we wanted. We all collaborated and came up with
our initial ideas for construction of the table. To visualize this
design, we used Google SketchUp to create a CAD layout of
our table. The building of the table itself was a team effort
where we all took part in building the frame for the acrylic
sheet, assembling the frame and legs, assembling crossbars for
stability, etc. There were a lot of tasks that needed to be done
to test our ideas, which included modifying and testing the PS3
Eye camera (changing the filter), testing the lasers with the
DeRoy, Gorman, Perras
6
camera, prototyping laser mounts and crossbars, experimenting
with the projector and mirrors. We all took part in these
experiments and helped one another. It was not until we
moved on to other areas of the project that we established and
set concrete team roles. These team roles are:
● Patrick DeRoy: Projection setup for output, physics
engine, GUI, incorporating image bitmaps into games
● Cory Gorman: Laser & camera setup for input, game
development, incorporating touch prediction, website
administrator
● Marc Perras: Table structure and design, image and
graphics processing, incorporating audio into games
We set these team roles to assign one person to each area
that we worked on together to ensure that someone is
responsible in making sure that portion of the project is
maintained and functions correctly. In the first semester, the
actual building of the table was our main focus, a task which is
sequential and involved more than one person at a time to
work on. Although we still had structural requirements to
finalize, the second semester’s main focus was the software
portion of the project. Even though we could have worked on
all of the software together, it was easier to divide this portion
of the project into sections and to assign one another to
specific areas and specific aspects of the games. By doing
this, we could work on the software in parallel and get a fully
functioning game in a short time. Thanks to our hard work,
research, help from forums online, input from our advisor, and
the experiments we performed, we now have a better
understanding of how the software works together and
achieved success in creating an output at the user level that is
fun and realistic.
VI. APPENDIX
A. Application of Mathematics, Science, and Engineering
In the design and development of this prototype, we have
used the knowledge and skills acquired in the following
courses:
1. ECE 242: Data Structures & Algorithms
We must create efficient software by using data
structures and various algorithms for both the image
processing and graphics processing in our system, as well
as object-oriented techniques for games.
2. ECE 354: Computer Systems Lab II
We use the concepts of embedded system software
development and image processing from this course in our
system design to process image data for both input and
output on the Intel Atom and interfacing with external
devices.
3. ECE 374: Computer Networks & the Internet
From this course, we are able to use our knowledge of
socket programming, which we use for interprocess
communication between the image processor and
applications.
Final Report – Senior Design 2011
4. Physics 261: General Physics III
In the implementation of our design, we use the
concepts of waves and optics including reflection for the
projection as well as the reaction of infrared light to
interference.
Detailed Example:
We used concepts from physics that allowed us to
determine the proper positioning of our projector and
mirror in order to provide a clear and properly sized image
at the surface of the table. To do so, we used ray tracing to
help determine the angle of the projector and the mirror as
well as the distance required between the projector, the
mirror, and the surface. When reflecting the projected
image off of a mirror, we had to figure out how to avoid
problems with the physics of this reflection, such as
keystone correction (image skewing caused by reflection).
Additionally, we used our knowledge of infrared light for
our touch surface. The objective of the lasers is to serve as
an indicator of when and where the surface is being
touched so that our software can determine when and how
to react. For this to work, the infrared light needs to bend
downward upon encountering interference. That is, when a
person touches the table, and thus interfering with the IR
light, we need the IR light coming from the lasers to be
deflected downward so that the IR camera underneath can
pick up the light.
B. Design and Performance of Experiments, Data Analysis
and Interpretation
We decided that one of the most important aspects at MDR
was ensuring that we had the appropriate “strength” of input.
That is, we want the finger touches to be as bright as possible
so that our software will be able to pick them up as easily and
accurately as possible. This also requires that all locations of
the surface (corners, middle, sides, etc.) have an acceptable
brightness for finger touches. Since we are engineers, we had
to devise an experiment that would allow us to determine
whether this was the case. Our experiment involved dividing
the table surface into sections and then testing each section
using our software. Basically, we would repeatedly touch the
section of the table we are testing to see how accurately the
software could pick up the touch. We were looking to see if
the number of touches was correct because we could have
missed touches or false touches. This would tell us whether
we needed stronger lasers, or whether there was enough
difference in the brightness of touches versus ambient light, or
if there were any dark spots (locations on the table that were
out of reach of the touch effect). We found that we needed
brighter lasers because the finger touches were not as bright as
we would like them. After purchasing new lasers, which were
25 mW instead of 10 mW, we obtained much brighter results
from the touches. We performed this experiment again before
FPR, and found our results to be much better.
Another aspect we needed to test was the input latency from
the moment a finger touches the table to the time the game
reacts to that touch. To test this, we used a second high-speed
camera to capture a laser positioned above the table. The
DeRoy, Gorman, Perras
7
camera captured the laser turning on and the game reacting to
the laser’s “touch.” We then looked at the video captured by
the camera and counted the number of frames it took for the
game to react. We then divided the number of frames by the
camera’s framerate (125 fps) to get the delay. With CCV
running at 100 fps, we were getting an input latency of 64ms.
We deemed that this was acceptable as it does not cause an
unrealistic lag.
C. Design of System, Component or Process to Meet Desired
Needs within Realistic Constraints
The The various requirements for our design pertain to
system performance and physical constraints of the table itself.
With regard to performance, the system needs to handle inputs
from multiple users and it needs to be able to process finger
locations and produce an output in the smallest amount of time
needed to simulate a real game. It also has to include a
realistic physics engine so that the response in each game is
comparable to a real game.
With regard to physical
constraints, we wanted the table to be large enough to feel like
a table game already found in homes and public locations, but
we did not want the table to be unrealistically tall due to our
projection setup.
There are also several real-world constraints for our design.
First, we have an economic constraint in the cost of the
project. Ideally, we would want to market the table as a
product for consumers. If this is the case, we need to ensure
that the design cost does not exceed that of competitors
already on the market. Secondly, there is a social constraint of
usability. We want our table to be easy to use for all age
groups. This means simplicity at the user level and this is also
affected by our physical constraint since we would want
people of all heights to use the table. Lastly, we have a health
and safety constraint. The lasers we are using, although low in
power, could be potentially dangerous if there is direct eye
contact.
Currently our design meets several of the constraints above,
or it at least allows us to adjust in order to adhere to these
constraints. For performance, we have successfully captured
touches from multiple users by using multiple lasers on the
table, which eliminates occlusion (blockage of finger touches
by other interferences on the table). Additionally, we have
tested our table to make sure that the time it takes for a touch
to cause a reaction is minimized. Our test showed that the
delay was small enough (64ms) that there was minimal lag
during gameplay. To address the physical constraints, we have
made our table adjustable in height so that we can experiment
with the projection to avoid making the table too tall. After
several adjustments to make the table short enough, we were
able to get the table’s height down to about 3.5 feet.
For the economic constraints, we remained under budget
due to the fact that we were able to get a lot of materials for
free. However, we must determine how much it would cost to
produce as a commercial product. With our prototype, we
have found several ways we can decrease cost if necessary,
such as building our own projector instead of buying one and
modifying the Playstation 3 Eye camera for IR instead of
buying an IR camera. Although we were able to stay under the
Final Report – Senior Design 2011
budget limit of $500, we estimate that the production cost of
our table would be around $850 - $900. This may seem high,
but it is still a relatively good cost compared to games that this
project could compete with. The social constraint is also
addressed by the adjustable height of the table. When creating
the user level software, we intended to make it very simple.
Essentially, there is a menu of buttons for selecting a game
(just push and play). For health and safety concerns with our
lasers, we intended to make the table short enough so that the
lasers are not at the level of the eyes of the users and we will
include warning labels. Additionally, for our safety in
development, we included switches which allowed us to turn
off the lasers we are not working on, so we do not mistakenly
look into them. On the top of the table there is a frame which
covers the lasers and the switches to ensure that the users will
not be able to see anything but the playing surface. This will
ensure that they are not look at the lasers directly and that they
will not accidentally hit the switches.
D. Multi-disciplinary Team Functions
· Patrick DeRoy, EE: In charge of projection setup for
output, physics engine, GUI
· Cory Gorman, CSE: In charge of laser and camera
setup for input, game development, website
administrator
DeRoy, Gorman, Perras
8
Figure 5: The effect of input latency on the table’s response
However, we realized that users’ input to air hockey is
actually quite predictable. Typically, a user will be holding the
paddle still, then move very rapidly in a rather straight line,
and then slow to a stop again or changing direction. Thus, we
developed a system for Touch Prediction.
As can be seen in Figure 5 below, we can extrapolate based
on the previous touch’s velocity to find a new position and
“catch up.” There will be some overshoot (or in the case of
speeding up, undershoot), but we can also look at the change
in velocity to try to account for this and minimize the amount
of time we are “wrong.”
· Marc Perras, CSE: In charge of table structure and
design, image and graphics processing
E. Identification, Formulation and Solution of Engineering
Problems
One issue we had with the system was that when a user
dragged their finger, the table’s touch response would lag
behind. The motion was correct, but it was just a bit too late.
Earlier in the paper we talked about input latency, and how
we were able to achieve a latency of 64ms--much lower than
the average human reaction time of around 215ms. Therefore,
when a user places their finger on the table, the response seems
instantaneous. However, when dragging their finger, reaction
time does not matter anymore because the user can see clearly
that the position of their finger and the table’s response is not
the same.
So despite our extremely low input response time, this made
our table seem sluggish. And when playing air hockey,
although still quite enjoyable, the lag made the game seem
unrealistic. Furthermore, it would be impossible to reduce the
input latency all the way to zero, so bettering our response
time would not help the situation.
Figure 5 shows how the delay affects response time of the
table. The table response is always behind the user’s touch by
1 latency unit.
Figure 6: Using touch prediction to eliminate the lag between
the user touch and the table’s response.
Essentially, we are predicting where the user’s touch will be
based on the current velocity and position. By doing so, we
can update the graphics with predicted information,
eliminating the lag that would normally exist. To implement
this, we created the following equation:
Predicted Position = Touch Position + α * Delay * Velocity +
ö
æ Velocity
- 1÷
÷
ç Velocity
old
ø
è
β * Delay * ç
(3)
where Delay is our input latency and α and β are parameters to
be set after experimenting. This equation is applied on both the
x- and y- axis.
We have found that, in practice, this works really well, even
for curves or other more “unusual” motions. It is difficult to
Final Report – Senior Design 2011
design an experiment to back up this statement, but we found
that when using the table, the table’s response is much closer
to the user’s finger, and very often directly beneath it. We
invited some other students to test the response for Air
Hockey, and they seemed satisfied with the Touch Prediction’s
response. Also, the reason for this working so well can be
determined from looking at the above figures. At first, it would
seem that it would not work well, because it looks like we are
still wrong half of the time. However, most of the motion
consists of the “middle part” where the prediction is correct.
Also, remember that these times are extremely small--only
64ms--so any overshoot seems much less noticeable, and the
acceleration factor helps with that as well. Thus, we are very
satisfied with the Touch Prediction solution to the dragging
lagging problem and believe it will provide for a much better
user experience.
F. Understanding of Professional and Ethical Responsibility
One issue with ethical responsibility is the safety of our laser
setup. We have to be sure that the lasers will not affect the
health of the user. We can do so by switching them off as we
work on them and placing them in a safe location within the
table so as to avoid eye contact from the user. Additionally,
we can display a warning so that the users will know the lasers
could potentially be harmful. Our final prototype includes
wood that covers up the lasers to prevent the user from looking
directly at them.
An issue of professional responsibility is for us to give credit
to those who have created software that we are using in our
project. One in particular is the software, called Community
Core Vision (CCV), for tracking finger touches. It is our
professional responsibility to give credit to its developers. We
also must give credit to Erin Catto, creator of the Box 2D
Physics Engine. The contribution of this software made game
development much easier. Finally, we would like to
acknowledge the developers of Allegro, the graphics library
we used for our games.
Additionally, we would like to thank Professors Russell
Tessier, Tilman Wolf, Dennis Goeckel, Ramki Gummadi, T.
Baird Soules, and especially our advisor Paul Siqueira. We
would also like to thank Unistress Corporation and Petricca
Industries, as well as the ECE department for donations to this
project. A great deal of thanks to Francis Caron and Rich
Correia for helping in the SDP lab all year.
G. Team Communication
Team communication has been primarily done through
weekly meetings, both with the team and our advisor. The
team meets about three to four times a week, generally
Monday through Thursday. Our team meeting with our
advisor generally takes place on Wednesdays at 10 am or
11am. In all of these meetings, we discussed our progress and
collaborated on design issues. Our advisor gave us feedback
on our progress, made suggestions for what we should
accomplish for our next meeting, and provided us with
information that was useful for our design reviews.
Outside of the team meetings, we also communicated via
email and phone. We used an SVN for our software as a
DeRoy, Gorman, Perras
9
means of communicating our work to other group members.
Additionally, we kept lab journals that contain information on
what we had done, ideas for what we would do in the future,
and simple notes or to-do items to keep us on track.
Marc Perras was the main contact for the team for setting up
advisor meetings and design reviews with the team’s
evaluation board.
H. Understanding of the Impact of Engineering Solutions in
a Global, Economic, Environmental, and Societal Context
This project can have an impact both in an economic and
societal context. Economically, it could potentially stimulate
the market for gaming and entertainment. Currently, there are
no inexpensive touch surfaces on the market and so the
competitors in this area have been traditional game tables. If
this product were introduced to the gaming and entertainment
market, it could become a competitor because it is relatively
inexpensive and the idea of touch technology in a gaming table
would be very popular. Gaming systems are always trying to
find new ways for the user to interact with the game and we
believe that this project will do just that. This is where
societal impacts come into play as well. If we were to market
our design as a product, people would buy our table for their
homes or their businesses (such as bars or arcades) where
people go to be entertained and enjoy the company of others.
Our table could provide a reason for friends and family to
interact more often and bond with each other.
I. Application of Material Acquired Outside of Coursework
The following are examples of sources of material outside of
our coursework:
1. NUI Group: A public forum for people interested in
computer vision and natural user interfaces, including
multitouch technologies.
2. Community Core Vision (CCV): Open source software
for object tracking.
3. Manuals and other documentation for the Intel Atom
embedded computing platform.
4. Box 2D Physics Engine: Open source physics engine
written primarily for games.
5. Allegro: An open source graphics library.
Detailed Example:
We are using the CCV software to track finger touch
locations for our system input. The software is open source
and so we can modify and rebuild it if necessary. The
software allows us to filter and amplify finger touches so
that they can be easily tracked. We not only used this for
our tracking software on the finished table, but also for
testing during development.
To learn how to use graphics library and physics engine,
we read the manuals for them and learned from the included
examples. We also analyzed some of the source code for these
to find out information that the manual did not include--for
example, the usage of mouse joints in Box2D and the way
Allegro handles audio drivers on Linux.
Final Report – Senior Design 2011
J. Knowledge of Contemporary Issues
There are several issues we wanted to solve by designing
this system. First, we wanted to create a solution to the
problems that arise with traditional game tables as well as
existing multigame systems. These systems can be costly and
inconvenient. In addition to solving these problems, we
believe that this table would also be very popular and on par
with current technologies. For example, touch interfaces have
been very popular in many devices, such as smart phones, mp3
players, and computers. Because this has been a popular
reason to purchase these items, we feel that the same
demographic will take an interest in our table. Taking these
contemporary considerations into account, we believe that we
have a reasonable motivation for this design.
K. Use of Modern Engineering Techniques and Tools
Three modern engineering techniques and/or tools that we
are using for this project include:
1. Object-oriented programming and socket programming
using C++ for our game development and data processing.
2. Laser Light Plane touch technology, which is a wellknown technique in the NUI community.
3. Versioning tools such as Tortoise SVN and Springloops
for software development.
Detailed Example:
The NUI community is devoted to finding new ways of
creating natural interfaces, such as Laser Light Plane. This
technique is widely known by them to be very effective for
touch applications. This is a modern technique developed
by professionals with degrees in Computer Science and
Engineering.
DeRoy, Gorman, Perras
10
REFERENCES
[1] NUI Group Community. (2008, May 22). Getting Started
with Multitouch: Multitouch Techniques. [Online].
Available:http://nuigroup.com/forums/viewthread/1982
[2] NUI Group Community. (2009, November 5). Laser Light
Plane Illumination (LLP). [Online]. Available:
http://wiki.nuigroup.com/Laser_Light_Plane_Illumination_(
LLP)
[3] NUI Group Community. 2010. Community Core Vision.
[Online]. Available: http://ccv.nuigroup.com/
[4] Code Laboratories. 2010. PS3Eye Disassembly & IR Filter.
[Online.] Available:
http://codelaboratories.com/research/view/ps3-eye-disassembly
[5] Projector People. 2010. Lumens Guide. [Online.] Available:
http://www.projectorpeople.com/resources/lumen-guide.asp
[6] ADTECH Systems and The Projector Pros. 2011. Throw Ratios
and Viewing Distances. [Online]. Available:
http://www.theprojectorpros.com/learn-s-learn-ptheater_throw_ratios.htm
[7] Da-Lite. 2011. Angles of View: Projection Geometry. [Online].
Available: http://www.da-lite.com/education/angles_of_view.p
hp?action=details&issueid=28
[8] Mitsubishi Electric Corporation. 2011. XD200U DATA
Projector User Manual.
[9] Box 2D Physics Engine, 2010. Box2D v2.1.0 User Manual.
[Online]. Available: http://www.box2d.org/manual.html
[10] Allegro, 2010. Allegro 5 Reference Manual. Available:
http://www.allegro.cc/manual/5/
[11] Allegro Wiki, 2010. Getting Started With Allegro: Allegro 5
Tutorial. Available:
http://wiki.allegro.cc/index.php?title=Allegro_5_Tutorial