1
Zoomgraph
Eytan Adar, Joshua R. Tyler
Information Dynamics Lab, HP Laboratories
1501 Page Mill Road
Palo Alto, CA 94304 USA
+1 650 857 1501
{eytan,jtyler}@hpl.hp.com
ABSTRACT
As graph models are applied to more widely varying fields, researchers struggle with tools that are at
times too general or too specific for their needs. The Zoomgraph system attempts to address this issue by
allowing users to define graphs with complex node and edge attributes, and providing a command and
scripting language to manipulate and explore these graphs. The tool, which is publicly available, also
includes a zoomable visualization system for rendered graphs that allows users to smoothly move between
graph views. Zoomgraph is a full featured graph analysis package with the ability to generate simple
snapshots as well complex animations of dynamic graphs and to interface to external systems (such as the R
statistical system). In this paper we will describe the Zoomgraph system and language and detail its novel
features.
1. INTRODUCTION
As the popularity of graph models increase in domains as varied as social sciences, organizational
behavior, physics, and biological sciences, the number of visualization options available to researchers has
become almost overwhelming. Researchers now must struggle to decide which tool best suited for his or
her needs. These tools are at times too general to handle the modeling of specific graph models or at times
limited to one domain. Due to the nature of our own research involving biological, social, and
computational networks, we saw a need for a general-purpose, interactive tool that is flexible and
reconfigurable enough to satisfy the demands of many different applications through one consistent
interface.
Through our new language and interface, Zoomgraph allows a user to define, describe, and visualize his
or her data and is particularly intuitive to users with little programming experience yet provides advanced
features based on a relational database model. Nodes and edges in graphs naturally have varied attributes
depending on the application. Zoomgraph users can specify the types of data, attributes and the possible
relationships between them. From this input, Zoomgraph creates a database-driven backend, enabling a
rich set of possible queries on the data.
Studying arbitrary graphs or networks within the database is made easy by Zoomgraph’s simple
command language. With statements such as “colornodes red Smith, Rogers” or “edgewidth 1
{dept=’finance’}-{country=’mexico’}”1, users can quickly and simply explore and create informative
graphs from their data. For advanced users, Zoomgraph can be driven by a SQL-like relational query
language and command line interface. The language is supported both as an embedded interpreter as well
as through scripts.
1
Both examples act on a social network. The first example colors the nodes called “Smith” and “Rogers” red. Since
nodes are first class objects we can refer to them by name. The second command sets the width of any edges between
individuals in the finance department and individuals in Mexico.
DRAFT – PLEASE DO NOT DISTRIBUTE WITH PERMISSION
Beyond the command line, Zoomgraph utilizes a zoomable user interface (ZUI). ZUIs are a class of
graphical user interfaces that allow a user to “zoom” in and out of a workspace, effectively introducing a
third dimension to the more typically two-dimensional navigation of computing environments. Simple
features such as centering on a selected node or zooming to focus on both end points of a clicked-on edge
greatly enhance navigability.
Our desire to implement a zoomable graph tool stemmed from a need to visualize large networks, such
as gene interaction networks or social communication networks in big organizations. By “large”, we mean
graphs containing at least a few hundred nodes, up to many thousands2. We sought to extend these ideas by
creating a system that combines them in a smoothly animated real-time environment with dynamic graph
content. Zoomgraph’s ability to smoothly shift (“morph”) from one graph configuration to another enables
the quick visualization of dynamic graphs, which can then be saved as images or movies.
In addition to a number of built-in functions, Zoomgraph provides advanced statistical and mathematical
network analysis by means of a connection to the R software package. Results of this analysis (e.g. the
betweenness centrality measure) can be integrated into the Zoomgraph database, enabling visualizations
based on these results (e.g. different colors depending on betweenness values).
1.1 Paper Roadmap
In Section 2 we will briefly discuss related systems. Sections 3 and 4 will cover the interactive language
used in Zoomgraph and some advanced features mentioned above. We conclude with a discussion of
ongoing work on the system.
2. RELATED WORK
2.1 Graph Exploration and Manipulation
In general, graph visualization tends to be a second, separate step from analysis. Analysis packages such
as Ucinet [10] are used for partitioning the graph and performing various calculations. The output of these
programs is then passed to external programs such as Pajek [3], Netdraw [9], GraphViz [12], or KrackPlot
[19] (to name a few). While powerful in rendering and performing layout operations, these packages by
necessity tend to serve only the most common required features for graphs (colors, shapes, etc.). Exploring
the graph based on more complex node and edge properties requires going back and forth between the
analysis and the visualization packages.
Some address this problem by generating a common API for the manipulation of graph objects in
memory as well as visually ([21][13][32]). Unfortunately, this approach requires compilation and does not
allow the user to interact with the graph dynamically. To support such behavior requires an additional
infrastructure that provides access (or storage) of complex attributes of graph objects. Another system,
Libsea[18], is a Java library that provides graph storage functions that was designed to handle graph objects
with a wider set of attributes. However, it still does not provide visualization functions or a graph specific
query language.
The database community and researchers leveraging database standards have also sought to address the
storage and querying of graphs. XML-based approaches such as GraphML [6] (and GXL [31], GML [16],
etc.) allow for a set mechanism for describing and passing graphs between applications and provides the
flexibility for additional attributes. However, such an approach still depends on the visualization program
2
We have successfully loaded Zoomgraph with networks as large as 30,000 nodes (and more is theoretically possible).
However, more work needs be done to properly lay out these large graphs.
DRAFT – PLEASE DO NOT DISTRIBUTE WITH PERMISSION
to render and provide an interface for selection
and updating of graph objects. While using an
XML standard provides access to evolved
database technologies, it also forces reliance on
XML standards for selection and update (i.e. the
Web Consortium’s XPath and XUpdate). These
standards are intended for very general
applications and are thus unwieldy for the user
wishing to manipulate graph objects in a natural
way. The GraphDB system [14] was designed
from the start to hold and query graph
structures though it lacks visualization features
and thus depends on external drawing tools.
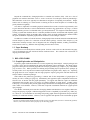
User
Input
UI
Interpreter
Analysis
Components
Interface to R
DBServer
Systems such as Visone [7] and the
commercial NetMiner [24] are powerful tools
SQL Database
that utilize a graphical user interface for access
to graphs. The Visone approach to object
selection is to allow users to pick nodes and
Fig 1: The basic Zoomgraph architecture
edges based on physical features (color, size,
shape, etc.) and perform transformations or
analyses based on the value of those features. Such an approach, however, assumes that the data is initially
partitioned in a way that the all attributes are directly convertible to a physical representation. The
NetMiner system provides slightly more sophistication by allowing additional features to be defined, but
limits the queries that may be applied to nodes to a simple Boolean scheme (e.g. node attribute 1 equals ‘x’
AND node attribute 2 equals ‘y’).
We believe the system most similar to Zoomgraph is a new plug-in [28] to the GGobi visualization
package. By tying into the R system (a public implementation of the S language), the system allows users to
control and analyze graphs interactively using the S language. While powerful, this system uses the firstclass objects of the S language (matrices, vectors, etc.) that naturally may be used to represent graphs, but
additional steps are often required by the user for simple operations. As we will show, the Zoomgraph
approach is to consider nodes and edges as first class objects and transform those into R matrices for
analysis if needed.
Zoomgraph is not an all-inclusive package. Frequently the tools mentioned above provide unique
features (more advanced layout algorithms, more efficient analysis algorithms, etc.) that Zoomgraph lacks.
Where appropriate we have built in facility to exchange data with these applications (currently, Pajek and
other simple comma separated formats). However, we believe that the approach we describe below,
combining a new language targeted specifically at graph objects and visualizing those structures, extends
the current state of the art.
2.2 Zoomable Graph Visualization
A zoomable interface is an attractive approach for presenting large graphs, as it enables a user to see
both the high-level structure of the entire graph as well as zoom in and navigate specific subsections in
detail. Other approaches for visualizing large networks incorporate “focus+context” techniques, which
allow the user to focus on some detail in the graph without losing the broader context. Examples of these
techniques include three-dimensional constructions such as a graph projected onto hyperbolic space [17],
DRAFT – PLEASE DO NOT DISTRIBUTE WITH PERMISSION
fisheye distortions [11], perspective-based information “walls” [20], and “cone trees” [25]. There is also a
distinction to be made between the geometric zooming of a system like Zoomgraph, Walrus [30], or Tulip
[1] and a semantic zooming system, in which the information content presented and level of detail changes
as the user navigates in and out of a graph (for a survey of these and other styles of graph visualization and
navigation, see [15]).
The use of ZUIs in computing dates back as far as Sutherland’s Sketchpad [27], by virtue of its use of
vector graphics rather than bitmaps. More recently, the Pad system and its descendants have explored the
use of zoomable interfaces for shared online workspaces, knowledge representation, and many other sorts of
information visualization applications. One such descendant, Piccolo, provides Java libraries and APIs for
developing zoomable interface applications, and is the foundation of the zooming features in Zoomgraph
(specifically we use a previous version called Jazz [5]). These systems aim to take advantage of our “natural
spatial and geographic ways of thinking” [4][23] to help us understand and navigate volumes of
information. The general design principle of these systems is that objects are placed in an infinite twodimensional plane and the user is able to navigate and interact freely in these two dimensions, as well as
zoom in for more detail or zoom out for a broader view of the space.
3. LANGUAGE FOR MANIPULATING AND EXPLORING GRAPHS
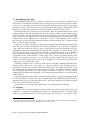
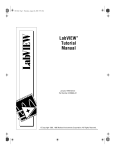
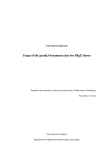
The Zoomgraph system, as illustrated in Figure 1, consists of a number of components. At the bottom
layer resides a SQL database which retains node and edge data. Zoomgraph’s DBServer transforms entries
in the database into renderable objects. These are passed through the main interpreter to a visualization/UI
component. The embedded interpreter processes the user commands (or scripts) to manipulate the
visualization and database as well as transfer information to and from other applications (such as R).
The Zoomgraph interpreter has been optimized to handle the concept of nodes and edges. While it was
possible to provide some functionality through existing languages this frequently forces the user to think of
graph elements as non-first order objects. For example, a system that represents graphs as matrices requires
edges to be addressed as an access to a two dimensional array where the index of desired nodes needs to be
looked up. Instead, Zoomgraph provides a more natural interface to these objects. An edge between the
node abc and def is simply ‘abc-def’ in the Zoomgraph language. If we would like to access the directed
edge between the two nodes (from abc to def) we can simply say ‘abc->def.’
Below we provide a few details on data representation within Zoomgraph setting the stage for a
discussion on how the language is used to manipulate node and edge properties, how scripting works, and
finally the built in support for grouping of nodes and edges into subgraphs.
3.1 Data Types and Database Representation
Zoomgraph objects are of two principal types, nodes and edges. A third type, subgraphs, function to
store groups of nodes, edges, and other subgraphs
nodedef> name VARCHAR(3)
and will be discussed in Section 3.4.
N1
Data in Zoomgraph is stored within a relational
database in two tables, one holding nodes and the
other edges. Tables contain a set of columns that
have significance to Zoomgraph (color, shape,
width, etc.) for visualization purposes as well as any
additional information the user supplied about the
nodes and edges. Each row (representing either a
node or an edge) is uniquely identified by an id field.
N2
edgedef> n1 VARCHAR(3), n2 VARCHAR(3)
N1,N2
Fig 2: A simple database definition containing 2
nodes and 1 edge.
DRAFT – PLEASE DO NOT DISTRIBUTE WITH PERMISSION
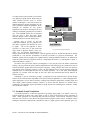
nodedef> name VARCHAR(32), SIZE DOUBLE,
COMPANYSIZE DOUBLE, CITY VARCHAR(32)
A,300,30,new york
B,100,10,san jose
C,200,20,san jose
edgedef> n1 VARCHAR(256),n2 VARCHAR(256),
COLOR VARCHAR(32) DEFAULT 'green', CALLS INT
DEFAULT 0
A,B,black,40
B,C,lightGray,30
Fig 3: A more complex graph definition and the visualization it produces
Rows are reconstituted by the DBServer into a Java object with most visual characteristics held in an object
field for caching purposes. Zoomgraph takes responsibility for maintaining consistency between the Java
object and the underlying database.
When creating a database users may opt to define the defaults or actual values for any of the visual
attributes of graph objects as well as any additional columns. At minimum, a node definition must contain
a name (can simply be a numerical identifier), and an edge must contain two endpoints corresponding to
defined nodes. A very simple graph definition file is illustrated in Figure 2.
This file represents a graph with two nodes, N1 and N2, and an undirected edge between them. The
nodedef and edgedef lines describe the schema for the input graph (represented in basic SQL). This
approach was selected because the connection between the file and the database is obvious. In the future we
may move to a format such as GraphML as it gains acceptance.
In the current instantiation, Zoomgraph is aware of the following visual properties:
•
For all objects the column vis (a bit) indicates if the object should be displayed, and color (a string)
represents the color of the object.
•
For nodes, the columns xloc and yloc (double values) indicate the x and y location of the node, fixed
(a bit) indicates if the node can be moved, size (a double) controls the size of the node, and shape
(an int) indicates the shape of the object from a set (currently circles and squares).
•
Edge properties include the width column (a double), and a directed column (an integer) indicating
the directionality of the edge (i.e. n1à n2, n1 ß n2, n1 ßà n2, or an undirected link, n1 – n2). A
weight column (a double) is also understood by Zoomgraph to indicate the value used for various
graph measures (shortest path, weighted betweenness, etc.). It is notable that self loops are
supported and are represented by listing the same node as the start and endpoint. Multiple edges
between two nodes are also supported.
Beyond these visual columns users may create whatever attributes they need. These may be of string,
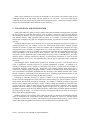
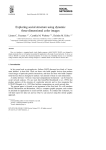
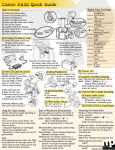
double, or any valid SQL type. Using these rules we can construct a more complex example (Figure 3)
representing a call graph for businesses in various cities. In this example, nodes sizes are declared by the
user and each node contains an additional string indicating the city that node (company) resides in and the
size of the company. Edges contain a color definition as well as an integer column representing the number
of calls between the nodes. The visualization of this example is illustrated in Figure 3.
DRAFT – PLEASE DO NOT DISTRIBUTE WITH PERMISSION
3.2 Manipulating the Graph
The Zoomgraph language provides a number of functions that take lists of primtive graph objects and
acts on them. For example, the command nodecolor is followed by a new color and a list of nodes. What is
critical to users is the ability to easily reference the variables representing nodes and edges and to quickly
generate sets of these. While in certain cases this is achievable in other languages, frequently the variable
naming rules or graph representation restrict the flexibility that we would like to expose to users.
In Zoomgraph there are two primary ways to select nodes. The first is to address them by name. In the
example in Figure 3 if the user wanted to change the color of nodes A and B to red, they could simply type
‘nodecolor red A,B.’ The other mechanism for node selection is through what is essentially a SQL WHERE
clause. To hide all nodes where the size is more than 10 and with the city ‘san jose’ (just node C in this
example) the user enters “hidenodes size > 10 AND city = ‘san jose’.” The interpreter is aware of which
type of selection is being used and automatically constructs a result set and acts on it. For both nodes and
edges ‘*’ means all objects of that type.
Edges can be accessed in a similar way. Edge names are simply the two end nodes with a dash between
them. The order of nodes is not important so the command “edgewidth 1 A-B’ is equivalent to ‘edgewidth
1 B-A’ (both set the width of the edge to 1 pixel). If more than one edge exists between the two nodes,
Zoomgraph assumes that all matching edges are the target of the command. To choose a specific edge in
this case a user may select an edge by its unique identifier. Although this example is for an undirected
graph, Zoomgraph supports directed edges. In this case an edge can be referenced by A->B, A<-B, or A<>B depending on the graph definition3. Finally, edges can be selected by specifying features of the
endpoints. For example, to change the color of all edges between companies with 100 employees and
companies with 200 employees (only one in the above example, B-C) a user would type ‘edgecolor blue
{companysize = 100}-{companysize = 200}.
Zoomgraph commands exist to control all visual aspects of the graph including background colors,
rendering quality, object colors, sizes, widths, etc. What view appears in the zoomable interface is
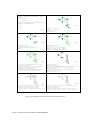
controlled by a camera which can also be manipulated by the language. For example, the command, ‘center
A,B’ will zoom and pan the display to fit nodes A and B in the screen. A full list of commands is available
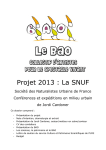
in the Zoomgraph user manual [1] but some examples are illustrated in Figure 4. For more complex
commands (beyond simple color manipulation), it is notable that optional parameters are grouped between
square brackets ‘[ ].’
Zoomgraph currently contains a number of simple layout algorithms. A spring based algorithm adapted
from the Java libraries, a random layout, circular, Kamada-Kawai, and Fruchterman-Reingold layouts (as
implemented by [25]), and a simple hierarchical layout. The layout commands can be applied to specific
sets of nodes, and will not act on fixed nodes.
Users wishing to save an image of the graph currently can create jpeg and SVG format files.
3.3 Scripting
Frequently users may wish to perform the same operation many times or multiple times with minor
modification. To support this, Zoomgraph allows users to save commands into a file. To support repeated
operation, the Zoomgraph includes a foreach statement which will iterate over a set of objects (nodes,
a
3
If an edge is defined to be bi-directional, say Aß à B, it can still be accessed by A->B in the Zoomgraph language.
Some further work is necessary to find if this makes semantic sense to users.
DRAFT – PLEASE DO NOT DISTRIBUTE WITH PERMISSION
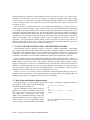
nodedef> name VARCHAR(256),XLOC DOUBLE,YLOC
DOUBLE,grp VARCHAR(30),size DOUBL E, shape
TINYINT
A,30,10,group1,2,1
…
E,50,55,group2,2,2
…
edgedef> n1 VARCHAR(256),n2 VAR CHAR(256),freq
INTEGER,width DOUBLE default 1
A,B,10,1
…
D,B,20,1
…
E,G,4,1
(a)
(b)
# center the display
center
# show the labels
labelnodes *
(c)
# hide some edges
hideedges B -E,B-F,F-G,E-G
# hide the disconnected nodes ( G)
hidedis
(d)
# show everything
showall
# color each group differently
nodecolor black grp = 'group1'
nodecolor lightGray grp = 'group2 '
(e)
# calculate the betweenness on each node
analysis betweenness *
# color each node based on the betweenness
score starting with light gray for low
betweenness and going to black
analysis colorize betweenness [linear=true,
startcolor=lightGray, endcolor=black ]
(f)
# hide some edges
hideedges A-B,B-D,C-B
# find the connected components (this generates two
subgraphs automatically, cc_A_3 and cc_A_4)
analysis concom
# color the nodes and edges of each subgraph
nodecolor black cc_A_3
edgecolor black cc_B_ 4
(g)
# color the edges based on the freq column
starting from white going to black
analysis colorize freq [linear=true,
startcolor=white, endcolor=black,table=edge s]
(h)
# reset the node and edge colors to light gray
nodecolor lightGray *
edgecolor lightGray *
# color the edges between the two groups black
edgecolor black {grp = 'group1'} -{grp = 'group2' }
Fig 4a-h: The application of various commands to the graph defined in (a).
DRAFT – PLEASE DO NOT DISTRIBUTE WITH PERMISSION
edges, or subgraphs) and perform a specific task. One simple application is to create an image file that
highlights specific nodes in a set.
1.
foreach nodeX *
2.
center {name = ‘nodeX’}-{*}
3.
nodecolor red nodeX
4.
savejpg nodeX.jpg
5.
nodecolor blue nodeX
In this example, line 1 tells Zoomgraph over which nodes to iterate (all). For each node in the set the
variable nodeX will be replaced by a specific node name. Line 2 causes the display to center on all edges to
and from nodeX. The color of nodeX is changed to red (line 3) and a jpeg image is saved of that view (line
4). Finally, the color of the node is returned to the original blue (line 5). For each loops may be nested to
support more complex behaviors.
Users may also utilize the ‘pause’ keyword followed by a number of milliseconds. This allows one to
automate visual analysis of a graph without worrying about the animation running too fast.
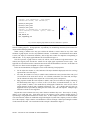
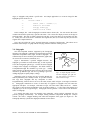
3.4 Subgraphs
One final important structure supported by the Zoomgraph
language is the subgraph. Subgraphs are hierarchically structured
objects that encapsulate nodes, edges, and other subgraphs. The
contained objects can be arbitrarily selected from the graphs (they
do not need to be connected, continuous, etc.).
Figure 5 demonstrates a possible subgraph structure. The
subgraph sgA contains two nodes and an edge, as well as pointers
to two other subgraphs sgB and sgC. Creation of such a subgraph
is simple in the language of Zoomgraph. The initial creation is
accomplished through the command ‘sg create sgA.’ Adding
nodes and edges is through the same selection criteria previously
described (‘sg addnodes sgA A,B’ and ‘sg addedges sgA A-B’).
Adding subgraphs is equally simple (‘addsg’).
sgA
Nodes
A
B
Edges
A-B
sgB
Nodes
D
E
sgC
Edges
D-E
Fig 5: A simple subgraph structure.
The three subgraphs, sgA, sgB, and
sgC, hold pointers to each other as
well as nodes and edges.
Subgraphs reside in memory and are accessible through the
name by which they were initially created. It is possible to delete
and copy these subgraphs and any component in them.
Programmatically, iterators allow us to access all nodes (A,B,D, and E in Figure 5) and edges (A-B and DE). Zoomgraphs commands are aware of when they are applied to subgraphs and will extract the
appropriate sub-object. For example, ‘colornodes red sgA’ will color nodes A,B,D, and E red. Similar
rules apply to edges and nested subgraphs can be accessed by adding a ‘.*’ to the name of the higher level
subgraph (sgA.* is the set sgB and sgC). Zoomgraph will also generate a visual convex hull around the
nodes of a subgraph.
It is notable that while users can manually create subgraphs, various analysis commands will also
generate groupings automatically. For example, finding connected components through the ‘analysis
concom’ will create a subgraph holding each connected component of the graph (see Figure 4f). The
Zoomgraph manual [1] details the subgraph commands in more detail.
DRAFT – PLEASE DO NOT DISTRIBUTE WITH PERMISSION
4. EXTENDED FEATURES
4.1 Graph States and Dynamic Layouts
One advantageous property of utilizing a database backend in the Zoomgraph system is that it allows us
to quickly switch betweem different graph properties. For example, in the study of communication patterns
in an organization it is valuable to be able to maintain data for different weeks in order to track changes in
communication patterns. Zoomgraph supports the saving and uploading of new tables to represent different
states and enables the smooth transition between them.
Through the command line users may save out the current graph state into a new table by typing
‘savestate state_name’ (where state_name can be any string). A state is restored by the command ‘loadstate
state_name’ which causes the graph to shift back to the previously stored configuration (colors, locations,
etc.). While powerful, this is not always consistent with the mental map model [22] as nodes can shift
dramatically between states. To handle this we have created the command morph which accepts a series of
state names and transitions between them over a configurable amount of time. Node and edge colors and
locations smoothly transition during this animation.
The user has a wide variety of “cinematographic” controls over the animations. Movies (in QuickTime
format) can be generated with control over the frames-per-second, the speed of the animation, node
highlighting, camera control, and how edges and nodes appear and disappear. We have found the last to be
critical for generating animations that are not too confusing. For example, certain layouts force
disconnected nodes to the periphery of the screen. As they are pulled back when they are connected long
edges fill the display making tracking nodes difficult. By offsetting the appearance (disappearance can be
similarly managed) of edges in the animation cycle edges no longer fill the screen but appear only as the
node reaches its final destination. Camera control further helps as the display can follow specific nodes as
they move or keep certain nodes or regions centered.
We have not currently addressed the issue of dynamic layouts in a unique way. There are many
powerful mechanisms for handling dynamic graphs [8] that may be appropriate by require further study.
We have opted to provide the simplest solution initially. A user may apply the layout algorithms previously
mentioned to a graph utilizing the current node positions as a starting point (rather than random). By using
an iterative layout algorithm such as the simple spring routine, the user may specify the amount of change
possible in the graph. Users may also fix certain nodes to anchor them.
Sample
animations
are
available
http://www.hpl.hp.com/shl/projects/graphs/movies.html.
on
the
Zoomgraph
page
at
4.2 Graph Analysis and R
As much as possible we have avoided re-implementing well known graph analysis algorithms. While
Zoomgraph does calculate certain basic statistics of the graph (clustering coefficient, density, etc), we have
opted to use the R system for various tasks. The RServe system [29] provides a Java based client library that
communicates with a running R system over TCP/IP. The system provides a great deal of flexibility in the
data that can be transmitted and received. Zoomgraph will convert a graph into an R matrix and transmit
the matrix to the R server. At present we use a number of hard-coded commands that perform specific
functions on the matrix and return the results. These are primarily centrality metrics (betweenness,
information centraility, closeness, etc.) which are available in R’s Social Network Analysis (SNA) library.
The results of these functions are folded back into the Zoomgraph table as new columns. Figure 4e
demonstrates the simple way in which such a result is used.
DRAFT – PLEASE DO NOT DISTRIBUTE WITH PERMISSION
While certain commands are hard-coded in Zoomgraph, we also provide users with the ability to pass
commands through to R and interact with the system as if it were local. Users may simply type R
commands and see the response directly inside the Zoomgraph interpreter. In the future we hope to further
integrate R and Zoomgraph to utilize functions such as clustering.
5. CONCULSIONS AND FUTURE WORK
While graph models are rapidly evolving to address many different domains and applications, frequently
the tools available to researchers have failed to evolve as quickly. These tools can be too broad, failing to
take advantage of attributes of specific graph types, or alternatively too narrow, making their application to
new domains difficult. Both approaches limit the ability of a researcher to perform exploratory data
analysis and visualization on graphs in a straightforward manner, as researchers are unable to model their
data fully.
Zoomgraph addresses this issue by allowing users to specify and manipulate the properties of graphs in a
natural and general way. For example, a user in the social network domain who is studying corporate
networks can construct a graph where nodes have attributes such as department and locations, and edges
with properties such as frequency of communication over e-mail, face-to-face, etc. Through Zoomgraph's
interactive language as well as a "zoomable" user interface the researcher may manipulate and explore the
visual representation of the graph based on these properties. They can, for example, display only edges
between two specific departments where communication frequency exceeds a certain threshold. In a totally
different context, a biologist studying the discovery of protein-protein interactions in yeast can specify
function categories on the nodes, and annotating edges with the type of experiment used to validate the
interaction.
The Zoomgraph system, implemented in portable Java, attempts to provide a set of functions that are
useful to applications requiring interactive (or scripted) manipulation of graphs. In addition to its
flexibility, Zoomgraph ensures usability by abstracting many details of graph layout and building on
conventional languages, particularly SQL. Beyond the novel zoomable interface which allows users to
easily traverse complex graphs, Zoomgraph includes a number of standard graph drawing algorithms as
well as hierarchical and dynamic algorithms that take advantage of the database backend of the system.
Beyond visualization, Zoomgraph provides analytical tools for generating graph and node statistics as well
as a mechanism for interactively utilizing the R statistical package.
Zoomgraph is continually evolving as it supports a number of our own internal graph based projects.
We have released Zoomgraph to the public and hope to continue making new versions available. There are
many features that one could envision for Zoomgraph. For example, it would be powerful to support the
ability to select complex paths from graph. Instead of simply finding edges between two connected nodes,
one may wish to list a chain of nodes with specific properties that should be connected. Other potential
additions include the ability to specify template objects and apply those to groups, the use of clustering
algorithms to generate groups based on different properties, and the ability to simulate dynamic information
(message passing) on graphs. As we observe the users of Zoomgraph and our own usage we also hope to
further refine the Zoomgraph language.
Building, managing, and visualizing large graphs and networks is a challenging and important problem,
which is evidenced by the proliferation of tools intended to address it. Even as it currently stands,
Zoomgraph, as a data-driven, zoomable, and statistical analysis-enabled software package, allows users to
explore many different applications and datasets with a minimal amount of transitional effort.
DRAFT – PLEASE DO NOT DISTRIBUTE WITH PERMISSION
6. AVAILABILITY
Zoomgraph (both binaries and sources) is available from our website at http://www.hpl.hp.com/shl/projects/graphs/
7. ACKNOWLEDGEMENTS
The authors would like to thank Bernardo Huberman, who has kindly allowed us to work on this project,
Lada Adamic, one of our first users, and the many implementers of the free software which we were able to
use in this system. These include the creators and developers of HSQLDB, RePast, Jazz, as well as Simon
Urbanek who kindly worked with us to get Rserve running.
REFERENCES
[1]
Adar,
E.,
and
J.R.
Tyler,
“Zoomgraph
http://www.hpl.hp.com/shl/projects/graphs/doc/zg-manual.htm
version
0.2
manual,”
[2]
Auber, D., “Tulip", Proceedings of GD’01, Springer-Verlag, Lecture Notes in Computer Science,
vol. 2265, 2000.
[3]
Batagelj, V., and A. Mrvar, “Pajek – Program for Large Analysis,” Connections, 21:47-47, 1998.
[4]
Bederson, B.B., and J.D. Hollan, “Pad++: A Zooming Graphical Interface for Exploring Alternate
Interface Physics,” UIST '94, Marina del Ray, CA, Nov. 2-4, 1994.
[5]
Bederson, B.B., J. Meyer, and L. Good, “Jazz: An Extensible Zoomable User Interface Graphics
Toolkit in Java,” UIST 2000, San Diego, CA, 2000.
[6]
Brandes, U., M. Eiglsperger, I. Herman, M. Himsolt, and Marshall M.S., “GraphML Progress
Report,” Proceedings of GD’01, Springer-Verlag, Lecture Notes in Computer Science, vol. 2265, 2001.
[7]
Brandes, U., and D. Wagner, “visone – Analysis and Visualization of Social Networks,”
Mathematics & Visualization, M. Junger and P. Mutzel (eds.), Springer-Verlag, to appear. Perlin, K and
D. Fox, “Pad - An Alternative Approach to the Computer Interface,” ACM SIGGRAPH '93, New York,
NY, 1993.
[8]
Branke, J., “Dynamic Graph Drawing,” Graph Drawing – Models and Algorithms, M Kaufmann
and D. Wager (eds.), Springer, 2002, pp. 228-246.
[9]
Borgatti, S., “NetDraw 1,” Analytic Technologies, http://www.analytictech.com/downloadnd.htm
[10] Borgatti, S., M.G.Everett,
http://www.analytictech.com
and
L.C.
Freeman,
UCINET,
Analytic
Technologies,
[11] Furnas, G., “Generalized fisheye views,” In Proceedings of the ACM Conference on Human
Factors in Computer Systems, Boston, MA, April 1986.
[12] Gansner, E.R., and S.C. North, “An open visualization system and its applications to software
engineering,” Software – Practice and Experience, 30(11):1203-1233, 2000.
[13]
Graph Foundation Classes for Java, IBM, 1999, http://www.alphaworks.ibm.com/tech/gfc
[14] Güting, R.H. “GraphDB: Modeling and Querying Graphs in Databases,” VLDB ’94, Santiago De
Chile, Chile, Sep. 12-15, 1994.
[15]
Herman, I., G. Melancon, and M. S. Marshall, “Graph Visualization and Navigation in
Information Visualization: A Survey,” IEEE Transactions on Visualization and Computer Graphics,
6(1):24-43, 2000.
DRAFT – PLEASE DO NOT DISTRIBUTE WITH PERMISSION
[16] Himsolt, M., “GML: A
passau.de/Graphlet/GML/gml-tr.html
Portable
Graph
File
Format,”
http://www.infosun.fmi.uni-
[17] Lamping, J., and R. Rao, "The Hyperbolic Browser: A Focus+context Technique for Visualizing
Large Hierarchies", Journal of Visual Languages and Computing, 7(1): 33-55, 1996.
[18] The LibSea Graph File Format
http://www.caida.org/tools/visualization/libsea/
[19]
1995
and
Java
Graph
Library,
CAIDA,
2003,
Krackhardt, D., J. Blythe, and C. McGrath, “KrackPlot 3.0 User’s Manual” Analytic Techologies,
[20] Mackinlay, J.D., G. G. Robertson, and S. K. Card, “The perspective wall: Detail and context
smoothly integrated” CHI ‘91, New Orleans, LA, 1991.
[21] Marshall, M.S., I. Herman, and G. Malancon, “An object-oriented design for graph visualization,”
2000, CWI Technical Report, INS-R0001.
[22] Misue, K., P. Eades, W. Lai, and K. Sugiyama, “Layout Adjustment and the Mental Map,” Journal
of Visual Languages and Computing, 6(2):183-210, 1995.
[23] Morse, A., “Some principles for the effective display of data,” International Conference on
Computer Graphics and Interactive Techniques, Chicago, IL, 1979.
[24]
NetMiner, Cyram Co. Ltd., 2003, http://www.netminer.com
[25]
RePast, 2003, http://repast.sourceforge.net
[26] Robertson, G.G., J.D. Mackinlay, and S.K. Card, “Cone Trees: animated 3D visualizations of
hierarchical information,” CHI ‘91, New Orleans, LA, 1991.
[27] Sutherland, I., “Sketchpad: A man-machine graphical communication system,” IFIPS Proceedings
of the Spring Joint Computer Conference, Detroit, Michigan, January 1963.
[28] Swayne, D.F., B. Andreas, and D.T. Lang, “Exploratory Visual Analysis of Graphs in GGobi,”
Workshop on Distributed Statistical Computing (DSC 2003), Vienna, Austria, March 20-22, 2003.
[29] Urbanek, S., “Rserve – A Fast Way to Provide R Functionality to Applications,” Workshop on
Distributed Statistical Computing (DSC 2003), Vienna, Austria, March 20-22, 2003.
[30] The
Walrus
Graph
Visualization
http://www.caida.org/tools/visualization/walrus/
Tool,
CAIDA,
2003,
[31] Winter, A., B. Kullbach, and V. Riediger, “An Overview of the GXL Graph Exchange Language,”
Software Visualization, S. Diehl (ed.), Springer-Verlag, 2001.
[32]
yWorks, 2003, http://www.yworks.de/
DRAFT – PLEASE DO NOT DISTRIBUTE WITH PERMISSION