1
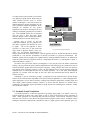
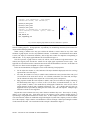
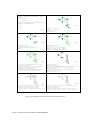
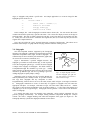
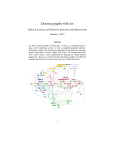
fisheye distortions [11], perspective-based information “walls” [20], and “cone trees” [25]. There is also a
distinction to be made between the geometric zooming of a system like Zoomgraph, Walrus [30], or Tulip
[1] and a semantic zooming system, in which the information content presented and level of detail changes
as the user navigates in and out of a graph (for a survey of these and other styles of graph visualization and
navigation, see [15]).
The use of ZUIs in computing dates back as far as Sutherland’s Sketchpad [27], by virtue of its use of
vector graphics rather than bitmaps. More recently, the Pad system and its descendants have explored the
use of zoomable interfaces for shared online workspaces, knowledge representation, and many other sorts of
information visualization applications. One such descendant, Piccolo, provides Java libraries and APIs for
developing zoomable interface applications, and is the foundation of the zooming features in Zoomgraph
(specifically we use a previous version called Jazz [5]). These systems aim to take advantage of our “natural
spatial and geographic ways of thinking” [4][23] to help us understand and navigate volumes of
information. The general design principle of these systems is that objects are placed in an infinite twodimensional plane and the user is able to navigate and interact freely in these two dimensions, as well as
zoom in for more detail or zoom out for a broader view of the space.
3. LANGUAGE FOR MANIPULATING AND EXPLORING GRAPHS
The Zoomgraph system, as illustrated in Figure 1, consists of a number of components. At the bottom
layer resides a SQL database which retains node and edge data. Zoomgraph’s DBServer transforms entries
in the database into renderable objects. These are passed through the main interpreter to a visualization/UI
component. The embedded interpreter processes the user commands (or scripts) to manipulate the
visualization and database as well as transfer information to and from other applications (such as R).
The Zoomgraph interpreter has been optimized to handle the concept of nodes and edges. While it was
possible to provide some functionality through existing languages this frequently forces the user to think of
graph elements as non-first order objects. For example, a system that represents graphs as matrices requires
edges to be addressed as an access to a two dimensional array where the index of desired nodes needs to be
looked up. Instead, Zoomgraph provides a more natural interface to these objects. An edge between the
node abc and def is simply ‘abc-def’ in the Zoomgraph language. If we would like to access the directed
edge between the two nodes (from abc to def) we can simply say ‘abc->def.’
Below we provide a few details on data representation within Zoomgraph setting the stage for a
discussion on how the language is used to manipulate node and edge properties, how scripting works, and
finally the built in support for grouping of nodes and edges into subgraphs.
3.1 Data Types and Database Representation
Zoomgraph objects are of two principal types, nodes and edges. A third type, subgraphs, function to
store groups of nodes, edges, and other subgraphs
nodedef> name VARCHAR(3)
and will be discussed in Section 3.4.
N1
Data in Zoomgraph is stored within a relational
database in two tables, one holding nodes and the
other edges. Tables contain a set of columns that
have significance to Zoomgraph (color, shape,
width, etc.) for visualization purposes as well as any
additional information the user supplied about the
nodes and edges. Each row (representing either a
node or an edge) is uniquely identified by an id field.
N2
edgedef> n1 VARCHAR(3), n2 VARCHAR(3)
N1,N2
Fig 2: A simple database definition containing 2
nodes and 1 edge.
DRAFT – PLEASE DO NOT DISTRIBUTE WITH PERMISSION