1
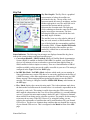
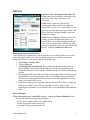
• Masks: Displays the current PDOP and HDOP mask values as configured in the
Masks section of the GPS page. If the measured Dilution of Precision (DOP) value
exceeds the value set for the corresponding mask, the resulting calculated position
will be ignored. In general, as the value of the DOP decreases, the accuracy of the
GPS position increases. DOP values greater than six usually indicate the GPS
position data is of poor quality (due to poor satellite geometry) and the resulting
positions are less accurate. NOTE: DOPs can not be displayed in Binary Mode,
however, the DOP masks are still in effect.
Satellite Icons
• Unused: A GPS satellite whose signal is being received, but not being used for
position calculations.
• Used: A GPS satellite that is being used to calculate your current position.
• SBAS: A Satellite Based Augmentation System (SBAS) satellite, which can be used
for error corrections. (See the DGPS page for more information.)
Leave SNR trails: Creates a dot on the screen for all previous satellite positions that
form a trail on the sky plot over time as the satellite moves across the sky.
DOPs Bar Graph: displays the various Dilution of Precision (DOP) values as explained
below. DOPs are not displayed when SiRF Binary is selected on the GPS page.
• PDOP: displays the Position Dilution of Precision, which is a combination of
HDOP, VDOP and Time Dilution of Precision. It will always be larger than HDOP
and VDOP.
• HDOP: displays the Horizontal Dilution of Precision, which is a measure of the
calculated accuracy of the solution. DOP has no units and lower numbers indicate
better solution geometry. In general, the lower the DOP value, the better confidence
you have in the position reading from your Nomad GPS receiver.
• VDOP: displays the Vertical Dilution of Precision, which is a measure of the
calculated elevation.
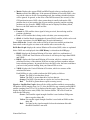
Each DOP bar is color coded to indicate the DOP quality as follows:
Green: The DOP is less than three (best).
Yellow: The DOP is greater than three, but less than six.
Orange: The DOP is greater than or equal to six, but less than twenty.
Red: The DOP is greater than or equal to twenty (worst).
Signal vs. Satellite Bar Graph: shows all the visible satellites and their corresponding
ID numbers (PRN) ranging from 1 to 32. Also, the PRN for any currently tracked SBAS
satellite (ranging from 122 to 138) is displayed in this graph. Tapping any bar will also
display the signal to noise ratio (SNR) value for that satellite. The color of each bar
indicates the following:
Green: Good satellite signal strength. Satellite is used with an SNR greater
than or equal to thirty dB.
Yellow: Fair satellite signal strength. Satellite is used with an SNR less than
thirty dB.
Red: No signal or the signal strength is below the minimum allowable
threshold. Satellite is not used.
Nomad SatViewer
6