1
1
TrichoSciencePro ©
Professional hair and scalp diagnostic software
USER MANUAL
How to install, use and administer TrichoSciencePro©
software.
The information in this document is subject to change without notice and should not be
construed as a commitment by TRILOGIC, LLC. TRILOGIC, LLC assumes no
responsibility for any errors that may appear in this manual. This document or any part
thereof may not be reproduced in any form without the written permission of
TRILOGIC, LLC. TrichoSciencePro © logo and marks are the property of TRILOGIC,
LLC or a related company. All rights reserved. Copyright 2015.
www.TrichoSciencePro.com
2
Table of Contents.
• Table of Contents:
•
Chapter 1. TrichoSciencePro © software installation .
6
•
1.1 Personal computer hardware, other software and network requirements.
6
•
Chapter 2. Introduction to “Program Manager” interface. “Patients” module. 6
•
2.1 Patient data management and transfer to another computer.
7
•
Chapter 3. “Trichoscopy” module.
9
•
•
•
3.1 Getting started. Image acquirement.
3.2 “Select video capture device” function.
3.3 Scaling settings based on Diagnosis Scope magnification.
9
10
10
•
Chapter 4. Hair density and diameter measurements and calculations.
Follicular unit counts.
11
•
•
•
•
•
•
•
•
•
•
•
4.1 Hair density and diameter measurements and calculations using first method.
4.2 Hair density and diameter measurements and calculations using second method.
4.3 Hair density measurements and calculations using third method.
4.4 Follicular unit counts.
4.5 “Perifollicular sign” function.
4.6 “Chart” function
4.7 “Point localization” function.
4.8 “Choose frame” function.
4.9 “Hair length” function.
4.10 “Marker” function.
4.11 “Information” function.
12
13
14
14
15
14
15
15
16
16
16
•
Chapter 5. Special functions for hair density and diameter calculations.
17
•
•
•
5.1 “Select area” function.
5.2 “Sync windows” function.
.
5.3 “Terminal/Vellus hair diameter threshold” function.
17
18
18
•
Chapter 6. Hair diameter measurements and calculations.
20
•
•
•
6.1 Hair diameter measurements and calculations, using first method.
6.2 Hair diameter measurements and calculations, using second method.
6.3 Chart function.
20
21
22
•
•
•
Chapter 7. Scalp analysis.
Chapter 8. Hair roots analysis.
Chapter 9. Hair shafts analysis.
24
26
27
www.TrichoSciencePro.com
3
Table of Contents.
•
•
•
•
Chapter 10. Generating conclusion .
Chapter 11. Ending diagnostic session. “Performed Trichoscopies” module.
Chapter 12. “Express Trichoscopy” module.
Chapter 13. “Phototrichogram” module.
•
•
•
•
•
•
•
•
•
•
•
•
•
•
•
13.1 Getting started. Image acquirement.
31
13.2 Phototrichogram analysis.
31
13.3 Phototrichogram calculation, using first method with automatic detection.
32
13.4 Phototrichogram calculation, using second method with semiautomatic detection.
33
13.5 Phototrichogram calculation, using third method with manual detection and diameter
auto-measurement mode.
34
13.6 Phototrichogram calculation, using forth method with manual detection.
35
13.7 “Density correction” function
35
13.8 Follicular unit counts.
35
13.9 “Perifollicular sign” function.
36
13.10 “Chart” function.
36
13.11 “Information” function.
37
13.12 Hair growth rate calculations.
37
13.13 “Anagen/Telogen hair diameter threshold” function.
38
13.14 “Terminal/Vellus hair diameter threshold” function.
38
13.15 Ending session. Generating conclusion. “Performed Phototrichograms” module.
39
•
Chapter 14. “Trichogram” module.
41
•
•
14.1 Conducting the “Trichogram” session.
14.2 Ending session. Generating conclusion. “Performed Trichograms” module.
41
42
•
Chapter 15. “Dermatoscopy” module.
43
•
•
15.1 Conducting the “Dermatoscopy” session.
15.2 Ending session. Generating conclusion. “Performed Dermatoscopies” module.
44
45
•
Chapter 16. “Hair calculator” module. “Trichometry” functions.
47
•
•
16.1 “Trichometry” function (hair wash test).
16.2 “Trichometry” function (growing hair test).
47
48
•
•
Chapter 17. “Hospital anxiety and depression scale” module.
Chapter 18. “Additional studies” module. Global photograph study.
49
50
•
•
18.1 Conducting the “Additional Studies” session.
18.2 Ending session. Generating conclusion. “Performed Additional Studies” module.
50
51
•
Chapter 19. “Conclusions and Recommendations” module.
52
www.TrichoSciencePro.com
28
29
30
30
4
Table of Contents.
•
•
19.1 Conducting the “Conclusions and Recommendations” session
19.2 Ending session. “Performed “Conclusions and Recommendations” module
52
52
•
•
Chapter 20. “Automatic conclusion” function.
Chapter 21. “Summary report” function.
54
55
•
21.1“Set template for report” function
56
www.TrichoSciencePro.com
5
Chapter 1. TrichoSciencePro©
software installation.
•
Chapter 1. TrichoSciencePro © software installation.
•
Depending on purchased version, TrichoSciencePro© software supply differs and is specified
in attached Installation Manager utility tool. Refer to it for your Program version installation
and online registration instructions for step-by-step guidance through the entire process. It also
links to Program general overview and this user manuals, as well as your Diagnosis Scope
setup and instructions. For additional support refer to http://TrichoSciencePro.com.
•
1.1 Personal computer hardware, other software and network requirements.
•
•
•
•
PC: at least 1.4GHz, 1GB of RAM, 20GB HDD, Full HD screen, 3 USB 2.0 ports;
Operating system: Win 7; 8; 10
Other software: MS Word , Acrobat Reader;
Internet connection for online registration to complete setup and to access reference materials.
•
ATTENTION! Before beginning to work with the TrichoSciencePro© software, connect your
Diagnosis Scope, e.g. TrichoScope, DermoScope, VideoDermoScope, MicroCamera, etc., to
your computer and set its drivers. Configure scaling according to the selection of your
Diagnosis Scope magnifications. Proper scale settings should be established for software
modules: “Trichoscopy” and “Express Trichoscopy” (primarily for “Hair Density” and
“Hair diameter” windows), also “Phototrichogram”, “Trichogram” and “Dermatoscopy”.
By default Program may be configured to various lower magnification settings for “Hair
density” sections of “Trichoscopy” and “Express Trichoscopy” sessions, as well as for
“Phototrichogram”, “Trichogram” and “Dermatoscopy” sessions. Same as for default
settings for higher magnifications for “Hair diameter” sections of “Trichoscopy” and
“Express Trichoscopy” sessions. Refer to paragraph 3.3 “Scaling settings based on
Diagnosis Scope magnification” for settings verification and additional setup information.
•
Chapter 2. Introduction to “Program Manager” interface. Patients module.
•
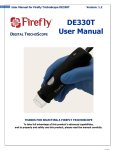
After TrichoSciencePro© software is installed and registered open the program by double
clicking on the icon generated on your computer desktop. This action will take you to
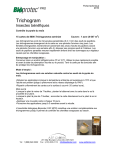
“Program Manager” (Fig.1), which is the main interface for all Software functions. To start
with a new patient/client click the "New patient" button (1.1). In the opened “Add patient”
table (1.2) enter name, select for sex and appropriate racial variation of patient's hair. Confirm
your entry by pressing “OK” or choose “Cancel” to exit. Next step is to fill out the Outpatient
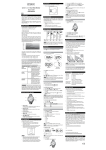
card. Click on "Outpatient card" button (1.3) and fill in all its graphs (2.0, Fig.2). The
accuracy and extent of information provided in “Outpatient card”, its “Questionnaire” part
(2.5) primarily, affects the objectivity of the “Automatic Conclusion” module (1.29, Fig.1).
Profile picture for patient can be taken by camera (2.2) or downloaded from file (2.3). After
entering patient’s weight and height data, the body mass index “BMI” (2.4) will be calculated
automatically. Underweight BMI value will be shown in blue color, overweight in red. After
the “Outpatient card” data is filled out, click to “Save” (2.6), “Cancel” (2.7), “Print” (2.8),
checkmark to add to summary report (2.9). Click “Additional files” (2.10) to open patient’s
www.TrichoSciencePro.com
6
Chapter 2. Introduction to “Program
Manager” interface. “Patients” module.
personal cabinet, also accessible from “Additional Studies” folder on the desktop, to manage
any additionally imported independent patient’s data, like blood work, etc. Patient’s sensitive
and confidential information may be protected by password in separate MS Word file. Click
“Additional information” (2.11), to enter it in pop-up window (2.12), then “Save” (2.13) to
open the file! If “Cancel” (2.14) button used, additional information file will not be under
password protection! This module also contains separate “Journal (Course of disease,
prescriptions, analysis)” section (2.1) to record any applicable data.
•
NOTE: Completion of the “Outpatient card” module (1.3, Fig.1) is not mandatory and may
be partially or completelly disregarded by user.
•
When finished entering new patient data, you may proceed with diagnostic sessions by
pressing “Trichoscopy” (1.20), “Phototrichogram” (1.21), “Trichogram” (1.22) or
“Dermatoscopy” (1.23) buttons and, accordingly, completing the selected program module.
Other studies that can be conducted for patient evaluation include semiautomatic “Hair
calculator” (1.24), “Hospital Anxiety and Depression Scale” (1.25) and “Additional
studies” (1.26) modules. The separate “Express Trichoscopy” module (1.27) of the program
is dedicated for express diagnostic Trichoscopy sessions to be performed when time devoted
to each session is limited. The “Conclusions and Recommendations" module (1.28) is
intended for entering patient’s provisional diagnosis and recommended treatment plan,
including diagnostic tests, general, topical and physiotherapy. The “Automatic conclusion”
(1.29) module automatically generates a report based on patient data analysis gathered in
previous modules. The “Summary report” (1.30) module allows generation of an extended
“all-in-one” patient report based on user selections. The “Set template for report” function
(1.31) allows customization of report print-outs per specific requirements. The “Select video
capture device” function (1.19) allows selection of used Diagnosis Scope video input to the
program when more computer video inputs are present.
•
For returning patients with previously saved diagnostic sessions, select patient’s name from
the list in the "Patients" directory (1.4) and initiate new diagnostic sessions, studies, etc., as
indicated above. To see results of previous patient visits select the date of the previous visit in
one of the performed diagnostic session windows. Those are “Performed Trichoscopies”
(1.5), "Performed Phototrichograms" (1.6), “Performed Trichograms” (1.7),
"Performed Dermatoscopies" (1.8), “Performed Additional Studies" (1.9) and
“Performed Conclusions and Recommendations" (1.10). Depending on what data has to
be viewed, specific diagnostic session or generated for this session report, click on "Load
session" button (1.17) or "Show report" button (1.18).
•
2.1 Patient data management and transfer to another computer.
•
To search patients by the date of previous visit, use the "Search" button (1.11) after entering
the date of this visit. To return back to the list of patients click "All sessions" button (1.12).
Functions “Save archive copy of database” (1.13) and “Restore database from archive”
(1.14) are needed to save and transfer customer database in cases when TrichoSciencePro©
software installation or transfer to another PC is required. Use the first button to save all data
•
www.TrichoSciencePro.com
7
Chapter 2. Introduction to “Program
Manager” interface. “Patients” module.
to file. After the Software is installed to another PC, move the saved database file to this
PC and click the second button to restore the patients database for the new program. The
"Patient’s Name" button (1.15) is used to sort patients in alphabetical order, the “Date”
button (1.16) to sort by date. To remove unnecessary sessions select the patient's name from
the database by left-clicking the mouse (while holding down “Ctrl” key you can select names
in random order, if holding down “Shift” key you can select names in subsequent
order). When finished, place the cursor within highlighted name(s) and press the right mouse
button. From the resulting query select "Delete", “Rename” and “Find” patient in the list,
as well as “New Patient”, “Outpatient card”, “Additional Information” or “Save patient
list to MS Word” prompts (1.32). Another important “Save to file” function (1.33) allows to
save into separate file any patient’s diagnostic session(s) in order to move data to another
computer, accordingly, use “Download from file” function (1.34) to upload data into
program from any file previously saved this way.
1.16
1.15
1.5
1.18
1.17
1.32
1.6
1.18
1.17
1.33
1.34
1.17
1.4
1.17
1.17
1.7
1.18
1.8
1.18
1.9
1.18
1.18
1.17
1.2
1.10
1.20
1.21
1.22
1.23
1.24
1.25
1.26
1.27
1.28
1.29
1.30
1.31
1.19
1.13
1.14
1.3
1.1
Fig. 1
1.11
1.12
www.TrichoSciencePro.com
1.12
8
Chapter 2. Introduction to “Program
Manager” interface. “Patients” module.
2.0
2.1
2.2
2.3
2.6
2.7
2.8
2.9
2.10
2.11
2.4
2.5
2.13
2.14
2.12
Fig. 2
•
Chapter 3. “Trichoscopy” module.
•
After entering “New patient” (1.1) primary information (1.2) and filling out the “Outpatient
card” data (1.3), in order to proceed with the diagnostic session, click "Trichoscopy” module
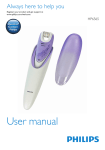
button (1.20, Fig.1). Each standard “Trichoscopy” (3.0, Fig. 3) diagnostic session shall be
comprised of “Hair density” (3.1), “Hair diameter” (3.2), “Scalp analysis” (3.3), “Hair
roots analysis” (3.4), “Hair shafts analysis” (3.5) section steps and “Conclusion/Print
results” (3.6) completion.
•
3.1 Getting started. Image acquirement.
•
Click on the first "Hair density" button (3.1) and press the "Scan" icon (3.8) for the right
image window. The “Image capture” window (3.10) will open. Place the Diagnosis Scope
www.TrichoSciencePro.com
9
Chapter 3. “Trichoscopy” module.
lens (optimally with magnification from x25 to x60) on chosen location of patient’s
Parietal area (Androgen-dependent zone) and position the mouse cursor within the “Image
capture” window (3.10), if a snapshot button on your Scope cannot be used. After good
quality image is obtained, lock it by pressing the left mouse button. Click “OK” button (3.11)
and the picture will appear in the window on the left, designated for Parietal area hair density
analysis. If locked image is not satisfactory, cancel it by pressing corresponding button
(3.12). Perform the same sequence of operations for the image window on the right to study
the Occipital area (Androgen-independent zone) of patient's scalp.
•
NOTE: Images of the scalp and hair can also be loaded from a file by pressing appropriate
icon (3.7). Any files to be uploaded into the program have to be located in the “Additional
studies” folder created by the Program on the desktop during installation. For convenient
data management, each new patient gets a personal subfolder created under the “Additional
studies” folder. Folder content can be previewed anytime by clicking the "Additional
studies” module button (1.26, Fig.1).
•
3.2 “Select video capture device” function.
•
If your computer is equipped with a built-in web camera, you may still be receiving its image
in the capture window when clicking the "Scan" icon (3.8) instead of an image from the
connected to computer Diagnosis Scope. Therefore, you have to disable webcam driver. To do
that, click on “Select video capture device” - button (1.19, Fig.1). You will be prompted to
select applicable Diagnosis Scope input. There is also another standard way to disable
webcam. Go to Control Panel, select Device Manager, then Imaging Device, right-click on
the webcam icon and select the “disable” option.
•
3.3 Scaling settings based on Diagnosis Scope magnification.
•
Since TrichoSciencePro© software allows to receive and process data in absolute units, e.g.
number of hairs per sq.cm, hair diameter in microns, etc., while optical equipment used may
have different magnification levels, setting a proper image acquisition scaling may be
necessary before conducting any diagnostic sessions. This setting must be properly adjusted
before conducting “Trichoscopy” (1.20), “Phototrichogram” (1.21), “Trichogram” (1.22),
“Dermatoscopy” (1.23) and Express Trichoscopy (1.27) sessions. By default Program may
be configured to magnifications from x25 to x60 for “hair density” section of “Trichoscopy”
and “Express Trichoscopy” sessions, as well as “Phototrichogram”, “Trichogram” and
“Dermatoscopy” sessions. The default settings for “hair diameter” sections of
“Trichoscopy” and “Express Trichoscopy” sessions may be configured from x100 to x200
magnifications. The following agenda describes how to change scaling settings:
•
Left-click the "Scope scaling" icon (3.9) in order to open the “Scope scaling” window
(3.13). In “Lens magnification” section (3.16) check the proper radio button corresponding
to your Diagnosis Scope magnification. The “Width of the image capture window value”
(3.14) will be adjusted accordingly. Confirm settings by clicking "Save" button (3.23). Now
your equipment is set to conduct diagnostic session. If you don’t know the magnification of
www.TrichoSciencePro.com
10
Chapter 3. “Trichoscopy” module.
equipment used or want to check the validity of claimed magnification, perform the setup
procedure using standard prototype scale. You will need a millimeter scale, or a picture with a
millimeter scale..After clicking the "Scope scaling" icon (3.9) and opening the “Scope
scaling” window (3.13), upload (3.19) a picture with a millimeter scale (3.21) or capture an
image of a scale bar (3.20) with your Diagnosis Scope camera. Scroll the reference scale with
the mouse cursor while holding down the left mouse button (3.22). For example, you captured
the scale length of 1 mm. Release the mouse button. You will be prompted: "Specify the
actual thickness of the standard". Click “OK” and enter into the box "Thickness of
prototype, mm” (3.18) reference value in millimeters (in this case 1 mm). Click "Save"
button (3.23). The value for “Width of the image capture window” (3.14) will be calculated
automatically, same as the corresponding value for “Lens magnification” (3.15) will be
established. In case of any error, or if measurement verification is desired, click “Cancel”
button (3.24).
•
ATTENTION: Any record from any window within Program can be removed or corrected by
allocating it with the right mouse button and confirming the request for deletion or correction.
3.2
3.0
3.1
3.3
3.7
3.4
3.5
3.6
3.13
3.8
3.14
3.15
3.9
3.16
3.17
3.19
3.10
3.18
3.20
3.21
3.22
3.11
3.12
3.23
3.24
Fig. 3
•
Chapter 4. Hair density and diameter measurements and calculations. Follicular
unit counts.
There are three different methods to calculate hair density, which differ by detection mode used semiautomatic and manual, including simultaneous automatic diameter measurements, as well as
just manual for quick density counts only. And there is also the additional method, advancing all
three of above by allowing to associate counted hairs with their distribution per follicular units.
www.TrichoSciencePro.com
11
Chapter 4. Hair density and diameter
measurements and calculations.
Follicular unit counts.
•
•
•
The first two methods are being used together mostly and efficiently compliment each other
to deliver quick and most complete assessment of hair density and their diameters, as well as
adding to it per user choice information on their distribution per follicular units and
perifollicular sign counts. Both methods allow to establish hair counts per sq.cm. with their
diameter measurements and calculations, including mean diameter of all of hairs; Terminal
and Velus hair counts; mean diameter of Terminal hairs only with a percentage of thin,
medium and thick hairs; coefficient of Anisotrichosis; etc.
The third method is just for density count with estimation of Terminal and Vellus hairs per sq.
cm, while disregarding their diameters (performed only in manual mode).
The separate follicular unit count method is not just another way of density calculations, it
actually compliments all three methods above and is designated to estimate the number of
both Terminal and Vellus hairs per sq. cm. per their distribution in the follicular units.
•
NOTE: To make it more convenient and accurate, when counting hairs in the left image
window for Parietal area, the size of this window can be increased. To do this, grab and drag
with the mouse the separating border between windows. To make left window larger drag it to
the right ("Movable border" 4.20, Fig.4). Respectively, when counting hairs in the right
window for Occipital area, increase the area of this window by moving the border to the left.
•
NOTE: For more accurate hair diameter measurements, as well as proper various types of
hairs and perifollicular signs determination, before starting hair count, zoom into image to
make it larger. To do this, click on the "Adjust scale" icon (4.21). Place the mouse cursor on
chosen image section and make one or more clicks with the left mouse button. Degree of
magnification for selected field of view depends on the number of mouse clicks. If it becomes
too high, click right mouse button to return to the previous step(s). The greater magnification
is being used, the higher accuracy will achieved for hair diameter diversity measurements. In
order to move to different magnified image section, click “Move” icon (4.22), then “grab and
drag”. To return the image to its original scale, click “Scaling per window size” icon (4.23).
•
ATTENTION: Anisotrichosis or Polymorphism - reflects the degree of deviation of measured
hair diameters from established average value. In initial stages of Alopecia Androgenetica,
the degree of Anisotrichosis is increasing. Later on, large number of Vellus hairs and "Yellow
dots" may reduce the severity of Anisotrichosis. However, by this time it is going to be
obvious, that two groups of hairs, thicker and thinning, will be present. The presence of some
minimal values of Anisotrichosis is typical for either patients without a progressive hair
thinning, or, on the contrary, in the final stages of Alopecia Androgenetica.
•
4.1 Hair density and diameter measurements and calculations, using first method
•
This is the most convenient and recommended way to simultaneously measure hair density
and their diameters. Also it is primarily useful in cases when Diagnosis Scope camera, used
for studies, does not have higher magnification capabilities for more precise hair diameter
measurements, or if there is no greater need to cross-verify these measurements.
For more accurate hair diameter measurements, increase the size of diagnostic window
(4.20) and magnify the image by adjusting scale (4.21), as described right above. Click on
•
www.TrichoSciencePro.com
12
Chapter 4. Hair density and diameter
measurements and calculations.
Follicular unit counts.
“Semiautomatic detection mode” icon (4.1). Cross with mouse cursor all hairs in a field of
view, either by one or in groups to count them with their diameters established automatically.
To do that, position cursor by measured hairs side, press down left button of the mouse and
cross with a line perpendicular to hair. You may extend this line to cross more neighboring
hairs. As long as the line remains perpendicular to hairs being crossed, their diameters will be
measured properly, while maintaining hair density count. When processed, all measured hairs
get marked up by two different color strips, either in red for Vellus, or green for Terminal. The
darker green color shows for more thick in diameter hairs. Perform measurements of all hairs
in given field of view. Only well contrasted hairs will be detected by this mode and not all of
their diameters might be measured correctly either. Some hairs in the field of view may not get
detected properly or at all, like very thin, or light shaded hairs and hairs, which get attached
side by side to neighboring hairs. In such cases, at line crossing hair is not getting any color
strip or its width is not corresponding to hair thickness. Corrections shall be done either by
using “Cancel” (4.24) function to take one or more steps back to correct measurements in
error, or by “Clear field” (4.10) function for groups of hairs in one area or by "Clear“ (4.9)
function to completely remove all previously performed actions. To complete hair density and
diameter measurements, proceed with using the second method with manual density detection
and diameter auto-measurement modes, described next in paragraph 4.2.
•
4.2 Hair density and diameter measurements and calculations, using second
method.
•
This is another method to simultaneously measure hair density and their diameters, mostly
used to complete first method measurements or used on its own when assessing hairs, that are
densely populated, thicker, curlier, growing in bunches, etc., especially in a darker shades. For
more accurate hair diameter measurements, increase the size of diagnostic window (4.20) and
magnify the image by adjusting scale (4.21), as described in paragraph 4. Click on “Manual
detection mode” icon (4.2) and press down “Diameter auto-measurement mode” icon (4.3)
to activate this function. Place the cursor closer to the base of the hair approximately in the
middle of the shaft, press and hold down the left mouse button, move the cursor along the
shaft. The length of the line drawn is not of an importance, it can take up any small area along
the hair shaft. Release the left mouse button. If the hair is still dark enough and well
contrasted, the line drawn along the hair shaft becomes thicker automatically, coinciding with
the thickness of the hair. If the automatic measurement is performed correctly, confirm the
completion of the measurement by clicking the left mouse button and proceed to the next hair
measurement. If the automatic measurement was carried out incorrectly, e.g. drawn line does
not thicken, goes beyond the diameter of the hair or vice versa, continue to measure hair
diameter manually. To do this, release the left mouse button and scroll the mouse wheel – the
line drawn along the hair shaft starts to thicken, if scrolled backwards - the line will become
thinner. When the thickness of the line becomes equal to the thickness of the hair shaft, click
the left mouse button to confirm the proper value of hair thickness measurement. Proceed to
the next hair measurement.
NOTE: If working without a mouse, perform mouse wheel operations described above using
"Slider" (4.13), located in the upper left corner of each window.
•
www.TrichoSciencePro.com
13
Chapter 4. Hair density and diameter
measurements and calculations.
Follicular unit counts.
•
ATTENTION: The automatic determination of hair diameter may not work properly in cases,
when hairs are too light; contrasted poorly in relation to surrounding tissues; ; hairs grow too
close to each other "in bunches"; image taken is not sharp; Scope’s resolution is too low, etc.
•
4.3 Hair density measurements and calculations using third method.
•
This method is mostly used when measuring only hair density, leaving their diameter
measurements for next Trichoscopy session “Hair diameter” section (7.00, Fig.7).
Click on “Manual detection mode” icon (4.2) ) and release “Diameter auto-measurement
mode” icon (4.3) to disable this function. Place the cursor closer to the base of the hair, press
and hold down mouse button and just move the cursor slightly along the shaft. Use the left
mouse button for Terminal hairs, and the right mouse button for Vellus hairs. The length of
the line drawn is not of any importance, it can take up any minimal area along the hair shaft.
Release the appropriate mouse button and click it again to confirm the detection. If doubtful
whether the hair is Terminal or Vellus, measure its diameter by scrolling the mouse
wheel as described in the second method. Also, if a hair is really thin and it turns quite
difficult to measure its thickness, magnify the image by increasing its scale, as described
above. After determining thickness of the hair and its state, proceed with hair density count.
•
•
4.4 Follicular unit counts.
•
This method compliments first three methods, described above, and supplements hair density
with or without diameter estimates in addition with hair distribution information in follicular
unit calculations (follicular unit is a group of adjacent growing hair).
Perform hair density/diameter measurements and calculations using previous methods. Then
click “Follicular unit count mode" icon (4.4). Place the cursor closer to the base of the hair
and press the left mouse button as many times, as there are hairs in a specific follicular unit,
mouse button clicks should be performed in quick successions. Program allows to estimate
for single, double, triple, as well as for separate follicular units with four and five hairs. The
chosen number of hairs will be displayed; in case of any mistake use “Cancel” icon (4.24) to
return to previous step or click right mouse button to start over.
•
•
4.5 “Perifollicular sign” function.
•
“Perifollicular sign” function (4.5) is designated to mark up and count “Exclamation mark
hairs”, “Pointed hairs”, “Broken hairs”, “Cadaverized hairs”, "Yellow dots", "Red
dots“, "White dots". Click the icon to open up perifollicular sign menu, select the
corresponding perifollicular sign and mark its location on the image by placing cursor on it
and clicking the left mouse button. The information on the number of perifollicular signs in
one or more fields of view will be provided on chart and saved into report. Perifollicular sign
presence may be quite critical for proper interpretation of obtained density counts. For
example, the sample image on Fig. 4 shows numerous “Yellow dots”, indicating the presence
of empty follicles, thus, the Anagen phase delay, which represents quite typical clinical
appearance for Alopecia Androgenetica. With treatment applied to achieve new hair growth
from these follicles, there is a possibility eventually to have more hairs and less “yellow dots”
www.TrichoSciencePro.com
14
Chapter 4. Hair density and diameter
measurements and calculations.
Follicular unit counts.
•
4.6 “Chart” function.
•
After counting all the hairs in the field of view, click the "Chart" icon (4.16) to open the
composite chart and data window. The density chart and data (4.26) on the left side are
representing measurement summary of the hair density. The diameter chart and data (4.27)
on the right side are representing measurement summary of hair diameters in case, if density
calculations were performed using the first method. If the second method was used, the right
side of the chart will stay empty. In this case, for diameter chart and corresponding data
information refer to next Trichoscopy session section (“Hair diameter”, 7.00, Fig.7) below.
The blue bar area on both charts represents the mean density and diameter for specified for
the patient racial type of hair. On the hair density chart on the left, yellow column represents
the total amount of hair per sq.cm, green column - the number of Terminal hair, red - the
number of Vellus hairs. On the hair diameter chart on the right, each measurement taken is
represented by a red column. If a lot of hair diameter measurements were performed, the red
curve will be displayed instead of separate columns. Single yellow column reflects the mean
diameter of Terminal hairs only (excluding all Vellus hairs). The chart window can be moved
across the monitor into any convenient location to allow for easy continuation of hair
measurements, if necessary. In order to move it, point to its title bar with the mouse cursor,
then left click and drag the window. In order to increase or decrease any window size in any
direction, point and drag any of its corners or borders. To save/delete charts to/from report,
check/uncheck "To report" checkbox (4.28), located in the bottom right of each chart.
•
•
4.7 “Point localization” function.
•
"Point localization" icon (4.18) opens "Point localization” table (4.29), to mark up specific
measurement points on the scalp diagram, where the hair counts have been performed. Click
“Localize” icon (4.30), place mouse cursor on any standard point marked with a red circle,
then, if necessary, move the cursor to the required location and left-click the mouse. This way
the coordinates of a measurement site on the scalp will be recorded. If a separate spot mark is
wanted, click on “New point marker” icon (4.31) and place a new mark at chosen location,
then proceed with its localization as above, if necessary. It is often important to memorize
measurement sites used during the session, since eventually it may be important to carry
out control measurements in same location during patient’s recurring visits. Right-clicking on
“Information” icon (4.32) allows by choosing “Add information” item from pop-up menu,
to add any additional information or comments to the diagram, select its font, move text by
grabbing it with the mouse, reset its position, if it was moved, and save changes on exit
•
4.8 “Choose frame” function.
•
"Choose frame" icon (4.19) allows to obtain additional image(s) for hair density calculations
in the new window(s) added "on top" of the previous one(s). These additional density
calculations in the added window(s) allow to significantly increase the reliability of the
measurements performed. All the results of hair density and diameter calculations obtained
from charts and reports for a given Parietal or Occipital area can be calculated as the mean
arithmetic value of all the measurements performed. To obtain mean arithmetic value of all
measurements in several windows added, click "Mean arithmetic value” icon (4.11).
www.TrichoSciencePro.com
15
Chapter 4. Hair density and diameter
measurements and calculations.
Follicular unit counts.
•
4.9 “Hair length” function.
•
“Hair length” icon (4.7 ) allows to perform linear length measurements of any growing hair
within the site. To do this place the cursor on the base of the hair, press and hold down either
mouse button, move the cursor along the shaft to the hair tip and release the button. The
actual value of hair length will be displayed in the top right corner of the image window.
Once the mouse button is released and the hair length is set, the actual measured hair length
value in millimeters will pop-up on the screen by the measurement site. To cancel the
performed measurement, quickly click once on either mouse button. For the performed
measurements accuracy always make sure “Scope scaling” function (4.17) is properly
configured in accordance with the applicable Diagnostic Scope magnification, for details
refer to paragraph 3.3 “Scaling settings based on Diagnostic Scope magnification” above.
•
4.10 “Marker” function.
•
"Marker" icon (4.6) allows to choose and mark up with different color markers any image
sections or details, which may be important to pay patient’s attention during the diagnostic
session. Select the desired color marker and circle an area or a subject of interest.
•
4.11 “Information” function.
•
For detailed information on the measurements performed within the image field of view, click
“Information” icon (4.12). The absolute number of measured hairs; density per sq.cm; total
amount of Terminal and Vellus hairs; hair diameters; thick, medium and thin Terminal hair
ratios; degree of Anisotrichosis – all this data will appear within image field. If several
measurement windows have been used, click "Mean arithmetic value” icon (4.11) to
obtain mean arithmetic value of all the measurements performed.
•
NOTE: In wanted to save the image into a separate picture file, click "Save" icon (4.14). You
will be prompted where to save the overall (full name, date) information or just the
information that is set to show in the field of image. Select the desired storage capacity and
click “OK” to confirm. The image can be also printed out by clicking “Print” icon (4.15).
•
NOTE: The information of the performed counts may be edited (amount of information
provided, font, changes or additions to the text). To make changes, place the cursor within
text area. Click the right mouse button. From pop-up menu select the desired item to make a
correction. If wanted to add own information, click "Add information"; "Choose fields"
allows to select what information you want to be displayed; "Reset position" is intended to
move information into its original location within the image, if the image scale was changed
or text has moved; “Select font” allows to choose displayed text appearance options.
•
NOTE: Results of any operations, performed while working with Program, are stored by
default in the final report. If you do not want to save results into report, uncheck "To report"
checkbox (4.25) in the lower right corner of the image window and/or the charts window
(4.28). Even if you choose not to save data into report, it does not mean, that this data is "lost"
after the session ends. All data obtained will be stored, if the session itself is saved.
www.TrichoSciencePro.com
16
Chapter 4. Hair density and diameter
measurements and calculations.
Follicular unit counts.
4.13
4.14
4.15
4.18
4.19
4.1
4.3
4.2
4.4
4.5
4.7
4.16
4.17
4.20
4.6
4.8
4.9
4.11
4.26
4.27
4.10
4.12
4.29
4.30
4.31
4.32
4.21
4.22
4.23
4.24
4.28
4.25
Fig. 4
•
Chapter 5. Special functions for hair density and diameter calculations.
•
Optional functions and settings for hair density and diameter calculations needed when
evaluating applied treatment dynamics or conducting any research, which requires hairs to be
calculated within a set size circle area with its center marked on the scalp with a tattoo, etc.
•
5.1 “Select area” function.
•
Click “Select rectangular area” icon (5.4, Fig.5) or “Select circle area” icon (5.5) and
scroll the mouse cursor to select the size of the area in form of a circle or rectangle/square to
be analyzed. To do this place the cursor in the starting point, press and hold down left mouse
button, move the cursor to the end point and release the button. The actual square size “S” of
selected rectangle in sq.mm or square size “S” in sq.mm and radius “R” in mm of selectable
circle will be displayed in the top right corner of the image window. Once the mouse button is
released and the area is set, the values “S” for rectangle or “S” and “R” for circle (5.9) will
be displayed in the image window bottom left corner, which by default is showing the actual
www.TrichoSciencePro.com
17
Chapter 5. Special functions for hair
density and diameter calculations.
square size “S” of original image obtained. To cancel the selected area, quickly click once the
right mouse button. For more convenient analysis you can enlarge the image by zooming into
it. To do this, click on the "Adjust scale" icon (5.6). Place the mouse cursor on the chosen
image section and make one or more clicks with the left mouse button. Degree of the
magnification for selected field of view depends on the number of mouse clicks. If it becomes
too high, click right mouse button to return to the previous step(s). The greater magnification
is used, the higher accuracy of hair density and diameter measurement is achieved. In order to
move to a different magnified image section click on “Move” icon (5.7), then grab and drag
it. To return the image to its original scale, click “Scaling per window size” icon (5.8).
•
ATTENTION: It is important to remember that anytime the area selection is performed, the
counting of any variables, i.e. hair density, diameter, follicular units, etc., shall be performed
only within the chosen site!
•
5.2 “Sync windows” function.
•
The "Sync windows" function may be required for the correct assessment of the performed
treatment dynamics when you need to compare two images taken in the same area before and
after the treatment. The "after treatment" image may be located asymmetrically (in relation to
image center), to the "before treatment" image. In this case, for correct comparison of the
results, it is necessary to place both images identically, so that they are not only
symmetrically arranged, but also displayed at the same angle. Load the "before treatment”
image into the left window and the “after treatment" image into the right. By clicking “Select
circle area” icon (5.5) choose identical size of the area in the form of a circle to be analyzed
on both images (see “Select area” function description above). For additional accuracy it is
preferable for the center of this circle to have a certain mark, e.g. tattoo. Next, clear the
surrounding field of view by clicking “Clear background” icon (5.3). Click "Sync windows
clockwise" icon (5.1) or "Sync windows counterclockwise" icon (5.2) in the left or in the
right window in order to position both images for comparison under the same angle. You can
now proceed with any calculations required.
•
5.3 “Terminal/Vellus hair diameter threshold” function.
•
When hair diameter is being evaluated together with hair density calculations, it is also
necessary to take into consideration the difference in hairs thickness to automatically sort
them into Terminal and Vellus accordingly. Generally, hairs with a diameter of less than 30-40
µm (micrometers or microns) are considered to be Vellus. By default the program autoconfigures the Threshold setting value for Terminal/Vellus hair, µm (5.10). When
calculating the hair density and diameter, depending on the mean diameter in the field of
view, the threshold will be set to one of three values - 30, 35 or 40µm (5.11). This function
changes dynamically, e.g., if in the field of view there are mostly thick Terminal hair present,
the threshold will be automatically set to the value of 40 microns; if the hair is mostly fine,
the threshold will be set to 30 microns; if there are various hair present, the threshold will be
changed to 35 microns. In case, when you want to set the threshold value on your own, you
www.TrichoSciencePro.com
18
Chapter 5. Special functions for hair
density and diameter calculations.
will have to turn off the automatic detection. To do it, right-click at the bottom of the window
on the “Threshold for Terminal/Vellus hair, µm” link (5.10). In the pop-up dialog box
uncheck the checkbox “Automatic threshold determination”. The link text color will
change to black. Enter the desired threshold value into “Threshold for Terminal/Vellus hair
actual value, µm” window (5.11). If the threshold has to be reset to automatic mode, rightclick on the “Threshold for Terminal/Vellus hair, µm” link (5.10) in black and in pop-up
prompt clear the checkbox “Automatic threshold determination”. The link text color will
change back to red, thus, indicating that threshold determination is being automatically
configured again.
•
NOTE: The threshold data above corresponds to the mean European/Caucasian hair
characteristics. For other racial variations of hair, automatic thresholds will be set according
to the selection in “Add patient” table (1.2, Fig.1).
5.1
5.2
5.3
5.4
5.5
5.6
5.7
5.8
5.9
5.10
5.11
5.12
Fig. 5
www.TrichoSciencePro.com
19
Chapter 6. Hair diameter
measurements and calculations.
•
Chapter 6. Hair diameter measurements and calculations.
•
Click on the second "Hair diameter" button (3.2, Fig.3) and press the "Scan" icon (6.2).
Capture window will open. Place the Diagnosis Scope lens (optimally with magnification
from x100 to x200) on the chosen location of patient’s Parietal area (Androgen-dependent
zone) and position the mouse cursor within image capture window, if a snapshot button on
your Scope cannot be used. After good quality image is obtained, lock it by pressing the
left mouse button. Click “OK” and the picture will appear in the left image window
designated for Parietal area. In the same sequence, perform the operation in the right image
window to study the second, normally Occipital area (Androgen- independent zone) of
patient's scalp. “Scope scaling” (6.4) shall be configured in advance in accordance with the
applicable Diagnostic Scope magnification, for details refer to paragraph 3.3 “Scaling
settings based on Diagnostic Scope magnification” above. There are two different ways to
calculate diameters of the hair.
•
NOTE: Images of the scalp and hair can be also uploaded from file by pressing appropriate
icon (6.1). Any files to be uploaded into the program shall be located in the “Additional
studies” folder created on the desktop during installation. For convenience of the patient’s
additional data management, every new patient entered into the program gets personal
subfolder created under this main folder. Folder content can be previewed anytime by
clicking "Additional studies” module button (1.26, Fig.1).
•
6.1 Hair diameter measurements and calculations using the first method.
•
Click on “Semiautomatic detection mode” icon (6.7). Cross with mouse cursor all hairs in a
field of view, either by one or in groups to count them with their diameters established
automatically. Only well contrasted hairs will be detected by this mode and not all of their
diameters might be measured correctly either. Corrections shall be done either by using
“Cancel” (6.14) function to take one or more steps back to correct measurements in error, or
by “Clear field” (6.11) function for groups of hairs in one area or "Clear“ (6.10) function to
completely remove all previously performed actions. Next, click “Manual detection mode”
icon (6.8) and press down “Diameter auto-measurement mode” icon (6.9) to activate this
function. Place the cursor closer to the base of the hair approximately in the middle of the
shaft, press and hold down the left mouse button, move the cursor along the shaft. The length
of the line drawn is not of an importance, it can take up any small area along the hair
shaft. Release the left mouse button. If the hair is still dark enough and well contrasted, the
line drawn along the hair shaft becomes thicker automatically, coinciding with the thickness
of hair. If the automatic measurement is performed correctly, confirm the completion of the
measurement by clicking the left mouse button and proceed to the next hair measurement. If
the automatic measurement was carried out incorrectly, e.g. drawn line does not thicken, goes
beyond the diameter of the hair or vice versa, continue to measure hair diameter manually. To
do this, release the left mouse button and scroll the mouse wheel – the line drawn along the
hair shaft starts to thicken, if scrolled backwards - the line will become thinner. When the
thickness of the line becomes equal to the thickness of the hair shaft, click the left mouse
button to confirm the proper value of hair thickness measurement. Proceed to the next hair
measurement.
www.TrichoSciencePro.com
20
Chapter 6. Hair diameter
measurements and calculations.
•
If working without a mouse, perform mouse wheel operations described above using
"Slider" (6.6), located in the upper left corner of each window.
•
NOTE: The semiautomatic detection mode and diameter auto-measurement mode may not
work properly in cases when hairs are too light; contrasted poorly in relation to surrounding
tissues; image taken is not sharp; hair grow too close to each other "in bunches"; etc. In such
cases, to avoid any errors, the program function of automatic measurement is being disabled
by default.
•
NOTE: If any error occurs during specific action, it can be consistently cancelled. To do this,
click "Cancel" icon (6.14). If you need to cancel any actions within selected area, press the
"Clear field" icon (6.11), then press down the left mouse button and draw with cursor an
area, where you want to cancel all the actions (trace the cursor over the information to be
removed in the direction from upper left side to lower right and down). Release the mouse
button. All actions within the encircled area will be removed. "Clear“ function (6.10) is used
to completely remove all previously performed actions.
•
6.2 Hair diameter measurements and calculations using the second method.
•
Click on “Manual detection mode” icon (6.8) and release “Diameter auto-measurement
mode” icon (6.9) to disable this function. Place mouse cursor on any selected hair edge, click
the right mouse button and drag the cursor across the width of hair to its other edge
perpendicular to the shaft. As cursor has been positioned on opposite edge, release the button.
The figure will appear displaying the performed measurement of the hair diameter in
microns. Proceed to the next hair diameter measurement.
•
NOTE: For detailed information on the measurements performed, click “Information” icon
(6.13). The absolute number of measured hair; total amount of Terminal and Vellus hair;
mean hair diameters; thick, medium and thin hair ratio; degree of Anisotrihosis data will
appear within image field. The information on counting results may be edited (amount of
information provided, font, changes or additions to the text). To make changes, place the
cursor within the text area. Click the right mouse button. From pop-up menu select the item
of interest and make the correction of the text. If you want to add your own information, click
"Add information“ prompt. "Select field" is intended to correct the amount of on-screen
information. "Reset field" is intended to move this information into its original location
within the image, if the image scale was changed or text has moved.
•
NOTE: "Choose frame" icon (6.5) allows to obtain additional image(s) for hair density
calculations in the new window(s) added "on top" of the previous one. These additional
diameter calculations in the additional windows may significantly increase the reliability of
measurements performed. All the results of hair diameter calculations on charts and in the
report for a given Parietal or Occipital area can be calculated as the mean arithmetic value of
all measurements. To obtain mean arithmetic value of all measurements in several windows
added, click "Mean arithmetic value” icon (6.12).
www.TrichoSciencePro.com
21
Chapter 6. Hair diameter
measurements and calculations.
•
6.3 “Chart” function.
•
After counting all the hairs in the field of view, click on "Chart" icon (6.3). The diameter
chart and data (6.16) represent measurement summary on hair diameters. The blue bar area
on the chart represents the average diameter for specified type of hair. On the hair diameter
chart each measurement shows as a red column. If a lot of hair diameter measurements were
performed, the red curve will be displayed instead of separate columns. Single yellow column
reflects mean diameter of Terminal hairs only (excluding all Vellus hairs). The chart window
can be moved across the monitor into any convenient location to allow easy continuation of
hair measurements, if necessary. To move it, point to its title bar with the mouse pointer, then
left click and drag the window. In order to increase or decrease window size in any direction,
point and drag any of its corners or borders. To save/delete charts into/from final report,
check /uncheck "To report" checkbox (6.17) located in the bottom right portion of the chart,
identically to all session data being saved by checking “To report” checkbox (6.19) in the
bottom of image window. If hair density and diameter measurements were performed in
several windows for different images by means of "Choose frame" icon (6.5), the chart will
reflect the arithmetic mean value of all the measurements in all the windows added.
•
NOTE: There are four racial hair variation types that are distinguished based on the
differences in their morphological characteristics: European/Caucasian, Latin/Mediterranean,
Asian/Pacific and African/Caribbean types. As it shows on charts, the boundaries of mean
density and diameter values for each hair will be different depending on specific hair
variation type. This fact is taken into account automatically when registering and introducing
patient's personal data into the program. The "Mean norm" is shown on the density and
diameter charts within blue bars as the gap between the two red lines. These “Mean norm”
boundaries may be adjusted per specialist’s decision. To accomplish this, grab red lines with
the cursor and drag them to desired location. To save changes right click with the mouse and
confirm "save settings" request.
•
NOTE: The threshold data above is corresponding to average European/Caucasian hair
characteristics. The program provides by default the auto-configuration for Threshold for
Terminal/Vellus hair (µm) (6.18) establishment, unless modified by user, for details see
paragraph 5.3 “Terminal/Vellus hair diameter threshold” function. above. For other racial
variations of hair automatic thresholds will be set according to the selection in “Add patient”
table (1.2, Fig.1).
•
NOTE: To make it more convenient and accurate, when counting hairs in the left image
window for Parietal area, the size of this window can be increased. To do this, grab and drag
with the mouse the separating "Movable border" (6.15) between windows. To make left
window larger drag it to the right. Respectively, when counting hairs in the right image
window for Occipital area, increase the area of this window by moving the border to the left.
•
NOTE: The settings and functions of all other not described icons are absolutely identical to
the “Hair density” diagnostic session (Fig.4 and Fig.5) and are respectively described in
Chapter 4 and Chapter 5 above.
www.TrichoSciencePro.com
22
Chapter 6. Hair diameter
measurements and calculations.
•
ATTENTION!: Pay attention to the average diameter of thick, medium and fine hair, percent
of Vellus hair and their ratio in the Parietal and Occipital areas. Vellus hair amount normally
should not exceed 15-20%. If this numbers are exceeded, it is an indication of the presence of
a pathological hair thinning. With “Yellow spots" present Vellus hair percentage starts to
decrease, since in such cases many hairs have really small diameter and are poorly visualized
or do not grow at all. Under normal conditions the thick hairs percentage is higher and,
respectively, the thin hairs percentage is smaller in Parietal area in comparison to Occipital
area. With the development of Androgen-dependent Alopecia this proportion starts to change
gradually.
ATTENTION: Any record from any window within this computer program can be removed
or corrected by allocating it with the right mouse button and confirming the request for
deletion or correction.
•
6.6
6.1
6.2
6.4
6.5
6.7
6.8
6.9
6.3
6.15
6.10
6.11
6.12
6.13
6.16
6.14
6.18
6.17
6.19
Fig. 6
www.TrichoSciencePro.com
23
Chapter 7. Scalp analysis.
•
Chapter 7. Scalp analysis.
•
Click on the third "Scalp analysis" button (3.3, Fig.3) and press the "Scan" icon (7.2).
Image capture window will open. Place the Diagnosis Scope lens on chosen location of
patient’s scalp and position the mouse cursor within image capture window, if a snapshot
button on your Scope cannot be used. After a good quality image is obtained, lock it by
pressing the left mouse button. Click “OK” and the picture will appear in the left window.
From the right window scrollable area representing diagnostic “Sample database” (7.16),
choose the diagnostic image that is most applicable to the current case. Place cursor on the
selected image and press the left mouse button. The selected image will appear in the right
window. The data will be saved into report by default. The report will contain obtained image
of the scalp and the diagnosis name from the heading of the chosen sample image on the
right. If you do not want to save results into the report, uncheck "To report" checkbox
(7.14) in the lower left corner of the image window.
•
NOTE: In order to add new diagnostic images to “Sample database” (7.16), place mouse
cursor over the image on the left and right-click. You will be prompted "Add image to Own
Base?” Release the button. The “Sample card” (7.17) will open. Type the name of diagnosis
in “Indicate diagnosis” field (7.18) and click “Save” (7.20) or “Cancel” (7.21). The image
will appear at the very bottom of the scroll bar. You can also upload more images by clicking
“Select image” (7.19). If necessary, you can edit images from the “Sample database”
(7.16.). To do this, place mouse cursor over the image in database and right click. From the
menu select an option - add, delete, change or move.
•
NOTE: Images of the scalp and hair can be also loaded from file by pressing appropriate
icon (7.1). Any files to be uploaded into the program have to be located in the “Additional
studies” folder created by the program during installation. For convenient data management,
each new patient gets a personal subfolder created under the “Additional studies” folder.
Folder content can be previewed anytime by clicking the "Additional studies” module
button (1.26, Fig.1).
•
NOTE: In case when it is necessary to save the image into a separate file, click "Save" icon
(7.3). The image can be also identically printed out by clicking “Print” icon (7.4).
•
NOTE: By means of "Point localization" icon (7.6) you can mark up specific measurement
points on patient’s scalp where the hair counts have been performed. You can utilize this
information for future reference. The steps are identical to 4.2 “Point localization” function
description above.
•
NOTE: By means of "Marker" icon (7.8), you can mark up with different color any image
sections, which may be important to pay attention to during the diagnostic session. Select
the desired color marker and circle an area or a subject of interest. Any mark ups on the
image can be deleted by using “Clear” icon (7.10).
•
NOTE: For more detailed view you can zoom into image to make it larger. To do this, click
on the "Adjust scale" icon (7.11). Place the mouse cursor on chosen image section and make
www.TrichoSciencePro.com
24
Chapter 7. Scalp analysis.
one or more clicks with the left mouse button. Degree of magnification for selected field of
view depends on the number of mouse clicks. If it becomes too high, click right mouse button
to return to previous step(s).The greater magnification is being used, the higher accuracy is
going to be achieved. In order to move to different magnified image section click on “Move”
icon (7.12), than grab and drag it. To return the image to its original scale, click “Scaling per
window size” icon (7.13). Also "Choose frame" icon (7.7) allows to obtain additional
image(s) in the new window(s) added "on top" of the previous one.
•
ATTENTION!: Before proceeding to diagnostic session, make sure “Scope scaling” function
(7.5) settings have been set according to paragraph 3.3. Scaling settings based on Diagnosis
Scope magnification above! The proper settings will directly affect the accuracy of “Linear
length” function (7.9), when measurements of any objects of interest are being performed. To
measure length, press and hold down either mouse button, then move the cursor to destination
and release the button. The actual linear measurement value in millimeters will be showing in
the top right corner of the image window, once the length is set, the final result will display
by the measurement site.
7.2
7.1
7.3
7.4
7.6
7.7
7.8
7.9
7.10
7.11
7.12
7.13
7.16
7.5
7.15
7.17
7.18
7.19
7.20
7.20
7.14
Fig. 7
www.TrichoSciencePro.com
25
Chapter 8. Hair roots analysis.
•
Chapter 8. Hair roots analysis.
•
Click on the third "Hair roots analysis" button (3.4, Fig.3) and press the "Scan" icon (8.1).
Image capture window will open. Place the Diagnosis Scope lens on extracted hair root(s) and
position the mouse cursor within image capture window, if a snapshot button on your Scope
cannot be used. After a good quality image is obtained, lock it by pressing the left mouse
button. Click “OK” and the picture will appear in the left window. From the right window
scrollable area representing diagnostic “Sample database” (8.2), choose the diagnostic
image that is most applicable to the current case. Place cursor on the selected image and press
the left mouse button. The selected image will appear in the right window. The data will be
saved into report by default. The report will contain obtained image of the hair roots and the
diagnosis name from the heading of the chosen sample image on the right. If you do not want
to save results into report, uncheck "To report" checkbox (8.3) in the bottom left corner.
•
NOTE: The settings and functions of all other session icons are identical to “Scalp analysis”
diagnostic session (Fig.7) and are respectively described in Chapter 7.
8.1
8.2
8.3
Fig. 8
www.TrichoSciencePro.com
26
Chapter 9. Hair shafts analysis.
•
Chapter 9. Hair shafts analysis.
•
Click on the third "Hair shafts analysis" button (3.5, Fig.3) and press the "Scan" icon (9.1).
Image capture window will open. Place the Diagnosis Scope lens on extracted/growing hair
shafts and position the mouse cursor within image capture window, if a snapshot button on
your Scope cannot be used. After a good quality image is obtained, lock it by pressing the
left mouse button. Click “OK” and the picture will appear in the left window. From the right
window scrollable area representing diagnostic “Sample database” (9.2), choose the
diagnostic image that is most applicable to the current case. Place cursor on the selected
image and press the left mouse button. The selected image will appear in the right
window. The data will be saved into report by default. The report will contain obtained image
of the hair shafts and the diagnosis name from the heading of the chosen sample image on the
right. If you do not want to save results into report, uncheck "To report" checkbox
(9.3) in the bottom left corner.
•
NOTE: The settings and functions of all other session icons are identical to “Scalp analysis”
diagnostic session (Fig.7) and are respectively described in Chapter 7.
9.1
9.2
9.3
Fig. 9
www.TrichoSciencePro.com
27
Chapter 10. Generating conclusion.
•
Chapter 10. Generating conclusion.
•
Click the "Conclusion /Print the results" (3.6, Fig.3). A cumulative report will be generated
containing all diagnostic session performed studies and results and will open up behind
diagnostic session window as a MS Word document file. This convenient format of reporting
allows to add/edit/delete any information within it per user discretion. Print the report and
close it. You will be prompted to save it before exiting. If some specific data was not included
into the report or you wish to include some additional information, close the report without
saving it. Make any changes and open the report again. In this case you will be prompted to
go to the previously saved report or generate the new one.
•
NOTE: If during hair density or diameter diagnostic sessions any additional information was
added to images by means of “Information” icons (4.12 or 6.13) and “Mean arithmetic
value” icons (4.11 or 6.12), when opening report you will be prompted to verify data in
“Information to image” table (10.1) first. Select the applicable data in order to proceed.
Same procedure is applicable if any of these type image shall be printed out or saved.
10.1
Fig. 10
www.TrichoSciencePro.com
28
Chapter 11. Ending diagnostic session.
“Performed Trichoscopies” module.
•
Chapter 11. Ending diagnostic session. “Performed Trichoscopies” module.
•
When finished, you can exit by closing diagnostic session window. You will be prompted to
save session data. If you choose to save it, patient’s diagnostic session will be recorded and
will appear in “Performed Trichoscopies” module (11.1, Fig.11) in the form of date and
time of the session. Any recurring patient sessions will be also recorded and listed in the
module if saved. Any of these sessions may be reviewed anytime. To choose the session of
interest right-click on its date once, so it is highlighted in blue color. Depending on what has
to be viewed, specific diagnostic session itself or generated session report, click on "Load
session" button (11.2) or "Show report" button (11.3).
•
ATTENTION!: If after diagnostic session completion the report per this session results was
generated and saved, it will appear in the “Performed Trichoscopies” module (11.1) in form
of “+” sign after the date and time of the session. Only in this case "Show report" button
(11.3) will be enabled!
11.1
11.2
11.3
Fig. 11
www.TrichoSciencePro.com
29
Chapter 12. “Express Trichoscopy”
module.
•
Chapter 12. “Express Trichoscopy” module.
•
The separate “Express Trichoscopy” module (1.27, Fig.1) of the program is dedicated to the
express diagnostic sessions, that are performed when time devoted to each patient or client is
limited, while quick, but efficient evaluation is of a main importance. The settings and
functions of this module are absolutely identical to “Trichoscopy” module (1.20) above.
However, the main difference is that this module operates in a standalone mode. There is no
requirement to enter any patient data, also no session data is saved automatically by default.
However, if necessary, any performed session actions and data may be saved by user into a
separate picture file and printed out.
Fig. 12
•
Chapter 13. “Phototrichogram” module.
•
After entering “New patient” (1.1, Fig.1) information (1.2) and filling out the “Outpatient
card” data (1.3), in order to proceed with the diagnostic session, click "Phototrichogram”
module button (1.21). The “Phototrichogram” diagnostic session window (13.0, Fig.13) will
open. If the patient has been entered into the program already, select the name from
“Patient’s name” list (1.15, Fig.1) and proceed to the diagnostic session.
www.TrichoSciencePro.com
30
Chapter 13. “Phototrichogram”
module.
•
13.1 Getting started. Image acquirement.
•
In the opened “Phototrichogram” section window (13.1, Fig.13.1) press the "Scan" icon
(13.5). Image capture window will open. Place the Diagnosis Scope lens (optimally with
magnification from x10 to x60) on chosen location of patient’s Parietal area (Androgendependent zone) and position the mouse cursor within the image capture window, if a
snapshot button on your Scope cannot be used. After good quality image is obtained, lock
it by pressing the left mouse button. Click “OK” and the picture will appear in the left
window, designated for Parietal area analysis. Perform the same sequence of operations for
the image window on the right to study the second, normally Occipital area (Androgenindependent zone) of patient's scalp.
•
NOTE: Images of the scalp and hair can be also loaded from file by pressing appropriate
icon (13.4). Any files to be uploaded into the program have to be located in the “Additional
studies” folder created by the program during installation. For convenient data management,
each new patient gets a personal subfolder created under the “Additional studies” folder.
Folder content can be previewed anytime by clicking the "Additional studies” module
button (1.26, Fig.1).
•
NOTE: In case, when it is necessary to save the image into a file, click "Save" icon (13.6).
You may be prompted where to save the overall (full name, date) information or just the
information that is set to show in the field of image. Select the desired storage capacity and
click “OK” to confirm. The image can be also printed out by clicking “Print” icon (13.7).
•
NOTE: By means of "Point localization" icon (13.10) you can mark up specific
measurement points on patient’s scalp where the hair counts have been performed. You can
utilize this information for future reference. The steps are identical to paragraph 4.5 “Point
localization” function description above.
•
NOTE: By means of "Marker" icon (13.20), you can mark up with different color any image
sections, which may be important to pay patient’s attention to during the diagnostic session.
Select the desired color marker and circle an area or a subject of interest.
•
ATTENTION!: Before proceeding to diagnostic session, make sure “Scope scaling” (icon
13.9) settings have been set according to the paragraph 3.3 Scaling settings based on
Diagnosis Scope magnification above!
•
13.2 Phototrichogram analysis.
•
The Phototrichogram analysis is based on the same principles as the hair density and diameter
calculations using the first method, described in paragraph 4.1 Hair density and diameter
calculations using the first method. The main difference is based on the approach of how
the hairs are being actually marked up for evaluation. In case of hair density and diameter
calculations, it is necessary to mark up only some part of hair shaft no matter how long it may
be, while for Phototrichogram study it is very important to carefully trace the entire length of
each hair. Proper hair length determination is critical for calculations of such parameters as
the ratio of Anagen to Telogen hairs or rates of hair growth. That’s why for proper and correct
www.TrichoSciencePro.com
31
Chapter 13. “Phototrichogram”
module.
Phototrichogram assessment we have to evaluate only hairs, which are clearly visible in given
field of view. Thus, any hairs extending beyond the field of view are not being included for
Phototrichogram evaluation, as their lengths are unclear. Although, these hairs are
examined for proper density assessment, see paragraph 13.7 Density correction function
below. Also, another difference with described in paragraph 4.1 Hair density and diameter
calculations using the first method, is that with the Phototrichogram module there is
additional important fully automatic detection mode available for hairs assessment, while all
other functions are being identical to measurement tools of Hair density section of
Trichoscopy module (Fig.4). Therefore, based on primary detection mode used, there are four
different methods for Phototrichogram calculation: with automatic, semiautomatic, manual
detection modes and manual detection mode with automatic hair diameter measurements.
•
NOTE: To make it more convenient and accurate, when processing images, the size of the
window may be increased. To do this, grab and drag with the mouse the separating border
"Movable wall” (13.12) between windows. To make left window larger drag it to the right.
Respectively, when assessing hairs in the right image window, increase the area of the
window by moving the separating border between windows to the left.
•
NOTE: It is important to run Phototrichogram evaluation on a set area within a field of view,
which may be reduced or limited for greater accuracy or convenience. To do that, use the
“Select rectangular area” (13.32) or “Select circle area” icons (13.33) to form
rectangular/square or circular areas to be analyzed; their sizes will be displayed in the lower
left corner (13.38). The function and directions are identical to described in paragraph 5.1
“Select area” function above.
•
NOTE: For more accurate hair diameter measurements, as well as various types of hairs and
perifollicular signs determination, before starting assessment, zoom into image to make it
larger. To do this, click on the "Adjust scale" icon (13.34). Place the mouse cursor on chosen
image section and make one or more clicks with the left mouse button. The degree of
magnification for selected field of view depends on the number of mouse clicks. If it becomes
too high, click right mouse button to return to the previous step(s). The greater magnification
is used the higher accuracy achieved, especially for hair diameter measurement accuracy. In
order to move to different magnified image section click on “Move” icon (13.35), then grab
and drag it. To return image to original scale, click “Scaling per window size” icon (13.36.).
•
13.3 Phototrichogram calculation using first method with automatic detection.
•
Automatic detection mode quality directly depends on quality of an image, being processed.
Choose for a field of view, by “Selecting rectangular area” (13.32), or “Selecting circular
area” (13.33), in which limits you plan to perform calculations. Increase image scale by
using “Adjust scale” (13.34). Place cursor on image and right-click once or several times, the
greater magnification, the more accurate measurements of diameters will be achieved. Click
on “Automatic detection mode” icon (13.13). Within several seconds Phototrichogram will
be processed in automatic mode. While processing image in the left diagnostic window, three
intermediate images will cascade on the right (Fig.13.2). Respectively, if processing an image
www.TrichoSciencePro.com
32
Chapter 13. “Phototrichogram”
module.
•
•
on the right, three intermediate images will cascade on the left. The first window will display
“Original image” (13.52), the second – “Filtered image” (13.53) and the third – “Processed
image” (13.53). You can close these images, using “Cancel automatic detection preview”
(13.24) and reopen, using ”Automatic detection preview” (13.23) buttons, if needed when
correcting obtained measurements. After processing, all detected and measured hairs get
marked up by four different color strips, either in green for Terminal in Anagen, blue for
Terminal in Telogen, red for Vellus in Anagen and pink for Vellus in Telogen.
Since typically automatic detection mode does not allow for completely accurate results, as
some hairs may not be processed properly, an image correction is being performed by next
step. Any hairs, which have been detected partially, i.e. color strip not passing by entire length
or width of hair, a correction shall be done manually. Press on “Manual detection mode”
(13.15) and “Diameter auto-measurement mode” (13.16) buttons. Position cursor at the end
of color strip over hair, so it turns into “cross”. Press down left button of the mouse and
continue the line to hair distal or proximal end (tip or base). Release the button and, if hair
diameter did not get detected automatically, or was detected incorrectly, rotate the mouse
wheel either direction to get the width of the color strip to be equal to hair thickness. Press on
left button again to complete measurement. Proceed to next hair evaluation.
Some hairs in the field of view may not get detected at all, like very thin, or light shaded hairs
and hairs, which get attached side by side to neighboring hairs. Press on “Manual detection
mode” (13.15) and “Diameter auto-measurement mode” (13.16) buttons. As this correction
method is actually same to the third method with manual detection and diameter automeasurement mode, for the complete instructions refer to its full description below in
paragraph 13.5.
•
NOTE: In case, when correction of certain performed measurement is not helpful and it is
more convenient to make a new measurement instead, use “Cancel” (13.37) function to take
one or more steps back to correct measurements in error, or “Clear field” (13.26) function for
groups of hairs in one area, or "Clear“ (13.25) function to completely remove all previously
performed actions within given field of view. Same applies to correct any errors with Program
•
ATTENTION!: Only clearly visible by entire length hairs in given field of view have to be
evaluated with Phototrichogram study, as their lengths are unclear! Although, those hairs,
which are growing out of the given field of view, will be in addition examined for proper
density assessment, see paragraph 13.7 Density correction function below.
•
13.4 Phototrichogram calculation using second method with semiautomatic
detection.
•
For more accurate hair diameter measurements, before processing an image, select for proper
field of view and increase the scale, as described at the beginning of paragraph 13.3
Phototrichogram calculation using first method with automatic detection. Click on
“Semiautomatic detection mode” icon (13.14). Cross with mouse cursor all hairs in a field
of view, either by one or in groups to count them with their diameters and lengths being
established automatically. To do that, position cursor by measured hairs side, press down left
button of the mouse and cross with a line perpendicular to hair. You may extend this line to
www.TrichoSciencePro.com
33
Chapter 13. “Phototrichogram”
module.
cross more neighboring hairs. As long as the line remains perpendicular to hairs being
crossed, their diameters and lengths will be measured properly. When processed, all measured
hairs get marked up by four different color strips, either in green for Terminal in Anagen, blue
for Terminal in Telogen, red for Vellus in Anagen and pink for Vellus in Telogen.
Perform measurements of all hairs in given field of view. Some hairs in the field of view may
not get detected properly or at all, like very thin, or light shaded hairs and hairs, which get
attached side by side to neighboring hairs. In such cases, at line crossing hair is not getting
any color strip or its width is not corresponding to hair thickness. For each case correction,
including just an adjustment of improperly detected hairs or their completely new assessment,
as well as for missed at all during detection hairs and all hair density count corrections, use
same steps and precautions, as described in paragraph 13.3 Phototrichogram calculation
using first method with automatic detection above.
•
•
ATTENTION: Both automatic and semiautomatic detection modes for Phototrichogram
calculations may work incorrectly with really dense or intercrossing in-between hairs; there
are high contrasted inclusions within a field of view or hairs are light or too poorly contrasted
against scalp; poor sharpness of a diagnostic image; low resolution of the Scope, etc.).
•
13.5 Phototrichogram calculation using third method with manual detection and
diameter auto-measurement mode.
•
This is another method to simultaneously measure hair density and their diameters, used to
correct and complete first two methods measurements or used widely on its own when
assessing hairs, that are densely populated, thicker, curlier, growing in bunches, etc.,
especially in a darker shades, or when wanted to perform a study “straight forward” without
going back to perform corrections. For more accurate hair diameter measurements, before
processing an image, select for proper field of view and increase the scale, as described at the
beginning of paragraph 13.3 Phototrichogram calculation using first method with
automatic detection. Press on “Manual detection mode” (13.15) and “Diameter automeasurement mode” (13.16) buttons. Position cursor at the end of hair distal end (base),
approximately in the middle of the shaft, press and hold down the left mouse button, move
the cursor along the shaft to the proximal end (tip) of the hair. The length of the line drawn is
very important for proper calculation of Anagen to Telogen hairs ratio or rates of hair growth.
Release the left mouse button. If the hair is dark enough and well contrasted, the line drawn
along the hair shaft becomes thicker automatically, coinciding with the thickness of hair. If
the automatic measurement is performed correctly, confirm its completion by clicking the left
mouse button and proceed to the next hair measurement. If the automatic measurement was
carried out incorrectly, e.g. the drawn line does not thicken or goes beyond the diameter of
the hair, continue to measure hair diameter manually. To do this, release the left mouse button
and scroll the mouse wheel. If scrolling forward the line drawn along the hair shaft starts to
thicken, if scrolling backwards the line will become thinner. When the thickness of the line
becomes equal to the thickness of the hair shaft, click the left mouse button to confirm the
proper value of hair thickness measurement. Proceed to next hair measurement. If working
without a mouse wheel, use "Slider" (13.3) located in the upper left corner of each window.
www.TrichoSciencePro.com
34
Chapter 13. “Phototrichogram”
module.
•
13.6 Phototrichogram calculation using fourth method with manual detections.
•
This is another method to simultaneously measure in manual mode both hair density and their
diameters. This method is designated to hair types, that may not get detected by any
automatic or semiautomatic mode due to being really thin, grey or light shaded, etc. This
mode is also being used for corrections for similar hair types with all 3 previous methods
above. For more accurate hair diameter measurements, before processing an image, select for
proper field of view and increase the scale, as described at the beginning of paragraph 13.3
Phototrichogram calculation using first method with automatic detection. Press on
“Manual detection mode” (13.15) and depress “Diameter auto-measurement mode”
(13.16) buttons, if it has been activated for previously used detection mode. Position cursor at
the end of hair distal end (base), approximately in the middle of the shaft, press and hold
down the left mouse button, move the cursor along the shaft to the proximal end (tip) of the
hair. The length of the line drawn is very important for proper calculation of Anagen to
Telogen hairs ratio or rates of hair growth. Release the left mouse button and scroll the mouse
wheel. If scrolling forward the line drawn along the hair shaft starts to thicken, if scrolling
backwards the line will become thinner. When the thickness of the line becomes equal to the
thickness of the hair shaft, click the left mouse button to confirm the proper value of hair
thickness measurement. Proceed to next hair measurement. If working without a mouse
wheel, use "Slider" (13.3) located in the upper left corner of each window.
•
13.7 “Density correction” function.
•
The proper Phototrichogram assessment requires evaluation of only those hairs, which are
clearly visible in the field of view. Any hair shafts extending beyond the field of view should
not be accounted as their lengths are unclear. This requirement is essential to properly
calculate Anagen and Telogen hair percentages. However, since during the study hair density
counts are carried out simultaneously, density measurements have to be corrected as well,
since it is important to account for all hairs growing within the field of view. To do this, leftclick on the “Correct density” icon (13.17) and measure hair density and diameter for the
rest of the hairs in the field of view by the first method, described in paragraph 4.1 Hair
density and diameter calculations using the first method above.
•
13.8 Follicular unit count mode.
•
This method supplements hair density count with hair distribution per follicular units
information (follicular unit is a group of adjacent growing hair).
•To perform this calculations, click “Follicular unit count mode" icon (13.18). Place the
cursor closer to the base of the hair and press the left mouse button as many times, as there
are hairs in a specific follicular unit, mouse button clicks should be performed in quick
successions. Program allows estimation for single, double, triple, as well as separate follicular
units with four and five hairs. The chosen number of hairs will be displayed; in case of any
mistake use “Cancel” icon (13.37) to return to previous step or click right mouse button to
start over. The information on follicular unit counts and distribution in one or more fields of
view will be saved into report and can be displayed with image Information (13.28).
•
www.TrichoSciencePro.com
35
Chapter 13. “Phototrichogram”
module.
•
13.9 “Perifollicular signs” function.
•
“Perifollicular signs” icon (13.19) is designated to mark up and count “Exclamation mark
hairs”, “Pointed hairs”, “Broken hairs”, “Cadaverized hairs”, "Yellow dots", "Red
dots“, "White dots". Click the icon to open up perifollicular sign menu, select the
corresponding perifollicular sign and mark its location on the image by placing cursor on it
and clicking the left mouse button. The information on the number of perifollicular signs in
one or more fields of view will be present on the chart and saved into report. It will be also
displayed with image Information (13.28). For more information, see paragraph 4.5 above.
•
13.10 “Chart” function.
•
After measuring all the hairs in the field of view, click on the "Chart" icon (13.8) to open
composite chart and data window, containing measurements summary for Phototrichogram
(13.46) on the left, for Density (13.47) in the middle and for Diameters (13.49) on the right
side for either the left image window for Parietal area or the right image window for Occipital
area. If measurements were performed in several fields of view (see description of "Choose
frame“ (13.11) function below), the charts and data will be reflecting accordingly the average
value of all associated measurements.
In Phototrichogram section the dark brown column on the chart reflects percentage and total
number of Anagen hairs; the light brown is for Telogen hairs; the green is for Terminal
among Anagen hairs, the blue is for Terminal among Telogen hairs; the red is for Vellus
among Anagen hairs; the purple represents Vellus among Telogen hairs. All this data with
mean diameters for these different hair types in addition and calculated hair growth rate is
listed below the chart.
In Density section the yellow column on the chart represents the total amount of hair per
sq.cm, green column – the number of Terminal hairs, red - the number of Vellus hairs. The
blue bar area represents the mean density for specified for the patient racial type of hair. Same
data with percentages for these different hair types in addition and follicular unit with
perifollicular sign counts is listed below the chart.
In Hair diameter section each measurement taken is represented on the chart by red column.
If a lot of hair diameter measurements were performed, the red curve will be displayed
instead of separate columns. Single yellow column reflects the mean diameter of Terminal
hairs only (excluding all Vellus hairs). Same data with percentages for these different hair
types in addition and Terminal hairs separation into thin, regular and thick groups based on
diameters, including Anisotrichosis value (see paragraph 4. Hair density and diameter
measurements and calculations. Follicular unit counts. below)
The composite chart and data window can be moved across the monitor into any convenient
location to allow easy continuation of hair measurements if necessary. To move it, point to its
title bar with the mouse cursor, then left click and drag the window. In order to increase or
decrease window size in any direction, point and drag any of its corners or borders. To save
or delete charts in final report, check/uncheck "To report" checkboxes (13.49, 13.50, 13.51),
located in the bottom right portion of associated chart and data table.
•
•
•
•
www.TrichoSciencePro.com
36
Chapter 13. “Phototrichogram”
module.
•
NOTE: Image window "Choose frame" icon (13.25) allows to obtain additional images for
Phototrichogram calculations in new windows added "on top" of the previous one. These
additional calculations in the new windows may significantly increase reliability of the
measurements. All the results in charts and in report for a given Parietal or Occipital area can
be calculated as the average of all measurements. To obtain the average values of the
measurements across several windows, click the "Mean arithmetic value” icon (13.7).
•
NOTE: Any operations performed while working with the program results are stored by
default in the final report. If you do not want to save results into report, uncheck "To report”
checkboxes of associated chart and data table, as indicated above. Even if you choose not to
save information into the report, it does not mean that this data is "lost" after the session
ends. All data obtained will be stored, if the session itself is saved.
•
13.11 “Information” function.
•
For more detailed information on the measurements performed within the field of view, click
on the “Information” icon (13.28). All information, identical to listed in chart and data tables
for “Chart” function (13.11), described in paragraph 13.10 “Chart” function above, will be
listed on the image, which can be printed (13.7) or saved (13.6), as a separate image file.
The displayed information includes total hair counts and ratios of Anagen and Telogen hairs,
Terminal and Vellus hairs and their intermediate ratios, hair and follicular unit density counts,
different hair type diameter values with thick, medium and thin terminal hair ratios and
anisotrichosis values, etc. If several measurement windows were used, click on the "Mean
arithmetic value” icon (13.27) to obtain the average of all the measurements performed.
•
NOTE: The information on counting results may be edited (amount of information provided,
font, changes or additions to the text). To make changes, place the cursor within text area and
right-click. From the pop-up menu select the desired item and make a correction of the text. If
you want to add your own information, click "Add information"; "Choose fields" allows to
select what specific information you want to be displayed; "Reset position" is intended to
move information into its original location within the image, if the image scale was changed
or text has moved; “Select font” allows to choose displayed text appearance options.
•
13.12 Hair growth rate calculations.
•
Calculation of the hair growth rate is performed automatically, based on the difference in the
length between Anagen and Telogen hairs within a set period of time. In the Phototrichogram
study all hairs within certain select area get trimmed down to an identical minimal length and
when the image is taken after a certain period of time (typically 48 to 72 hours), the Anagen
hairs will grow out, while the Telogen hairs will be remaining of the same length. In order to
calculate the hair growth rate properly, an exact number of hours that passed from the
moment of trimming to the new image acquirement shall be entered into the “Time period
between measurements (hours)” window (13.40) before the hair growth rate calculation is
carried out. The value displayed by default in this window is 48 hours. The result of the hair
growth calculation will be reflected in the "Conclusion/Print results" section (13.2).
www.TrichoSciencePro.com
37
Chapter 13. “Phototrichogram”
module.
•
13.13 “Anagen/Telogen hair diameter threshold” function.
•
Anagen and Telogen hair percentage and ratio calculations are based on the difference in
length between Anagen hairs, which grew out, and Telogen hairs, which remained the same,
within a set period of time. For proper calculations, it is necessary to enter the correct hair
length for the “Threshold for Anagen/Telogen hair length, mm” value (13.41). To correctly
determine the length, locate the longest Telogen hair in the field of view and trace its entire
length by holding down the left mouse button. Watch for the hair length value in mm that
appears in the yellow window in the upper right corner of the image. Enter this number into
the “Threshold for Anagen/Telogen hair length, mm” window (13.42). After the threshold
value is established, all hairs with equal or lesser length will be considered to be Telogen
hairs, while hairs with a greater length will be considered, as Anagen hairs. By moving the
"Slider for Anagen/Telogen hair length threshold determination” (13.43), the threshold
value may be dynamically changed during any stage of the Phototrichogram session, as well
as prior to starting the session, or after finishing it. Changing the threshold value will affect
the Anagen/ Telogen hair ratio value calculations. By default this value is set to 0.35 mm.
•
NOTE: The “Linear length“ function (13.21) can be used for any length measurements
within any field of view. The function and directions, are identical to those, described in
paragraph 4.8 Hair length above.
•
13.14 “Terminal/Vellus hair diameter threshold” function.
When hair diameter is being evaluated along with hair density calculations, it is necessary to
take into consideration the difference in hair thickness to automatically sort them into Vellus
or Terminal hairs. Generally, hairs with a diameter of less than 30-40 µm (micrometers or
microns) are considered to be Vellus hairs. The program provides default auto-configuration
values for the “Threshold for Terminal/Vellus hair, µm” window (13.44). When calculating
hair density and diameters, depending on the average diameter in the field of view, the
threshold will be set to one of the three preset values - 30, 35 or 40µm (13.45). This function
changes dynamically, e.g., if the field of view mostly contains thick Terminal hairs, the
threshold will be automatically set to the value of 40 microns; if the hairs are mostly fine, the
threshold will be set to 30 microns; if hairs are mixed, the threshold will be set to 35 microns
In case, if you want to change the threshold, you have to turn automatic detection off. To do
this, right-click on the red link “Threshold for Terminal/Vellus hair, µm” (13.44) at the
bottom of the window. In the pop-up window uncheck the “Automatic threshold
determination” checkbox. The text color of the link will change to black. Enter the desired
threshold value into the “Threshold for Terminal/Vellus hair, µm” window (13.45). If the
threshold has to be reset to automatic mode again, right-click on the “Threshold for
Terminal/Vellus hair, µm” link (13.44) and check the “Automatic threshold
determination” checkbox in the pop-up window. The text color of the link will change back
to red, thus, indicating that threshold determination is configured automatically again.
•
NOTE: The threshold data above is corresponding to average European/Caucasian hair
characteristics. For ethnic variations of hair, automatic thresholds will be set accordingly with
selection in the “Add patient” table (1.2, Fig.1).
www.TrichoSciencePro.com
38
Chapter 13. “Phototrichogram”
module.
•
•
NOTE: The "Sync windows" special function (13.29, 13.30) may be required for the correct
assessment of treatment dynamics, when comparing before- and after-treatment images, taken
in same area. The function and directions, including “Select circle area” (13.33) and “Clear
background” (13.31) are identical to those, described in paragraph 5.2 Sync windows above
NOTE: The "Select area“ special function may be needed to set any rectangular (13.32) or
circle (13.33) area of determined size of field of view for more accurate measurements. The
function and directions, including other functions for magnifying (13.34) selected area,
moving (13.35) to different image parts and restoring (13.36) original scaling for image, are
identical to those, described in paragraph 5.1 Select area above.
•
13.15 Ending session. Generating conclusion. “Performed Phototrichograms”
module.
•
After Phototrichogram session is completed, determine what data has to be saved to report by
using the “To report: Phototrichogram, Hair density, Hair diameter” checkboxes (13.39).
Click on the "Conclusion /Print the results" section (13.2). Generated per above selection
report for the diagnostic session will open up behind diagnostic session window, as a MS
Word document file. This convenient format of reporting allows to add/edit/delete any data
within it per user discretion. Print the report and close it. You will be prompted to save it
before exiting. You may also save it as an uneditable PDF file to personal patients folder in
“Additional Studies” folder, conveniently accessible from desktop, to email it or other uses.
When finished, you can exit by closing the diagnostic session window. You will be prompted
to save the session. If you choose to save it, this patient’s diagnostic session will be recorded
and appear in the “Performed Phototrichograms” module (1.6, Fig.1) in the form of date
and time of the session. Any recurring patient sessions will be also recorded and listed in the
module if saved. Any of these sessions may be reviewed anytime. To choose the session of
interest right-click on the appropriate date, so it gets highlighted in blue. Depending on what
has to be viewed, specific diagnostic session itself or generated session report, click on the
"Load session" button (1.17) or the "Show report" button (1.18) respectively.
•
NOTE: Any performed during diagnostic session actions and their results are stored by
default in the final report. If some specific data was not included into the report or you wish
to include some additional information, close the report without saving it. Make any changes
and open the report again. You will be prompted to go to the previously developed report or
generate new one. If you do not want to generate full report at all, or want it to be partial,
uncheck some or all three “To report: Phototrichogram, Hair density, Hair
diameter” checkboxes (13.29, Fig.13). Even if you choose not to save data into the final
report, it does not mean, that this data is "lost" after the session ends. All data obtained will be
stored, if the session itself is saved. Other report options and directions are identical to those,
described in Chapter 10 “Generating conclusion report” function above.
•
ATTENTION: If after the diagnostic session completion the session’s report was generated
and saved, it will be listed in the “Performed Phototrichograms” module (1.6, Fig.1) with
the “+” sign following the date and time of the session. Only in this case, the "Show report"
button (1.18) will be enabled.
www.TrichoSciencePro.com
39
Chapter 13. “Phototrichogram”
module.
13.2
13.1
13.3
13.13
13.15
13.17
13.19
13.4
13.14
13.16
13.18
13.20
13.22
13.24
13.25
13.27
13.29
13.26
13.28
13.31
13.33
13.30
13.32
13.34
13
Fig.Fig.13.1
13.10
13.11
13.21
13.23
13.35
13.37
13.38
13.5
13.6
13.36
13.41
13.7
13.8
13.9
13.12
13.46
13.39
13.42
13.40
13.43
13.47
13.49
13.44
13.48
13.50
13.51
13.45
13.52
13.13
13.53
13.23
13.24
13.54
13.32
13.33
13.34
Fig. 13.2
www.TrichoSciencePro.com
40
Chapter 14. “Trichogram”
module.
•
Chapter 14. “Trichogram” module.
•
After entering “New patient” (1.1, Fig.1) information (1.2) and filling out the “Outpatient
card” data (1.3), in order to proceed with the diagnostic session, click "Trichogram” module
button (1.22). The “Trichogram” diagnostic session window (14.0, Fig.14) will open. If the
patient has been entered into the program already, select the patients’ name from “Patient’s
name” list (1.15) and proceed to the diagnostic session.
•
14.1 Conducting the “Trichogram” session.
•
In the opened “Trichogram” diagnostic session window (14.0, Fig.14) press the "Scan" icon
(14.12), the image capture window will open. Usually left window is used for Parietal area
and right window for Occipital area study. Place the Diagnosis Scope lens on epilated hair
root(s), extracted from patient’s scalp, and position the mouse cursor within image capture
window. Trichogram study typically requires about 50 hairs to be epilated. After good quality
image is obtained, lock it by pressing left mouse button. Click “OK” and the picture will
appear in the corresponding window. Use the block of 7 hair type icons (14.1) to mark up
hair roots in the field of view. By placing mouse cursor over each of these icons, you will
have their names displayed. This group of 7 icons provides functionality to mark up Anagen,
Dysplastic Anagen, Broken Anagen, Anagen with Papilla, as well as Catagen, Telogen and
Dystrophic hairs. In the window’s bottom scrollable area, representing diagnostic “Sample
database” (14.20), you can locate various epilated hair root reference images. By placing
mouse cursor over each of these images, you will have their names displayed. You may also
place the cursor on the selected image and double-click the left mouse button to open the
selected image in a separate window with its name displayed. In case of ane mistake made,
use “Cancel” icon (14.10) to correct it. With each additional click it will take you back by
sequentially reverting to previously performed step. After completing the counting process,
press “Trichogram table” icon (14.17) to open the table with results (14.25) for review.
•
NOTE: In order to add new diagnostic images to the “Sample database” (14.20), place
mouse cursor over the image and right-click with the mouse. You will be prompted to "Add
image to Own Base?”. Left-click on it in order to open the “Sample card” (14.21). Type the
name of diagnosis in the “Sample title” field (14.22) and click ”Save” (14.24). The image
will appear at the very end of the scrollable area. More images can be uploaded by clicking
“Select image” button (14.23). If necessary, images from the “Sample database” (14.20)
may be edited. To do this, place mouse cursor over any image in it and right-click. From the
menu select an option to open, add, delete, change or move the selected image.
•
NOTE: Diagnostic images can be also downloaded from file by pressing appropriate icon
(14.11). Any image files to be loaded into program have to be located in the “Additional
studies” folder that was created on the desktop during installation. For convenient additional
data management, for every new patient entered into program a personal subfolder is created
under this “Additional studies” desktop folder. Folder content can be previewed anytime by
clicking "Additional studies” module button (1.26, Fig.1).
•
NOTE: In case when it is necessary to save an image into a separate file, click "Save" icon
(14.13). The image can also be printed by clicking the “Print” icon (14.14).
•www.TrichoSciencePro.com
diagnostic session. Select the desired color marker and circle an area or a subject of interest.
41
Any mark ups on the image can be deleted by using “Clear” icon (14.5).
Chapter 14. “Trichogram”
module.
•
NOTE: By means of "Marker" icon (14.4) you can choose and mark up with different
colors any image sections, which may be important to pay patient’s attention to during the
diagnostic session. Select the desired color marker and circle an area or a subject of interest.
Any mark ups on the image can be deleted by using “Clear” icon (14.5)
•
NOTE: The “Information” icon (14.6) allows placing any important information within
image field by right clicking "Add information" when prompted; "Choose fields" allows to
select what specific information you want to be displayed; "Reset position" is intended to
move information into its original location within the image, if the image scale was changed
or text has moved; “Select font” allows to choose displayed text appearance options.
•
NOTE: For more detailed view you can zoom into image to make it larger. To do this, click
on the "Adjust scale" icon (14.7). Place the mouse cursor on chosen image section and make
one or more clicks with the left mouse button. Degree of magnification for selected field of
view depends on the number of mouse clicks. If it becomes too high, click right mouse button
to return to previous step(s).The greater magnification is being used, the higher accuracy is
going to be achieved. In order to move to different magnified image section click on “Move”
icon (14.8), than grab and drag it. To return the image to its original scale, click “Scaling per
window size” icon (14.9). Also "Choose frame" icon (14.16) allows to obtain additional
image(s) in the new window(s) added "on top" of the previous one.
•
ATTENTION!: Before proceeding to diagnostic session, make sure “Scope scaling” icon
(14.15) settings have been set according to the paragraph 3.3. Scaling settings based on
Diagnosis Scope magnification above! The proper settings will directly affect the “Linear
measurer” function (14.2) or “Circular measurer” function (14.3) data displayed in the
yellow window by the measurement object or in the upper right corner of the image, when
measuring, and in the left bottom corner under diagnostic image, when finished, should any
measurements of the objects of interest will be performed!
•
14.2 Ending session. Generating conclusion. “Performed Trichograms” module.
•
After completing the Trichogram diagnostic session, check “To report” checkbox (14.19).
Click the "Conclusion/Print the results" module (14.0). Generated per diagnostic session
report will open up behind diagnostic session window as a MS Word document file. This
convenient format of reporting allows to add/edit/delete any information within it per user
discretion. Print the report and close it. You will be prompted to save it before exiting. When
finished, you can exit by closing the diagnostic session window. You will be prompted to save
session data. If you choose to save it, your diagnostic session will be recorded and appear in
“Performed Trichograms” module (Fig.1, 1.7) in the form of date and time of the session.
Any recurring patient sessions will be also recorded and listed in the module if saved. Any of
these sessions may be reviewed anytime. To choose the session of interest right-click on the
appropriate date, so it gets highlighted in blue. Depending on what has to be viewed, specific
diagnostic session itself or generated session report, click on the "Load session" button
(1.17) or the "Show report" button (1.18), respectively.
•
NOTE: Any operations performed while working with the program results are stored by
default in the final report. If some specific data was not included into the report or you wish
www.TrichoSciencePro.com
42
Chapter 14. “Trichogram”
module.
to include additional information, close the report without saving it. Make any changes and
open the report again, you will be prompted to go to the previously generated report or build
new one. If you do not want to save results into report, uncheck "To report" checkbox
(14.19). Even if you choose not to save data into the report, it does not mean, that this data is
"lost" after the session ends. All the data obtained will be stored if the session itself is saved.
•
ATTENTION: If after diagnostic session completion the report per this session results was
generated and saved, it will show in “Performed Trichograms” module (1.7) in form of “+”
sign after date and time of the session and the "Show report" button (1.18) will be enabled!
14.0
14.12
14.13
14.14
14.17
14.11
14.18
14.7
14.15
14.7
14.8
14.16
14.2
14.3
14.1
14.4
14.5
14.6
14.10
14.19
14.20
14.25
14.21
14.22
14.23
Fig. 14
14.24
•
Chapter 15. “Dermatoscopy” module.
•
After entering “New patient” (1.1, Fig.1) information (1.2) and filling out the “Outpatient
card” data (1.3), in order to proceed with the diagnostic session, click "Dermatoscopy”
module button (1.23). The “Dermatoscopy” section window (15.0, Fig.15) will open. If the
www.TrichoSciencePro.com
43
Chapter 15. “Dermatoscopy”
module.
patient has been entered into the program already, select the name from “Patient’s name” list
(1.15) and proceed to the diagnostic session.
•
15.1 Conducting the “Dermatoscopy” session.
•
Each standard “Dermatoscopy” (15.0, Fig.15) diagnostic session is composed of “General
Dermatoscopy” and “Pigmented Lesions” diagnostic sections steps and “Conclusion/Print
results” completion step (15.1). Both diagnostic sections are identical in use. In the opened
section window press the "Scan" icon (15.12), image capture window will open. Place the
Diagnosis Scope lens on chosen location of patient’s scalp and position the mouse cursor
within image capture window. After good quality image is obtained, lock it by pressing the
left mouse button. Click “OK” and the picture will appear in the left window. In the the right
window scrollable area, representing diagnostic “Sample database” (15.20), choose the
diagnostic image that is most applicable to the current case. Place cursor on the selected
image and press the left mouse button. The selected image will appear in the right window
(15.19). “Linear measurer” function (15.2) and/or “Circular measurer” function (15.3)
allow to estimate the size, area and diameter, as well as the symmetry of the skin structures,
i.e. lesions, neoplasms, melanomas, tumors, etc. Both diagnostic sessions of this module have
“Calculators” functions (15.17) with three most common Dermatoscopic algorithms of
pigmented lesion assessment. You may choose from “ABCD”, “ABC” and “Argeniziano”
calculator algorithms (15.25) for melanoma and other tumor estimation. The “ABCD”
algorithm requires the user to enter points in its third graph. Left-click on “0” and enter the
corresponding number of points. For the “ABC” and “Argeniziano” algorithms mark
corresponding points in the fourth graph, if applicable. When finished, you can evaluate
results by pressing “Evaluation of results” button (15.26) for additional data.
•
NOTE: In order to add new diagnostic images to “Sample database” (15.20), place mouse
cursor over the image on the left and right-click. You will be prompted "Add image to Own
Base?” Left-click on it in order to open the “Sample card” (15.21). Type the name of the
diagnosis in the “Sample title” field (15.22) and click ”Save” (15.24). The image will appear
at the very bottom of the scrollable area. You can also upload more images by clicking the
“Select image” button (15.23). If necessary, images from the “Sample database” (15.20)
may be edited. To do this, place mouse cursor over any image in it and right-click. From the
menu select an option to open, add, delete, change or move the selected image.
•
NOTE: Diagnostic images can be also downloaded from file by pressing appropriate icon
(15.11). Any files to be uploaded into the program have to be located in the “Additional
studies” folder created by the program during installation on the desktop. For convenient data
management, each new patient gets a personal subfolder created under the “Additional
studies” folder. Folder content can be previewed anytime by clicking the "Additional
studies” module button (1.26, Fig.1).
•
NOTE: By means of "Marker" icon (15.4) you can choose and mark up with different
colors any image sections, which may be important to pay patient’s attention to during the
diagnostic session. Select the desired color marker and circle an area or a subject of interest.
Any mark ups on the image can be deleted by using “Clear” icon (15.5).
www.TrichoSciencePro.com
44
Chapter 15. “Dermatoscopy”
module.
•
NOTE: In case when it is necessary to save the image into a separate file, click "Save" icon
(15.13). The image can also be printed out by clicking “Print” icon (15.14).
•
NOTE: The “Information” icon (15.6) allows placing any important information within
image field by right clicking "Add information" when prompted; "Choose fields" allows to
select what specific information you want to be displayed; "Reset position" is intended to
move information into its original location within the image, if the image scale was changed
or text has moved; “Select font” allows to choose displayed text appearance options.
•
NOTE: To make it more convenient and accurate, when counting hairs in the left image
window the size of the window can be increased. To do this, grab and drag with the mouse the
separating border between windows. To make the left window larger drag it to the right
("Movable border" 15.18). Respectively, when counting hairs in the right window, increase
the area of the window by moving the border to the left.
•
NOTE: For more detailed view you can zoom into image to make it larger. To do this, click
on the "Adjust scale" icon (15.7). Place the mouse cursor on chosen image section and make
one or more clicks with the left mouse button. Degree of magnification for selected field of
view depends on the number of mouse clicks. If it becomes too high, click right mouse button
to return to previous step(s).The greater magnification is being used, the higher accuracy is
going to be achieved. In order to move to different magnified image section click on “Move”
icon (15.8), than grab and drag it. To return the image to its original scale, click “Scaling per
window size” icon (15.9). Also "Choose frame" icon (15.16) allows to obtain additional
image(s) in the new window(s) added "on top" of the previous one.
•
ATTENTION!: Before proceeding to diagnostic sessions, make sure “Scope scaling” icon
(15.15) settings have been set according to the paragraph 3.3. Scaling settings based on
Diagnosis Scope magnification above! The proper settings will directly affect the “Linear
measurer” function (15.2) or “Circular measurer” function (15.3) data displayed in the
yellow window by the measurement object or in the upper right corner of the image, when
measuring, and in the left bottom corner under diagnostic image, when finished, should any
measurements of the objects of interest will be performed!
•
15.2 Ending session. Generating conclusion. “Performed Dermatoscopies”
module.
•
After completing the Dermatoscopy session, click the "Conclusion/Print the results"
section (15.0). The report will contain obtained images of the scalp and lesions, as well as
diagnosis names from headings of the chosen sample image on the right and chosen
calculator data. If you do not want to save everything into report, uncheck "To report"
checkbox (15.29) and/or "To report" checkbox (15.27) in lower right corners of applicable
calculator tables accordingly. The generated report will open up behind diagnostic session
window as a MS Word document file. This convenient format of reporting allows to
add/edit/delete any information within it per user discretion. Print the report and close it. You
will be prompted to save it before exiting. When finished, exit by closing diagnostic session
www.TrichoSciencePro.com
45
Chapter 15. “Dermatoscopy”
module.
window. You will be prompted to save session data. If saved, your diagnostic session will be
recorded and appear in the “Performed Dermatoscopies” module (1.8, Fig.1) in the form of
date and time of the session. Any recurring patient sessions will be also recorded and listed in
the module if saved. To choose the session of interest right-click on the appropriate date, so it
gets highlighted in blue and proceed with clicking on the "Load session" button (1.17) or the
"Show report" button (1.18). Other functions/settings are identical to described in paragraph
14.2 Ending session. Generating conclusion. “Performed Trichograms” module.
15.0
15.12
15.13
15.1
15.11
15.20
15.17
15.2
15.3
15.4
15.5
15.6
15.18
15.16
15.15
15.14
15.19
15.25
15.21
15.22
15.23
15.7
15.8
15.24
15.9
15.10
Fig. 15
15.28
15.29
www.TrichoSciencePro.com
15.26
15.27
46
Chapter 16. “Hair calculator” module.
“Trichometry” functions.
•
Chapter 16. “Hair calculator” module. “Trichometry” functions.
•
In order to proceed, click "Hair calculator” module button (1.24, Fig.1). The “Hair
calculator” window (16.0, Fig.16) will open. This module allows to calculate total quantity
of scalp hair, hair growth and hair loss rates, to compare this data to mean numbers based on
patient’s sex, age and racial hair variations, and much more. The module functions in
automatic mode by default. The data for its upper portion – Terminal and Vellus hairs
density and percentages in Parietal and Occipital areas, percentages of Telogen and
Anagen hairs in Parietal and Occipital areas, as well as percentages of Vellus Telogen
hairs in Parietal and Occipital areas (16.1), is obtained from corresponding Trichoscopy
and Phototrichogram sessions. “Sex” (16.2), “Age” (16.3) and “Racial variation of hair”
(16.4) fields data is obtained from the data contained in Outpatient card. Per user discretion
all the data above, which is being obtained automatically, may be modified and corrected
anytime by typing new information into applicable fields. The bottom module portion
contains calculated data in applicable fields (16.7) as follows: “Total mean and actual
quantities of scalp hairs with mean quantity in reference to specific patient’s racial hair
variation and actual quantity breakdown to Terminal and Vellus hairs counts, mean and
actual hair growth rates with mean rate in reference to specific patient’s racial hair variation
and actual rate breakdown to Parietal and Occipital areas, total actual hair loss rates with a
breakdown to Terminal and Vellus hairs counts. The measurement error may reach up to
10%, depending on user's qualifications. You may Print, Download to MS Word, Close
(16.8) or save results into “Summary report” (1.30, Fig.1) by selecting "To report"
checkbox (16.9) in the lower right corner of the calculator window. Also there are two
additional calculators included, representing Trichometry functions, based on hair wash
test (16.5) and growing hair test (16.6) results, as described below.
•
16.1 “Trichometry” function (hair wash test).
•
In order to proceed, click “Trichometry function (hair wash test)” function (16.5) button.
The “Trichometry function (hair wash test)” window (16.10) will open. This function
allows for better understanding of ongoing hair loss intensity and form. The test can be
carried out only if patient’s hair are at least 5 cm. long and were not washed at least 3 days
prior to the test. Enter the ”Date of hair sampling” (16.11) and patient’s “Current mean
hair length, cm” (16.12) into appropriate fields. Count shed during hair wash and collected
for the test Telogen hairs, based on their lengths. Enter results into left table column “Hair
quantity” (16.13) appropriate fields. After filling in data required you will get automatically
calculated results of the percentages of the Telogen hairs depending on their length in the
right column “Percentage of hair” (16.14). For example, if the quantity of shed during wash
hairs with lengths up to 3 cm. is going to be greater than 20%, this will indicate the potential
progression of Alopecia Androgenetica. As finished you may Print, Download to MS Word,
Close (16.5) or save results into “Summary report” (1.30, Fig.1) by selecting "To report"
checkbox (16.6) in the lower right corner of the calculator window.
www.TrichoSciencePro.com
47
Chapter 16. “Hair calculator” module.
“Trichometry” functions.
•
16.2 “Trichometry” function (growing hair test).
•
In order to proceed, click “Trichometry (growing hair test)” function (16.6) button. The
“Trichometry (growing hair test)” window (16.17) will open. This function allows for
retrospective calculation of total quantities of hairs shed within 5, 4, 3, 2 consecutive months
preceding to the test. To carry out the test a fixed quantity of hairs growing within
neighboring follicular units from select scalp areas is being epilated and affixed to a scotch
tape in order to measure their lengths. Enter the ”Date of hair sampling” (16.18) into
appropriate field and amount of hairs collected for the test, depending on their lengths, into
the left table column “Total amount” (16.19) appropriate fields. After filling in applicable
data you will get in the right table column an automatically calculated results of the
“Intensity of monthly hair loss” (16.20) for the five preceding to the test months. You may
Print, Download to MS Word, Close (16.21) or save results into “Summary report” (1.30,
Fig.1) by selecting "To report" checkbox (16.22) in the lower right corner of the calculator
window.
16.10
16.0
16.11
16.12
16.1
16.13
16.3
16.2
16.4
16.7
16.16
16.5
16.17
16.15
16.6
16.18
16.19
Fig. 16
16.14
16.8
www.TrichoSciencePro.com
16.9
16.21
16.20
16.22
48
Chapter 17. “Hospital anxiety and
depression scale” module.
•
Chapter 17. “Hospital anxiety and depression scale” module.
•
In order to proceed, click “Hospital anxiety and depression scale” module button (1.22,
Fig.1). The “Hospital anxiety and depression scale” window (17.0, Fig.17) will open. This
module is based on “Zigmond A., Snaith R. 1983” questionnaire. The patient should answer
14 questions of this questionnaire by selecting one out of four answer choices. After finished
click “OK” to save data or “Cancel” to exit (17.1). To get evaluation of results press the
“Conclusion” button (17.2). The “Conclusion” table (17.3) with automatic evaluation will
open. Press the “Detailed report” button (17.4) if you want to get all complete test data. The
“Detailed report” window (17.5) will open. You may Print, Download to MS Word, Close
(17.6) or save results into “Summary report” (1.30, Fig.1) by selecting "To report"
checkbox (17.7) in the lower right corner of the window.
17.0
17.3
17.4
17.1
Fig. 17
www.TrichoSciencePro.com
17.5
17.2
17.6
17.7
49
Chapter 18. “Additional studies” module.
Global photographs study.
•
Chapter 18. “Additional studies” module. Global photographs study.
•
After entering “New patient” (1.1, Fig.1) information (1.2) and filling out the “Outpatient
card” data (1.3) in order to proceed with the diagnostic session, click "Additional Studies”
module button (1.26). The “Additional Studies” section window (18.0, Fig.18) will open.
This module is intended to be used primarily for “Global photographs” study assessment to
evaluate performed treatment results and/or progress, however, any other images taken by
Diagnosis Scope, i.e. Trichoscope or any other microscopic or regular camera, e.g. any
specific scalp area changes, etc., may be uploaded and used per user discretion. If the patient
has been entered into the program already, select the name from “Patient’s name” list (1.15)
and proceed to the diagnostic session.
•
18.1 Conducting the “Additional Study” session.
•
In the opened “Additional studies” section window (18.0, Fig.18) press the "Scan" icon
(18.5), the image capture window will open. To perform before and after treatment
comparison, load the “before the treatment” image into the left window for “Image Nr.1” and
the “after the treatment” image into the right window for “Image Nr.2”. Images can be also
loaded from file by pressing appropriate icon (18.4). Any image files to be loaded into
program have to be located in the “Additional studies” folder that was created on the
desktop during installation. For convenient additional data management, for every new
patient entered into program a personal subfolder is created under the “Additional studies”
folder. Folder content can be previewed anytime by clicking "Additional studies” module
button (1.26, Fig.1).
•
NOTE: In case when it is necessary to save the image into a separate file, click "Save" icon
(18.6). Image will be saved into the “Additional studies” desktop folder. The image can also
be printed out by clicking the “Print” icon (18.7). After completing the session, check “To
report” checkbox (18.10) to have the obtained data saved into the “Summary report” (1.30,
Fig.1).
•
NOTE: To get a closer look on any image part in the left window, the size of it may be
increased. To do this, grab and drag with the mouse the separating border between windows.
To make left window larger drag it to the right ("Movable border" 18.9). Respectively,
when counting hair in the right window, increase the area of the window by moving the
border to the left.
•
NOTE: For more detailed view you can zoom into image to make it larger. To do this, click
on the "Adjust scale" icon (18.1). Place the mouse cursor on chosen image section and make
one or more clicks with the left mouse button. Degree of magnification for selected field of
view depends on the number of mouse clicks. If it becomes too high, click right mouse button
to return to previous step(s). In order to move to different magnified image section click on
on “Move” icon (18.2), than grab and drag it. To return the image to its original scale, click
“Scaling per window size” icon (18.3). Also "Choose frame" icon (18.8) allows
to obtain additional image(s) in the new window(s) added "on top" of the previous one.
www.TrichoSciencePro.com
50
Chapter 18. “Additional studies” module.
Global photographs study.
•
18.2 Ending session. Generating conclusion. “Performed Additional Studies”
module.
•
After completing the “Additional Studies” session, check “To report” checkbox (18.10) to
have data saved into “Summary report” (1.30, Fig.1). Click the "Conclusion/Print results"
module (18.0). Generated per session results report will open up behind session window as a
MS Word document file. This convenient format of reporting allows to add/edit/delete any
information within it per user discretion. Print the report and close it. You will be prompted to
save it before exiting. When finished, you can exit by closing the diagnostic session window.
You will be prompted to save session data. If you choose to save it, your diagnostic session
will be recorded and appear in “Performed Additional Studies” module (1.9, Fig.1) in the
form of date and time of the session. Any recurring patient sessions will be also recorded and
listed in the module if saved. Any of these sessions may be reviewed anytime. To choose the
session of interest right-click on the appropriate date, so it gets highlighted in blue.
Depending on what has to be viewed, specific diagnostic session itself or generated session
report, click on the "Load session" button (1.17) or the "Show report" button (1.18),
respectively. Other functions/settings are identical to described in paragraph 14.2 Ending
session. Generating conclusion. “Performed Trichograms” module.
18.0
18.4
18.1
18.2
18.3
18.7
18.8
18.6
18.5
18.9
18.10
Fig. 18
www.TrichoSciencePro.com
51
Chapter 19. “Conclusions and
Recommendations” module.
•
Chapter 19. “Conclusions and Recommendations” module.
•
After completing all diagnostic sessions, in order to proceed, click on “Conclusions and
Recommendations” module button (1.28, Fig.1) to open the “Conclusions and
Recommendations” window (19.0, Fig.19). This module is intended to record patient’s
specific diagnostic conclusions, results and applicable notes. It also offers extended listings of
common diagnoses and additional diagnostic tests, as well as mostly used topical, oral and
physical therapy products and practices, to choose from.
•
19.1 Conducting the “Conclusions and Recommendations” session.
•
In the opened “Conclusions and Recommendations” window (19.0, Fig.19) from the “List
of diagnoses“ section (19.2) select an applicable clinical case by marking up appropriate
checkbox, chosen diagnosis will be displayed in the right field. If proper diagnosis is not
listed, go to the “Diagnosis“ section (19.1) and type it in. Also any other important clinical
case related additional information may be entered in this field. Other sections of “Diagnostic
tests” (19.3), “Topical treatment” (19.4), “Oral therapy” (19.5) and “Physiotherapy”
19.6) allow to select applicable diagnostic and therapeutic activities from appropriate lists of
recommendations. The “Reference materials” section (19.7) offers selection of standard hair
loss and other classification diagrams as well as other useful data, used in “Questionnaire”
section (2.4, Fig.2) of the “Outpatient card” module (1.3, Fig.1). The “Search” engine
(19.8) allows to easily find various diagnostic and therapeutic activities available in the
program by entering applicable keyword into the search field.
•
NOTE: If any additional information has to be entered into modules’ sections (19.2-19.7), go
to the relevant section, place mouse cursor anywhere within information listings (19.9), and
click the right mouse button. From the opened menu (19.10) select the “Add” prompt to
open “Add record” window (19.11). Enter the new item name and in table’s “Add” section
choose where to place it. If you want to enter a new section title, click the checkbox on the
right. This will center the new record and make it bald. Click “OK” to save changes. You can
“Delete record” or “Download from file” any text files by selecting appropriate prompts. If
changes have to be applied to any existing item in the list, select it first by left-clicking the
mouse. You can edit information by using “Rename”, “Find”, “Move up” and “Move
down” prompts. Also there is “Detailed information” prompt, which is designated for
adding extended information to any listed items. By selecting this option, the empty MS Word
file will open allowing to conveniently enter any important information per user discretion.
Any information entered will be saved by default and an “i” icon will appear next to selected
item name. Thus, while viewing informational listings, it can be easily understood which
items have additional detailed descriptions. These descriptions may be deleted anytime by
using “Delete information” prompt.
•
19.2 Ending session. “Performed Conclusions and Recommendations” module.
•
After completing all appropriate sections you may Print, Download to MS Word, Close
(19.12) or save results into “Summary report” (1.30, Fig.1) by selecting "To report"
www.TrichoSciencePro.com
52
Chapter 19. “Conclusions and
Recommendations” module.
•
checkbox (19.13) in the lower right corner of the window. Click the "Download into MS
Word” button. Generated per session results report will open up behind session window as a
MS Word document file. This convenient format of reporting allows to add/edit/delete any
information within it per user discretion. Print the report and close it. You will be prompted to
save it before exiting. When finished, you can exit by closing the diagnostic session window.
You will be prompted to save session data. If you choose to save it, your diagnostic session
will be recorded and appear in “Performed Conclusions and Recommendations” module
(1.10, Fig.1) in the form of date and time of the session. Any recurring patient sessions will be
also recorded and listed in the module if saved. Any of these sessions may be reviewed
anytime. To choose the session of interest right-click on the appropriate date, so it gets
highlighted in blue and proceed with clicking on the "Load session" button (1.17) or the
"Show report" button (1.18). Other functions/settings are identical to described in paragraph
14.2 Ending session. Generating conclusion. “Performed Trichograms” module.
19.0
19.2
19.3
19.4
19.6
19.7
19.8
19.1
19.5
19.9
19.11
19.10
Fig. 19
www.TrichoSciencePro.com
19.12
19.13
53
Chapter 20. “Automatic conclusion”
function.
•
Chapter 20. “Automatic conclusion” function.
•
In order to proceed, click “Automatic Conclusion” function button (1.29, Fig.1). The
“Automatic Conclusion” window (20.0) will open. This function is implemented to
calculate for the differential diagnosis between most common Alopecia Androgenetica and
Telogen Effluvium hair loss diagnoses. Calculations are based on “Outpatient card” (1.3,
Fig.1) questionnaire information and “Trichoscopy” (1.20), “Phototrichogram” (1.21) and
“Trichogram” (1.22) sessions calculated data. This information, as well as other
subjective and objective data obtained during diagnostic sessions, is being collected and
processed in a specialized table, which assigns and counts specific points. For the conclusion
to be correct it is important to have questionnaire information completely filled out, as well as
various conducted measurement and calculation results, i.e. hair density, diameter, follicular
unit and perifollicular sign counts, Terminal/Vellus and Anagen/Telogen hair ratio assessment
data in various scalp locations, percentages of Vellus to Telogen hair numbers, etc. The total
results obtained in this table indicate the potential activity of each of these processes. Since
signs of Androgenetic and Diffuse Alopecia often coexist, this issue typically turns to be a
frequent cause of diagnostic difficulties. You may Print, Download to MS Word, Close
(20.1) or save results into “Summary report” (1.30, Fig.1) by selecting "To report"
checkbox (20.2) in the lower right corner of the window.
•
NOTE: One of the most frequent diagnostic difficulties is to distinguish Female Pattern Hair
Loss signs from Chronic Telogen Effluvium in women in the early stages of hair loss
development. In the early stages of Androgenetic Alopecia, despite the reduction in hair
density in the Parietal area, the total quantity of hairs within the Parietal area remains higher
than in the Occipital area. The average diameter of hairs in the Parietal area is also reduced,
but there are no significant changes in diameters of the hairs in the Occipital area. There is an
increase in the quantity of fine hairs in the Parietal area, as compared to the Occipital area
and there is a reduction in the quantity of thick hairs in the Parietal area, as compared to the
Occipital area. There is an increase in the percentage of Telogen hairs in the Parietal area, as
compared to the Occipital area. There is a pronounced condition of the Anisotrichosis and an
increased percentage of single follicular units in the Parietal area, as compared to the
Occipital area. Though it should be noted, that with appearance of the “Yellow Dots”,
indicating the presence of empty follicles, the calculation of percentage of Vellus hair
becomes impractical, as their quantity begins to decline since empty follicles in form of
“Yellow Dots” start to replace thinning hairs.
•
NOTE: An appearance of the “Spiky Hairs" indicates the intensity of hair loss, but does not
reflect progressive hair thinning. The progressive thinning of hair is best reflected by the
Anisotrichosis value and the proportion of Vellus hairs in Telogen phase.
www.TrichoSciencePro.com
54
Chapter 20. “Automatic conclusion”
function.
20.0
Fig. 20
20.1
20.2
•
Chapter 21. “Summary report” function.
•
After completing all diagnostic sessions and studies, as well as generating conclusions and
reports for the patient, in order to proceed, click “Summary report” function button (1.30,
Fig.1). When prompted (21.0) to select components for the report, choose the items you want
to be included into report, i.e. Trichoscopy, Phototrichogram, Trichogram, Dermatoscopy,
Hair calculator, Hospital Anxiety and Depression Scale, Additional Studies, Conclusions
www.TrichoSciencePro.com
55
Chapter 21. “Summary report”
function.
and Recommendations, Automatic Conclusion (21.1). When finished click “OK” (21.2).
The “Summary report” will be generated as MS Word document file.
•
NOTE: “Summary report” may include any patient images stored in “Additional Studies”
folder on the desktop. To do this click "Additional Studies” button (1.26), locate and open
images, that you plan to include into report. Place the cursor within the open image field,
right-click the mouse and select “To report” when prompted. The image will be stored
within the report and will remain in it anytime the new “Summary report” is generated.
21.0
21.1
Fig. 21
21.2
•
21.1 “Set template for report” function.
•
The “Set template for report” function (1.31, Fig.1) is designated for cases, when it is
necessary to print out “Summary report” or any other reports on the specific preset
forms with the company or institution name, address and other information on it. The
template file should be a document in the MS Word 97-2003 (.doc) file format. If you wish
the report content to be printed out within specific area of the template, mark this area on
template with “$$$$”. If no mark up is present, the report will be built and attached to the end
of the template.
www.TrichoSciencePro.com
56
www.TrichoSciencePro.com