1
Technical Report No. 25: The WRF Greenhouse Gas Model
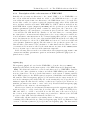
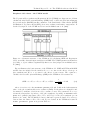
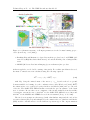
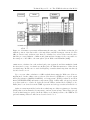
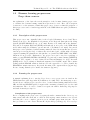
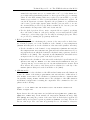
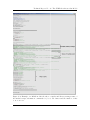
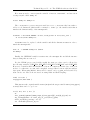
Figure 2.3: Schematic representation illustrating the structure of the Walter wetland model
with the position of the water table, soil temperature, and NPP as input of the model. The
CH4 production and oxidation rates that are calculated at each soil layer and the three
different processes (diffusion, ebullition and plant-mediated transport) are responsible for
the transport of the CH4 to the atmosphere (from Walter and Heimann [2000]).
emissions are calculated at each wetland grid point separately and then multiplied with
the fractional coverage of wetland area in that grid cell. This information is obtained from
a wetland map. In this case we used the Kaplan potential wetland map that was already
described in Sec. 2.3.1.
Up to now an online calculation of CH4 wetland fluxes using the Walter model is not
implemented, but the offline version of the model is driven by WRF meteorological output
fields (Precipitation (RAINC+RAINNC), soil temperature (TSLB), radiation and heat
fluxes (SWDOWN,GLW) and surface temperature (T2)). Additionally, soil and vegetation
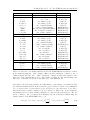
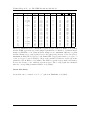
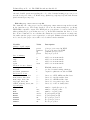
properties such as root and soil depth used in the Walter wetland model [Walter et al.,
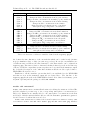
2001a] have been derived from the WRF vegetation and soil types as shown in Table 2.7.
Other necessary input fields besides the wetland map are daily net primary productivity
(NPP) values, mean annual soil temperature, and an elevation map. These maps (except
for the wetland map) are gridded from the Walter et al. [2001a] version to the WRF model
grid and missing values are filled in as described in Sec. 3.3.
23