1
U s e r M a n ua l
User Manual
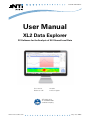
XL2 Data Explorer
PC-Software for the Analysis of XL2 Sound Level Data
Doc version
Refers to SW
1.4.0/0e
v1.4.0 or higher
NTi Audio AG is
an ISO9000:2008
certified company
www.nti-audio.com
July 15 / MBe
Contents
3
Table of Contents
Part I
5
Introduction
1 Installation ................................................................................................................................... 6
2 Software structure
................................................................................................................................... 7
3 Tutorial
................................................................................................................................... 9
4 License agreement
................................................................................................................................... 16
Part II
19
Project view
1 Data import................................................................................................................................... 21
2 Preferences
................................................................................................................................... 24
3 Project info................................................................................................................................... 26
Part III
28
Chart view
1 Overview chart
................................................................................................................................... 31
2 Audio bar &...................................................................................................................................
player
32
3 Setup Levels
................................................................................................................................... 33
4 Audit Intervals
................................................................................................................................... 35
37
5 Main chart,...................................................................................................................................
Info section
6 Spectrogram,
RTA spectrum
...................................................................................................................................
39
7 Cursor
................................................................................................................................... 42
8 Zoom & pan
................................................................................................................................... 44
9 Markers
Part IV
................................................................................................................................... 45
48
Result view
1 Markers (in...................................................................................................................................
Result view)
49
...................................................................................................................................
50
2 Audit Intervals
(in Result view)
Part V
Level Calculations
52
1 Level statistics
................................................................................................................................... 52
Percentiles
.......................................................................................................................................................... 54
2 Day Night Level
................................................................................................................................... 55
LDEN exam ples
Part VI
Reporting
.......................................................................................................................................................... 56
60
................................................................................................................................... 60
1 Report properties
2 Report printout
................................................................................................................................... 61
3 Data Export................................................................................................................................... 62
Index
© 2015 NTi Audio AG, MBe
63
Part
I
Introduction
1
5
Introduction
The XL2 Data Explorer is a PC-based software application with a powerful data processor for easy and
fast analysis of sound level measurement data. Visualize, analyze and control millions of data points with
this tool that is dedicated to acoustic consultants and noise measurement professionals. It provides a
convenient way to view and manage your data and quickly create professional customized reports.
Visualization of the entire data set including spectrogram.
Very fast zoom and pan response over the entire log.
Timeline for audio files and synchronized playback including proper leveling.
Exclude markers eliminate unwanted areas from the level calculations.
Include markers allow level calculations of specific areas.
Visualization of recorded events analyze and report only the noise infringements.
Audit interval and percentile LN calculation
Results are immediately visible as recalculations are executed on the fly.
Report and customize your results simply and professionally.
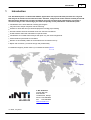
For dedicated support, please contact your nearest NTi Audio partner.
© NTi Audio AG
Im alten Riet 102
9494 Schaan
Liechtenstein, Europe
Phone +423 239-6060
Fax +423 239-6089
www.nti-audio.com
v1.40/0e, July 2015
© 2015 NTi Audio AG, MBe
6
XL2 DataExplorer User Manual
1.1
Installation
System requirements
Supported operating systems:
o Windows XP SP3
o Windows Vista SP1 or later
o Windows 7
o Windows 8 Pro or 8.1 Pro
Hardware requirements:
o Recommended Minimum: Pentium 1 GHz or higher with 512 MB RAM or more
o Video board with shader model 3.0 or higher (DirectX 9.0c)
Minimum disk space: 2 GB
Hint
Result data that is exported from the XL2 Data Explorer to MS Excel is saved in "*.xlsx" format.
Please check the compatibility of your MS Office installation with this file format, and install the
Microsoft Compatibility Pack if necessary.
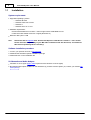
Software installation procedure
1. Access your personal account in My NTi Audio
2. Download the XL2 Data Explorer installation package
3. Double left-click on the installation file
XL2 Acoustic and Audio Analyzer
Firmware V2.70 or higher (legacy data require minimum firmware V2.32 or higher)
XL2 Data Explorer Option installed on the XL2 device (if you don't have the Option yet, contact your nearest NTi
Audio partner).
© 2015 NTi Audio AG, MBe
Introduction
1.2
7
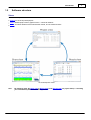
Software structure
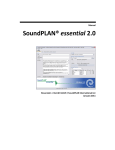
Views
The XL2 Data Explorer offers three different views,
Project: list of the imported projects
Chart: detailed project data in graphical form + numerical readouts
Result: numerical readout of the measurement results, and of marked sections
XL2 Data Explorer views
Hint
By switching from the Chart view or Result view to the Project view, all project data (i.e. including
your amendments) will be automatically saved.
© 2015 NTi Audio AG, MBe
8
XL2 DataExplorer User Manual
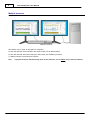
Multiple instances
It is possible to run two or more instances of the XL2 Data Explorer on one PC.
Multiple instances
This feature may be used, for example, for comparing
a) XL2 Test files that were recorded in the same location, but at different dates,
b) XL2 Test files that were record during the same event, but at different positions,
c) different sections of the same XL2 Test file.
Hint
A project file that is simultaneously open in two instances, can be edited only in the first instance.
© 2015 NTi Audio AG, MBe
Introduction
1.3
9
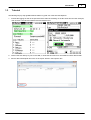
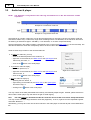
Tutorial
The following step-by-step guideline demonstrates a typical use of the XL2 Data Explorer.
1.
Activate the logging as well as the spectra and the audio file recording on the XL2 Audio and Acoustic Analyzer,
then execute a sound level measurement and save the test.
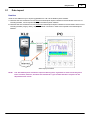
2.
Connect the XL2 directly to your PC via USB, or insert the SD-card into a card reader for faster data transfer.
3.
Run the XL2 Data Explorer and click on the 'Import' button in the Projects view.
© 2015 NTi Audio AG, MBe
10
XL2 DataExplorer User Manual
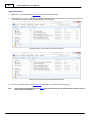
4.
Select the XL2 Test file just recorded and click 'Open'. The XL2 Data Explorer imports the logged data and audio
file; this procedure can take a few seconds to some minutes, depending on the file sizes. During this process,
all relevant files (including the WAV file associated with the selected project) are copied into the Data Explorer
project folder.
5.
As soon as the import process is completed, select the imported project and click on the 'Open' button to open
it in the Chart view.
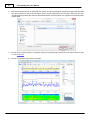
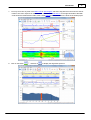
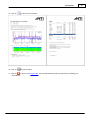
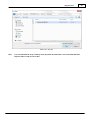
6.
You can now view the level curves and results.
© 2015 NTi Audio AG, MBe
Introduction
11
7.
You may zoom into any area of the Main chart or Spectrogram: left-click+drag with the mouse over the area of
interest. The zoom response is instantaneous. In addition, the Info section on the right-hand side of the Main
chart shows the instantaneous levels at the current Cursor position, as well as the result of the whole project.
8.
Click on the button
© 2015 NTi Audio AG, MBe
, and then on
to display the large RTA spectrum.
12
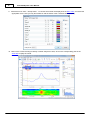
9.
XL2 DataExplorer User Manual
Select the menu 'View -> Setup Levels...' to choose which levels are displayed in the Main chart, and select the
appropriate colors. Here you may also enable or edit the values of the correction factors (k1, k2).
10. Listen to the sound recording to identify or further analyze an event; click on the corresponding point in the
Audio bar to replay the sound.
© 2015 NTi Audio AG, MBe
Introduction
13
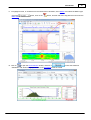
11. To highlight an area, or exclude it from the overall result calculation, add a Marker: first select the Marker type
using the
button, click on the
Main chart to add the Marker.
button, and then left-click+drag with the mouse over the
12. Click on
to open the Level statistics window, and then on
distribution of dt values in a graph, as well as the Percentile results in a table.
© 2015 NTi Audio AG, MBe
to show the statistical
14
XL2 DataExplorer User Manual
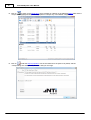
13. Click on
to switch to the Result view, which provides an overview on the individual Marker data and the
Project result (highlighted row). You may expand or collapse any of the Marker categories.
14. Click on
to edit the Report properties: tick the checkboxes for the parts to be printed, edit the
corresponding text and optionally Browse to add your own logo.
© 2015 NTi Audio AG, MBe
Introduction
15. Click on
to verify the Print preview.
16. Click on
to print the report.
17. Click on
to return to the Project view; this step automatically saves all project data, including your
amendments.
© 2015 NTi Audio AG, MBe
15
16
1.4
XL2 DataExplorer User Manual
License agreement
Scope
This End-User License Agreement (“EULA”) is a legal agreement between you (either an individual or a single entity)
and NTi Audio AG (“NTi Audio”). By installing or using the NTi Audio software, content or documentation (collectively
the “NTi Audio software”) accompanying this EULA, you accept these terms and are consequently bound to them. If
you do not agree to the terms of this EULA, do not install or use the NTi Audio software.
The NTi Audio software is licensed, not sold, to you by NTi Audio for use only under the terms of this license
agreement. This EULA only gives you some rights to use the software. You may use the software only as expressly
permitted in this EULA.
This EULA also applies for all upgrades or updates to the NTi Audio software (if any), supplements, internet-based
services, and support services for this NTi Audio software, unless other terms accompany those items. If so, those
terms will govern.
License Uses and Restrictions
A. Software Installation: Subject to the terms and conditions of this license agreement, you are granted a limited,
non-exclusive license to use and run the NTi Audio software. Data transfer from an XL2 Audio & Acoustic analyzer
to the NTi Audio software is only enabled if the corresponding license is installed on the analyzer.
B. No Reverse Engineering: You may not and you agree not to, or to enable others to, copy (except as expressly
permitted by this license agreement or by the usage rules if they are applicable to you), publish, distribute,
decompile, reverse engineer, disassemble, attempt to derive the source code of, decrypt, modify, or create derivative
works of the NTi Audio software or any services provided by the NTi Audio software, or any part thereof.
C. Termination: This license is effective until terminated. Your rights under this license agreement will terminate
automatically or otherwise cease to be effective without notice from NTi Audio if you fail to comply with any term(s)
of this license agreement. Upon the termination of this license, you must cease all use of the NTi Audio software
and destroy all copies, full or partial, of the NTi Audio software.
Services
The NTi Audio software may enable access to NTi Audio and third party services and web sites (collectively and
individually, “NTi Audio services”). Such NTi Audio services may not be available in all languages or in all countries.
Use of these NTi Audio services requires internet access and use of certain NTi Audio services may requires an NTi
Audio ID, may require you to accept additional terms and may be subject to additional fees. By using this software
in connection with an NTi Audio ID or other NTi Audio account, you agree to the applicable terms of service for that
account.
Disclaimer
A. NTi Audio and all our affiliates do not give any warranty, guarantee or conditions for this software, i.e. you bear
the sole risk of using it. This limitation applies to anything related to this software, including breach of contract,
warranty, guarantee or condition, strict liability, negligence or other tort to the extent permitted by applicable law. It
also applies if NTi Audio knew or should have known about the possibility of the damages.
B. The NTi Audio software and services are provided “as-is”, i.e. with all faults. You bear the sole risk of using it. NTi
Audio gives no express warranties, guarantees or conditions. NTi Audio excludes the implied warranties of
merchantability, fitness for a particular purpose and non-infringement.
C. You acknowledge that the NTi Audio software and services are not intended or suitable for use in situations or
environments where the failure or time delays of, or errors or inaccuracies in the content, data or information
provided by the NTi Audio software or services could lead to death, personal injury, or severe physical or
environmental damage, including without limitation the operation of nuclear facilities, aircraft navigation or
communication systems, air traffic control, life support or weapons systems.
D. No oral or written information or advice given by NTi Audio or an NTi Audio authorized representative shall create
a warranty. Should the NTi Audio software or services prove defective, you assume the entire costs of all necessary
servicing, repair or correction.
© 2015 NTi Audio AG, MBe
Introduction
17
E. In no event shall NTi Audio be liable for personal injury, or any incidental, special, indirect or consequential
damages whatsoever, including, without limitation, damages for loss of profits, loss of data or information, business
interruption or any other commercial damages or losses, arising out of or related to your use or inability to use the
NTi Audio software or services or any third party software or applications in conjunction with the NTi Audio software
or services, however caused, regardless of the theory of liability (contract, tort or otherwise) and even if NTi Audio
has been advised of the possibility of such damages. In no event shall NTi Audio’s total liability to you for all
damages exceed the amount of ten US dollars (USD 10.00). The foregoing limitations will apply even if the above
stated remedy fails of its essential purpose.
Separate Provisions
If any provision of this EULA shall be held to be invalid, illegal or unenforceable, the validity, legality and
enforceability of the remaining provisions shall in no way be affected or impaired thereby.
Privacy
At all times your information will be treated in accordance with NTi Audio’s privacy policy, which is incorporated by
reference into this license agreement and can be viewed at http://www.nti-audio.com/privacy-statement
Controlling Law
This license agreement will be governed and construed in accordance with the laws of Liechtenstein, Europe,
excluding its conflict of law principles. No amendment to or modification of this EULA will be binding unless in
writing and signed by NTi Audio. The English version of this EULA shall govern, to the extent not prohibited by local
law in your jurisdiction.
© 2015 NTi Audio AG, MBe
Part
II
Project view
2
19
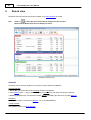
Project view
The Data Explorer always starts up in the Project view. The Project view is also accessible from the Chart or Result
views by clicking the
button.
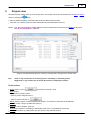
After the initial installation, the Project view shows the 'Demo Projects' folder.
From then on, it always opens the same folder that had been selected the last time.
NOTE
The XL2 unit must have a Data Explorer Option installed to allow the direct import of XL2 Test
files to the Data Explorer software.
Projects view with imported projects sorted by recording date, and right-click context menu
Hint
Click on any column title to sort the projects in ascending or descending order.
Right-click on any column title to amend the selection of displayed columns.
Direct actions
Import project: click on
and select an XL2 file (*.XL2)
Open project:
o double-click on project name
o select a project and press Ctrl+O
o select a project and click on
Delete: select a project or folder and press Del (NOTE - All contents of the folder will be deleted!)
Rename: select a project or folder and press F2
Refresh the list of projects: press F5
Organize the projects in ascending or descending order: click on the preferred column title
Arrange the columns by moving them with the mouse to the preferred position
© 2015 NTi Audio AG, MBe
20
XL2 DataExplorer User Manual
Copy to: right-click on a project and select 'Copy To...'
New folder: right-click in the Project view and select 'New Folder...'
Up one folder level: click on
Change working folder: click on
Create new folder: click on
Save project
All amendments to an open project (e.g. Markers, layout of the Chart view or Result view) are automatically saved.
Furthermore, upon returning to the Project view, the project file (*.xldb) is closed. Consequently, if you want to
restore a previous project status, you may either
manually undo every amendment,
or restore an older version of the project file on your PC.
Copy project
You can copy & paste a Data Explorer project e.g. to another location, and open the copy if the PC has the XL2
Data Explorer software installed.
© 2015 NTi Audio AG, MBe
Project view
2.1
21
Data import
Data flow
There are two different ways to import logged data from a XL2 to the Data Explorer software.
A. Test files that were recorded on an XL2 with the Data Explorer Option installed on the XL2 device at the time of
recording the data, can be imported directly to the Data Explorer software.
B. Test files that were recorded on an XL2 without the Data Explorer Option installed on the XL2 device at the time of
recording the data ("Legacy data"), require an internet connection in order to be imported to the Data Explorer
software.
Data import procedures
NOTE
The XL2 Data Explorer allows the import of XL2 log files, regardless in which mode they have
been recorded; however, this does not include the "cycle results" that were acquired in the
'Repeated Timer' mode.
© 2015 NTi Audio AG, MBe
22
XL2 DataExplorer User Manual
Import procedure
1.
Define the Y-axis and percentile preferences for imported files (optional).
2.
Connect the XL2 to your PC with the Data Explorer software via the USB interface, or insert the SD-card into a
card reader, and copy the required XL2 test files to the hard disk.
Example of XL2 Test files with continuous audio file
Example of XL2 Test files with segmented audio files
3.
Click on the 'Import' button in the Project view and select the *.xl2 test file to be imported.
Hint
It is strongly recommended that you copy the XL2 test files to the PC hard disk first, and then import
them into the Data Explorer.
© 2015 NTi Audio AG, MBe
Project view
Select XL2 Test file
Hint
It is recommended to keep a backup of the imported XL2 Test files or the converted XL2 Data
Explorer files in case of loss of data.
© 2015 NTi Audio AG, MBe
23
24
2.2
XL2 DataExplorer User Manual
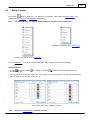
Preferences
The 'Preferences' feature allows you to customize some default settings according to your demands, e.g. the
displayed level or RTA curves, the Main chart Y-axis scale, the default percentiles or the Day Night Level periods.
The customized default settings
a) are automatically applied on all XL2 projects that are subsequently imported,
b) may be applied individually by manual interaction on selected older XL2 projects.
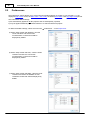
To define the default settings, select the menu 'File
Preferences...' in the Project view.
a) Select 'Setup Levels' and 'SLMeter', clear the
'Chart' checkbox and tick the level
measurements or results that shall be
displayed by default.
b) Select 'Setup Levels' and 'RTA', clear the 'Chart'
checkbox and tick the 1/3rd octave
measurements or results that shall be
displayed by default.
c) Select 'Setup Levels' and 'Math', clear the 'Chart'
checkbox and select the SLMeter or RTA
calculation results that shall be displayed by
default.
© 2015 NTi Audio AG, MBe
Project view
25
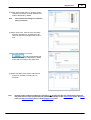
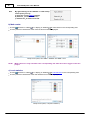
d) Select 'Setup Levels' and 'LN', clear the 'Chart'
checkbox and select the Level Statistics that
shall be displayed by default.
Hint
The 'Preferences' settings are limited to
seven percentiles.
e) Select 'Chart View', clear the 'Auto' checkbox
and enter the Minimum and Maximum dB
values for the lower and upper ends of the Yaxis.
f) Select 'Level Statistics' and press
to edit the percentiles that
shall be calculated and displayed by default,
and/or edit the scaling of the graph axes.
g) Select 'Day Night Level' and the edit the time
scheme or penalties according to your
demands.
Hint
Changes of the preference settings are applied on all XL2 log files that are subsequently imported.
The preferences of older projects may be updated individually via the Setup Levels panel, the Zoom
panel, the Edit percentiles panel or the Day Night Level panel.
© 2015 NTi Audio AG, MBe
26
XL2 DataExplorer User Manual
2.3
Project info
As soon as an XL2 test file has been imported to the Data Explorer, it becomes a Data Explorer Project with the
following content:
Logged level data
Recorded audio file (if applicable)
Project info (see below)
Events (Markers) created by the XL2 or by the user from within the Data Explorer
Report properties
List of level measurements
Expansion level / layout of Result view (also after exit & re-enter)
Hint
To re-establish the original status of a Data Explorer Project after you have amended the data,
simply re-import the *.XL2 Test file
Project Info pop-up
In the Chart or Result view, you may move the cursor to the left bottom corner of the XL2 Data Explorer window to
open the Project Info pop-up.
The Project Info pop-up contains the following list of non-editable information.
Project info pop-up (example)
Hint
Please refer also to chapter Report properties
© 2015 NTi Audio AG, MBe
Part
III
28
3
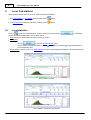
XL2 DataExplorer User Manual
Chart view
The chart view contains the Overview chart, Audio bar & player, Main chart & info section, Spectrogram with RTA
spectrum and the Project info.
Default chart view
Chart view with large RTA spectrum
© 2015 NTi Audio AG, MBe
Chart view
Buttons
Icon
Description
Return to Project view
Switch to Chart view
Switch to Result view
Select the levels to be displayed
Print the project report
Preview the project report
Open the Report properties
Change the layout of the chart view: Main chart only / with Spectrogram / with large RTA
spectrum
Zoom by Date Time
Zoom In
Zoom Out
Zoom All out
Pan left
Pan right
Edit the name, function or color of the Markers
Add a Marker
Select the type of a new Marker
Open the Level statistics window
Open the Day Night Level window
© 2015 NTi Audio AG, MBe
29
30
XL2 DataExplorer User Manual
Time axes
The time axes always show the absolute date & time as recorded by the XL2 at the time when the level data was
acquired.
The time axis of the Overview chart always shows the full recorded period.
The time axis of the Audio bar, Main chart and Spectrogram automatically adapts to the current zoom range.
Separator
The separator line between the Main chart and the Spectrogram can be shifted vertically, adjusting the height of the
graphs.
Project info
A pop-up with the Project info opens as soon as the cursor is moved over the XL2 serial number / firmware version in
the left bottom corner of the Chart view.
© 2015 NTi Audio AG, MBe
Chart view
3.1
31
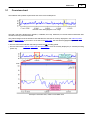
Overview chart
The Overview chart provides a permanent view of the full recorded period.
Overview chart with highlighted zoom range
The level curve that is displayed by default is, if available, the LAeq. Otherwise, it's the first level measurement data
recorded in the log of the XL2 Test file.
The yellow background of the Overview chart indicates the area that is currently displayed in the Audio bar, Main
chart and Spectrogram. If you zoom in to an area in the Main chart, the area will be highlighted in yellow in the
Overview chart.
The time axis of the Overview chart always shows the full recording period.
The time axis of the Audio bar, Main chart and Spectrogram cover the currently displayed (i.e. zoomed) recording
period only.
Example of Overview chart, Audio bar and Main chart
© 2015 NTi Audio AG, MBe
32
3.2
XL2 DataExplorer User Manual
Audio bar & player
NOTE
The Audio bar is only shown if the audio log was switched on in the XL2 at the time of data
acquisition.
Example of a continuous Audio bar
Example of a segmented Audio bar
The Audio bar is normally continuous, but can also be segmented. For example, if the XL2 'Log Audio' mode was
switched to 'Events Only'. Furthermore, longer audio recordings will be concatenated, as the maximum file size for
an audio log is restricted to approx. 500 MB (= 1 hour full audio, or 12 hours compressed audio).
The area displayed in the Audio bar always corresponds to the content of the Main chart (i.e. the zoomed area). The
vertical lines below the Audio bar consequently refer to the time scale of the Main chart, too.
There are three ways to listen to the recorded audio file.
a. To replay the audio file, you may
o click on the desired position in the audio bar, or
o right-click on the Audio bar, the Main chart or the Spectrogram and
select 'Play from here', or
o click on the
button of the Audio player.
b. To pause the audio file replay,
o press the 'Space' bar, or
o right-click on the Audio bar, the Main chart or the Spectrogram and
select 'Pause', or
o click on the
Right-click context menu
button of the Audio player.
c. Stop the audio file replay by
o pressing the 'Esc' button, or
o right-clicking on the Audio bar, the Main chart or the Spectrogram
and select 'Stop', or
o clicking on the
button of the Audio player.
Audio player
You may switch off the AGC (Automated Gain Control), and manually adjust the gain. However, please note that in
this mode the Audio player may still reduce the gain to avoid clipping.
Hint
The AGC cannot be switched off if the XL2 audio file was recorded in the mode 'Compressed+AGC'.
You may access the WAV file(s) behind the Audio bar (segments). To do so, right-click on the requested segment
and select 'Browse to ...'.
Alternatively, you may also hover over the time indicator in the Audio player to read the file path of the related WAV
file.
© 2015 NTi Audio AG, MBe
Chart view
3.3
33
Setup Levels
Click on the
button or press Ctrl + L to select the sound levels, math results and level statistics to be
displayed in the Chart view and Result view respectively.
Hint
The displayed levels are selected independently for the Chart and the Result view.
Example of available levels in Result view
Example of available levels in Chart view
Click on 'Advanced...', to open the 'Setup Levels' panel, which provides access to more settings.
a) Sound levels
Tick the
checkbox to select
corresponding view.
(i.e. display) or deselect
all level or RTA curves and results in the
Tick the particular checkboxes of the levels, RTA spectra or correction factors k1, k2 that shall be displayed.
Edit the values of the correction factors k1, k2.
Setup Levels panel, tabs 'SLMeter' and 'RTA'
Hint
Activate an Audit Interval if required (optional)
© 2015 NTi Audio AG, MBe
34
XL2 DataExplorer User Manual
Hint
By right-clicking on the 'SLMeter' or 'RTA' Setup
Levels panel you may
a) apply the current default settings,
b) select all _dt values in the list,
c) deselect all _dt values in the list.
b) Math results
Tick the
checkbox to select
(i.e. display) or deselect
all math results in the corresponding view.
Tick the particular checkboxes of the math results that shall be displayed.
Setup Levels panel, tabs 'Math / SLMeter' and 'Math / RTA'
NOTE
'Math' values are only available if the corresponding raw data have been logged in the XL2
project.
c) Level statistics
Tick the
checkbox to select
(i.e. display) or deselect
all level statistics in the corresponding view.
Tick the particular checkboxes of the level statistics that shall be displayed.
Setup Levels panel, 'LN' (level statistics)
© 2015 NTi Audio AG, MBe
Chart view
3.4
35
Audit Intervals
The 'Audit Intervals' feature allows to divide the log data in measurement intervals (segments) of selectable length.
These intervals are always synchronized with the time of the day.
For instance, the 15' audit interval would divide a recording from 08:12 to 09:05 into following intervals: 08:12
08:15
08:30
08:45
09:00
09:05.
The selected measurement results are then displayed for every interval in the Main chart and in the Result view.
Hint
The 'Audit Intervals' feature is available regardless in which mode the data had been logged on the
XL2.
To activate the 'Audit Intervals' feature, open the 'Setup Levels' panel, select the required interval duration and press
'OK'.
Selection of audit interval
© 2015 NTi Audio AG, MBe
36
XL2 DataExplorer User Manual
Example of Chart view with audit interval = 5'
Example of Result view with audit interval = 5'
© 2015 NTi Audio AG, MBe
Chart view
3.5
37
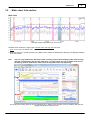
Main chart, Info section
Main chart
Example of Main chart with Level, RTA curves
The Main chart shows the curves of the selected levels and RTA data over time.
Zoom in to or out of a specific area.
Move the cursor to a specific position in the Main chart to read the instantaneous value(s) of the displayed level(s)
in the Info section.
Hint
There is a gap between the start point of the recording, and the first sample(s) of the result curve(s).
This gap corresponds to the XL2 log "Interval dt". The first results are only available at the end of
the first log interval, whereas the audio file recording starts at the very beginning.
The audio file recording starts at the very beginning (0 s), while the first samples are only available after the first
logging interval dt has elapsed (10 s)
© 2015 NTi Audio AG, MBe
38
XL2 DataExplorer User Manual
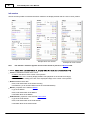
Info section
The Info section provides contextual information related to the displayed levels and the current cursor position.
Example #1 of Info section
Example #2 of Info section
Hint
Example #3 of Info section
The "Marker" extension appears as soon as the mouse is placed on a Marker band.
Offset
Cursor: instantaneous values of the cursor
o Position: date & time of the current cursor position
o Time resolution of the currently-displayed Main chart (depends on the actual zoom range)
o The instantaneous value(s) and color of the displayed level(s) at the current cursor position
Result: absolute result data
o Start, End and duration of the whole recording
o The Results (i.e. all recorded values minus the excluded Markers)
Marker: properties of the selected Marker
o Type of the Marker
o Start, End and duration of the Marker
o Level data values of the Marker
Audit Interval: properties of the selected Audit Interval
o Type of the Audit Interval
o Start, End and duration of the Audit Interval
o Level data values of the Audit Interval
© 2015 NTi Audio AG, MBe
Chart view
3.6
39
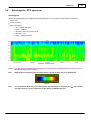
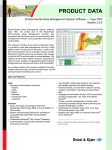
Spectrogram, RTA spectrum
Spectrogram
The Spectrogram displays the logged spectra of the XL2 test (i.e. sound level at each frequency over time).
X-axis: time
Y-axis: frequency
Color: sound level
o red = highest level value
o green = medium
o turquoise = 50% of maximum level
o dark blue = low
o black = lowest level value
Example of Spectrogram
NOTE
The Spectrogram and the RTA spectrum are only available if "Add Spectra" was set to "Yes" in
the XL2 during the data logging.
Hint
Right-click in the Spectrogram and select 'Show Legend' to show the color assignments.
Legend
Hint
You may edit the RTA-axis via the Zoom panel and thus define an absolute level
This may improve e.g. the comparison of the spectra of different projects.
© 2015 NTi Audio AG, MBe
color scheme.
40
XL2 DataExplorer User Manual
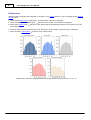
RTA spectrum
The RTA spectrum displays the LZeq level vs. frequency of the cursor position; it may be enlarged via the 'Change
Layout' button.
i. Cursor outside Main chart / Spectrogram
ii. Cursor over Main chart or Spectrogram
iii. Cursor over a Marker label
RTA spectrum)
overall project spectrum is displayed
spectrum at the current cursor position is displayed
spectrum of the marked area is displayed (Hint: Mark er color applies also to the
iv. Cursor locked to all markers of the same type
v. Cursor locked to Audit Interval
spectrum of all markers of the same type is displayed
spectrum of the selected area
Different RTA spectrums displayed (default size) with different cursor positions (i, ii, iii, iv, v)
© 2015 NTi Audio AG, MBe
Chart view
41
In addition, the RTA spectrum provides individual level/frequency information both numerically (on top of the graph),
and graphically with a red bar.
a) Move the cursor over the RTA spectrum or Spectrogram
b) Lock the cursor in the Main chart or on a Marker label, then move it over the RTA spectrum.
RTA spectrum with readout: default size (above) / large size (below)
© 2015 NTi Audio AG, MBe
42
XL2 DataExplorer User Manual
3.7
Cursor
The cursor (mouse pointer) can be used to perform several actions:
Readout the instantaneous level results (-> info section) or level & frequency (-> RTA spectrum)
Zoom & pan
Start audio file replay: right-click on the required start point in the Main chart or Spectrogram, then select 'Play
from here'
Readout
The info section shows the instantaneous level or spectrum of the cursor position in the Main chart or Spectrogram.
If the cursor is located in the Main chart, the info section shows the corresponding level values. In
addition, the intersection(s) of the cursor and the displayed curve(s) are highlighted by a small "x".
If the cursor is located in the Spectrogram, the frequency and the level value that corresponds to the
actual cursor position is also shown in the Info section.
Cursor color
The default cursor color is red. While the audio file is playing, the cursor is blue.
Zoom-in/-out, pan
Zoom-in:
o select the zoom area with left-click+drag over the target area of the Main chart or Spectrogram, or
o use the scroll wheel of your mouse.
Zoom-out:
o double left-click on the Main chart or Spectrogram, or
o use the scroll wheel of your mouse.
Pan:
o Overview chart, place the cursor on the zoom range (yellow area) then left-click+drag
o Main chart or Spectrogram, press Ctrl+left-click+drag
Lock cursor
The cursor position can be locked by right-clicking in the Main chart or Spectrogram, or over a Marker label, or in an
Audit Interval. The RTA spectrum consequently shows the spectrum at the corresponding cursor position, or of the
marked area.
Lock cursor ...
RTA spectrum
a) ... in the Main chart
b) ... to a single Marker
of the specific cursor position
of the marked area
c) ... to all Markers of a specific type
of the combined Marker areas
d) ... in the Spectrogram
of the specific cursor position
e) ... to an Audit Interval
of the marked area
Hint
A locked cursor is indicated by a
in the Info section.
When printing a report, the values of the locked cursor appear in the printout below the charts.
© 2015 NTi Audio AG, MBe
Chart view
To unlock the cursor,
press Esc
click on
in the Info section
right-click and select "Lock cursor" again
lock the cursor at a new position
© 2015 NTi Audio AG, MBe
43
44
XL2 DataExplorer User Manual
3.8
Zoom & pan
Zoom
There are several ways to zoom:
Click on the
,
buttons to zoom in/out,
Place the cursor in the Main chart or Spectrogram, then
o left-click+drag to the end position of the required zoom range,
o use the scroll wheel of your mouse to zoom in/out.
Click on the
button to open the Zoom panel, and manually edit the X-axis zoom range, Y-axis scale and the
RTA-axis color scheme:
Zoom panel
Hint
The Y-axis scaling may be adjusted to a predefined default via the preferences. To adjust the Y-axis
of an XL2 Test file that has been previously imported, right-click on the Y-axis section of the Zoom
panel and select 'Default'.
Return to the overall view:
o click on
,
o double click on the Main chart,
o right-click on the Main chart or Spectrogram and select 'Zoom All Out'.
Pan
When you are zoomed in, there are several ways to pan:
Click on the
or
button.
Press the left / right arrow on the PC keyboard.
Click on the zoom range in the Overview chart and move it with the mouse.
Press Ctrl+left-click in the Main chart or Spectrogram and move the zoom range with the mouse
© 2015 NTi Audio AG, MBe
Chart view
3.9
45
Markers
Markers are a very helpful way to
exclude user-defined areas of the recording from the overall result calculation,
and highlight specific events that occurred during the recording.
Markers are either logged by the XL2 during the recording, or manually added by the user within the Data Explorer.
Every Marker is displayed as a colored band in the Main chart.
Irrespective of how it was created, any Marker may be edited or deleted by the user.
Marker types
The XL2 Data Explorer supports eleven (11) different Marker types, which are by default labeled "Exclude" and
"Marker 1...10". The name and color of each of these Marker types may be edited. Also, you can choose whether
each Marker type should be Excluded from the Result calculation.
Click on
to open the 'Define Marker Types' panel.
Example of edited Mark er types
The panel shows the 11 Marker types.
Double left-click on any entry in the first column to edit the corresponding Marker Name (consequently the name
of all Markers of this type in the Main chart or Result view will be amended).
Tick the checkbox in the second column to exclude all Markers of this type from the level result calculation.
Amend the color of any Marker type via the corresponding dropdown menu.
Hints
The level data of an excluded Marker is not considered for the overall level result calculation.
In the Main chart, every excluded Marker is identified by a "–" (minus) sign in front of its name.
© 2015 NTi Audio AG, MBe
46
XL2 DataExplorer User Manual
If Markers were set by the XL2 unit during the recording, they are assigned and labeled as follows:
Marker 4
Pause: the XL2 recording had paused for a while
Marker 5
Lvl: the XL2 input level exceeded the user-defined threshold
Marker 6..9
Marker 10
Key 1...4: the operator pressed the XL2 Input Keypad during the recording
Error: a technical problem (e.g. SD-card overflow) occurred during the recording
Create, edit or delete a Marker
Markers can be created, edited or deleted using buttons, context menus or the keyboard.
Add Marker
1. Select the Marker type using the
combo box, then click on the
- or press the corresponding number key 0...9 on the PC keyboard.
button
2. Create the Marker by selecting an area in the Main chart with left-click+drag.
Hint
Overlapping Markers are supported.
Marker type, position, duration
The type, the start/end points or the duration of any Marker can be edited, regardless whether it has been imported
from an XL2 test, or created in the Data Explorer software.
Right-click on the Marker (or Marker name) in the Main chart and select 'Edit', then
amend the Marker Type, Start, End or Duration in the Info section, or
click on the left or right edge of the Marker band and manually adjust it with the
click on the Marker band and pan it with the
cursor, or
cursor.
Click on 'OK' in the Info section to confirm or on 'Cancel' to abandon your changes.
Delete
To remove a Marker,
right-click on it in the Main chart and select 'Marker
Delete', or
right-click on its name in the Main chart and select 'Delete'.
Marker Spectrum
You may either display the RTA spectrum of a specific Marker, or of all Markers of the same type.
a) RTA spectrum of a specific Marker
i. Right-click on the Marker name and select 'Lock'
ii. Right-click on the Marker area and select 'Marker
Lock'
b) RTA spectrum of all Markers of the same type
i. Right-click on the Marker name and select 'Lock All of Type [Mark erName]'
ii. Right-click on the Marker area and select 'Marker
Lock All of Type [Mark erName]'
© 2015 NTi Audio AG, MBe
Part
IV
48
4
XL2 DataExplorer User Manual
Result view
The Result view summarizes the numerical results of the selected levels in a table.
Hint
Click on
to select the level results that are displayed in the columns.
Notice that the Result view does not display dt values.
Example of Result view
Structure
The Result view is vertically divided in two sections, Project Results and Markers.
a) Project Results
1. Recorded: the overall level results including the data of all Markers.
2. Every Marker with a "–" sign in front of its name is excluded from the Result and shown separately
3. Result (highlighted row): the overall level results without considering the data of the excluded Markers.
b) Markers
The individual results of all remaining Markers (i.e. no excluded Markers)
c) Audit Intervals
The individual results of all Audit Intervals
© 2015 NTi Audio AG, MBe
Result view
49
Features
The following operations are supported in the Result view.
Select the levels that are displayed.
Click on
or
to expand or collapse Markers.
Right-click to the Result view and select 'Expand All' or 'Collapse All' (applies to all Marker categories).
Double click on a Marker or an Audit Interval to open the Chart view, with the zoom range at the selected Marker
position / Audit Interval, respectively.
Delete a selected Marker if necessary.
Click on
to export the formatted table to an MS Excel file.
Open the Level statistics calculation
Open the Day Night Level calculation.
Hint
4.1
All settings are saved in the Project, i.e. the Result view layout will re-open in its last state when the
project is opened again.
Markers (in Result view)
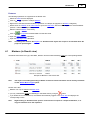
The Result view shows the Type, Start Date, Duration and the measured level(s) within the corresponding Marker.
Example of Mark ers in the Result view
Hint
The impact of including/excluding a Marker in/from the result calculation can be directly visualized
via the 'Define Marker Types' panel.
Please notice that
Markers can only be edited in the Main chart
you may nevertheless delete the Marker(s) in the Result view by using the
button
if you double-click on a Marker line, the software automatically toggles to the Chart view and displays the
corresponding section
Hint
Right-clicking in the Result view opens a context menu to expand or collapse all Markers, or to
copy the selected row to the clipboard.
© 2015 NTi Audio AG, MBe
50
XL2 DataExplorer User Manual
4.2
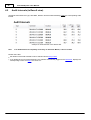
Audit Intervals (in Result view)
The Result view shows the Type, Start Date, Duration and the measured level(s) within the corresponding Audit
Interval.
Example of Audit Intervals in the Result view
Hint
If an Audit Interval is completely covered by an 'Exclude' Marker, it has no results.
Please notice that
the duration of the Audit Intervals must be selected via the Setup Levels
if you double-click on an Audit Interval line, the software automatically toggles to the Chart view, displays the
corresponding section and locks the cursor to it.
© 2015 NTi Audio AG, MBe
Part
V
52
5
XL2 DataExplorer User Manual
Level Calculations
The XL2 Data Explorer offers two tools for customized level calculations,
5.1
i. the Level statistics, or percentiles are accessible via the
button,
ii. the Day Night level window is opened by clicking on the
button.
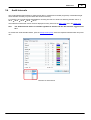
Level statistics
Click on
to open the 'Level Statistics' window, select the Level and click on
display the statistical distribution of recorded dt values.
to calculate &
Level: select any dt value that has been recorded by the XL2
Percentiles:
o click on
to open the 'Edit percentiles' panel.
o tick the 'Chart' or 'Result' checkbox to select
the corresponding view.
(i.e. display) or deselect
all percentile results in
Audit intervals (if active): click on an Audit Interval to see the corresponding level statistics and percentile results.
Level statistics window
Level statistics of selected audit interval
© 2015 NTi Audio AG, MBe
Level Calculations
Hint
53
A red exclamation mark next to the button
shows that the level statistics have to be recalculated. This has to be done every time when you activate, amend or deactivate the Audit
Intervals, or one or several Markers.
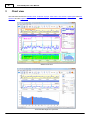
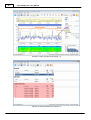
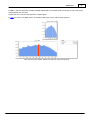
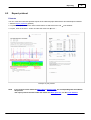
Level statistics graph
Axes:
o the left axis [%] refers to the dt levels (green bars)
o the right axis [%] refers to the percentiles (blue line).
Cursor: hover over the graph to read out the dB value, probability and cumulative probability at the corresponding
x-axis position.
Zoom:
o click & drag to select an area of the graph that shall be enlarged
o right click on the graph, select 'Zoom...' and manually enter the preferred Min.X, Max.X, Max.Y values
o right click on the graph and select 'Zoom All Out' to return to the full view
© 2015 NTi Audio AG, MBe
54
XL2 DataExplorer User Manual
5.1.1
Percentiles
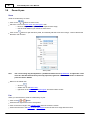
The list of LN values for the percentiles calculation can be edited as follows.
Enter a numerical LN value in the top input box and click on 'Add'.
Select an LN value from the list and click on 'Delete', or 'Delete All'.
Click on 'Apply Default' to apply the default values.
Edit percentiles panel
Hint
The default list of LN values may be defined via the preferences. XL2 Test files that have been
previously imported, may be adjusted by clicking on the 'Default' button.
© 2015 NTi Audio AG, MBe
Level Calculations
5.2
55
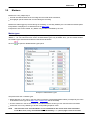
Day Night Level
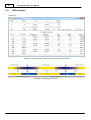
The 'Day Night Level' window calculates the LDay , LEv ening, LNight , LDN , LDEN levels with individual weightings
(penalties).
Example of Day-Evening-Night time scheme with penalties
Time scheme and penalties
The top section of the window comprises of the parameter settings for the time scheme and penalties.
Enabled, Period: each 24 hour period can be divided into between 1 and 3 periods,
1) Day
always enabled
2) Night
tick checkbox to enable a separate result calculation or penalty for the night period
3) Evening
tick checkbox to enable a separate result calculation or penalty for the evening period (only
accessible if 'Night' is enabled)
From, To: assign individual start times to the enabled periods
o Adjust the times for when the individual enabled periods begin.
o The end time of a period is automatically the start time of the next period.
o Enter the times in the format hh:mm:ss
Penalty: positive offset that should be added to the measurement results to reflect the annoyance level during that
period.
o Enter the penalties, expressed in dB, for the Day, Evening and Night periods separately.
Split at Midnight: the Night level is calculated separately for each calendar day (see example), i.e. split by
1) 00:00:00 hrs to start of Day +
2) end of Day/Evening to 24:00:00 hrs
Hint
The default list of Day Night Levels may be defined via the preferences. XL2 Test files that have been
previously imported, may be adjusted by right-clicking on the top section of the window and
selecting 'Default'.
Click on
settings.
NOTE
to let the system evaluate & display the level results that correspond to the current
If no valid measurement could be executed, the message "n. def." (not defined) is shown as
result.
© 2015 NTi Audio AG, MBe
56
5.2.1
XL2 DataExplorer User Manual
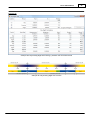
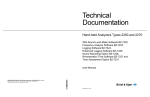
LDEN examples
Example #1
Example #1: Day-Night time settings, penalties and calculated results
Example #1: Day-Night time scheme
© 2015 NTi Audio AG, MBe
Level Calculations
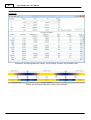
Example #2
Example #2: Day-Evening-Night time settings, penalties and calculated results
Example #2: Day-Evening-Night time scheme
© 2015 NTi Audio AG, MBe
57
58
XL2 DataExplorer User Manual
Example #3
Example #3: Day-Evening-Night time settings, split at midnight, penalties and calculated results
Example #3: Day-Evening-Night time scheme, split at midnight
© 2015 NTi Audio AG, MBe
Part
VI
60
6
XL2 DataExplorer User Manual
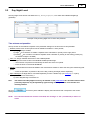
Reporting
The XL2 Data Explorer provides several features for creating a report from the project data.
Editable Report properties
Print preview, printout
Data export to MS Excel
Copy graph to clipboard (bitmap format)
Copy numerical data to clipboard
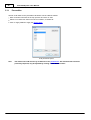
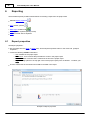
6.1
Report properties
The Report properties...
are accessible from the Chart or Result view, via the 'Report Properties' button or the menu 'File
Properties..',
Report
contain the following editable information:
o Title: headline of the project report
o Introduction: user comment that precedes the charts in the project report
o Conclusion: user comment that is inserted at the end of the project report
o Logo: user logo placed in the top right corner of the project report (click on 'Browse...' to select your
logo)
Tick the checkboxes of the sections that shall be included in the report.
Example of Report properties
© 2015 NTi Audio AG, MBe
Reporting
6.2
61
Report printout
Printouts
You can create and customize printable reports of the selected project data with the XL2 Data Explorer software.
1. Edit the Report properties (optional)
2. To preview the print, click on the 'Print Preview' button or select the menu 'File
3. To print, click on the 'Print...' button or select the menu 'File
Print Preview'
Print...'
Example of print preview
Hints
If you lock the cursor within the Main chart or Spectrogram, the corresponding data are added to
the printout.
The report printout includes neither the default size RTA spectrum, nor the Level statistics.
© 2015 NTi Audio AG, MBe
62
6.3
XL2 DataExplorer User Manual
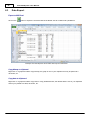
Data Export
Export to MS Excel
Click on the
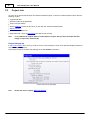
button to export the numerical data of the Result view to an MS Excel spreadsheet.
Example of a Data Explorer result table after export to MS Excel
Copy bitmap to clipboard
Right-click on a graph and select 'Copy Bitmap'; the graph is now in your clipboard and may be pasted to a
document, etc.
Copy data to clipboard
Right-click on a graph and select 'Copy Data' or 'Copy Selected Rows'; the relevant data is now in your clipboard
and may be pasted to a table, document, etc.
© 2015 NTi Audio AG, MBe
Index
Index
-Eedit
-AAGC
32
audio
bar
28, 32
player
28, 32
audit intervals
35
activate
33
level statistics
52
percentiles
52
automated gain control
32
-Ffolder
-Bbitmap
marker
45
error marker
45
evening
55
example
56
exclude
45
export
data
62
project
19
export data
48
62
19
-G-
-C-
gain control
chart
main
37
overview
31
spectrogram
39
spectrum
39
view
28
clipboard
62
clipping
32
copy project
19
copy to clipboard
62
correction factor
33
cursor
42
lock
61
-H-
-Ddata
21
export
48, 60, 62
flow
21
import
9, 19, 21, 24
Data Explorer
option
19, 21
structure
7
day
55
example
56
default settings
24, 33, 54, 55
© 2015 NTi Audio AG, MBe
hardware
highlights
32
6
5
-Iimport
preferences
24
repeat mode data
XL2 file
21
info section
28, 37
installation
6
instance
7
internet
21
introduction
5
-Kk1, k2
33
key marker
45
-LLDEN
55
example
legacy data
56
21
21
63
64
XL2 DataExplorer User Manual
legend
39
level
display
37
marker
45
overview
31
results
48
setup
33
setup default
24
spectrum
39
statistics
52
statistics printout
61
license
21
license agreement
16
lock cursor
42, 61
-Mmain chart
28, 37
marker
data
48
result view
49
spectrum
45
measurement results
37
midnight
55
MS Excel
61, 62
multiple instances
7
-Nnight
55
example
56
NTi Audio
5, 16
-Ooption
19, 21
overview chart
28, 31
-Ppan
44
pause
45
penalty
55
percentiles
52, 54
default
24
printout
61
printout
61
probability
52
project
19
content
26
copy
19
info
26, 28
restore
19
save
19
properties of report
60
-Rread-only mode
7
readout
42
repeat mode
data import
21
replay sound file
32, 42
report
60, 61
properties
60
restore project
19
result view
48
RTA
levels default
24
RTA spectrum
39
printout
61
-Ssave project
7, 19
separator
28
setup levels
33
default
24
share project
19, 21
shift zoom range
44
software
installation
6
structure
7
spectrogram
28, 39
spectrum
28, 39
of marker
45
statistics
52
step-by-step
9
structure
7
support
5
-Ttable export
62
time axis
28
trial mode
21
tutorial
9
© 2015 NTi Audio AG, MBe
Index
-Uundo amendments
-Vview
7
chart
28
project
19
result
48
-XX-axis zoom
44
XL2
marker
45
XL2 Data Explorer
option
19, 21
structure
7
XL2 setup
9
-YY-axis scale
44
default
24
-Zzoom
42, 44
© 2015 NTi Audio AG, MBe
19
65
66
XL2 DataExplorer User Manual
Notes
© 2015 NTi Audio AG, MBe