1
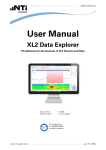
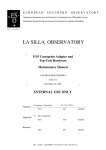
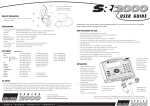
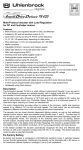
User manual v1.1 - Online database 2. Table of Contents 1. Welcome & Introduction ........................................................................1 2. Table of Contents..................................................................................2 3. About This Tool ....................................................................................3 3.1 Table: .............................................................................................3 3.2 Chart ..............................................................................................4 4. Creating Dynamic Tables .......................................................................5 5. Creating Dynamic Graphs ......................................................................7 6. Contact Us ......................................................................................... 12 7. Glossary ............................................................................................. 12 2 3. About This Tool Our Data Visualisation Tool has two core functionalities: 3.1 Table: This allows tabular representation of statistical indicators sourced from various national and international statistical agencies. http://www.unescap.org/stat/data/statdb/DataExplorer.aspx Figure 1: This table listing the Population Size of ESCAP Countries stretching back 60 years was generated in mere seconds by the user. Key Features: Table is generated based on a users selection of socioeconomic indicators Data can be extracted in a variety of formats, including Excel. 3 3.2 Chart Allows the graphical representation of dynamic time series data based on a users selection of socioeconomic indicators allowing for trends and comparisons to be easily identified. http://www.unescap.org/stat/data/statdb/DataExplorer.aspx Figure 2: This 4D Bubble Chart listing the inflation rate, average growth rate of internet users, population size and time was generated in mere seconds by the user. Key Features: Chart is generated based on a users selection of socioeconomic indicators Data can be extracted in a variety of formats, including Excel. 4 4. Creating Dynamic Tables This guide will show you how to create dynamic tables in 4 easy steps 1 Visit http://sd- Visit http://www.unescap. dev/stat/data/swweb/ http://www.unescap.org/stat/data/statdb/DataExplorer.aspx org/stat/data/statdb/ 2 Select Your Indicator http://www.unescap.org/stat/data/statdb/DataExplorer.aspx 5 3 Select Your Area http://www.unescap.org/stat/data/statdb/DataExplorer.aspx 4 Click Load Data http://www.unescap.org/stat/data/statdb/DataExplorer.aspx 6 5. Creating Dynamic Graphs This guide will show you how to create dynamic charts. Two types of charts can be generated. a. Line Chart – steps 5-7 b. Bubble Chart- steps 8-10 As a pre-requisite for both charts, you will need to follow steps 1-3 1 2 Visit http://sd- Visit dev/stat/data/swweb/ http://www.unescap. org/stat/data/statdb/ http://www.unescap.org/stat/data/statdb/DataExplorer.aspx Click on Chart http://www.unescap.org/stat/data/statdb/DataExplorer.aspx 7 3 You should see the following screen. If you do not see this http://www.unescap.org/stat/data/statdb/DataExplorer.aspx screen, most likely you do not have Microsoft Silverlight installed on your machine. You will automatically be requested to download it – click “yes” to any such request. 4 Select up to six countries or http://www.unescap.org/stat/data/statdb/DataExplorer.aspx aggregates from the list on the right hand side. 8 5 Select one indicator by clicking on the tab on http://www.unescap.org/stat/data/statdb/DataExplorer.aspx the left hand side. 6 Click on “Load Data” http://www.unescap.org/stat/data/statdb/DataExplorer.aspx 9 7 Your line graph based on your country and http://www.unescap.org/stat/data/statdb/DataExplorer.aspx indicator selection should be automatically generated. You can adjust the speed at which your graph is generated by using the slider tool which is circled. 8 To create a bubble chart, select indicators on both the X and Y http://www.unescap.org/stat/data/statdb/DataExplorer.aspx Axis (You will need to choose another indicator other than “Year” on the Y-Axis) 10 9 Click on Load Data and then press Play. Your Bubble Chart Should http://www.unescap.org/stat/data/statdb/DataExplorer.aspx Appear. 10 You can adjust the type of bubble using http://www.unescap.org/stat/data/statdb/DataExplorer.aspx the Point Size Drop Down. When you have selected a different point size (either Fixed, Population or GDP), repeat step 9 11