1
US 7,702,437 B2
1
2
MULTIDIMENSIONAL VEHICLE HEALTH
GRAPHICS
tional devices in order to supplement the limitations of output
FIELD OF THE INVENTION
methods of today’s diagnostic tools or personal computers
used for diagnostic purposes. Accordingly, it is desirable to
The user of the diagnostic tool can be forced to use addi
provide a method and apparatus that Will alloW enhanced
display capabilities to a user or technician to use a diagnostic
The present invention relates generally to a display. More
particularly, the present invention relates to a display related
to vehicle diagnostics and vehicle health information.
tool or diagnostic personal computer to determine the output
of the vehicle’s health information in a manner that is easy
and quick to ascertain Whether it is Within normal constraints.
BACKGROUND OF THE INVENTION
SUMMARY OF THE INVENTION
Onboard control computers have become prevalent in
The foregoing needs are met, to a great extent, by the
present invention, Wherein in one aspect an apparatus is pro
vided that in some embodiments enhanced display capabili
ties to a technician through a diagnostic tool or diagnostic
motor vehicles, but as safety, economy, and emissions
requirements have continued to tighten, friction braking sys
tems, and traction control devices have not met the require
ments set out in government regulations and the implicit
demands of competitors’ achievements. Successive genera
personal computer to determine the output of the vehicle’s
health information in a manner that is easy and quick to
tions of onboard control computers have acquired increasing
data sensing and retention capability as the electronics have
advanced.
20
Present external diagnostic and display apparatus, knoWn
as diagnostic tools, are commonly limited to reporting the
data acquired by the onboard control computer itself. Increas
ingly, subtle subsystem failures in vehicles overload the abil
ity of maintenance technicians, not simply to read the faults
detected and stored by the diagnostic tools themselves, but to
combine those readings With peripheral measurements and
deduce corrective actions With both speed and accuracy.
Currently in the automotive industry, there are both stand
alone and hand-held diagnostic testers or tools used in con
sured values With a set of related normal values of a vehicle of
the same type as the vehicle being measured, and operating
30
nection With motor vehicle maintenance and repair. For
example, hand-held diagnostic tools have been used to
trouble-shoot faults associated With vehicular control units.
Diagnostic tools detect faults based on Diagnostic Trouble
computer. A DTC can be triggered and stored When there is a
problem With the vehicle. A technician then retrieves the DTC
using a diagnostic tool, repairs the associated problem and
Vehicle diagnostics have also been performed through per
sonal computers. HoWever, the display of such diagnostic
40
Furthermore, technicians have also needed extensive learning
testing. Certain sensors are attached to the vehicle to make
certain measurements related to environmental emissions or
45
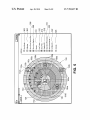
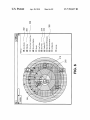
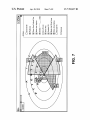
dependency on a predetermined variable. The video image
can include coloring or shading the different regions of video
image according to a deviation from the normal set of values.
There can also be a dividing of different regions of the video
image according to a set range of deviations from the normal
set of values.
50
safety related information of the vehicle.
The current diagnostic tools and personal computers used
Additionally, there is an altering of the video image accord
ing to the display of the measured values as compared to the
related normal set of values. The location of the measured
values can be dependent on a third variable in addition to the
comparison to the normal set of values. The video image can
include a plurality of icons representing the particular mea
sured variables of the vehicle and measured values being
for vehicle diagnostics and vehicle health information are
limited in the display output, thus limiting the usefulness of
the diagnostic tool for a user. The limits on the current tools
centric circles With the measured values being located accord
ing to the comparison to the normal set of values, and the
concentric circles being sectioned further into a plurality of
pied subdivisions, With each pie representing an additional
information has alWays been dif?cult to read for technicians.
in order to read such diagnostic information.
Further general vehicle health information have also be
monitored through personal computers, or standalone com
puting modules that measure information related to emission
Within a preset normal range, and displaying on a video image
a graphical depiction of the measured set of values in com
parison to the normal set of values of the same type of vehicle.
The video image can also include icons With values indi
cating the measured set of values of a health of the vehicle.
The video image can further include a video depiction of the
values having a dependency on the location Within a display
screen to indicate the comparison to the normal set of values.
The video image can be a plurality of concentric circles, With
measured values of the vehicle being located closer to center
as the measured values are closer to value of the related
normal set of values.
The video image can be sectioned into a plurality of con
Codes or DTCs that are set in the vehicle’s onboard control
then deletes the DTC from the vehicle’s computer.
ascertain Whether it is Within normal constraints.
In accordance With one aspect of the present invention, a
method of displaying a vehicle’s information, includes mea
suring a set values of the vehicle, comparing the set of mea
55
output capabilities include, for example, problems With the
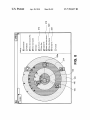
displayed adjacent to the respective icons, and the icons and
method of indicating the DTC, or vehicle health information
measured values being moved around a concentric circle at a
same distance from the center of the concentric circle in order
such as the measurement of a certain sensors in the vehicle.
to not overlap the displayed image of the icon and related
The current diagnostic tools shoW the DTC on a basic display
that displays the basic information and such information, then
must be checked manually or through additional steps to
ascertain Whether the information is Within the normal limits.
The user must be in close proximity and in vieWing distance
from the diagnostic tool as the information is usually text
based. For example, When a diagnostic tool detects a DTC or
an emission testing result, a user must directly vieW the tool in
order to see the DTC or emission testing readout.
60
measured value. The method can also be a set of computer
executable instructions stored on a computer readable media.
In another aspect of the invention, there can be an apparatus
for displaying a vehicle’s measured information, including a
communication interface connecting to the vehicle and
accommodating the measuring of the vehicle’s information
65
through a plurality of sensors, a memory connected to the
communication interface, storing a softWare for displaying of
the vehicle’s measured information, a processor connected to