1
Instruction Manual
PW3198
POWER QUALITY
ANALYZER
April 2011 Edition 1 PW3198A981-00 11-04H
1
Contents
Contents
Introduction .................................................. 1
Confirming Package Contents .................... 2
Safety Notes.................................................. 4
Usage Notes.................................................. 6
Chapter 1 Overview
11
1.1
Product Overview ............................ 11
1.2
Features ............................................ 12
1.3
Measurement Flowchart .................. 13
3.7
Connecting the Clamp Sensors ......34
3.8
Turning the Power On and Off
(Setting the Default Language) .......36
Chapter 4 Configuring the
Instrument before
Measurement
(SYSTEM - SYSTEM
screen) and Wiring37
Starting and Stopping Recording......... 14
Chapter 2 Names and Functions
of Parts
Basic Operations
& Screens
15
2.1
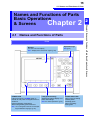
Names and Functions of Parts ....... 15
2.2
Basic Operations ............................. 19
2.3
Display Items and Screen Types .... 20
Common Display Items........................ 20
Warning Indicators............................... 22
Screen Types .......................................23
Chapter 3 Measurement
Preparations
27
3.1
Preparation Flowchart ..................... 27
3.2
Initial Instrument Preparations ....... 28
Attaching input cable labels to the
voltage cords and clamp sensors ........28
Attaching the strap ...............................28
Bundle the voltage cord leads with the
spiral tubes .......................................... 29
Installing the battery pack .................... 30
3.3
Pre-Operation Inspection ................ 31
3.4
Connecting the AC Adapter ............ 32
3.5
Inserting (Removing) an SD Memory
Card ................................................... 32
3.6
Connecting the Voltage Cords ....... 34
4.1
Warm-up and Zero-adjust
Operation ..........................................37
4.2
Setting the Clock ..............................38
4.3
Configuring the Connection Mode
and Clamp Sensors ..........................39
Connection diagram............................ 40
4.4
Setting the Vector Area
(Tolerance Level) ..............................45
4.5
Connecting to the Lines to be
Measured (Preparing for Current
Measurement) ...................................46
4.6
Verifying Correct Wiring
(Connection Check) .........................48
4.7
Quick setup .......................................50
4.8
Verifying Settings and Starting
Recording ..........................................53
4.9
Using the Instrument during a
Power Outage ...................................54
Chapter 5 Changing Settings
(as necessary)
55
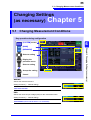
5.1
Changing Measurement Conditions 55
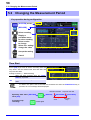
5.2
Changing the Measurement Period 58
5.3
Changing the Recording Settings ..61
5.4
Changing Hardware Settings ..........64
5.5
Changing Event Settings .................66
1
2
3
4
5
2
Contents
5.6
Initializing the Instrument
(System Reset) .................................73
5.7
Factory Settings ...............................74
Chapter 8 Checking Events
(EVENT screen) 119
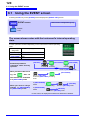
8.1
Using the EVENT screen ............... 120
Chapter 6 Monitoring
Instantaneous Values
(VIEW Screen)
75
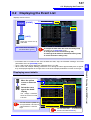
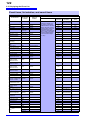
8.2
Displaying the Event List .............. 121
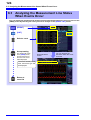
8.3
Analyzing the Measurement Line
Status When Events Occur ........... 124
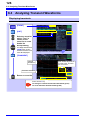
8.4
Analyzing Transient Waveforms .. 126
6.1
Using the VIEW screen ....................75
8.5
6.2
Displaying Instantaneous
Waveforms ........................................76
Viewing High-order Harmonic
Waveforms ..................................... 129
8.6
Checking Fluctuation Data ........... 132
6.3
Displaying Phase Relationships
([VECTOR] Screen) ...........................80
6.4
Displaying Harmonics ......................83
Displaying harmonics as a bar graph .. 83
Displaying harmonics as a list ............. 86
6.5
Displaying Measured Values
Numerically (DMM Screen) ..............89
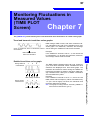
Chapter 7 Monitoring
Fluctuations in
Measured Values
(TIME PLOT
Screen)
91
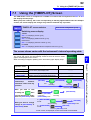
7.1
Using the [TIMEPLOT] Screen ........93
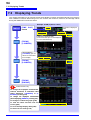
7.2
Displaying Trends ............................94
7.3
Displaying detailed trends .............101
Displaying a detailed trend graph for
each TIMEPLOT interval ................... 101
7.4
Displaying Harmonic Trends .........107
7.5
Displaying Flicker Values in Graph
and List Form ..................................111
IEC flicker meters and ΔV10 flicker
meters ............................................... 111
Displaying an IEC flicker fluctuation
graph ................................................. 111
Displaying an IEC flicker list.............. 114
Displaying a ΔV10 flicker fluctuation
graph................................................. 115
Displaying a ΔV10 flicker list ............. 118
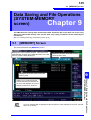
Chapter 9 Data Saving and File
Operations
(SYSTEM-MEMORY
screen)
135
9.1
[MEMORY] Screen ......................... 135
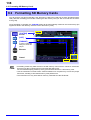
9.2
Formatting SD Memory Cards ...... 138
9.3
Save Operation and File Structure 139
9.4
Saving and Deleting Measurement
Data ................................................. 141
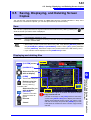
9.5
Saving, Displaying, and Deleting
Screen Copies ................................ 143
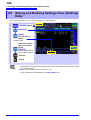
9.6
Saving and Deleting Settings Files
(Settings Data) ............................... 144
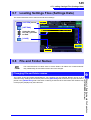
9.7
Loading Settings Files
(Settings Data) ............................... 145
9.8
File and Folder Names .................. 145
Changing file and folder names ........ 145
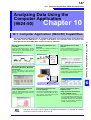
Chapter 10 Analyzing Data
Using the Computer
Application
(9624-50)
147
10.1 Computer Application (9624-50)
Capabilities ..................................... 147
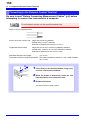
10.2 Downloading Data from the SD
Memory Card .................................. 148
3
Contents
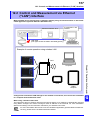
Chapter 11 Connecting External
Devices
149
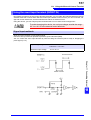
11.1 Using the External Control
Terminal .......................................... 149
Connecting to the External Control
Terminal .............................................150
Using the event input terminal
(EVENT IN) ........................................151
Using the event input terminal
(EVENT OUT) ....................................152
13.8 GPS Time Synchronization
Function ..........................................197
13.9 Other Functions ..............................197
13.10Calculation Formula .......................198
13.11Clamp Sensors and Ranges ..........211
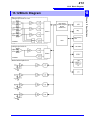
13.12Block Diagram ................................213
Chapter 14 Maintenance
and Service
215
14.4 Disposing of the Instrument ..........221
5
Appendix
6
14.3 Error Indication ...............................218
A1
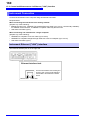
LAN Settings and Network Environment
Configuration .....................................158
Instrument Connection .......................160
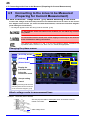
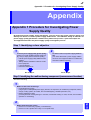
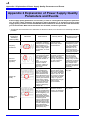
Appendix 1 Procedure for Investigating
Power Supply Quality .......... A1
12.3 Remote Control of the Instrument
by Internet Browser ....................... 162
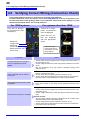
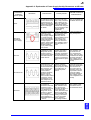
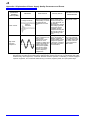
Appendix 2 Explanation of Power Supply
Quality Parameters and
Events.................................... A4
Connecting to the Instrument .............162
Operating Procedure ......................... 163
12.4 Converting Binary Data to Text
Data ................................................. 164
4
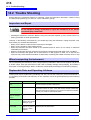
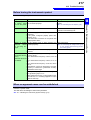
14.2 Trouble Shooting ............................216
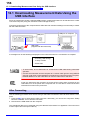
12.1 Downloading Measurement Data
Using the USB Interface ................ 156
12.2 Control and Measurement via
Ethernet ("LAN") Interface ............ 157
14
3
14.1 Cleaning ..........................................215
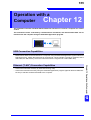
Chapter 12 Operation with a
Computer
155
13
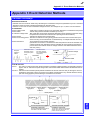
Appendix 3 Event Detection Methods .... A7
Appendix 4 Recording TIMEPLOT Data
and Event Waveforms........ A14
Appendix 5 Detailed Explanation of IEC
Flicker and ΔV10 Flicker .... A18
7
8
9
165
Appendix 6 Making Effective Use of
Channel 4 ............................ A21
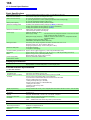
13.1 Environmental Safety
Specifications ................................. 165
Appendix 7 Terminology........................ A24
10
Index
11
Chapter 13 Specifications
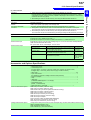
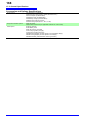
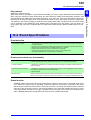
13.2 General Specifications .................. 165
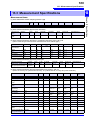
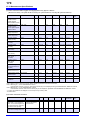
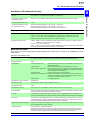
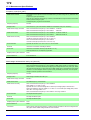
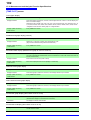
13.3 Measurement Specifications ........ 169
13.4 Event Specifications ...................... 189
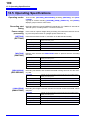
13.5 Operating Specifications ............... 190
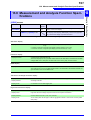
13.6 Measurement and Analysis
Function Specifications ................ 191
12
Appendix
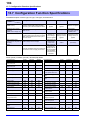
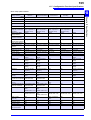
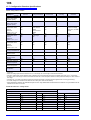
13.7 Configuration Function
Specifications ................................. 194
Index1
Index
4
Contents
1
Introduction
Introduction
Thank you for purchasing the HIOKI PW3198 Power Quality Analyzer. To obtain maximum performance from the product, please read this manual first, and keep it handy for future reference.
Clamp-on sensors (optional; see p.3) are required in order to input current to the instrument.
(Clamp-on sensors are called "clamp sensors" throughout this manual.) For more information,
see the instruction manual for the clamp sensors being used.
Registered trademarks
• Windows is a registered trademark of Microsoft Corporation in the United States and/or other countries.
• Sun, Sun Microsystems, Java, and any logos containing Sun or Java are trademarks or registered
trademarks of Sun Microsystems, Inc. in the United States and other countries.
• The SD logo is a trademark of SD-3C, LLC.
Symbols
Symbols in this manual
Indicates the prohibited action.
(p. )
Indicates the location of reference information.
Indicates quick references for operation and remedies for troubleshooting.
*
[
Indicates that descriptive information is provided below.
]
CURSOR
(Bold character)
Bold characters within the text indicate operating key labels.
Windows
Unless otherwise specified, "Windows" represents Windows 2000, Windows XP, Windows Vista,
or Windows 7.
Dialogue
Dialogue represents a Windows dialog box.
Mouse action terminology
Click:
Press and quickly release the left button of the mouse.
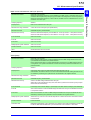
Accuracy
We define measurement tolerances in terms of f.s. (full scale), rdg. (reading) and dgt. (digit) values, with
the following meanings:
f.s.
(maximum display value
or scale length):
The maximum displayable value or scale length. This is usually the name
of the currently selected range.
rdg.
(reading or displayed
value):
The value currently being measured and indicated on the measuring instrument.
dgt.
(resolution):
The smallest displayable unit on a digital measuring instrument, i.e., the
input value that causes the digital display to show a "1" as the least-significant digit.
2
Confirming Package Contents
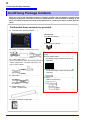
Confirming Package Contents
When you receive the instrument, inspect it carefully to ensure that no damage occurred during
shipping. In particular, check the accessories, panel switches, and connectors. If damage is evident, or if it fails to operate according to the specifications, contact your dealer or Hioki representative.
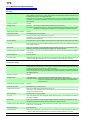
Confirm that these contents are provided.
PW3198 Power Quality Analyzer....... 1
Accessories
Instruction Manual ............................... 1
Measurement Guide............................ 1
Z1002 AC Adapter (includes power cord)1
Please attach to the instrument before use.
(p.28)
Input Cable Labels .............................. 1
(to identify voltage cable leads and input
L1000 Voltage Cord............................ 1
channels)
(Cords: One each red, yellow, blue, and gray as well as
4 black; alligator clips: 1 each red, yellow, blue, and
gray as well as 4 black)
Spiral Tubes........................................ 20
(to identify voltage cable leads and input
channels)
USB Cable .......................................... 1
Strap ................................................... 1
(attach to instrument)
Z1003 Battery Pack ............................ 1
(Ni-MH, 7.2 V/4500 mAh)
Z4001 SD Memory Card 2GB............. 1
3
Confirming Package Contents
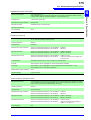
Options
Contact your dealer or Hioki representative for details.
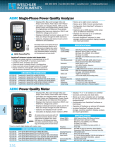
Clamp sensors (current measurement)
9660 Clamp-On Sensor
(100 A rms rated)
9661 Clamp-On Sensor
( 500 A rms rated)
9667 Flexible Clamp-On Sensor
(5000 A rms/500 A rms rated)
9669 Clamp-On Sensor
(1000 A rms rated)
9694 Clamp-On Sensor
(5 A rms rated)
9695-02 Clamp-On Sensor
(50 A rms rated)
9695-03 Clamp-On Sensor
(100 A rms rated)
9290-10 Clamp-On Adapter
9219 Connection Cable
(For use with Model 9695-02/9695-03)
9657-10 Clamp-On Leak Sensor
(10 A rms rated)
9675 Clamp-On Leak Sensor
(10 A rms rated)
Voltage measurement
9804-01 Magnetic Adapter
9804-02 Magnetic Adapter
9243 Grabber Clip
L1000 Voltage Cord
Carrying cases
C1001 Carrying Case (Soft type)
C1002 Carrygin Case (Hard type)
Recording media
Z4001 SD Memory Card 2GB
Communications
9642 LAN Cable
9624-50 PQA-HiView Pro
(Computer application software)
Other
Z1002 AC Adapter
Z1003 Battery Pack
PW9000 Wiring Adapter
(For use with 3-phase
3-wire (3P3W3M) voltages)
PW9001 Wiring Adapter
(For use with 3-phase 4-wire
voltages)
PW9005 GPS Box
(Build-to-order)
4
Safety Notes
Safety Notes
This manual contains information and warnings essential for safe operation of the product and
for maintaining it in safe operating condition. Before using the product, be sure to carefully read
the following safety notes.
This instrument is designed to comply with IEC 61010 Safety Standards, and has
been thoroughly tested for safety prior to shipment. However, mishandling during use could result in injury or death, as well as damage to the instrument. However, using the instrument in a way not described in this manual may negate the
provided safety features.
Be certain that you understand the instructions and precautions in the manual
before use. We disclaim any responsibility for accidents or injuries not resulting
directly from instrument defects.
Safety Symbols
In the manual, the
symbol indicates particularly important information that the user
should read before using the product.
The
symbol printed on the product indicates that the user should refer to a corresponding
topic in the manual (marked with the symbol) before using the relevant function.
Indicates a grounding terminal.
Indicates the ON side of the power switch.
Indicates the OFF side of the power switch.
Indicates AC (Alternating Current).
The following symbols in this manual indicate the relative importance of cautions and warnings.
Indicates that incorrect operation presents a significant hazard that could result in serious injury
or death to the user.
Indicates that incorrect operation presents a significant hazard that could result in serious injury
or death to the user.
Indicates that incorrect operation presents a possibility of injury to the user or damage to the
product.
Advisory items related to performance or correct operation of the product.
Symbols for Various Standards
WEEE marking:
This symbol indicates that the electrical and electronic appliance is put on the EU market after August
13, 2005, and producers of the Member States are required to display it on the appliance under Article
11.2 of Directive 2002/96/EC (WEEE).
Ni-MH
This is a recycle mark established under the Resource Recycling Promotion Law (only for Japan).
This symbol indicates that the product conforms to safety regulations set out by the EC Directive.
5
Safety Notes
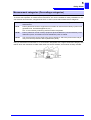
Measurement categories (Overvoltage categories)
This instrument complies with CAT IV (600 V) safety requirements.
To ensure safe operation of measurement instruments, IEC 61010 establishes safety standards for various electrical environments, categorized as CAT I to CAT IV, and called measurement categories.
CAT I:
Secondary electrical circuits connected to an AC electrical outlet through a transformer or
similar device.
CAT II:
Primary electrical circuits in equipment connected to an AC electrical outlet by a power cord
(portable tools, household appliances, etc.)
CAT II covers directly measuring electrical outlet receptacles.
CAT III:
Primary electrical circuits of heavy equipment (fixed installations) connected directly to the
distribution panel, and feeders from the distribution panel to outlets.
CAT IV:
The circuit from the service drop to the service entrance, and to the power meter and primary overcurrent protection device (distribution panel).
Using a measurement instrument in an environment designated with a higher-numbered category than
that for which the instrument is rated could result in a severe accident, and must be carefully avoided.
6
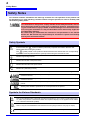
Usage Notes
Usage Notes
Follow these precautions to ensure safe operation and to obtain the full benefits of the various
functions.
Before Use
Before using the instrument the first time, verify that it operates normally to ensure that the no damage
occurred during storage or shipping. If you find any damage, contact your dealer or Hioki representative.
Before using the instrument, make sure that the insulation on the voltage cords
is undamaged and that no bare conductors are improperly exposed. Using the
instrument in such conditions could cause an electric shock, so contact your
dealer or Hioki representative for replacements.
Instrument Installation
Operating temperature and humidity: 0 to 50°C, 80%RH or less, Indoors only (non-condensating)
Storing temperature and humidity: -20 to 50°C, 80%RH or less, Indoors only (non-condensating)
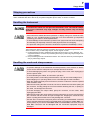
Avoid the following locations that could cause an accident or damage to the instrument.
Exposed to direct sunlight
Exposed to high temperature
In the presence of corrosive or
explosive gases
Exposed to water, oil, other
chemicals, or solvents
Exposed to high humidity or
condensation
Exposed to high humidity or
condensation
Exposed to strong electromagnetic fields
Near electromagnetic radiators
Exposed to high levels of particulate dust
Near induction heating systems
(e.g., high-frequency induction
heating systems and IH cooking utensils)
Subject to vibration
Installing
• The instrument should be operated only with the bottom or rear side downwards.
• Vents (on the left and right side of the instrument) must not be obstructed.
50 mm or more
7
Usage Notes
Shipping precautions
Hioki disclaims responsibility for any direct or indirect damages that may occur when this instrument has
been combined with other devices by a systems integrator prior to sale, or when it is resold.
Handling the Instrument
To avoid electric shock, do not open the instrument's case. The internal components of the instrument carry high voltages and may become very hot during
operation.
• If the instrument exhibits abnormal operation or display during use, review the information in "14.2 Trouble Shooting" (p.216) and "14.3 Error Indication" (p.218) before
contacting your dealer or Hioki representative.
• To avoid damage to the instrument, protect it from physical shock when transporting
and handling. Be especially careful to avoid physical shock from dropping.
• The protection rating for the enclosure of this device (based on EN60529) is *IP30.
*IP30:
This indicates the degree of protection provided by the enclosure of the device against use in hazardous locations, entry of solid foreign objects, and the ingress of water.
3: Protected against access to hazardous parts with tools more than 2.5 mm in diameter. The
equipment inside the enclosure is protected against entry by solid foreign objects larger than
2.5 mm in diameter.
0: Not protected against use in hazardous locations. The enclosure does not protected against
entry by solid foreign objects.
Handling the cords and clamp sensors
• To prevent damage to the instrument and clamp sensors, never connect or disconnect a sensor while the clamp sensor is clamped around a conductor.
• To avoid damaging the power cord, grasp the plug, not the cord, when unplugging it
from the power outlet.
• To avoid breaking the cables, do not bend or pull them.
• For safety reasons, when taking measurements, only use the L1000 Voltage Cord.
• Avoid stepping on or pinching cables, which could damage the cable insulation.
• Keep the cables well away from heat sources, as bare conductors could be exposed
if the insulation melts.
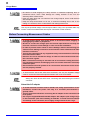
• When disconnecting the BNC connector, be sure to release the lock before pulling off
the connector. Forcibly pulling the connector without releasing the lock, or pulling on
the cable, can damage the connector.
• To avoid damaging the output cable, grasp the connector, not the cable, when
unplugging the cable.
• When disconnecting the clamp sensor from the instrument, be sure to grip the part of
the connector with the arrows and pull it straight out. Gripping the connector elsewhere or pulling with excessive force may damage the connector.
• Use the 9217 Connection Cord (resin) when connecting to insulated BNC connector
(resin), and the 9165 Connection Cord (metal) when connecting to metallic BNC connector (metal). If you connect metal BNC cable to insulated BNC connector, the insulated BNC connector can be damaged and the connection equipment may be
damaged.
8
Usage Notes
• Be careful to avoid dropping the clamp sensors or otherwise subjecting them to
mechanical shock, which could damage the mating surfaces of the core and
adversely affect measurement.
• Keep the clamp jaws and core slits free from foreign objects, which could interfere
with clamping action.
• Keep the clamp closed when not in use, to avoid accumulating dust or dirt on the
mating core surfaces, which could interfere with clamp performance.
Use only the specified voltage cords and input cables. Using a non-specified cable may
result in incorrect measurements due to poor connection or other reasons.
Before Connecting Measurement Cables
• To avoid electric shock, turn off the power to all devices before plugging or
unplugging any cables or peripherals.
• Be sure to connect the voltage input and current input terminals correctly. An
incorrect connection could damage or short circuit this instrument.
• In order to prevent electric shock or device damage, observe the following precautions when making connections to the external control terminals and other
interface connectors.
• Turn off the instrument and any equipment being connected before connecting
the measurement cables.
• Exercise care not to exceed the ratings of external control terminal and interface connector signals.
• Make connections securely to avoid the risk of connections coming loose during instrument operation and bringing wires into contact with other electrically
conductive parts.
• Ensure that devices and systems to be connected to the external control terminals are properly isolated.
• To avoid electric shock and short-circuit accidents, use only the supplied voltage
cords to connect the instrument input terminals to the circuit to be tested.
Always turn both devices OFF when connecting and disconnecting an interface
connector.
About the AC adapter
• To avoid electrical accidents and to maintain the safety specifications of this
instrument, connect the power cord only to a 3-contact (two-conductor +
ground) outlet.
• Turn the instrument off before connecting the AC adapter to the instrument and
to AC power.
• Use only the supplied Model Z1002 AC Adapter. AC adapter input voltage range
is 100 to 240 VAC (with ±10% stability) at 50/60 Hz. To avoid electrical hazards
and damage to the instrument, do not apply voltage outside of this range.
9
Usage Notes
About the battery pack
For battery operation, use only the HIOKI Model Z1003 Battery Pack. We do not
take any responsibility for accidents or damage related to the use of any other
batteries.
• The battery pack is subject to self-discharge. Be sure to charge the battery pack
before initial use. If the battery capacity remains very low after correct recharging, the
useful battery life is at an end.
• To avoid problems with battery operation, remove the batteries from the instrument if
it is to be stored several week or more.
Others
Avoid using an uninterruptible power supply (UPS) or DC/AC inverter with rectangular
wave or pseudo-sine-wave output to power the instrument. Doing so may damage the
instrument.
Before Connecting to the Lines to be Measured
• To avoid short circuits and potentially life-threatening hazards, never attach the
clamp sensor to a circuit that operates at more than the maximum rated voltage to earth
(See your clamp sensor's instruction manual for its maximum ratings.)
• The maximum input voltage is 1000 VAC, ±600 VDC. Attempting to measure
voltage in excess of the maximum input could destroy the instrument and
result in personal injury or death.
• To avoid electrical hazards and damage to the instrument, do not apply voltage
exceeding the rated maximum to the input terminals.
• The maximum rated voltage between input terminals and ground is 600 VDC/
AC. Attempting to measure voltages exceeding 600 V with respect to ground
could damage the instrument and result in personal injury.
• Connect the clamp sensors or voltage cords to the instrument first, and then to
the active lines to be measured. Observe the following to avoid electric shock
and short circuits.
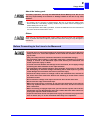
• Do not allow the voltage cord clips to touch two wires at the same time.
• Never touch the edge of the metal clips.
• When the clamp sensor is opened, do not allow the metal part of the clamp to
touch any exposed metal, or to short between two lines, and do not use over
bare conductors.
• When connecting a clip-type input cord, you will need to clip the line to the terminal while it is hot. Bringing two wires into contact with each other while connecting the clips will cause a short-circuit.
• To prevent electrical shock and personnel injury, do not touch any input terminals on the VT (PT), CT or the instrument when they are in operation.
10
Usage Notes
• To avoid electrical accidents, confirm that all connections are secure. The
increased resistance of loose connections can lead to overheating and fire.
• Ensure that the input does not exceed the maximum input voltage or current to
avoid instrument damage, short-circuiting and electric shock resulting from
heat building.
• To avoid electric shock when measuring live lines, wear appropriate protective
gear, such as insulated rubber gloves, boots and a safety helmet.
When the instrument's power is turned off, do not apply voltage to the instrument.
Doing so may damage the instrument.
While Measuring
If an abnormality such as smoke, strange sound or offensive smell occurs, stop
measuring immediately, disconnect from the measurement lines, turn off the
instrument, unplug the power cord from the outlet, and undo any changes to the
wiring. Contact your dealer or Hioki representative as soon as possible. Continuing to use the instrument may result in fire or electric shock.
11
1.1 Product Overview
1.1
Chapter 1
Product Overview
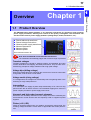
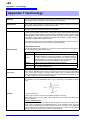
The PW3198 Power Quality Analyzer is an analytical instrument for monitoring and recording
power supply anomalies, allowing their causes to be quickly investigated. The instrument can
also be used to assess power supply problems (voltage drops, flicker, harmonics, etc.).
Record abnormal waveforms
Record voltage fluctuations
Observe power supply waveforms
Measure harmonics
Measure flicker
Measure power
Transient voltages
One instrument does it all!
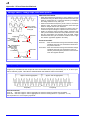
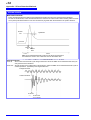
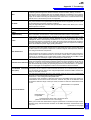
How does the PW3198 record abnormal waveforms?
The instrument automatically judges and records a range of problems:
Transient voltages
Voltage dips
Transient voltages are caused by lightning strikes, circuit-breaker and relay
contact obstructions and tripping, and other phenomena. They are often characterized by precipitous voltage variations and a high peak voltage.
Voltage dips (falling voltage)
Short-lived voltage drops are caused by the occurrence of a inrush current with
a large load, such as when a motor starts.
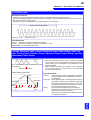
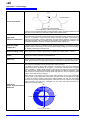
Voltage swells
Voltage swells (rising voltage)
In a voltage swell, the voltage rises momentarily due to a lightning strike or the
switching of a high-load power line.
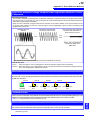
Interruptions
Interruptions
In an interruption, the supply of power stops momentarily or for a short or long
period of time due to factors such as a circuit breaker tripping as a result of a
power company accident or power supply short-circuit.
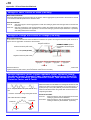
Harmonic and high-order harmonic elements
Harmonics are caused by distortions in the voltage and current caused by the
semiconductor control devices that are frequently used in equipment power
supplies.
Harmonic
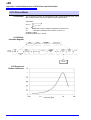
Flicker (ΔV10, IEC)
Flicker is caused by blast furnace, arc welding, and thyristor control loads. The
resulting voltage fluctuations cause flicker in light bulbs and similar phenomena.
Flicker
Chapter 1 Overview
Overview
1
12
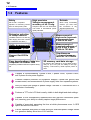
1.2 Features
1.2
Features
Safety
Cat IV 600 V compliant.
Capable of measuring lead-in
wires on their primary side.
High precision
Voltage measurement
accuracy of ±0.1%rdg.
Reliable
Complies with the new IEC610004-30 Class A international power
quality standard.
Extensive selection
of clamp sensors
Quick setup functionality
ensures you won't miss
the occurrence of any
abnormal phenomena.
(Available rated for use with signals ranging from leak currents
to a maximum of 5,000 A.)
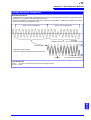
Measurement of
high-order harmonic
components from
2 kHz to 80 kHz
Ability to measure all
parameters
necessary for power
quality measurement
Measurement of
transient voltages of
up to 6,000 V from
5 kHz to 700 kHz
Support for 400 Hz
lines
Simultaneous
3-channel measurement of ΔV10 flicker
Easy downloading of data to a
computer via USB or LAN
Separately available software simplifies analysis.
SD memory card data storage
By allowing the PW3198 to record data continuously for up to one year, the ability to use highcapacity 2 GB memory cards inspires peace of
mind.
Capable of accommodating 1-phase 2-wire, 1-phase 3-wire, 3-phase 3-wire,
and 3-phase 4-wire power supplies.
Features isolated channels for equipment analysis, neutral line ground fault
measurement, and measurement of power supply lines from separate systems.
Lets you select line voltage or phase voltage. Includes Δ-Y conversion and Y-Δ
conversion functionality.
Features a TFT color LCD that is easily visible in both bright and dark settings.
Capable of true simultaneous measurement with gap-less continuous operation, assuring your ability to reliably capture target phenomena.
Capable of accurately assessing the time at which phenomena occur. A GPS
option allows time correction.
Can be operated with peace of mind during an extended power outage thanks
to a generous battery drive time of 180 minutes.
13
1.3 Measurement Flowchart
1.3
1
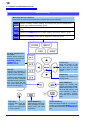
Measurement Flowchart
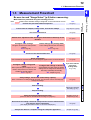
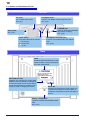
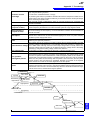
Measurement is performed using the following process:
See:
3.3 (p.31)
Connect the AC adapter, voltage cords, and current clamps.
3.4 (p.32) to 3.7 (p.34)
Turn on the instrument.
3.8 (p.36)
Perform zero adjustment after allowing the instrument to warm up for 30
minutes.
4.1 (p.37)
Configure initial settings.
Load a settings file (settings data).
Configure connection and clamp sensor
settings.
See: 4.3 (p.39)
Load a settings file from the SD memory
card.
See: 9.7 (p.145)
Connect to the measurement line.
Verify connections.
Note: If waveforms, measured values, or vector diagrams appear incorrect, reconnect the lines.
Configure settings using quick
setup.
Select quick setup and configure the connection, clamp sensor, VT and CT, and
TIMEPLOT interval settings.
See: 4.7 (p.50)
Configure the settings as desired.
Set thresholds and other values as desired.
Settings can be configured as desired even
after using quick setup functionality.
See: Chapter 5 (p.55)
PW3198
operating state
shaded areas indicate settings configured on the instrument's screen.
Perform the pre-measurement inspection.
4.5 (p.46)
4.6 (p.48)
[SETTING]
Note:
If you have loaded a
settings file
(settings data)
9.7 (p.145)
Verify settings, event count, and memory capacity.
4.8 (p.53)
Start recording.
"Starting and Stopping
Recording" (p.14)
[RECOR
DING]
Note: If waveforms or settings appear incorrect, or if the event count is unusually high,
change the settings.
Check and analyze measurement data.
(Data can also be checked while recording is in progress.)
Chapter 6 (p.75) to
Chapter 8 (p.119)
Disconnect the voltage cords and clamp sensors from the measurement
line and turn off the instrument.
3.8 (p.36)
(The display data will be erased. It cannot be redisplayed.)
Analyze the data on a computer using the computer application.
Chapter 12 (p.155)
[ANALYZING]
Stop recording.
Chapter 1 Overview
Be sure to read "Usage Notes" (p.6) before measuring.
14
1.3 Measurement Flowchart
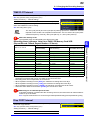
Starting and Stopping Recording
You can start and stop recording either manually or using real-time control. In either case, repeat recording can be used.
Manual
Start
Press
Stop
Press
Real-time control
.
Press
to start recording at the set time and date.
Stops automatically at the specified stop time.
to stop
Press the
recording.
Notes
Repeated
recording
to force stop.
See: "Time Start" (p.58)
Recording is performed at the specified interval (once a week or once a day), and files
containing measurement data are created at the specified interval. Repeated recording
can be used to record for up to 55 weeks (approx. 1 year).
See: "Repeat Record" (p.59)
To start a new recording session after recording has ended, press the DATA RESET key, set the instrument to [SETTING] mode, and then press the START/STOP key. (Note that pressing the DATA RESET
key will erase the displayed measurement data.)
Relationship between the operation status and key operations
[SETTING]
Set
[RECORDING]
Start
recording
[ANALYZING]
Stop
recording
Revert to [SETTING] mode
Do not remove the SD memory card while recording or analyzing data. Doing so
may cause data on the card to be corrupted.
15
2.1 Names and Functions of Parts
Chapter 2
2.1
Names and Functions of Parts
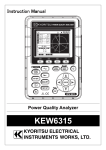
Front
Display
Operation keys
6.5" TFT color LCD display
See: "Display Items and Screen Types" (p.20)
See:(p.16)
POWER LED
Lights up when the POWER switch is
turned on and power is supplied to the instrument.
Normal operation: Solid green
When using battery pack: Solid red
See: "3.8 Turning the Power On and Off (Setting the Default Language)" (p.36)
F key (Function key)
Select and change display contents and settings.
See:"2.2 Basic Operations" (p.19)
START/STOP LED
When in the recording
standby state:
Flashing green
When recording:
Solid green
2
Chapter 2 Names and Functions of Parts Basic Operations & Screens
Names and Functions of Parts
Basic Operations
& Screens
16
2.1 Names and Functions of Parts
Operation keys
Menu keys (Screen selection)
Press a key to select a screen (the lit key indicates the current selection).
Displays the [SYSTEM] screen (which provides a list of system settings, event
settings, recording condition settings, and memory [file] options [settings data,
screen copy, measurement data]). (p.23)
Displays the [VIEW] screen (which displays waveform and measured values).
(p.24)
Displays the [TIMEPLOT] screen (which displays time series graphs). (p.25)
Displays the [EVENT] screen (which displays an event list). (p.26)
DF keys (display function keys)
Selects which screen to
display from the selected
[SYSTEM], [VIEW],
[TIMEPLOT], or
[EVENT] screen.
Cursor keys
Move the cursor on the
screen. The cursor keys
are also used to scroll
through graphs or waveforms.
ESC key
Cancels any selections or
changes made and reverts
to the previous settings.
ENTER key
Finalizes the selected or
changed item.
Pressing and holding this
key for at least 3 seconds
activates the key lock function. (To cancel the key
lock, press and hold for at
least 3 seconds again.)
COPY key
Outputs data from the
currently
displayed
screen to the SD memory card or printer.
DATA RESET key
Erases all currently displayed measurement data.
(Data that has been recorded to the SD memory card
is not erased.) To start a
new recording session,
press this key to reset the
data.
MANU EVENT key
Generates an event, initiating recording of measured values and event
waveforms.
START/STOP key
Starts and stops recording. To resume recording, press the DATA RESET key to reset the data followed by the START/STOP
key.
17
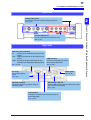
2.1 Names and Functions of Parts
Upper side
Voltage input jacks
Connect the included L1000 Voltage Cord here.
2
See: (p.34)
See: (p.34)
Right side
External control terminal
IN
: Allows use of external input as an event
trigger.
OUT : Outputs a signal when an internal event
occurs.
GND : Serves as the ground terminal for the
external event input and output terminals.
USB interface
Connect a computer here using
the included USB cable.
See: (p.149)
See: (p.156)
Air vents
Do not block these
vents.
Strap eyelet
See: (p.28)
See: (p.6)
RS-232C interface
Connect a GPS box or printer using an
RS-232C cable.
SD memory card slot
Insert an SD memory card here. Be sure to close
the cover when recording.
See: (p.32)
LAN interface
Connect a computer here using the optional
9642 LAN Cable.
See: (p.160)
Chapter 2 Names and Functions of Parts Basic Operations & Screens
Current input jacks
Connect optional clamp sensors here.
18
2.1 Names and Functions of Parts
Left side
Air vents
Do not block these vents.
AC adapter hook
Loop the AC adapter cord through this hook.
See: (p.6)
See: (p.32)
CHARGE LED
Lights up while the Z1003 Battery Pack is charging.
Strap eyelet
See: (p.28)
See: (p.30)
Power switch
Turns the instrument on and off.
Power ON
Power OFF
AC adapter connection jack
Connect the included Z1002 AC Adapter
here.
See: (p.32)
See: (p.36)
Back
Label
Contains important warnings as well
as the CE mark, country of manufacture, and manufacturer.
MAC address label
Displays the instrument's unique MAC
address, which is used when configuring
a LAN connection. Do not remove the label as the information it contains is necessary in order to manage the device.
Serial No.
Displays the instrument's serial number. Do
not remove the label as the information is
contains is necessary in order to manage the
device.
Battery compartment
Install the included Z1003 Battery Pack
here.
See: (p.30)
19
2.2 Basic Operations
2.2
Basic Operations
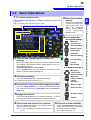
1 To select a display screen
2 Select the screen to
display.
Press SYSTEM, VIEW,TIME PLOT, or EVENT to display the corresponding screen.
See: "2.3 Display Items and Screen Types" (p.20)
1
4
4 Select and finalize
the desired settings.
2
Move the
cursor to the
desired setting
7
3
8
9
6
5
3 To select and change display contents and
Press one of the F keys to select and change display contents
and settings. The displayed function labels depend on the currently displayed screen.
Freeze the waveform or value display.
On the [VIEW] screen, you can freeze the waveform or value
display by pressing the F4 [HOLD] key.
5 Start/stop recording.
See: "Starting and Stopping Recording" (p.14)
6 Revert to [SETTING] mode after stopping recording.
Press the DATA RESET key to reset the measurement data.
The instrument will return to [SETTING] mode from [ANALYZING] mode.
7 Engage the key lock.
To change a value
Move the
cursor to the
desired setting
Select a digit
Select a value
Accept setting
Press and hold the ESC key for at least 3 seconds. To cancel
the key lock, press and hold the key for at least 3 seconds.
See: "9.5 Saving, Displaying, and Deleting Screen Copies"
(p.143)
Cancel
the setting
Select the
value so that it
can be
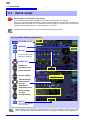
changed
Press the START/STOP key to start/stop recording.
Press the COPY key. Data will be saved to the SD
card (or output to the printer).
Select the
desired setting
Accept setting
settings
8 Save screen data (output it to a printer).
Display a pulldown menu
Cancel
9 Generate an event manually.
Press the MANU EVENT key. Measured values and event waveforms
at that time will be recorded.
See: "Manual Events" (p.13)
2
Chapter 2 Names and Functions of Parts Basic Operations & Screens
Press one of the DF keys
to select and change display contents and settings. The displayed
function labels depend
on the currently displayed screen.
20
2.3 Display Items and Screen Types
2.3
Display Items and Screen Types
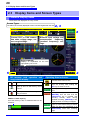
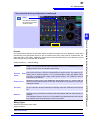
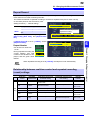
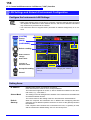
Common Display Items
These items are displayed on every screen.
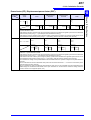
Screen Types
The tab for the currently displayed screen is shown brighter than the rest.
2, 3
1
6
Current CH1 to CH4 connection state, voltage range, current range settings
2
Nominal input voltage and
measurement
frequency
(nominal frequency) settings
Help comment
Displays an explanation for the item
highlighted by the cursor.
5
1SD
memory card operation and
usage status display
Lights up when no SD card is inserted.
(White)
Lights up when an SD memory card is
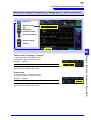
inserted.
(Red)
Lights up when the SD memory card is
being accessed.
TIMEPLOT data capacity
Once the memory is full, no additional data can be
recorded.
2Operating State Indicators
4
Indicates Data Hold is active.
Lights to indicate Key Lock is active
(keys are locked), after holding the
ESC key for three seconds.
Lights up when settings can be configured.
The [SETTING] indicator shows
[WAITING] from the time that the
START/STOP key is pressed until
recording actually starts. During
repeated recording, [WAITING] is also
displayed when recording is stopped.
Lights up when data is being recorded.
Lights up when the instrument is in
[ANALYZING] mode after recording
stops.
21
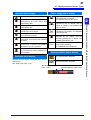
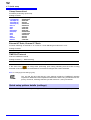
2.3 Display Items and Screen Types
3 Interface status display
5 Power supply status display
Lights up during normal operation.
(White)
Lights up when the instrument is
downloading data.
(Orange)
Lights up when the instrument is connected to an HTTP server.
Lights up when a printer is connected
to the RS-232C terminal.
(Blue)
(Red)
(Yellow)
Lights up when GPS positioning is
active while connected to the PW9005
GPS Box.
Lights up when the RS connected
device is set to GPS but the PW9005
GPS Box is not yet connected.
Lights up when the PW9005 GPS Box
is connected but GPS positioning is
not yet active.
4Real-time clock display
(White)
(Red)
No display
Lights up when the instrument is being
powered by the AC adapter and the
battery is charging. The POWER LED
will turn green.
Lights up when the instrument is being
powered by the battery. The POWER
LED will turn red.
Lights up when the instrument is being
powered by the battery and the
remaining battery life is limited. The
POWER LED will turn red.
No display indicates that the instrument is off or charging.
The CHARGE LED will light up.
6 Event generation status display
An event has been detected.
(Orange)
Displays the current year, month, day, hour, minute,
and second.
See: Setting the Clock: (p.65)
No event has been detected.
(White)
No. of events recorded
(Max. 1,000)
Event indicator
Full bar indicates 1,000 events.
2
Chapter 2 Names and Functions of Parts Basic Operations & Screens
Lights up when the instrument is both
connected to an HTTP server and
downloading data.
Lights up when the instrument is being
powered by the AC adapter.
The POWER LED will turn green.
22
2.3 Display Items and Screen Types
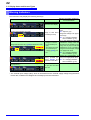
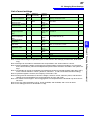
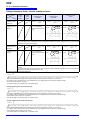
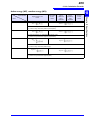
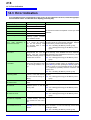
Warning Indicators
The instrument may display the following warnings:
Display
(Voltage indicator turns red.) ([Udin] indicator turns red.)
2
([fnorm] indicator turns red.)
1
(The voltage range indicator and current range indicator
are grayed out.)
1
Solution and page number for
more information
Normal screen display
-
Switch to an appropriate clamp
sensor.
See: "Options" (p.3)
Range or crest factor
Change the settings to an approexceeded (current).
priate range.
See: "5.1 Changing Measurement Conditions" (p.55)
(Current range indicator turns red.)
1
Cause
1. Range or crest factor exceeded (voltage).
2. The measured value
and nominal input
voltage ([Udin])* differ.
For (1), the measured value has
exceeded the voltage value that
the instrument is capable of measuring. Use VT (PT) to make the
measurement. If only (2) applies,
change the nominal input voltage
to an appropriate value.
See: "5.1 Changing Measurement Conditions" (p.55)
The measurement fre- Change the measurement frequency (nominal fre- quency to an appropriate value.
quency [fnom]) and See: "5.1 Changing Measuremeasured value differ.
ment Conditions" (p.55)
VT (PT) and CT have
been set.
-
*: The nominal input voltage (Udin), which is calculated from the nominal supply voltage using the transformer ratio, indicates the voltage that is actually input to the instrument.
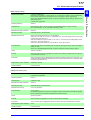
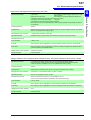
23
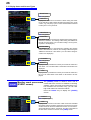
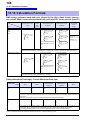
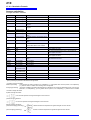
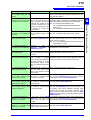
2.3 Display Items and Screen Types
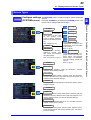
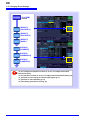
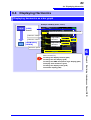
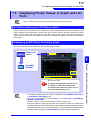
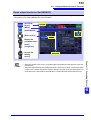
Screen Types
Configure settings
(SYSTEM screen)
The [SYSTEM] screen is used to configure various instrument
settings.
Press the SYSTEM key to display the [SYSTEM] screen. The
screen can be changed with the DF keys.
WIRING
Configures the connection,
clamp sensor, VT ratio, and
CT ratio settings. (This
screen is always displayed
after the instrument is turned
on.)
See: Chapter 4 (p.37)
MAIN
RECORD
Configures the recording,
TIMEPLOT interval, realtime control, and repeated
recording settings.
See: 5.2 (p.58) to 5.3 (p.61)
EVENT1
See: 4.1 (p.37)
Preset
See: 4.7 (p.50)
VectorArea
MEASURE
Configures the connection,
clamp sensor, VT ratio, CT ratio,
current range, event, and TIMEPLOT settings.
See: 5.1 (p.55)
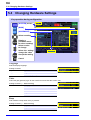
HARDWARE
Configures the display language, screen color, clock, external output, RS-connected
device, beep, LCD backlight,
and LAN settings. Resets the
system.
See: 5.4 (p.64)
See: 5.5 (p.66)
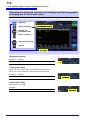
VOLTAGE1
Configures the frequency, swell, dip, interruption, transient
threshold, and hysteresis settings.
VOLTAGE2
Configures the RMS voltage, waveform peak, DC fluctuation,
harmonic distortion factor, high-order harmonic component, and
unbalance factor threshold settings.
WAVE
Configures the threshold settings for generating events with the
voltage waveform.
EVENT2
See: 5.5 (p.66)
CURRENT
Configures the inrush current, RMS current, waveform peak, DC
fluctuation, harmonic distortion factor, high-order harmonic component, unbalance factor, and K factor threshold settings.
HARMONICS
Configures the threshold settings for 0- to 50-order harmonics
(voltage, current, power, phase).
POWER/etc
Configures the active power, reactive power, apparent power,
power factor threshold, timer event, external event, and continuous event settings.
Chapter 2 Names and Functions of Parts Basic Operations & Screens
Zero Adjust
SYSTEM
2
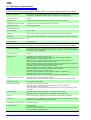
24
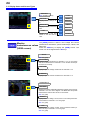
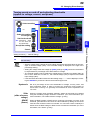
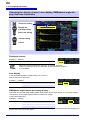
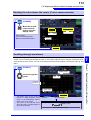
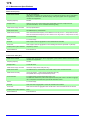
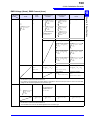
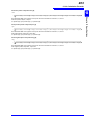
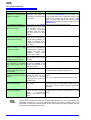
2.3 Display Items and Screen Types
MEMORY
See: Chapter 9 (p.135)
SETTING
Displays a list of settings data.
HARDCOPY
Displays a list of screenshot
data.
LIST
Displays a list of the files
stored on the SD memory
card.
Monitor
instantaneous values
(VIEW screen)
LOAD
SAVE
DELETE
VIEW
DELETE
DELETE
FORMAT
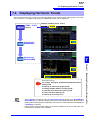
The [VIEW] screen is used to view voltage and current
instantaneous waveforms, phase relationships, values, and
harmonics.
Press the VIEW key to display the [VIEW] screen. The
screen can be changed with the DF keys.
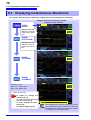
WAVE
See: 6.2 (p.76)
VOLT/CURR
Displays voltage waveforms for channels 1 to 4 on one screen
and current waveforms for channels 1 to 4 on another screen (for
a total of two screens).
VOLTAGE
Displays separate voltage waveforms for channels 1 to 4.
CURRENT
Displays separate current waveforms for channels 1 to 4.
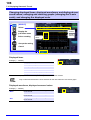
HARMONICS
VECTOR
Displays the phase relationship between voltage and current for
channels 1 to 3 as a vector diagram. The RMS value and phase
instantaneous value is also shown for each order.
See: 6.3 (p.80)
GRAPH
Displays the sum voltage, current, and 0- to 50-order power measured values for channels 1 to 4 as a graph.
See: 6.4 (p.83)
LIST
Displays the sum voltage, current, power measured values (orders 0 to 50) for channels 1 to 4 as a graph.
See: 6.4 (p.83)
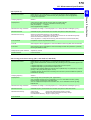
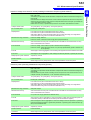
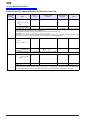
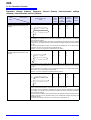
25
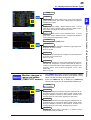
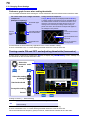
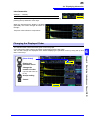
2.3 Display Items and Screen Types
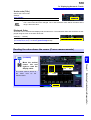
DMM
See: 6.5 (p.89)
POWER
Displays the RMS voltage, RMS current, active power, apparent
power, reactive power, power factor, integral power, and K factor
instantaneous values.
Displays the RMS voltage, voltage distortion factor, ± current
peak value, current unbalance factor, harmonic voltage component, and 10-sec frequency instantaneous values.
CURRENT
Displays the RMS current, current distortion factor, ± current
peak value, current unbalance factor, and high-order harmonic
current component instantaneous values.
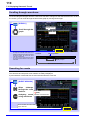
EVENT
Shown only in [ANALYZING] mode.
TRANSIENT
Displays the transient waveform obtained by high-speed sampling when an event occurred.
See: 8.4 (p.126)
HHarmonic
Displays the high-order harmonic voltage and current waveforms
at the time of event occurrence.
See: 8.5 (p.129)
TrendData
Displays a 30-second time series graph depicting fluctuations in
the swell, dip, interruption, or inrush current when an event occurred (0.5 s before and 29.5 s after EVENT IN) (for 400 Hz measurement, approx. 0.125 s before and approx. 7.375 s after
EVENT IN).
See: 8.6 (p.132)
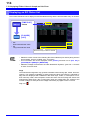
Monitor changes in
measured values
(TIME PLOT screen)
The [TIMEPLOT] screen is used to view RMS, voltage,
and harmonic fluctuations as time series graphs. Flicker
values can also be shown as a graph or list.
Press the TIMEPLOT key to display the [TIMEPLOT]
screen. The screen can be changed with the DF keys.
TREND
See: 7.2 (p.94)
1-SCREEN
Displays the RMS value measured using data collected over approximately 200 ms, the average value of peak or other values
during the TIMEPLOT interval, or the maximum, minimum, and
average values as a time series, showing one per screen.
2-SCREEN
Displays the RMS value measured using data collected over approximately 200 ms, the average value of peak or other values
during the TIMEPLOT interval, or the maximum, minimum, and
average values as a time series, showing two per screen.
ENERGY
Displays the active energy (WP+/WP-) or reactive energy
(WQLAG/WQLEAD) as selected.
Chapter 2 Names and Functions of Parts Basic Operations & Screens
VOLTAGE
2
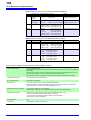
26
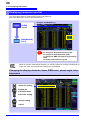
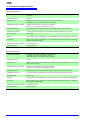
2.3 Display Items and Screen Types
DetailTrend
See: 7.3 (p.101)
DtlTrend
Displays the maximum and minimum values during the TIMEPLOT interval for RMS voltage refreshed each half-cycle, inrush
current, S (t), frequency cycle, or other characteristics measured
in half-cycle or one-cycle units.
HarmTrend
See: 7.4 (p.107)
HARMONIC
Can display 6 orders of harmonics. Displays the average value or
maximum, minimum, and average value during the TIMEPLOT
interval as a time series. (You can select voltage, current, power,
or phase to be displayed.)
INTERHARM
Can display 6 orders of inter-harmonics. Displays the average
value or the maximum, minimum, and average values during the
TIMEPLOT interval as a time series. (You can select voltage or
current to be displayed.)
FLICKER
See: 7.5 (p.111)
GRAPH
Displays Δ10V (instantaneous values) or Pst and Plt values as a
time series. You can select either Δ10V flicker or IEC flicker to be
displayed.
LIST
Displays Δ10V (instantaneous values) or Pst and Plt values as a
list. You can select either Δ10V flicker or IEC flicker to be displayed.
Monitor event occurrence The [EVENT] screen is used to view a list of
events that have occurred. In addition to checking
(EVENT screen)
whether a given event has occurred and the number of times it has occurred, if any, you can view
high-order harmonic measured values.
Press the EVENT key to display the [EVENT]
screen.
EVENT
See: Chapter 8 (p.119)
LIST
Displays a list of events in the order of their occurrence. Detailed
information and the waveform at the time of the event occurrence
are also shown for the event selected on the list. You can also analyze instantaneous values, waveforms, and other information at
the time of the event's occurrence on the [VIEW] screen.
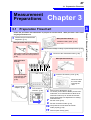
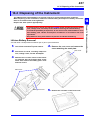
27
3.1 Preparation Flowchart
Measurement
Preparations
3.1
Chapter 3
3
Preparation Flowchart
1
Perform the pre-measurement
inspection. (p.31)
After-purchase item (4)
Install the battery pack. (p.30)
After-purchase item (1) (voluntary)
Back side
4
Connect the voltage cords (p.34) and clamp sensors (p.34).
8
Apply input code input cable labels to
the voltage cords and clamp sensors.
(p.28)
Connect to the measurement line (p.46)
After-purchase item (2)
After-purchase
item (3)
Attach the strap. (p.28)
3 Insert an SD memory card. (p.32)
Secure the voltage
cords together with
a spiral wrapper.
(p.29)
2
Connect the AC
adapter. (p.32)
Be sure to close
the cover after
inserting the
card.
5
Turn on the instrument. (p.36)
6
Perform zero adjustment. (p.37)
To ensure you are able to obtain precise measurements, it is recommended to allow the instrument to warm up for at least 30 minutes
before performing zero adjustment or making
measurements.
Set the clock. (p.65)
7
9
10
Set the connection mode. (p.39)
11
Perform quick setup. (p.50)
Verify that the connections have been
made properly.(p.48)
Chapter 3 Measurement Preparations
Follow the procedure described below to prepare for measurement. "After-purchase" items need
only be performed once.
28
3.2 Initial Instrument Preparations
3.2
Initial Instrument Preparations
Perform the following before starting measurement the first time.
Attaching input cable labels to the voltage cords and clamp sensors
Attach input cable labels to the voltage cords and clamp sensors as needed to allow identification of individual channels.
Before applying the input cable labels
Wipe any dust from the surface of the voltage cords and clamp sensors, and ensure that it is
dry.
Red
Yellow
Blue
Brown
Black
Grey
Green
White
Input Cable Labels
Apply labels
to both ends
of the voltage
cords
Apply labels
to both ends
of the clamp
sensor leads.
Attaching the strap
Use the strap when carrying the instrument or suspending it from a hook during use.
Attach both ends of the strap securely to the instrument. If insecurely attached, the
instrument may fall and be damaged when carrying.
1
1
Tighten securely to keep straps from
loosening or twisting.
1.
2
2.
3
3.
Feed each end of the strap
through the corresponding eyelet on the instrument.
Feed each end of the strap
through its buckle.
Feed each end of the strap
through its loop.
29
3.2 Initial Instrument Preparations
Bundle the voltage cord leads with the spiral tubes
The instrument ships with 20 spiral wrappers. Use the wrappers to bundle pairs of cords (colored and
black) together as needed.
Preparation items
(Two sets of the following)
L1000 Voltage Cord
Procedure
1. Line up two cords (colored and black).
Start bundling from one end of the leads.
2. Wind the spiral tube around the leads.
Wrap the two leads together with the spiral tube. The five spiral tubes should be applied with suitable spacing.
Spiral tube
Colored
Black
Attach alligator clips that are
the same color as the cords.
Chapter 3 Measurement Preparations
Alligator Clips (eight, one each red, yellow, blue, gray, and four black)
Banana Plug Leads (eight, one each red, yellow, blue, gray, and four black)
Spiral Tubes (twenty, for cable bundling)
3
30
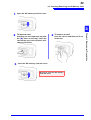
3.2 Initial Instrument Preparations
c
Installing the battery pack
Be sure to read the "About the battery pack" (p.9) before connecting power.
The battery pack is used to power the instrument during power outages and as a backup power supply.
When fully charged, it can provide backup power for approximately 180 minutes in the event of a power
outage. The battery pack is designed to charge during normal use of the instrument. The CHARGE LED
will turn red while the battery pack is charging.
Note that if a power outage occurs while the battery pack is not being used, displayed measurement data
will be erased. (Data that has been recorded on the SD memory card is retained.)
Tools needed to install the battery pack: 1 Phillips head screwdriver
1.
2.
4.
Turn off the instrument.
Disconnect
Z1002.
the
AC
Connect the battery pack's plug to the connector (orient the connector so that the two protruding pieces are on the left).
ADAPTER
3
2
3.
1
Turn the instrument upside down
and remove the screws that hold
the battery pack cover in place.
Remove the cover.
5.
Insert the battery pack as indicated by
the labeling on the battery pack.
Exercise care not to pinch the battery
pack wires between the batter pack and
the instrument.
6.
Reattach the battery pack cover to the
instrument and tighten the screws
securely.
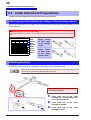
31
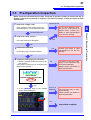
3.3 Pre-Operation Inspection
3.3
Pre-Operation Inspection
Before using the instrument the first time, verify that it operates normally to ensure that the no
damage occurred during storage or shipping. If you find any damage, contact your dealer or Hioki
representative.
1
Inspect the voltage cords
Metal Exposed
Is the insulation of the voltage cord to be
used damaged, or is bare metal exposed?
No Metal Exposed
2
Inspect the clamp sensors
Yes
Is a clamp cracked or damaged?
No
3
Inspect the instrument
Yes
Is damage to the instrument evident?
Contact your dealer or Hioki
representative if you find any
damage.
No
4
Inspection after turning on instrument
1. Does the self-test (model and version) display appear?
(The version number may be changed to the
latest version number.)
No
The power cord may be damaged, or the instrument may
have internal damage.
Please contact your dealer or
Hioki representative.
HIOKI PW3198
POWER QUALITY ANALYZER
Ver 1.00
Yes
2. Is the [WIRING] page of the settings
screen being displayed?
An error is
displayed
The instrument may be damaged internally.
Please contact your dealer or
Hioki representative.
Yes
Inspection complete
3
Chapter 3 Measurement Preparations
Do not use if damage is present, as you could receive an
electric shock. Contact your
dealer or Hioki representative
if you find any damage.
32
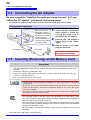
3.4 Connecting the AC Adapter
3.4
Connecting the AC Adapter
Be sure to read the "Handling the cords and clamp sensors" (p.7) and
"About the AC adapter" (p.8) before connecting power.
Connect the AC adapter to the power inlet on the instrument, and plug it into an outlet.
Connection Procedure
2
Hooks for AC
adapter
AC adapter
1
After connecting the
output plug, loop the
AC adapter cord on either of the two hooks
on the instrument.
(This will prevent the
cord from being pulled
out of the socket.)
that the instrument’s
power switch is turned off.
Connect the power cord to
the inlet on the AC adapter.
2. Connect
the AC adapter’s
output plug to the instrument.
3. Plug the power cord's input
plug into an outlet.
Power cord
3
3.5
1. Check
Turn off the instrument before
unplugging the AC adapter.
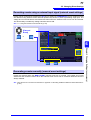
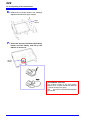
Inserting (Removing) an SD Memory Card
Important
• Use only HIOKI-approved SD memory cards. Proper operation is not guaranteed if other cards
are used.
• Format new SD memory cards before use.
• Format SD memory cards with the instrument. Using a computer to format the card may
reduce the card’s performance.
See:"9.2 Formatting SD Memory Cards" (p.138)
• Inserting a SD card upside down, backwards or in the wrong direction may damage
the instrument.
• Do not turn off the instrument while the SD memory card is being accessed. Never
remove the SD memory card from the instrument. Doing so may cause data on the
card to be corrupted.
• Do not remove the SD memory card while recording or analyzing data. Doing so may
cause data on the card to be corrupted.
• The operating lifetime of the SD memory card is limited by its flash memory. After
long-term or frequent usage, data reading and writing capabilities will be degraded. In
that case, replace the card with a new one.
• No compensation is available for loss of data stored on the SD memory card, regardless of the content or cause of damage or loss. Be sure to back up any important data
stored on an SD memory card.
• The SD memory card operation indicator (p.20) will turn red while the card is being
accessed.
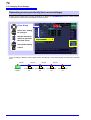
Insert and remove SD memory cards as follows:
33
3.5 Inserting (Removing) an SD Memory Card
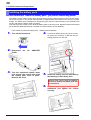
1
Open the SD memory card slot cover.
3
3
To insert a card:
Orienting the card right side up (with
the [] mark on the top), insert the
card all the way in the direction indicated by the arrow.
2
To remove a card:
Push the card in and then pull it out
of the slot.
Close the SD memory card slot cover.
Be sure to close the SD memory
card slot cover.
Chapter 3 Measurement Preparations
2
34
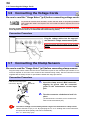
3.6 Connecting the Voltage Cords
3.6
Connecting the Voltage Cords
Be sure to read the "Usage Notes" (p.6) before connecting voltage cords.
To prevent an electric shock accident, confirm that the white or red portion (insulation
layer) inside the cable is not exposed. If a color inside the cable is exposed, do not use
the cable.
Plug the voltage cord leads into the voltage input jacks on the instrument (the number of connections depends on the lines to be measured and selected wiring mode).
Connection Procedure
Plug the voltage cables into the appropriate channels' voltage measurement jacks.
Insert the plugs into the jacks as far as they
will go.
3.7
Connecting the Clamp Sensors
Be sure to read the "Usage Notes" (p.6) before connecting clamp sensors.
Plug the Clamp sensor cables into the current measurement jacks on the instrument (the number of connections depends on the lines to be measured and selected wiring mode). See the instruction manual
supplied with the Clamp sensor for specification details and usage procedures.
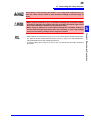
Connection Procedure
PW3198 current input jack
Connector, aligning
BNC
connector
1
Lock
2
1.
2.
Insert the clamp sensor's BNC connector,
aligning its groove with the connector
guide on the instrument’s current input
jack.
Turn the connector clockwise to lock it in
place.
(To disconnect the connector, turn it counterclockwise to unlock it and then pull.)
To measure voltage and current beyond the range of the instrument or clamp sensor
Use an external VT (PT) or CT. By specifying the VT or CT winding ratio on the instrument,
the input level at the primary side can be read directly.
See: "4.7 Quick setup" (p.50)
35
3.7 Connecting the Clamp Sensors
During wiring, avoid touching the VT(PT), CT or input jacks. Exposed live contacts can cause electric shock or other accident resulting in personal injury or
death.
• When using an external VT (PT), avoid short-circuiting the secondary winding.
If voltage is applied to the primary when the secondary is shorted, high current
flow in the secondary could burn it out and cause a fire.
• When using an external CT, avoid open-circuiting the secondary winding. If
current flows through the primary when the secondary is open, high voltage
across the secondary could present a dangerous hazard.
Chapter 3 Measurement Preparations
• Phase difference in an external VT (PT) or CT can cause power measurement errors.
For optimum power measurement accuracy, use a VT (PT) or CT that exhibits minimal phase difference at the operating frequency.
• To ensure safety when using a VT (PT) or CT, one side of the secondary should be
grounded.
3
36
3.8 Turning the Power On and Off (Setting the Default Language)
3.8
Turning the Power On and Off (Setting the
Default Language)
Be sure to read the "Usage Notes" (p.6) before turning the instrument on.
Turn on the instrument after connecting the AC adapter, voltage cords, and clamp sensors.
Turning the power on
Turn the POWER switch on ( | ).
The instrument performs a 10-second power-on self test.
See: 3.3 (p.31)
After the self-test is complete, the [SYSTEM]-[WIRING] screen will be displayed.
If the self-test fails, operation stops at the self-test screen. If the fault recurs after turning the power off and on, the instrument may be damaged. Perform the following procedure:
1. Cancel measurement and disconnect the voltage cords and clamp sensors from the
measurement line before turning off the instrument's POWER switch.
2. Disconnect the power cord, voltage cords, and clamp sensors from the instrument.
3. 3. Contact your dealer or Hioki representative.
For best precision, allow at least 30 minutes warm-up before executing zero adjustment and measuring.
Turning the power off
Turn the POWER switch off (
).
After use, always turn OFF the power.
Do not turn the instrument off with the voltage cords and clamp sensors connected to
the measurement line. Doing so may damage the instrument.
Setting the Default Language
When the instrument is turned on for the first time after performing a boot key reset (p.73), the following
message will be displayed on the startup screen:
Please select default language.
English: F1 Japanese: F2 Chinese: F3
Select the desired language with the F key. (F1: English, F2: Japanese, F3: Chinese)
This default language setting is retained even if the system is reset (p.73). The language is not retained
when the instrument is reset to its factory settings with a boot key reset (p.73).
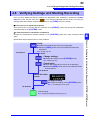
37
4.1 Warm-up and Zero-adjust Operation
Configuring the Instrument
before Measurement
(SYSTEM - SYSTEM screen)
and Wiring
Chapter 4
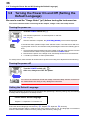
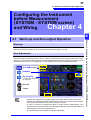
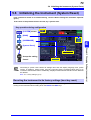
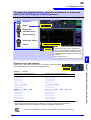
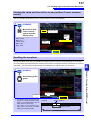
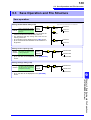
Warm-up and Zero-adjust Operation
Warm-up
It is necessary to allow the PW3198 to warm up to ensure its ability to make precise measurements.
Allow the instrument to warm up for at least 30 minutes after turning it on. (p.36)
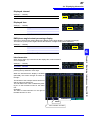
Zero Adjustment
Zero-adjust functionality creates a state in which the input signals are equal to zero in the instrument's
internal circuitry and uses that level as zero. In order to ensure the device's ability to make precise measurements, it is recommended to perform zero adjustment after allowing the instrument to warm up for at
least 30 minutes. Perform zero-adjustment on both voltage and current measurement channels.
[SYSTEM] screen
[WIRING]
[Zero Adjust]
A confirmation dialog will
be displayed.
Execute
Cancel
• Perform zero adjustment only after plugging the clamp sensor into the instrument.
• Perform zero adjustment before attaching to the lines to be measured (proper adjustment requires the absence of any input voltage or current).
• In order to ensure the instrument's ability to make precise measurements, zero
adjustment should be performed at an ambient temperature level that falls within the
range defined by the device specifications.
• The operating keys are disabled during zero adjustment.
Chapter 4 Configuring the Instrument before Measurement (SYSTEM - SYSTEM screen)
4.1
4
38
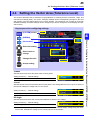
4.2 Setting the Clock
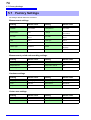
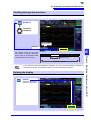
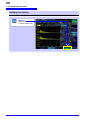
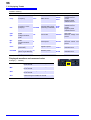
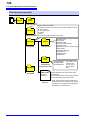
4.2
Setting the Clock
This section describes how to set the PW3198's clock.
It is recommended to check the clock before starting recording.
[SYSTEM] screen
[MAIN]
[HARDWARE]
Move
Select value to
change
Set value
Accept setting
Cancel
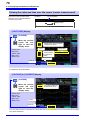
39
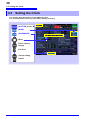
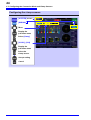
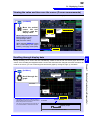
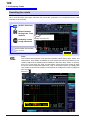
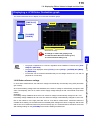
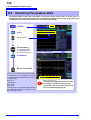
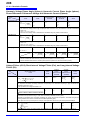
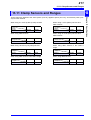
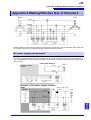
4.3 Configuring the Connection Mode and Clamp Sensors
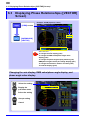
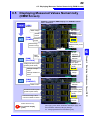
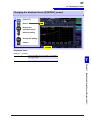
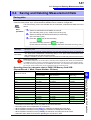
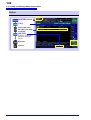
4.3
Configuring the Connection Mode and
Clamp Sensors
This section describes how to configure the connection mode and clamp sensors appropriately
for the measurement line being analyzed.
Eight wiring modes are available.
To select the wiring mode
[SYSTEM] screen
4
[WIRING]
Display the
pull-down menu
Select
[WIRING]
[CH123], [CH4]
Display the
pull-down menu
Select the
connection mode
Accept setting
Cancel
Accepting the settings will cause a
connection diagram for the selected
connection mode to be displayed.
Accepting the selection displays the
wiring diagram of the selected wiring
mode. (p.40)
• To measure multiphase power, use the same type of clamp sensor on each phase
line. For example, to measure 3-phase 4-wire power, use the same model clamp sensors on channels 1 to 3.
• When using clamp sensors with switchable ratings (ranges), for example the 9667
Flexible Clamp-On Sensor, use the same rating (range) setting for the sensors and
the instrument.
Chapter 4 Configuring the Instrument before Measurement (SYSTEM - SYSTEM screen)
Move
40
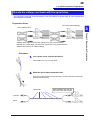
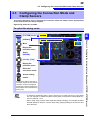
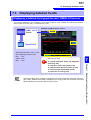
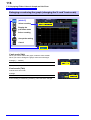
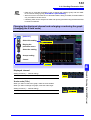
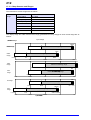
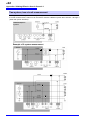
4.3 Configuring the Connection Mode and Clamp Sensors
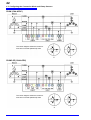
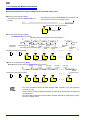
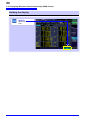
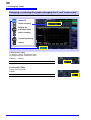
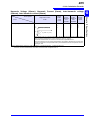
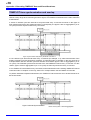
Connection diagram
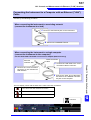
1P2W
The vector diagram shows the measurement line in its ideal state.
1P3W
The vector diagram shows the measurement line in its ideal (balanced) state.
41
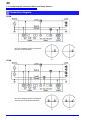
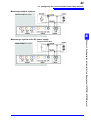
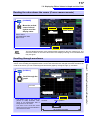
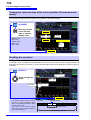
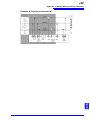
4.3 Configuring the Connection Mode and Clamp Sensors
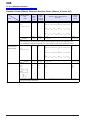
3P3W2M
4
3P3W3M
The vector diagram shows the measurement line in its ideal (balanced) state.
Chapter 4 Configuring the Instrument before Measurement (SYSTEM - SYSTEM screen)
The vector diagram shows the measurement line in its ideal (balanced) state.
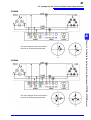
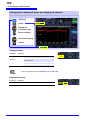
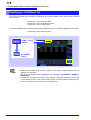
42
4.3 Configuring the Connection Mode and Clamp Sensors
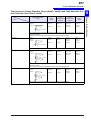
3P4W (CH4:ACDC)
The vector diagram shows the measurement line in its ideal (balanced) state.
3P4W2.5E (CH4:ACDC)
The vector diagram shows the measurement line in its ideal (balanced) state.
43
4.3 Configuring the Connection Mode and Clamp Sensors
Measuring multiple systems
Used for a separate system
4
±24 V, ±15 V, ±5V, etc.
Used for a separate system
Chapter 4 Configuring the Instrument before Measurement (SYSTEM - SYSTEM screen)
Measuring a system and a DC power supply
44
4.3 Configuring the Connection Mode and Clamp Sensors
Configuring the clamp sensors
[SYSTEM] screen
[WIRING]
Move
Display the
pull-down menu
Select [Clamp]
[CH123], [CH4]
Display the
pull-down menu
Select the
clamp sensor
Accept setting
Cancel
45
4.4 Setting the Vector Area (Tolerance Level)
4.4
Setting the Vector Area (Tolerance Level)
This section describes how to determine rough guidelines for verifying that the connection, range, and
nominal input voltage (Udin)* are correct. Changing settings causes corresponding changes in the area
and position of the fan-shaped areas on the vector diagram. The instrument can normally by used with
the default settings, but those settings can be changed if you wish to change the vector display area (tolerance level).
Key sequence for configuring settings
[SYSTEM] screen
[WIRING]
Select the setting
Select value to
change
Change the value
Accept setting
ΔPhase
Sets the tolerance level for the phase value of each phase.
Setting Contents:( ∗ : Default setting)
±1 to ±30∗ (°)
ΔLevel
Sets the tolerance level for the RMS value of each phase. The setting takes the form of (±1% to ±30%) of
the nominal voltage for voltage and CH1 for current.
Setting Contents:( ∗ : Default setting)
±1 to ±30 (%) (±20∗)
U/I Angle
Sets the tolerance level for the current phase difference relative to the voltage.
Setting Contents:( ∗ : Default setting)
-60 to +60 (°) (0∗)
*: The nominal input voltage (Udin), which is calculated from the nominal supply voltage using the transformer ratio, indicates the voltage that is actually input to the instrument.
Chapter 4 Configuring the Instrument before Measurement (SYSTEM - SYSTEM screen)
[VectorArea]
4
46
4.5 Connecting to the Lines to be Measured (Preparing for Current Measurement)
4.5
Connecting to the Lines to be Measured
(Preparing for Current Measurement)
Be sure to read the "Usage Notes" (p.6) before attaching to the lines.
Connect the voltage cords and clamp sensors to the measurement line as shown in the connection diagram on the screen. (To ensure accurate measurement, consult the connection diagram*
while making the connections.)
*: The diagram appears when the wiring mode is selected. (p.39)
To avoid electric shock and short-circuit accidents, do not attach any unnecessary cables.
To avoid risk of electric shock, turn off the supply of electricity to the measurement circuit before making connections.
The phases are named R, S, and T on the wiring diagram display. Substitute with
equivalent names such as L1,L2, and L3 or U,V, and W, as appropriate.
Changing the phase names
[SYSTEM] screen
[WIRING]
[Phase Name]
Display the
pull-down menu
Select the
connection mode
Accept setting
Cancel
Accepting the settings will cause the
selected phase names to be shown
on the connection diagram. (p.40)
Attach voltage cords to measurement lines
Example: Secondary side of breaker
Securely clip the leads to metal parts such as terminal screw terminals or bus bars.
L1000 Voltage Cord
47
4.5 Connecting to the Lines to be Measured (Preparing for Current Measurement)
Example:
When using Model 9804-01 or 9804-02 Magnetic Adapter (standard screw: M6 pan head screw)
Model 9804-01, 9804-02 Magnetic Adapter
Model L1000
Voltage Cord
Secondary side of
breaker
Attach the Model 9804-01 or 9804-02
Magnetic Adapter (option) to the Model
L1000 Voltage Cord.
Connect the magnetic part of the 980401 or 9804-02 tip to the screws on the
secondary side of the breaker.
Check the voltage values to verify that the connections have been
made securely.
Model 9804-01, 9804-02 Magnetic
Adapter
Model L1000
Voltage Cord
Secondary side of
breaker
Connecting clamp sensors to lines to be measured
(Example: 9661)
Be sure to attach each clamp around only one conductor.
Correct measurement cannot be obtained if a clamp is attached around more than one conductor.
OK
Load side
Line
Source side
Current Flow
Direction Arrow
Make certain that the current flow direction
arrow points toward the load.
4
Chapter 4 Configuring the Instrument before Measurement (SYSTEM - SYSTEM screen)
The weight of the voltage cords may prevent you from making a
perpendicular connection to the Model 9804-01 or 9804-02 Magnetic Adapter. In this case, connect each cords so that it is hanging off the adapter in a manner that balances its weight.
48
4.6 Verifying Correct Wiring (Connection Check)
4.6
Verifying Correct Wiring (Connection Check)
Correct attachment to the lines is necessary for accurate measurements.
Check the measured values and vectors on the [SYSTEM]-[WIRING] screen to verify that the connections have been made properly. Refer to the measured values and vector displays to verify
that the measurement cables are correctly attached.
For 1P2W systems
Verify that an appropriate measurement value
is displayed.
Measured
voltage value
Measured
current value
Measured active
power value
For systems other than 1P2W
• Verify that an appropriate measurement
value is displayed.
• Verify that the vectors are displayed
with the appropriate
range.
Current
Vector line range
Colors match the corresponding lines in the
wiring diagram.
In this case
A measured value is too high or
too low compared to the set
[Udin].
Voltage
Check
• Are the cables securely plugged into the voltage measurement jacks on
the instrument? (p.34)
• Are the voltage measurement cable clips properly attached to the lines?
(p.46)
• Has the appropriate Urms type (phase voltage/line voltage) been
selected? (p.56)
If the measured current value is
not correct
• Are the clamp sensors securely plugged into the current measurement
jacks on the instrument? (p.34)
• Are the clamp sensors properly attached to the lines? (p.47)
• Are the clamp sensors appropriate for the line current to be measured?
• Have the sensor’s range settings been configured appropriately?
If the measured active power value
is negative
• Are the clamp sensors properly attached to the lines? (p.46)
• Is the arrow marker on the clamp sensors pointing toward the load?
(p.47)
Voltage vectors:
If vectors are too short, or unequal
• Are the cables securely plugged into voltage measurement jacks on the
instrument? (p.34)
• Are the voltage measurement cable clips properly attached to the lines?
(p.46)
Current vectors:
• Are the clamp sensors securely plugged into the current measurement jacks on the instrument? (p.34)
• Are the clamp sensors properly attached to the lines? (p.47)
• Are the clamp sensors appropriate for the line current to be measured?
• Is the sensor range set correctly?
49
4.6 Verifying Correct Wiring (Connection Check)
In this case
Check
Voltage vectors:
If vector direction (phase) or color is incorrect
• Check that the voltage measurement clips are attached to the lines
according to the wiring diagram.
Current vectors:
• Check that the clamp sensors are attached to the lines according to the
wiring diagram.
When measuring 3P3W2M systems, the active power (P) measured on each channel may be
negative.
4
Chapter 4 Configuring the Instrument before Measurement (SYSTEM - SYSTEM screen)
50
4.7 Quick setup
4.7
Quick setup
What settings are affected by quick setup?
For accurate measurements, settings such as range must be properly configured.
When you use quick setup, the following settings are automatically configured using HIOKI-recommended values according to the selected connection settings: current range, nominal input
voltage, measurement frequency, event thresholds, etc. (p.195)
If measurement line power is off, turn it on before performing quick setup.
Key operation during configuration
[SYSTEM] screen
[WIRING]
[Preset]
The screen shown to the
right will be displayed.
[PRESETS]
Display the
pull-down menu
Select a pattern
Accept setting
Check settings
and select to
change
Display the
pull-down menu
Select setting
or value
Accept setting
[NEXT]
The connection diagram
will be displayed.
Check settings and change as necessary before you start recording. Execute quick setup
when using the instrument the first time, and when changing to a different line configuration.
51
4.7 Quick setup
Key operation during configuration (continued)
[GO]
The settings selected in
the quick setup process
will be accepted.
4
Five measurement patterns are provided. Select the pattern that best suits your application. Quick setup
automatically sets appropriate values for the connections and clamp types used in measurement, settings other than VT/CT ratios, TIMEPLOT interval times, and thresholds used for event detection. Each of
these settings can be changed later as desired.
Setting Contents:( ∗ : Default setting)
Monitors voltage factors (dips, swells, interruptions, etc.) and frequency to detect
events. It is recommended to select this pattern when you are troubleshooting power
supply problems such as hardware malfunctions.
U Events∗
Standard
Quality
Monitors voltage factors (dips, swells, interruptions, etc.), frequency, current, voltage
and current harmonics, and other characteristics to detect events. This pattern is priPower
marily used to monitor systems, so it is recommended to select this pattern when
you wish to evaluate power supply quality (power quality). The TIMEPLOT interval
will be set to 10 minutes.
Inrush Current
Measures inrush current. The TIMEPLOT interval will be set to 1 minute, and the
inrush current threshold will be set to 200% of the RMS current (reference value) set
during quick setup.
Recording
Records measured values over an extended period of time using a TIMEPLOT interval of 10 minutes. All event detection functionality other than manual events is turned
off.
EN50160
Performs EN50160-compliant measurement. Standard-compliant evaluation and
analysis can be performed by analyzing data using Model 9624-50 PQA-HiView Pro
software.
The EN50160 analysis function is only available using Model 9624-50 PQA-HiView
Pro software when the interval time is set to 10 minutes.
Wiring Types
Set before performing quick setup.
Setting Contents:
CH1,2,3: 1P2W/1P3W/3P3W2M/3P3W3M/3P4W/3P4W2.5E
CH4: ACDC/DC/OFF
Chapter 4 Configuring the Instrument before Measurement (SYSTEM - SYSTEM screen)
Presets
52
4.7 Quick setup
Clamp Sensor Used
Set before performing quick setup.
Setting Contents:
Sensor used
0.1mV/A(5 kA)
1mV/A(500 A)
10mV/A(50 A)
100mV/A(5 A)
9657-10
9660
9661
9667(500A)
9667(5kA)
9669
9675
9694
9695-02
9695-03
: Current range
: 5000A/500A
: 500A/50A
: 50A/5A
: 5A/500mA
: 5A/500mA
: 100A/50A
: 500A/50A
: 500A/50A
: 5000A/500A
: 1000A/100A
: 5A/500mA
: 50A/5A
: 50A/5A
: 100A/50A
External VT Ratio, External CT Ratio
Set when attaching an external VT or CT. Set to 1 if not attaching an external VT or CT.
Setting Contents:
0.01 to 9999.99
TIME PLOT Interval
Sets the TIMEPLOT interval.
Setting Contents:( ∗ : Default setting)
1/ 3/ 15/ 30 sec, 1∗/ 5 /10/ 15/ 30 min, 1/2 hour, 150/180cycle
If the event icon (
) is orange after performing quick setup (indicating that the event is being
detected continuously), it is recommended to check and reconfigure the event's threshold.
See:"5.5 Changing Event Settings" (p.66)
The 150 (50 Hz) and 180 (60 Hz) cycle settings provide the TIMEPLOT intervals
required for IEC61000-4-30-compliant measurement. When using a measurement frequency of 400 Hz, selecting 150/180 cycle will result in a 1,200 cycle interval.
Quick setup pattern details (settings)
For more information about the quick setup patterns, see "Quick setup pattern details" (p.195).
53
4.8 Verifying Settings and Starting Recording
4.8
Verifying Settings and Starting Recording
Once you have determined that the settings are appropriate, start recording by pressing the START/
STOP key. Verify that the event icon (
) is not orange (indicating that the event is occurring frequently) and that measured values and waveforms on the [VIEW] screen are normal.
If the event icon is appearing frequently
Verify which event is occurring with the event list on the [EVENT] screen and change the problematic
event threshold on the [SYSTEM] screen.
If measured values or waveforms are abnormal
Change the measurement condition settings on the [SYSTEM] screen and verify measured values
again.
Verify
Check how frequently the event icon is appearing.
Select the [VIEW] screen and check measured values and
waveforms.
See: Chapter 6 (p.75)
No problem
Problem
Change settings
Change the settings on the [SYSTEM] screen.
See: Chapter 5 (p.55)
Check again
Check how frequently the event icon is appearing.
Select the [VIEW] screen and check measured values
and waveforms.
No problem
Check the clock
Problem
Change settings
Change the settings on the [SYSTEM] screen.
See: "4.2 Setting the Clock" (p.38)
No problem
Start recording.
See: "Starting and Stopping Recording" (p.14)
Chapter 4 Configuring the Instrument before Measurement (SYSTEM - SYSTEM screen)
Repeat these steps until there are no other problems.
4
54
4.9 Using the Instrument during a Power Outage
4.9
Using the Instrument during a Power Outage
If the supply of power to the instrument is interrupted (for example, during a power outage), it will operate
using battery power (a fully charged battery provides enough power to operate for about 180 minutes).
However, the instrument will turn off about 180 minutes after the outage occurs. Once the power is back
on, the instrument will turn back on and resume recording. Integral values and other data will be reset,
and the integration process will resume.
55
5.1 Changing Measurement Conditions
Changing Settings
(as necessary)
Chapter 5
5.1
Changing Measurement Conditions
Key operation during configuration
[SYSTEM] screen
[MAIN]
Select a setting
Display the
pull-down menu
Select a setting
Accept the setting
Cancel
WIRING
Selects the measurement line.
Setting Contents:( ∗ : Default setting)
CH1,2,3: 1P2W/1P3W/3P3W2M/3P3W3M/3P4W∗/3P4W2.5E
CH4: ACDC∗/DC/OFF
Udin
Selects the nominal input voltage (Udin) for the measurement line.
Setting Contents:( ∗ : Default setting)
100/101/110/120/127/200/202/208/220/230∗/240/277/347/380/400/415/480/
600/VARIABLE (set from 50 to 780 V in 1 V increments)
Chapter 5 Changing Settings (as necessary)
[MEASURE]
5
56
5.1 Changing Measurement Conditions
VT Ratio
Sets the external VT (PT) being used.
Setting Contents:( ∗ : Default setting)
1∗/60/100/200/300/600/700/1000/2000/2500/5000/
VARIABLE (0.01 to 9999.99)
ClampSensor, I Range
Selects the type of clamp sensor being used and current range. You can also set an output rate and use
a sensor that has not been registered.
Setting Contents:( ∗ : Default setting)
0.1mV/A(5 kA)
1mV/A(500 A)
10mV/A(50 A)
100mV/A(5 A)
9657-10
9660
9661∗
9667(500A)
9667(5kA)
9669
9675
9694
9695-02
9695-03
: 5000A/500A
: 500A/50A
: 50A/5A
: 5A/500mA
: 5A/500mA
: 100A/50A
: 500A∗/50A
: 500A/50A
: 5000A/500A
: 1000A/100A
: 5A/500mA
: 50A/5A
: 50A/5A
: 100A/50A
CT Ratio
Set if using an external CT.
Setting Contents:( ∗ : Default setting)
1∗/40/60/80/120/160/200/240/300/400/600/800/1200/
VARIABLE (0.01 to 9999.99)
Frequency
Selects the nominal frequency (fnom) for the measurement line.
Setting Contents:( ∗ : Default setting)
50 Hz∗/60 Hz/400 Hz
URMS Type
Selects the voltage calculation method to use during 3-phase measurement.
Setting Contents:( ∗ : Default setting)
PHASE-N∗/LINE-LINE
PF Type
Selects the power factor calculation method. You can select either PF (calculate using RMS values) or
DPF (calculate using fundamental wave only). The displacement power factor (DPF) is generally used for
power systems, while power factor (PF) is used when evaluating device efficiency.
Setting Contents:( ∗ : Default setting)
PF∗/DPF
57
5.1 Changing Measurement Conditions
THD Type
Selects the total harmonic distortion (THD) calculation method. You can select either THD-F (distortion
component/fundamental wave) or THD-R (distortion component/RMS value).
Setting Contents:( ∗ : Default setting)
THD-F∗ / THD-R
Harm Calc
Selects the harmonic calculation method.
Setting Contents:( ∗ : Default setting)
U,I,P: All Levels∗/U,I,P: All % of FND/U,P: %, I: Level
Flicker
Selects the flicker measurement type.
Setting Contents:(Default setting: ΔV10 when the language
is set to Japanese; otherwise, Pst, Plt)
Pst,Plt /DV10
Sets the lamp system when Pst and Plt are selected for flicker measurement.
Setting Contents:( ∗ : Default setting)
230V Ed1∗/120V Ed1/230V Ed2/120V Ed2
Chapter 5 Changing Settings (as necessary)
Filter
5
58
5.2 Changing the Measurement Period
5.2
Changing the Measurement Period
Key operation during configuration
[SYSTEM] screen
[RECORD]
Select a setting
Display a
pull-down menu
to select a setting
Select a value
to change
Select the setting/
change the value
Accept the setting
Cancel
Time Start
Set to [ON] if you wish to set the recording start and
stop times. Set the desired start time and date and
stop time and date.
Setting Contents:( ∗ : Default setting)
OFF∗
Starts and stops recording when the START/
STOP key is pressed.
ON
Starts and stops recording at the set times and
dates.
If a date in the past is set as the start time and date set when the START/STOP key is
pressed, an error message will be displayed.
Start time and date
Operating state when [SETTING]
set to [ON]:
To forcibly stop
recording:
[WAITING]
[RECORDING]
Recording
starts.
Press again
Stop time and date
[ANALYZING]
Recording
stops.
59
5.2 Changing the Measurement Period
Repeat Record
Repeated recording operations can be conducted up to 55 days at one-day measuring intervals, and up
to 55 weeks at one-week measuring intervals.
The measured data file of repeated recording is saved as a separate binary file for each one-day
or one-week period on the SD memory card.
Setting Contents:( ∗ : Default setting)
OFF∗
No repeated recording
1 Day
Repeated recording at one-day intervals
1 Week
Repeated recording at one-week intervals
Set the start and stop days for
repeated recording.
If [Repeat Record] is set to [1 Day], set the
[Start Time], [End Time], and [Repeat Number].
If [Repeat Record] is set to [1 Week], set the
[Repeat Number].
5
Repeat Number
When repeated recording is set to [1 Week], the stop time is set automatically.
Relationship between real-time control and repeated recording
(count) settings
Real-time
control
Repeated
measurement
Real-time control time
and date setting
Repeated measurement
time setting
Repeat
number
-
ON
OFF
Start time and date and stop
time and date
-
ON
1 Week
Start time and date
-
1 Day
Start date and stop date
Set- ON
ting OFF
Start time and stop time
OFF
-
-
OFF
1 Week
-
-
OFF
1 Day
-
Start time and stop time
Any value
from 1 to 55
Any value
from 1 to 55
Any value
from 1 to 55
Chapter 5 Changing Settings (as necessary)
Can be set to a value from
1 to 55.
During repeated recording, the
current iteration and total
number of set iterations is displayed, and the green arrow
flashes.
60
5.2 Changing the Measurement Period
Relationship between the repeat setting and the maximum repeat count
When the repeat setting is [OFF]
Recording starts when the START/STOP key is
pressed.
Recording stops when the START/STOP key is pressed, or at
the stop time and date set for real-time control.
Max. 35 days
Measurement data and event data
Data storage folder
When the repeat setting is [1 Day]
The START/STOP key is pressed.
(No gap between the start time and stop time settings)
Start time /
Stop time
1 day
Stand
by
Recording starts.
1 day
1 day
1 day
Stan
dby
Recording Recording Recording
starts.
starts.
starts.
Recording Recording
Recording stops. Recording stops.
stops.
stops.
1 day
Recording
starts.
Measurement data and event data
Max. 55
days
Recording
stops.
repeat count
Data storage folder
When the repeat setting is [1 Week]
Recording starts when the START/STOP key is pressed.
No gap
No gap
No gap
1 week
1 week
1 week
Measurement data and event data
1 week
No gap
No gap
1 week Max. 55
Weeks
repeat count
Data storage folder
• For more information about the data storage folder hierarchy, see "File structure
(overall)" (p.140)
• In the event of a power outage (interruption of power to the instrument), the folder will
be segmented.
• Once the data storage files exceed about 100 MB, data will be segmented, regardless of the repeat count.
61
5.3 Changing the Recording Settings
5.3
Changing the Recording Settings
Key operation during configuration
[SYSTEM] screen
[RECORD]
Select a setting
Display the
pull-down menu
Select a setting
Cancel
Est. Data Size
Displays an estimate of the amount of data that will be saved. The estimated
data volume is calculated based on the recording item, TIMEPLOT interval, realtime control, and repeated recording settings. The estimated data volume does
not include screen copy data or event data.
SD Card Capacity
Displays the amount of space remaining on the SD memory card. If the SD
memory card experiences an error, "SD Error" will be shown.
Data Days
Displays an estimate of how many days of data can be saved based on the estimated data volume and the SD card remaining capacity. The actual number of
days of data that can be saved may be less than the indicated amount depending on the number of screen copies made and events generated.
Chapter 5 Changing Settings (as necessary)
Accept the setting
5
62
5.3 Changing the Recording Settings
Recording Items
Sets the type of measurement data.
See:"Key operation during configuration" (p.61)
Setting Contents:( ∗ : Default setting)
ALL DATA∗
Records all the calculation values.
P&Harm
Records all calculation values except inter-harmonics.
Power
Records all calculation values except harmonics and
inter-harmonics.
Note: If 400 Hz is selected, ALL DATA can not be selected.
Recording items
Power
P&Harm
ALL DATA
Recording items
Power
P&Harm
ALL DATA
RMS voltage
refreshed each
half-cycle
Harmonic voltage
×
RMS current
refreshed each
half-cycle
Harmonic current
×
Frequency
Harmonic power
×
Frequency wave
Phase difference of
harmonic voltage and
harmonic current
×
10-sec
frequency
High-order harmonic
voltage phase angle
×
Voltage RMS
High-order harmonic
current phase angle
×
Current RMS
Voltage
waveform peak
Inter-harmonic voltage
×
×
Current
waveform peak
Inter-harmonic current
×
×
Active power
THD Voltage Percentage
Apparent Power
THD current percentage
Reactive Power
Power factor/
displacement
power factor
High-order harmonic
voltage component
Voltage
unbalance factor
High-order harmonic
current component
Current
unbalance factor
K factor
Instantaneous
flicker value
Integral power
Flicker
(DV10/Pst,Plt)
Detailed trend graphs are always displayed with maximum and minimum values.
63
5.3 Changing the Recording Settings
TIME PLOT Interval
Sets the TIMEPLOT interval (recording interval).
See:"Key operation during configuration" (p.61)
Setting Contents:( ∗ : Default setting)
1/ 3/ 15/ 30 sec, 1∗/ 5 /10/ 15/ 30 min, 1/2 hour, 150/180/1200cycle
The time series graph recording time varies with the recorded parameters and TIMEPLOT interval setting.
See:"Recording Items" (p.62)
The 150 cycle (50 Hz) and 180 cycle (60 Hz) settings provide the TIMEPLOT intervals
required for IEC 61000-4-30-compliant measurement. You can select 150 cycles (measurement frequency of 50 Hz), 180 cycles (60 Hz), or 1,200 cycles (400 Hz).
When the memory is full
The PW3198 stops recording data to the SD memory card.
Recording times (reference value) for a Z4001 SD Memory Card 2GB
(Repeat Record: 1Week, Repeat Number: 55 times)
Recording parameter setting
ALL DATA
(Saves all data)
P&Harm (Saves RMS values Power
and harmonics)
(Saves RMS values only)
1sec
16.9 hours
23.6 hours
11.5 days
3sec
2.1days
3.0 days
34.6 days
15sec
10.6 days
14.8 days
24 weeks
30sec
21.1days
29.5 days
49 weeks
1min
42.2 days
8.4 weeks
55 weeks
5min
30.1 weeks
42.1 weeks
55 weeks
10min
55 weeks
55 weeks
55 weeks
15min
55 weeks
55 weeks
55 weeks
30min
55 weeks
55 weeks
55 weeks
1 hour
55 weeks
55 weeks
55 weeks
2 hours
55 weeks
55 weeks
55 weeks
3.0 days
34.6 days
150/180 /1200wave (Approx. 3 sec) 2.1 days
• Recording times do not account for event data and screen copy data. Recording times may be shortened when event data and screen copy data are stored on the card.
• Recording times are not dependent on connections.
• When repeated recording is set to [OFF], the maximum recording time is 35 days.
• When repeated recording is set to [1 Day], the maximum recording time is 55 days.
• When repeated recording is set to [1 Week], the maximum recording time is 55 weeks.
• Harmonics order data is not saved for [Power], but it is saved in THD.
Measuring for an extended period of time.
If repeated recording is enabled and the recording count set, the instrument can make measurements for up to 55 weeks.
See: Long-term measurements over 1 month or longer: Enable repeated recording (see "Repeat Record" (p.A59)).
Disp COPY Interval
Outputs the display image to the SD memory card or printer at the
set screen copy interval.
See:"Key operation during configuration" (p.61)
Setting Contents:( ∗ : Default setting)
OFF∗/5min/10min/30min/1hour/2hour
Chapter 5 Changing Settings (as necessary)
TIME PLOT interval
5
64
5.4 Changing Hardware Settings
5.4
Changing Hardware Settings
Key operation during configuration
[SYSTEM] screen
[MAIN]
[HARDWARE]
Select a setting
Display a
pull-down menu
to select a setting/
Select a value
to change
Select the setting/
change the value
Accept the setting
Cancel
Language
Sets the display language.
Setting Contents:
Japanese
Japanese
English
English
Chinese
Chinese (Simplified)
Color
Select the grid (graticule) type for the waveform screen.Sets the screen color.
Setting Contents:( ∗ : Default setting)
COLOR1∗
Blue-gray
COLOR2
Blue
COLOR3
Black
COLOR4
Gray
COLOR5
White
Beep
Sets whether to beep when a key is pressed.
Setting Contents:( ∗ : Default setting)
ON∗
Beeps are enabled.
OFF
Beeps are disabled.
65
5.4 Changing Hardware Settings
LCD Backlight
The LCD backlight can be set to turn off after a set period of time.
Pressing a key will cause the screen to be displayed again.
Setting Contents:( ∗ : Default setting)
AUTO
Automatically turns the backlight off once 2 minutes
have elapsed since the last key press.
ON∗
Leaves the screen backlight on at all times.
Clock
Sets the time and date, which are used to record and manage data.
Be sure to set the time and date before starting recording (seconds cannot be set).
Valid setting range: 00:00 on January 1, 2010, to 23:59 on December 31, 2079
External Out
Set when using the external control terminal to connect the PW3198 to an external device.
Setting Contents:( ∗ : Default setting)
Disables external output.
ShortPulse∗
Sets output to low for at least 10 ms when an event is
detected.
LongPulse
Sets output to low for 2.5 sec when an event is
detected. This setting is used when connecting the
PW3198 to the 2300 Remote Measurement System
or other device.
See:"Event output can be set for ENKAKU." (p.A153)
DV10alarm
This setting can be selected only when the [Flicker]
setting is [DV10]. Output will be set to low when the
set ΔV10 threshold is exceeded. If selecting this setting, set the ΔV10 threshold. (0.00 V to 9.99 V)
RS-232C
Set when connecting the PW3198 to a printer or PW9005 GPS Box with an RS-232C cable.
Setting Contents:( ∗ : Default setting)
OFF∗
Disables the RS connection.
PRINTER
Outputs data to a printer. If selecting this setting,
select the RS communication speed.
GPS
Outputs data to a Model PW9005 GPS Box. If selecting this setting, select the time zone. (-13:00 to +13:00)
See:PW9005 Instruction manual
LAN
Set when connecting the PW3198 to a computer with a LAN cable.
See:"Configure the Instruments LAN Settings" (p.158)
Setting Contents:
IP Address
Sets the IP address. (3 characters.3 characters.3
characters.3 characters (***.***.***.***))
Subnet Mask
Sets the subnet mask. (3 characters.3 characters.3
characters.3 characters (***.***.***.***))
Default Gateway
Sets the default gateway. (3 characters.3 characters.3 characters.3 characters (***.***.***.***))
5
Chapter 5 Changing Settings (as necessary)
OFF
66
5.5 Changing Event Settings
5.5
Changing Event Settings
What is an event?
See: "Appendix 2 Explanation of Power Supply Quality Parameters and Events"
List of event settings
Event parameter
Order
Additional
selection functionality
Transient overvoltage
Swell
Slide
Dip
Slide
Interruption
Inrush current
Frequency
Frequency cycle
Voltage
waveform peak
Phase/line
sense
RMS voltage
DC voltage change
(CH4 only)
Current
waveform peak
RMS current
Sense
DC current change
(CH4 only)
Active power
Apparent power
Reactive power
Power factor/displacement power factor
Negative-phase voltage unbalance factor
Zero-phase voltage
unbalance factor
Negative-phase current unbalance factor
Zero-phase current
unbalance factor
PF/DPF
Harmonic voltage
Orders
0 to 50
Harmonic current
Orders
0 to 50
Harmonic power
Orders
0 to 50
Level (RMS)/
content
percentage
Level (RMS)/
content
percentage
Level/content
percentage
Channel
selection
(1,2,3) (4)
(OFF)
(1,2,3) (-)
(OFF)
(1,2,3) (-)
(OFF)
(1,2,3) (-)
(OFF)
(1,2,3) (4)
(OFF)
(U1) (-)
(OFF)
(U1) (-)
(OFF)
(1,2,3) (4)
(OFF)
(1,2,3) (4)
(OFF)
(-,-,-) (4)
(OFF)
(1,2,3) (4)
(OFF)
(1,2,3) (4)
(OFF)
(-,-,-) (4)
(OFF)
(1,2,3)(sum)
(OFF)
(1,2,3)(sum)
(OFF)
(1,2,3)(sum)
(OFF)
(1,2,3)(sum)
(OFF)
(-,-,-)
(sum)(OFF)
(-,-,-)
(sum)(OFF)
(-,-,-)
(sum)(OFF)
(-,-,-)
(sum)(OFF)
Threshold (Note 9)
Note
0 to 6000 Vpk
Specify as absolute value.
1,4
0 to 200%
1,5
0 to 100%
1,5
0 to 100%
1,5
0 to (varies with range) A
1,4,5
0.1 to about 9.9 Hz
5
0.1 to about 9.9 Hz
5
0 to 1200 Vpk
1,4,7
0 to 780 V
Specify upper and lower limits.
1,3,4,5
0 to 1200 V
1,5
0 to (varies with range) A×4
1,4,7
0 to (varies with range) A
1,4,5
0 to (varies with range) A×4
1,5
0 to varies with range
Specify as absolute value.
1,4,5,8
0 to varies with range
1,4,5,8
0 to varies with range
Specify as absolute value.
1,4,5,8
0 to 1
3,4,5
0 to 100%
5
0 to 100%
5
0 to 100%
5
0 to 100%
5
(1,2,3) (4)
(OFF)
0 to 780V/0 to 100%
Specify 0-order as an absolute value.
1,2,3,4,
5,6
(1,2,3) (4)
(OFF)
1.3 × (0 to [varies with range]) A /0 to 100%
Specify 0-order as an absolute value.
1,2,3,4,
5,6
(1,2,3)(sum) 1.3 × (0 to [varies with range]) W
(OFF)
Specify as absolute value. /0 to 100%
1,2,3,4,
5,6,8
67
5.5 Changing Event Settings
List of event settings
Order
Additional
selection functionality
Harmonic voltage-cur- Orders
rent phase difference 1 to 50
Total harmonic voltage
-F/-R
distortion factor
Total harmonic current
-F/-R
distortion factor
Event parameter
K factor
High-order harmonic
voltage component
RMS
High-order harmonic
current component
RMS
Voltage waveform
comparison
Time event
External event
Manual event
Start
Stop
Threshold (Note 9)
Note
0 to 180×
Specify as absolute value.
2,4,5,6
0 to 100%
3,4,5
0 to 500%
3,4,5
0 to 500
4,5
(1,2,3) (4)
(OFF)
0 to 600 V
1,4
(1,2,3) (4)
(OFF)
0 to (varies with ran A)
1,4
(1,2,3) (-)
0 to 100%
(OFF)
(-,-,-)
(-)
OFF,1,5,10,30 min,1,2 hour.
(OFF)
(-,-,-)
(-)
(OFF)
(External)
None
(OFF)
None
None
None
1
Note 1: The threshold range is expanded by the VT ratio and CT ratio settings (for harmonics, level value
only).
Note 2: Settings can be made for individual orders as specified in the “Order selection” column.
Note 3: Phase voltage/line voltage, level/content percentage/voltage content percentage or current power
level, THD-F/THD-R, power factor/displacement power factor selections are made in the system settings.
Note 4: Thresholds can be set for separately for individual channels as grouped together (other than “OFF”)
in the “Channel selection” column. (However, channels 1, 2, and 3 must share the same setting.)
Note 5: Hysteresis applies. However, the frequency is fixed at 0.1 Hz.
Note 6: During 400 Hz measurement, harmonic voltage, harmonic current, harmonic power, and harmonic
voltage-current phase difference can be measured up to the 10th order.
Note 7: DC values from an approx. 200 ms aggregation are compared with the threshold only when CH4 is
set to DC.
Note 8: The sum value threshold is 2 X for 1P3W, 3P3W2M, and 3P3W3M, and 3 X for all others.
Note 9: The setting precision for thresholds is ±1 dgt.
5
Chapter 5 Changing Settings (as necessary)
Continuous event
Channel
selection
(1,2,3)(sum)
(OFF)
(1,2,3) (4)
(OFF)
(1,2,3) (4)
(OFF)
(1,2,3) (4)
(OFF)
68
5.5 Changing Event Settings
[SYSTEM]
screen
[EVENT1]
[VOLTAGE1]
[EVENT1]
[VOLTAGE2]
[EVENT1]
[WAVE]
[EVENT2]
[CURRENT]
[EVENT2]
[HARMONICS]
[EVENT2]
[POWER/etc]
To turn voltage/current/power events on or off, or to adjust associated
thresholds (p.69)
To turn harmonic events on or off, or to adjust associated thresholds (p.70)
To generate an event using an external input signal (p.71)
To generate an event manually (p.71)
To periodically generate an event (p.72)
69
5.5 Changing Event Settings
Turning events on and off and adjusting thresholds
(applies to voltage, current, and power)
Select a setting
Or
[ON]
[OFF]
Select the setting
to change it
Set the threshold
See: "Reference graph
for use when setting thresholds"
Accept the setting
Setting Contents:( ∗ : Default setting)
OFF∗
Disables the event function for the selected setting.
ON
Sets the threshold at which to enable the event function for the
selected setting.
• Sets the voltage swell, voltage dip, and voltage interruption threshold values as percentages of nominal voltage (Uref)*. The converted voltage is displayed to the right of the
percentage setting.
• Setting the voltage swell and voltage dip [Slide] settings to [ON] causes the threshold to
be expressed as a percentage of the slide reference voltage.
*: The nominal voltage (Uref) is obtained by multiplying the nominal input voltage (Udin) by
the VT ratio. When the VT ratio is 1, the nominal voltage (Uref) is equal to the nominal
input voltage (Udin).
• If the threshold value falls outside the valid setting range, "-----" will be displayed. Pressing the ENTER key resets the value to the threshold upper limit.
Hysteresis
Set as a percentage of the event thresholds for voltage, current, power, and
other measured values in order to prevent an excessively large number of
events from occurring. It is generally recommended to set the hysteresis from
1% to 2%.
Slide
(slide reference
voltage)
When the voltage value fluctuates gradually, allows dip and swell to be judged
using the fluctuating voltage values as a reference. (For more information. (For
more information, see "Slide reference voltage" (p.A27))
SENSE
(Sense)
When the RMS voltage or RMS current continues to fluctuate in excess of the
threshold, generates an event when the value obtained by adding the set sense
value and the measured value is exceeded. You can track events to identify the
status when the RMS voltage or RMS current exceeds the threshold. (For more
information, see "Sense" (p.A27))
Chapter 5 Changing Settings (as necessary)
Cancel
5
70
5.5 Changing Event Settings
Reference graph for use when setting thresholds
You can adjust thresholds while viewing the current measured value and measurement waveform state.
For events other than voltage waveform
comparison
(Example: Frequency)
Threshold upper
limit
Voltage waveform comparison
The [U_Wave] screen can be displayed with the DF2 key.
A voltage waveform comparison event is generated when
the measurement waveform exceeds the waveform envelope level. The waveform envelope level is set as a percentage of the nominal input voltage. When using a 3phase connection, the waveform envelope level applies to
the voltages of all 3 phases.
Red:
Current measurement
waveform
Currently threshold
Current threshold
Current
measured
value
Top of waveform envelope level
Threshold lower
limit
Bottom of waveform
envelope level
Set thresholds are stored internally regardless of the event’s ON/OFF setting.
Even if a threshold is set, no events will be generated unless the event is set to ON.
Turning events ON and OFF and adjusting thresholds (harmonics)
Events can be configured by pressing the DF3 key to display the [HARMONICS] screen. Settings can
be turned ON or OFF for each harmonic order.
Select the
harmonic order
to set
Or
[ON]
[OFF]
Select the setting
to change it
Bar for harmonic order being set (green)
Set the threshold
Threshold (red)
Accept the setting
Cancel
Setting Contents:( ∗ : Default setting)
OFF∗
Disables the event function for the selected setting.
ON
Sets the threshold at which to enable the event function for the
selected setting.
Set thresholds are stored internally regardless of the event’s ON/OFF setting.
Even if a threshold is set, no events will be generated unless the event is set to ON.
When the measurement frequency (fnom) is 400 Hz, measurement is limited to the 10th order.
71
5.5 Changing Event Settings
Generating events using an external input signal (external event settings)
Events can be configured by pressing the DF3 key to display the [POWER/etc] screen. External events
are detected using external control terminal (EVENT IN) shorts or pulse signal falling edge input. The
voltage and current waveforms and measured values when the external event occurs can be recorded.
This functionality is enabled by setting external events to ON.
See:"11.1 Using the External Control Terminal" (p.149)
[External
Event]
or
[OFF]
[ON]
5
Events are detected when the MANU EVENT (manual event) key is pressed. The voltage and current
waveforms and measured values when the external event occurs can be recorded. Manual events are
always enabled.
See: More about how to record event waveforms: "Appendix 4 Recording TIMEPLOT Data and Event Waveforms"
(p.A14)
Chapter 5 Changing Settings (as necessary)
Generating events manually (manual event settings)
72
5.5 Changing Event Settings
Generating events periodically (timer event settings)
Events can be configured by pressing the DF3 key to display the [POWER/etc] screen. Events are generated at the set interval and recorded as external events.
[Timer Event]
Select the setting
to change it
Set the interval at
which to generate
the timer event
Accept the setting
Cancel
Once recording is started, timer events will be recorded at a fixed interval (the set time) from the start
time.
Interval
Recording
started
Interval
Event recorded
Ext
Interval
Event recorded
Ext
Interval
Event recorded
Ext
Event recorded
Ext
73
5.6 Initializing the Instrument (System Reset)
5.6
Initializing the Instrument (System Reset)
If the instrument seems to be malfunctioning, consult "Before having the instrument repaired"
(p.217).
If the cause of the problem remains unclear, try a system reset.
Key operation during configuration
[SYSTEM] screen
[MAIN]
[HARDWARE]
[System Reset]
Cancel
Performing a system reset causes all settings other than the display language, time, phase
names, IP address, subnet mask, and RS connected device (including baud rate) to be
reverted to their default values. Additionally, displayed measurement data and screen data will
be deleted.
See: "5.7 Factory Settings" (p.74)
Reverting the instrument to its factory settings (boot key reset)
You can revert all settings, including language and communications settings, to their default values by
turning on the instrument while holding down the ENTER and ESC keys.
Chapter 5 Changing Settings (as necessary)
Accept the setting
5
74
5.7 Factory Settings
5.7
Factory Settings
All settings’ default values are as follows:
Measurement settings
Setting
Default value
Setting
Default value
WIRING
CH123: 3P4W
CH4: ACDC
ClampSensor
CH123: 9661
CH4: 9661
Phase Name
RST
I Range
CH123: 500 A
CH4: 500 A
PT Ratio
CH123: 1
CH4: 1
CT Ratio
CH123: 1
CH4: 1
Udin
230 V
THD Type
THD-F
Frequency
50 Hz
Harm Calc
U,I,P: All Levels
URMS Type
PHASE-N
Flicker
Varies with set display
language.
PF Type
PF
Measurement period and recording settings
Setting
Default value
Setting
Default value
Time Start
OFF
TIME PLOT Interval
1 min
Repeat Record
OFF
Disp COPY Interval
OFF
Recording Items
ALL DATA
Hardware settings
Setting
Default value
Setting
Default value
Language
Set language
LCD Backlight
ON
Color
COLOR1
External Out
ShortPulse
Beep
ON
RS-232C
OFF
Setting
Default value
Setting
Default value
ΔPhase
±30
U/I Angle
0
ΔLevel
±20
Vector area settings
75
6.1 Using the VIEW screen
Monitoring Instantaneous Values
(VIEW Screen)
Chapter 6
6.1
Using the VIEW screen
The VIEW screen is composed of a number of screens corresponding to the DF1 to DF4 (DF: display function) keys. When you press a DF key, the screen corresponding to that key appears.
Each time you press the same DF key, the display changes.
VIEW screen selector
About screen configuration (p.23)
Switching screen display
WAVE
6
See: "6.2 Displaying Instantaneous Waveforms" (p.76)
HARMONICS
DMM
See: "6.5 Displaying Measured Values Numerically (DMM Screen)" (p.89)
Internal operating state
[SETTING]
[WAITING]
Display
Display
update
Contents of the display update during setting.
[RECORDING]
Contents of the latest display update during
measurement.
[ANALYZING]
Contents of the display update during analysis,
or contents at the moment an event selected in
[EVENT] screen occurs.
Normal screen display:
Displays the current measurement screen.
Note: [WAITING]
From the time the START/STOP key is pressed
until measurement actually starts, settings are
shown as [WAITING]. Settings are also shown as
[WAITING] when measurement has been
stopped due to use of repeated recording.
Screen display after an event is selected:
This screen is shown when an event is selected on
the [EVENT] screen in [ANALYZING] mode. As
shown in the screenshot to the right, the event number, time and date, and type are displayed.
See:"8.3 Analyzing the Measurement Line Status
When Events Occur" (p.124)
Approximately
1 second
Monitoring Instantaneous Values (VIEW
The screen shown varies with the instrument's internal operating state.
Chapter 6
See: "6.3 Displaying Phase Relationships ([VECTOR] Screen)" (p.80),
"6.4 Displaying Harmonics" (p.83)
76
6.2 Displaying Instantaneous Waveforms
6.2
Displaying Instantaneous Waveforms
This section describes how to display the voltage and current instantaneous waveforms.
Example: Waveform showing four 3P4W
(3-phase, 4-wire) channels
[VIEW]
screen
Superimposes and
displays 4 channels
of the voltage waveform.
[WAVE]
[VOLT/CURR]
Superimposes and
displays 4 channels
of the current waveform.
[WAVE]
[VOLTAGE]
[WAVE]
[CURRENT]
Waveform colors
Red: CH1, Yellow: CH2
Blue: CH3, White: CH4
Select with the F key.
To reduce or enlarge the
waveform (p.77)
To/(p.77)
view the value and time
To the
read
the
value
over
cursor
(p.78)
above
the
cursor
(p.78)
To scroll through the waveTo (p.79)
scroll waveform
form
data
(p.79)
To hold the display (p.79)
The instantaneous waveform displays the waveform sampled at 20 kHz. (Measured values are
calculated using waveforms sampled at a different frequency for each parameter.)
77
6.2 Displaying Instantaneous Waveforms
Reduce or enlarge the waveform (changing the X- and Y-axis scale)
[SELECT]
Select the setting
Display the
pull-down menu
Select the setting
Accept setting
Cancel
6
To reduce the graph, decrease the scale.
To enlarge the graph, increase the scale.
Settings:( ∗ : Default)
The scale can also be changed without using the pull-down menu by
pressing the up and down cursor keys.
X-axis scale
To reduce the graph, decrease the scale.
To enlarge the graph, increase the scale.
Settings:( ∗ : Default)
5ms/div∗, 10ms/div, 20ms/div, 40ms/div
The scale can also be changed without using the pull-down menu by
pressing the up and down cursor keys.
Monitoring Instantaneous Values (VIEW
x1/3, x1/2, x1∗, x2, x5, x10, x20, x50
Chapter 6
Y-axis scale (U: Voltage, I: Current)
78
6.2 Displaying Instantaneous Waveforms
Viewing the value and time over the cursor (cursor measurement)
The cursor on the scroll bar shows
where the cursor is located relative to
all measurement data.
Cursor position
Scroll bar
Display scope
All measurement data
[VOLT/CURR] display
[CURSOR]
Move the vertical
cursor left and
right to read the
display value.
Voltage cursor value (waveform
instantaneous value)
Cursor
Cursor color
Red: CH1
Yellow: CH2
Blue: CH3
White: CH4
Cursor time
Current cursor
value (waveform
instantaneous
value)
Display scope
Scroll bar
You can read waveform instantaneous values and time with the cursor. Normally, the cursor is located at
the beginning of the waveform.
[VOLTAGE] or [CURRENT] display
[CURSOR]
Move the vertical
cursor left and
right to read the
display value.
Cursor color
Red: CH1
Yellow: CH2
Blue: CH3
White: CH4
Cursor value (waveform
instantaneous value)
Cursor
Scroll bar
You can read waveform instantaneous values with the cursor. Normally, the cursor is located at the beginning of the waveform.
79
6.2 Displaying Instantaneous Waveforms
Scrolling through the waveform
You can review all measurement data by scrolling horizontally.
[SCROLL]
Scroll the
waveform
Display scope
Scroll bar
6
Scroll bar
Display scope
All waveform data
Holding the display
[HOLD]
(Measured values and
waveforms will be held.)
Monitoring Instantaneous Values (VIEW
If you select an event and display a waveform, you can scroll horizontally to analyze 14
waveforms at 50 Hz, 16 waveforms at 60 Hz, or 112 waveforms at 400 Hz.
Chapter 6
The display scope on the scroll
bar (shown in white) illustrates
which range of all waveform data
is being shown on the screen.
80
6.3 Displaying Phase Relationships ([VECTOR] Screen)
6.3
Displaying Phase Relationships ([VECTOR]
Screen)
Example: 3P4W (3-phase, 4-wire)
[VIEW] screen
[HARMONICS]
[VECTOR]
Select with the F key.
To change the axis display (p.81)
To change the RMS value/phase angle value
display (p.81)
To change the phase angle display method (p.81)
RMS/phase angle/content percentage display (p.81)
To change the harmonic number of orders (p.82)
To hold the display (p.88)
Changing the axis display, RMS value/phase angle display, and
phase angle value display
Select the setting
Display the
pull-down menu
Select the setting
Accept setting
Cancel
81
6.3 Displaying Phase Relationships ([VECTOR] Screen)
Axis display
You can select whether to use a linear display (LINEAR) or logarithmic display (LOG) for the vector axis.
If you select the logarithmic display method, the vector is easy to see even at low levels.
Settings:( ∗ : Default)
LINER∗
Linear display
LOG
Log Logarithmic display
When the 400 Hz measurement frequency is selected, harmonic analysis is performed up
to the 10th order, and inter-harmonic analysis is not available.
RMS/phase angle/content percentage display
Selects which value to display (RMS value display, phase angle display, or content percentage display). If
[PHASE] is selected, you can also set the phase angle value display method.
Settings:( ∗ : Default)
LEVEL∗
RMS
Phase
Phase angle
Content
Content percentage
Phase angle value display method
Settings:( ∗ : Default)
±180∗
lead 0 to 180°, lag 0 to -180°
lag360
lag 0 to 360°
You can select the reference source (0°) to display the phase angle value.
U1∗/ I1/ U2/ I2/ U3/ I3
Monitoring Instantaneous Values (VIEW
Phase angle reference source
6
Chapter 6
You can select the type of phase angle display. (This setting can be configured only when [Phase] is
selected.)
If [lag360] is selected, you can also set the phase angle reference source.
82
6.3 Displaying Phase Relationships ([VECTOR] Screen)
Changing the harmonic number of orders
You can select what value to display.
When you change the number of orders, the values change along with the vector.
In this case, the voltage and current unbalance factors remain the same as the values calculated using
the fundamental wave (1st order).
[Harm Order]
Display the
pull-down menu
Change the
number of order
(Up to the 50th order can
be set)
Accept setting
Cancel
The harmonic number of orders
can also be changed without using
the pull-down menu by pressing the
up and down cursor keys.
83
6.4 Displaying Harmonics
6.4
Displaying Harmonics
Displaying harmonics as a bar graph
Example: 3P4W (3-phase, 4-wire)
[VIEW]
screen
Data for the channel selected here is displayed.
Harmonic voltage
Harmonic current
[HARMONICS]
[GRAPH]
Harmonic power
High-order
harmonic
High-order
harmonic
current
6
Monitoring Instantaneous Values (VIEW
To change the display channel (p.84)
To change the axis display (p.84)
To change the RMS value/phase angle display (p.84)
To display inter-harmonics (p.85)
To change the display order (p.85)
To hold the display (p.88)
Chapter 6
Select with the F key.
84
6.4 Displaying Harmonics
Changing the display channel, axis display, RMS/phase angle display, and inter-harmonics
Select the setting
Display the
pull-down menu
Select the setting
Accept setting
Cancel
Displayed channel
Settings:( ∗ : Default)
CH1∗/ CH2/ CH3/ CH4/sum
When the 400 Hz measurement frequency is selected, harmonic
analysis is performed up to the 10th order, and inter-harmonic analysis
is not available.
Axis display
If you select the logarithmic display method, the vector is
easy to see even at low levels.
Settings:( ∗ : Default)
LINER∗
Linear display
LOG
Log Logarithmic display
RMS/phase angle/content percentage display
Select the harmonic bar graph display (RMS value display, phase angle display, or content percentage).
The harmonic power phase angle indicates the harmonic voltagecurrent phase difference.
Settings:( ∗ : Default)
LEVEL∗
RMS
Phase
Phase angle
Content
Content percentage
In the level display, the high-order harmonic component bar graph and measured value (harmH) are displayed next to the U and I bar graphs.
85
6.4 Displaying Harmonics
Inter-harmonics
Settings:( ∗ : Default)
iharmOFF∗, iharmON
The setting can also be changed without using the pull-down menu by
pressing the up and down cursor keys.
When the inter-harmonics display is enabled
(iharmON), the screen changes as shown to
the right.
Turquoise: inter-harmonics components
Changing the Displayed Order
The selected order number becomes green on the bar graph.
If you change the order number, the values change along with the bar graph.
You can also change the displayed order without displaying the pull-down menu by using the up and
down cursor keys.
Change the
number of order
(Up to the 50th order can
be set)
Accept setting
Cancel
Monitoring Instantaneous Values (VIEW
Display the
pull-down menu
Chapter 6
[Harm Order]
6
86
6.4 Displaying Harmonics
Displaying harmonics as a list
The 1st to 50th harmonic orders and 0.5 to 49.5 inter-harmonic
orders are displayed in a list for the selected item.
Example: 3P3W3M Wiring
[VIEW]
screen
[HARMONICS]
[LIST]
To change the displayed channels (p.84)
To change the displayed items (p.84)
To change the RMS value/phase angle display
(p.84)
To display inter-harmonics (p.85)
When the 400 Hz measurement frequency is selected, harmonic analysis is performed up
to the 10th order, and inter-harmonic analysis is not available.
Changing the display channels, items, RMS value, phase angle, interharmonics
Select the setting
Display the
pull-down menu
Select the setting
Accept setting
Cancel
87
6.4 Displaying Harmonics
Displayed channel
Settings:( ∗ : Default)
CH1∗/ CH2/ CH3/ CH4/sum
Displayed item
Settings:( ∗ : Default)
U∗
Voltage
I
Current
P
Active power
RMS/phase angle/content percentage display
Select the harmonics list display (RMS value display, phase angle display, or content percentage).
The harmonic power phase angle indicates the harmonic voltage-current phase difference.
Settings:( ∗ : Default)
LEVEL∗
RMS
Phase
Phase angle
Content
Content percentage
6
When active power (P) is selected as the display item, inter-harmonics
are not displayed.
Settings:( ∗ : Default)
The setting can also be changed without using the pull-down menu by
pressing the up and down cursor keys.
When the inter-harmonics display is enabled
(iharmON), the screen changes as shown to
the right.
The left side of the example shows harmonics
and the right inter-harmonics.
The inter-harmonics order is obtained by adding 0.5 to the harmonics order for the same
row.
(Example)
The order of inter-harmonics on the right of
the 20th harmonic is 20.5.
Inter-harmonics
Harmonic
Harmonic number of orders
Monitoring Instantaneous Values (VIEW
iharmOFF∗, iharmON
Chapter 6
Inter-harmonics
88
6.4 Displaying Harmonics
Holding the display
[HOLD]
(Measured values and
waveforms will be held.)
89
6.5 Displaying Measured Values Numerically (DMM Screen)
6.5
Displaying Measured Values Numerically
(DMM Screen)
Example: 4-channel DMM display for 3P3W3M connection + channel 4
[VIEW]
screen
RMS voltage
RMS current
Active
Power
Apparent power
[DMM]
Reactive
[POWER]
Power
Power factor
(displacement power
factor)
Active energy
Reactive energy
K factor
[DMM]
[VOLTAGE]
Voltage average
value
Voltage unbalance
factor
Voltage waveform peak
(negative peak
value)
Harmonic
voltage
[DMM]
[CURRENT]
RMS current
Current waveform peak
(positive peak value)
Current average value
Current unbalance factor
Select with the F key.
To hold the display
(p.90)
Total current
distortion
Current
waveform peak
(negative peak
value)
Harmonic
current
See: For more information about the voltage calculation method
(Urms type), power factor calculation method (PF type), and
THD calculation method (THD type) settings:
"5.1 Changing Measurement Conditions" (p.55)
Monitoring Instantaneous Values (VIEW
Voltage waveform peak
(positive peak value)
Total voltage
distortion
6
Chapter 6
RMS
voltage
10-sec
frequency
90
6.5 Displaying Measured Values Numerically (DMM Screen)
Holding the display
[HOLD]
(Measured values will be
held.)
91
Monitoring Fluctuations in
Measured Values
(TIME PLOT
Screen)
Chapter 7
The [TIMEPLOT] screen allows you to view measured value fluctuations as a time series graph.
Trend and harmonic trend time series graphs:
RMS voltage, RMS current, and other measured values calculated every 200 ms are displayed as a time
series graph. The maximum, minimum, and average
50 Hz: 10 waveforms, 60 Hz: 12 waveforms, 400 Hz: values during the TIMEPLOT interval are recorded.
80 waveforms
Example
If the TIMEPLOT interval is set to 1 s, five values will
be calculated in 1 s. Of those, the maximum, minimum,
and average values will be recorded.
RMS value calculation
Harmonic calculation
Detailed trend time series graph:
1
3
2
1
5
4
2 3 4
5
RMS voltage calculation
During 400 Hz
measurement
1
2
3
RMS voltage calculation
The RMS voltage refreshed each half-cycle, frequency
cycle, and other measured values calculated for each
waveform are displayed as a time series graph. The
maximum and minimum values during the TIMEPLOT
interval are recorded. As shown in the figure, RMS voltage refreshed each half-cycle is shifted a half-wave
and calculated every wave.
Example
If the TIMEPLOT interval is set to 1 s, there are 100
RMS values and 50 frequency values calculated every
1 s (for a 50 Hz signal). Of those, the maximum and
minimum values are recorded.
See: Trend graph recording methods: "Recording TIMEPLOT
Data and Event Waveforms" (pA.14)
Chapter 7 Monitoring Fluctuations in Measured Val-
During 50/60 Hz
measurement
7
92
Display of trend data, detailed trend data, and harmonic trend data on the instrument is subject to certain
constraints. Updating of the displayed time series graph will stop when the times listed in the following
table are exceeded. Data will continue to be recorded to the SD memory card (see recording times
(p.63)) even if updating of the displayed time series graph stops.
[TIMEPLOT] screen maximum display times
TIME PLOT
Interval
Recording Items setting
ALL DATA
(Saves all data)
7 min. 52 sec.
23 min. 36 sec.
1 hour 58 min.
3 hours 56 min.
7 hours 58 min.
1 day 15 hours 20 min.
3 days 6 hours 40 min.
4 days 22 hours
9 days 20 hours
19 days 16 hours
35 days
1sec
3sec
15sec
30sec
1min
5min
10min
15min
30min
1hour
2hours
150/180 wave
23 min. 36 sec.
(Approx. 3 sec)
P&Harm
(Saves RMS values and harmonics)
15 min. 44 sec.
47 min. 12 sec.
3 hours 56 min.
7 hours 52 min.
15 hours 44 min.
3 days 6 hours 40 min.
6 days 13 hours 20 min.
9 days 20 hours
19 days 16 hours
35 days
35 days
Power
(Saves RMS values only)
2 hours 37 min. 20 sec.
7 hours 52 min.
1 day 15 hours 20 min.
3 days 6 hours 40 min.
6 days 13 hours 20 min.
32 days 18 hours 40 min.
35 days
35 days
35 days
35 days
35 days
47 min. 12 sec.
7 hours 52 min.
93
7.1 Using the [TIMEPLOT] Screen
7.1
Using the [TIMEPLOT] Screen
The TIME PLOT screen is composed of a number of screens that correspond to the DF1 to DF4
(DF: display function) keys.
When you press a DF key, the screen corresponding to that key appears.When there are multiple
screens, the screen display will change every time the same DF key is pressed.
TIME PLOT screen selector
About screen configuration (p.23)
Switching screen display
TREND
See: "7.2 Displaying Trends" (p.94)
DetailTrend
See: "7.3 Displaying detailed trends" (p.101)
HarmTrend
See: "7.4 Displaying Harmonic Trends" (p.107)
FLICKER
See: "7.5 Displaying Flicker Values in Graph and List Form" (p.111)
The screen shown varies with the instrument's internal operating state.
When recording starts, the time series graph is displayed on the TIME PLOT screen.
The Y-axis and X-axis are automatically scaled so that all the time series
graphs are displayed on the screen.
When recording is stopped, updating of the time series graph display stops.
[SETTING]
[WAITING]
Display
Display update
No time series graph display data.
-----------
[RECORDING]
The time series graph display is updated.
[ANALYZING]
Updating of the time series graph display stops.
Relationship
between
instrument status and key
operation
Every set TIMEPOT interval
[SETTING]
Set
-----------
[RECORDING]
Start
recording
[ANALYZING]
Stop
recording
Revert to [SETTING] mode
When you want to start
[RECORDING]
recording, but
does
not work because the instrument is in [ANALYZING] mode
Return to [SETTING]
mode from
[ANALYZING] mode
Start
recording
In [RECORDING]
mode:
When you want to change
settings in [RECORDING] or
[ANALYZING] mode
[SETTING]
Stop recording
In [ANALYZING]
mode:
Revert to [SETTING] mode
[SETTING]
Revert to [SETTING] mode
In both cases, all displayed measurement data will be deleted.
Chapter 7 Monitoring Fluctuations in Measured Val-
Internal
operation status
7
94
7.2 Displaying Trends
7.2
Displaying Trends
This section describes how to generate a time series display of values calculated internally every 200 ms
each TIMEPLOT interval. When using one or two screens, the maximum, minimum, and average values
during the TIMEPLOT interval are shown.
Example: 3P4W (3-phase, 4-wire)
[TIME PLOT]
screen
Final time in displayed
data
Initial time in displayed data
(One interval time prior to that displayed
for cursor measurement)
[TREND]
[1-SCREEN]
When displaying
[2-SCREEN], you can
select two characteristics to display.
[TREND]
[2-SCREEN]
[TREND]
[ENERGY]
Select with the F key.
To change the displayed characteristic,
channel, waveform, or measured value
(when displaying [1-SCREEN] or [2SCREEN] screen) (p.95)
To change the displayed characteristic
(when displaying [ENERGY] screen) (p.97)
To enlarge or reduce the graph (p.98)
To view the value and time over the
cursor (p.99)
To scroll through display data (p.99)
To search for an event (p.100)
95
7.2 Displaying Trends
Changing the displayed items, channels, waveforms, or measured
value ([1-SCREEN] and [2-SCREEN] screen)
[SELECT]
Select
Display the
pull-down menu
Select a setting
Accept the setting
Cancel
Flag
Indicates that a dip, swell, or interruption occurred during the displayed TIMEPLOT interval based on IEC61000-4-30 flag conversion.
A flag indicates that integrated values may be
unreliable.
See: "Flags" (p.100)
Allows you to select the displayed item and channel. Which channels
are available depends on the selected displayed item.
Settings:( ∗ : Default)
Displayed item Displayed channel
Displayed item Displayed channel
Freq∗
Freq∗ f10s
Ipk-
Urms
CH1∗
CH2
CH3
CH4
Upk+
CH1∗
CH2
CH3
CH4
Iunb
unb∗
unb0
Upk-
CH1∗
CH2
CH3
CH4
IharmH
CH1∗
CH2
CH3 CH4
Udc
CH4∗
Ithd
CH1∗
CH2
CH3 CH4
Uunb
unb∗
unb0
P
CH1∗
CH2
CH3 sum
UharmH
CH1∗
CH2
CH3
CH4
S
CH1∗
CH2
CH3 sum
Uthd
CH1∗
CH2
CH3
CH4
Q
CH1∗
CH2
CH3 sum
Irms
CH1∗
CH2
CH3
CH4
AVG PF
CH1∗
CH2
CH3 sum
Ipk+
CH1∗
CH2
CH3
CH4
KF
CH1∗
CH2
CH3 CH4
AVG Idc
CH1∗
CH2
CH3 CH4
CH4∗
• For, Freq, Uunb, and Iunb, you can select a detailed measurement item, rather than a channel.
• AVG indicates the average value for channels 1 through 3 (varies with connection).
• Sum indicates the sum for channels 1 through 3 (varies with connection).
The channels available for selection vary with the connection mode setting.
Chapter 7 Monitoring Fluctuations in Measured Val-
Displayed items and channels
7
96
7.2 Displaying Trends
Notation meaning
Symbol
Freq∗
Measurement Items
Frequency
Symbol
Irms
Measurement Items
RMS current
Symbol
Measurement Items
Uunb0
Uunb
Voltage zero-phase
unbalance factor
current
Negative-phase
unbalance factor
f10s
Frequency 10 sec
(Freq10s)
IrmsAVG
Average RMS current
(when avg is selected)
Iunb0
Iunb
Current zero-phase
unbalance factor
current
Negative-phase
unbalance factor
Upk+
Upk-
Voltage waveform
peak+
Voltage waveform
peak-
Idc
Current DC
UharmH
High-order
harmonic voltage component
Ipk+
Ipk-
Current waveform
peak+
Current waveform
peak-
P
Active power
IharmH
High-order
harmonic current component
Urms
RMS voltage
(phase/line)
S
Apparent power
Uthd-F
Uthd-R
Total harmonic voltage
distortion factor
UrmsAVG
Average RMS voltage
(when avg is selected)
Q
Reactive power
Ithd-F
Ithd-R
Total harmonic current
distortion factor
Udc
Voltage DC
PF
Power factor
KF
K factor
Displayed waveform and measured value
Settings:( ∗ : Default)
MAX
Displays the maximum value during the TIMEPLOT interval.
MIN
Displays the minimum value during the TIMEPLOT interval.
AVG
Displays the average value during the TIMEPLOT interval.
ALL∗
Displays the maximum, minimum, and average
values during the TIMEPLOT interval.
97
7.2 Displaying Trends
Changing the displayed items ([ENERGY] screen)
[SELECT]
Select
Display the
pull-down menu
Select a setting
Accept the setting
Cancel
Displayed items
Settings:( ∗ : Default)
WP∗
Active integration amount for WP+ consumption,
WP- regeneration
WQ
Reactive power WQLAG lag, WQLEAD lead
7
Chapter 7 Monitoring Fluctuations in Measured Val-
98
7.2 Displaying Trends
Enlarging or reducing the graph (changing the X- and Y-axis scale)
[SELECT]
Select a setting
Display the
pull-down menu
Select a setting
Accept the setting
Cancel
Y-axis scale (Ydiv)
To reduce the graph, decrease the scale.
To enlarge the graph, increase the scale.
Settings:( ∗ : Default)
AUTO∗, x1, x2, x5, x10, x25, x50
X-axis scale (Tdiv)
Selects the X-axis scale.
Settings:
AUTO∗, From 1min/div
When recording, use AUTO.
99
7.2 Displaying Trends
Viewing the value and time over the cursor (Cursor measurements)
You can read the value above the cursor and the time on the time series graph
[CURSOR]
Move the vertical
cursor left and
right to read the
display value.
When using one or two screens:
MAX (maximum value),
AVG (average value),
MIN (minimum value)
Cursor
time
Cursor value
Cursor
When using the [ENERGY] screen:
WP+ (consumption), WP- (regeneration), LAG (lag), LEAD (lead)
Scrolling through display data
[SCROLL]
Display scope
Scroll through the
graph
Scroll bar
Scroll bar
Display
scope
•
•
The display scope on the scroll bar (shown in
white) illustrates which range of all measurement
data is being shown on the screen.
The cursor on the scroll bar shows where the cursor is located relative to all measurement data.
Scroll bar
Cursor position
Display scope
All measurement data
7
Chapter 7 Monitoring Fluctuations in Measured Val-
During recording, the X- and Y-axis are automatically scaled so that the full time series graph fits on the
screen. Once recording has stopped and the X- and Y-axis scale has been changed so that the waveforms do
not fit on the screen, you can scroll through the time series graph by moving left, right, up, and down.
100
7.2 Displaying Trends
Searching for events
You can search for the time the event occurred (event marker).
When recording starts and stops, start and stop events are generated. This corresponds to the event
selected on the event list.
[EVENT SEARCH]
Skips sideways
through the event
Event mark
markers.
Analyzing events
using waveforms
(Red):
Indicates a normal event.
Event number, time and date,
type, channel
Flags
The measurement algorithm may generate unreliable values during dips, swells, and
interruptions. The possible unreliability of these measured values (set-values) is indicated by flags that are displayed with TIMEPLOT data when dips, swells, or interruptions occur. Even when dip, swell, and interruption events have been turned off, flags
are shown with measurement data when a dip or interruption (when the voltage falls
10% relative to the nominal voltage) or swell (when the voltage rises 200%) is judged to
have occurred.
Flag icon:
101
7.3 Displaying detailed trends
7.3
Displaying detailed trends
Displaying a detailed trend graph for each TIMEPLOT interval
This section describes how to display a time series graph for each TIMEPLOT interval for Urms1/2,
Irms1/2 (inrush current), S(t), or one frequency cycle.
Example: 3P4W (3-phase, 4-wire)
[TIME PLOT]
screen
[DetailTrend]
Waveform/measured value colors
when displaying CH1/2/3 data
Red : CH1
Yellow : CH2
Blue : CH3
Select with the F key.
Unlike trend data, which consists of one graph each for the maximum, minimum, and average values, detailed trend data is displayed as a single graph with vertically connected
bands between the maximum and minimum values.
7
Chapter 7 Monitoring Fluctuations in Measured Val-
To change displayed items and displayed
channel (p.102)
To enlarge or reduce the graph (p.103)
To read the value above the cursor (p.104)
To scroll through display data (p.105)
To search for an event (p.106)
102
7.3 Displaying detailed trends
Changing the displayed items and displayed channel
[SELECT]
Select
Display the
pull-down menu
Select a setting
Accept the setting
Cancel
Displayed items
Settings:( ∗ : Default)
Urms1/2∗
RMS voltage refreshed each half-cycle
Irms1/2
RMS current refreshed each half-cycle
(inrush current)
Freq_wav
One frequency cycle
S(t)
Instantaneous flicker value
S(t) is only displayed when [Flicker] is set to [Pst, Plt].
Displayed channel
Settings:( ∗ : Default)
CH1∗/ CH2/ CH3/ CH4
103
7.3 Displaying detailed trends
Enlarging or reducing the graph (changing the X- and Y-axis scale)
[SELECT]
Select a setting
Display the
pull-down menu
Select a setting
Accept the setting
Cancel
Y-axis scale (Ydiv)
When you want to reduce the graph, make the scale smaller.
When you want to enlarge the graph, make the scale larger.
Settings:( ∗ : Default)
X-axis scale (Tdiv)
When you want to reduce the graph, make the scale smaller.
When you want to enlarge the graph, make the scale larger.
Settings:( ∗ : Default)
AUTO∗, From 1min/div (varies with TIME PLOT interval)
AUTO scaling is used during recording. This cannot be changed.
Chapter 7 Monitoring Fluctuations in Measured Val-
AUTO∗, x1, x2, x5, x10, x25, x50
7
104
7.3 Displaying detailed trends
Reading the value above the cursor (Cursor measurements)
You can read the value above the cursor and the time on the time series graph.
[CURSOR]
Move the vertical
cursor left and
right to read the
display value.
Cursor color
Red: CH1
Yellow: CH2
Blue: CH3
Cursor value
Left:
Maximum
value
Right:
Minimum
value
Cursor time
Cursor
• When the TIMEPLOT interval is set to 150 or 180 cycles, the time is shown in ms
units.
• The time displayed during cursor measurement is based on the CH1 voltage (U1).
The event time shown on the event list and the time displayed during cursor measurement may not agree.
105
7.3 Displaying detailed trends
Scrolling through display data
During recording, the X- and Y-axis are automatically scaled so that the full time series graph fits on the
screen. Once recording has stopped and the X- and Y-axis scale has been changed so that the waveforms do
not fit on the screen, you can scroll through the time series graph by moving left, right, up, and down.
[SCROLL]
Display scope
Scroll through the
graph
Scroll bar
Scroll bar
Display scope
Scroll bar
Cursor position
Display scope
All measurement data
7
Chapter 7 Monitoring Fluctuations in Measured Val-
• The display scope on the scroll bar
(shown in white) illustrates which
range of all measurement data is
being shown on the screen.
• The cursor on the scroll bar shows
where the cursor is located relative to
all measurement data.
106
7.3 Displaying detailed trends
Searching for events
You can search for the time (event mark) at which an event occurred. When recording starts and stops,
start and stop events are generated. This corresponds to the event selected on the event list.
[EVENT SEARCH]
Skips
sideways
through the event
Event mark
markers.
Analyzing events
using waveforms
Event number, time and date,
type, channel
(Red):
Indicates a normal event.
107
7.4 Displaying Harmonic Trends
7.4
Displaying Harmonic Trends
This section descries how to select six orders and display their harmonic time series graphs. The maximum, minimum, or average value during the TIMEPLOT interval can be displayed.
Example: 3P4W (3-phase, 4-wire)
[TIME PLOT]
screen
[HarmTrend]
[HARMONIC]
7
[HarmTrend]
[INTERHARM]
To change displayed items/waveform/measurement
value (p.108)
To enlarge or reduce the graph (p.108)
To change display number of order (p.108)
To read the value above the cursor (p.109)
To scroll waveform data (p.110)
To search for an event (p.110)
• When [Power] is selected under the [Recording Items] settings (see SYSTEM-DF1
[RECORD] (p.62)), harmonic trends (the harmonic trend graph and inter-harmonic trend
graphs) will not be displayed. Additionally, inter-harmonic trend data will not be displayed
if [P&Harm] is selected.
• During 400 Hz measurement, harmonic analysis is performed up to the 10th order, and
inter-harmonic analysis is not available.
Chapter 7 Monitoring Fluctuations in Measured Val-
Select with the F key.
108
7.4 Displaying Harmonic Trends
Changing displayed items, displayed waveforms, and displayed measured values; enlarging and reducing graphs (changing the X-axis
scale); and changing the displayed order
[SELECT]
Select
1st-order
waveform
Display the
pull-down menu
Select a setting
Measured
values
3rd-order
waveform
Accept the setting
Cancel
Displayed items
Settings:( ∗ : Default)
U1∗/U2/U3/U4
Voltage (CH1/2/3/4)
I1/I2/I3/I4
Current (CH1/2/3/4)
P1/P2/P3
Active power (CH1/2/3)
Psum
Total active power
θ1/θ2/θ3
Phase difference (P phase) (CH1/2/3)
θsum
Total phase difference (P phase)
The available displayed characteristics options vary with the connection method.
Only U1/U2/U3/U4/I1/I2/I3/I4 can be selected for the inter-harmonic time series graph.
Displayed waveforms, displayed measured values
Settings:( ∗ : Default)
MAX∗
Displays the maximum value during the TIMEPLOT interval.
MIN
Displays the minimum value during the TIMEPLOT interval.
AVG
Displays the average value during the TIMEPLOT interval.
109
7.4 Displaying Harmonic Trends
X-axis scale (Tdiv)
Selects the X-axis scale.
Settings:
From 1min/div
AUTO scaling is used during recording. This cannot be
The Y-axis scale cannot be changed. The Y-axis maximum value will be the same as the
range’s full-scale value.
Displayed Order
Six orders can be selected and displayed at the same time. The measured value and waveform are displayed using the color of the order at the left.
Settings:( ∗ : Default)
(1,3,5,7,9,11)∗, 0 to 50 ([HARMONIC] screen)
(1.5,3.5,5.5,7.5,9.5,11.5)∗, 0.5 to 49.5 ([INTERHARM] screen)
Reading the value above the cursor (Cursor measurements)
This section describes how to read the value and time above the time series graph cursor.
7
[CURSOR]
The cursor value is shown in
the same color as the
selected order.
Cursor time
Cursor
Cursor value
Chapter 7 Monitoring Fluctuations in Measured Val-
Move the vertical
cursor left and
right to read the
display value.
110
7.4 Displaying Harmonic Trends
Scrolling through waveforms
During recording, the X-axis is automatically scaled so that the full time series graph fits on the screen.
Once recording has stopped and the X-axis scale has been changed so that the waveforms do not fit on
the screen, you can scroll through the time series graph by moving left and right.
[SCROLL]
Display scope
Scroll through the
graph
•
•
The white band on the scroll bar indicates
the range of measured values that can be
displayed. When this band does not include
the cursor position, the cursor and cursor
value are not displayed.
The cursor on the scroll bar shows where
the cursor is located relative to all measurement data.
Scroll bar
Scroll bar
Cursor position
Display scope
All measurement data
Searching for events
You can search for the time the event occurred (event marker).
The start time and stop time event markers are always displayed.
Synchronization is achieved with an event selected from the event list.
[EVENT SEARCH]
Skips
sideways
through the event
Event mark
markers.
(Red):
Analyzing events Indicates a normal event.
using waveforms
Event number, time and date,
type, channel
111
7.5 Displaying Flicker Values in Graph and List Form
7.5
Displaying Flicker Values in Graph and List
Form
Flicker measurement cannot be performed during 400 Hz measurement.
IEC flicker meters and ΔV10 flicker meters
Flicker meters are used to measure the sensation of visual instability that occurs due to changes in light
source brightness and wavelength. There are two types of flicker meters: IEC flicker meters (UIE flicker
meters), which comply with IEC standards, and ΔV10 flicker meters, which are used domestically in
Japan. Both types of flicker meter observe fluctuations in voltage and display values used to objectively
judge flicker.
Displaying an IEC flicker fluctuation graph
This section describes how to display an IEC flicker fluctuation graph.
[TIME PLOT]
screen
7
Select with the F key.
To change the displayed channels (p.112)
To enlarge or reduce the graph (p.112)
To read the value above the cursor (p.113)
To scroll waveform data (p.113)
• The graph is updated every 10 minutes, regardless of the [TIMEPLOT Interval] set
in SYSTEM-DF1 [RECORD] (p.63).
• The graph is not displayed unless [Flicker] is set to [Pst, Plt] in [SYSTEM]-DF1
[MAIN]-F1 [MEASURE].
• Urms1/2, Irms1/2, Freq_wav, and S(t) are recorded continuously.
• Due to the influence of the high pass filter used, measured values are unstable when
starting Pst, Plt measurement immediately after settings have been configured, and the
initial measured value may be excessively high. It is recommended to wait about 2 minutes after making settings on the [SYSTEM] screen before starting measurement.
Chapter 7 Monitoring Fluctuations in Measured Val-
[FLICKER]
[GRAPH]
112
7.5 Displaying Flicker Values in Graph and List Form
Changing the displayed channel and enlarging and reducing graphs
(changing the X- and Y-axis scale)
[SELECT]
Select a setting
Display the
pull-down menu
Select a setting
Accept the setting
Cancel
Displayed channel
Settings:( ∗ : Default)
CH1∗, CH2, CH3
Y-axis scale (Ydiv)
When you want to reduce the graph, make the scale smaller.
When you want to enlarge the graph, make the scale larger.
Settings:( ∗ : Default)
AUTO∗, x1, x2, x5, x10, x25, x50
X-axis scale (Tdiv)
Selects the X-axis scale.
Settings:
From 10min/div
AUTO scaling is used during recording. This cannot be changed.
113
7.5 Displaying Flicker Values in Graph and List Form
Reading the value above the cursor (Cursor measurements)
This section describes how to read the Pst and Plt measured values every 10 minutes.
[CURSOR]
Move the vertical
cursor left and
right to read the
display value.
Cursor time
Cursor value
Cursor value
Top: Pst measured value
Bottom: Plt measured value
Cursor
Scrolling through waveforms
[SCROLL]
Display scope
Scroll through the
graph
Scroll bar
Scroll bar
Display scope
• The display scope on the scroll bar
(shown in white) illustrates which
range of all measurement data is
being shown on the screen.
• The cursor on the scroll bar shows
where the cursor is located relative to
all measurement data.
Scroll bar
Cursor position
Display scope
All measurement data
7
Chapter 7 Monitoring Fluctuations in Measured Val-
During recording, the X- and Y-axis are automatically scaled so that the full time series graph fits on the
screen. Once recording has stopped and the X- and Y-axis scale has been changed so that the waveforms do not fit on the screen, you can scroll through the time series graph by moving left, right, up, and
down.
114
7.5 Displaying Flicker Values in Graph and List Form
Displaying an IEC flicker list
This section describes how to display Pst and Plt statistics along with the time and date every 10 minutes.
[TIME PLOT]
screen
[FLICKER]
[LIST]
• Pst:
Short interval flicker value
• Plt:
Long interval flicker value
Press the F key to select a channel.
• Statistics consist of a list of the following IEC flicker statistics (Pst and Plt) along with the
time and date, which is updated every 10 minutes.
• This information will not be displayed unless [Flicker] has been set to [Pst, Plt] in
[SYSTEM]-DF1 [MAIN]-F1 [MEASURE].
• EN50160,”Voltage Characteristics in Public Distribution Systems,” gives “Plt ≤ 1 for 95%
of week” as a limit value.
Flags
The measurement algorithm may generate unreliable values during dips, swells, and interruptions. The possible unreliability of these measured values (set-values) is indicated by
flags that are displayed with TIMEPLOT data when dips, swells, or interruptions occur.
Even when dip, swell, and interruption events have been turned off, flags are shown with
measurement data when a dip or interruption (when the voltage falls 10% relative to the
nominal voltage) or swell (when the voltage rises 200%) is judged to have occurred.
Flag icon:
115
7.5 Displaying Flicker Values in Graph and List Form
Displaying a ΔV10 flicker fluctuation graph
This section describes how to display a ΔV10 flicker fluctuation graph.
[TIME PLOT]
screen
[FLICKER]
[GRAPH]
Select with the F key.
To enlarge or reduce the graph (p.116)
To read the value above the cursor (p.117)
To scroll waveform data (p.117)
• The graph is updated once a minute, regardless of the TIMEPLOT interval set in [SYSTEM]-DF1 [RECORD].
• The graph is not displayed unless [Flicker] is set to [DV10] in [SYSTEM]-DF1 [MAIN]F1 [MEASURE].
• ΔV10 flicker can be measured simultaneously for the voltage channels U1, U2, and U3
(depends on connection).
ΔV10 flicker reference voltage
In ΔV10 flicker measurement, the reference voltage is automatically set internally using AGC (automatic
gain control).
Once the fluctuating voltage value has stabilized, the reference voltage is automatically changed to that
value. Consequently, there is no need to switch supply voltage settings as with conventional ΔV10 flicker
meters.
(Example)
Fluctuating voltage: Stabilizes at 96 Vrms The reference voltage is automatically changed to 96 V rms.
Fluctuating voltage: Stabilizes at 102 Vrms The reference voltage is automatically changed to 102 V rms.
Due to the influence of the high pass filter used in ΔV10 flicker measurement, measured values are
unstable when starting ΔV10 measurement immediately after settings have been configured, and the first
and second ΔV10 measured values may be excessively high. It is recommended to wait about 5 minutes
after making settings on the [SYSTEM] screen before starting measurement.
Chapter 7 Monitoring Fluctuations in Measured Val-
1
7
116
7.5 Displaying Flicker Values in Graph and List Form
Enlarging or reducing the graph (changing the X- and Y-axis scale)
[SELECT]
Select a setting
Display the
pull-down menu
Select a setting
Accept the setting
Cancel
Y-axis scale (Ydiv)
When you want to reduce the graph, make the scale smaller.
When you want to enlarge the graph, make the scale larger.
Settings:( ∗ : Default)
AUTO∗, x1, x2, x5, x10, x25, x50
X-axis scale (Tdiv)
Selects the X-axis scale.
Settings:
From 1min/div
AUTO scaling is used during recording. This cannot be changed.
117
7.5 Displaying Flicker Values in Graph and List Form
Reading the value above the cursor (Cursor measurements)
This section describes how to read the ΔV10 flicker measured value once a minute.
[CURSOR]
Move the vertical
cursor left and
right to read the
display value.
Cursor time
Cursor value
Cursor value
Left: Measured value
Right: ΔV10
Cursor
The time displayed during cursor measurement is based on the CH1 voltage (U1). The
event time shown on the event list and the time displayed during cursor measurement
may not agree.
Scrolling through waveforms
[SCROLL]
Display scope
Scroll through the
graph
Scroll bar
Scroll bar
Display scope
• The display scope on the scroll bar
(shown in white) illustrates which
range of all measurement data is
being shown on the screen.
• The cursor on the scroll bar shows
where the cursor is located relative to
all measurement data.
Scroll bar
Cursor position
Display scope
All measurement data
7
Chapter 7 Monitoring Fluctuations in Measured Val-
During recording, the X- and Y-axis are automatically scaled so that the full time series graph fits on the
screen. Once recording has stopped and the X- and Y-axis scale has been changed so that the waveforms do
not fit on the screen, you can scroll through the time series graph by moving left, right, up, and down.
118
7.5 Displaying Flicker Values in Graph and List Form
Displaying a ΔV10 flicker list
This section describes how to display the following ΔV10 flicker statistics along with the time and date
once an hour:
• ΔV10 flicker 1-hour maximum value
• ΔV10 flicker 1-hour fourth-largest value
• ΔV10 flicker 1-hour average value
ΔV10 flicker statistics for the measurement period are displayed. Each ΔV10 value is updated once a minute.
• ΔV10 flicker overall maximum value
[TIME PLOT]
screen
[FLICKER]
[LIST]
• Statistics are updated once an hour, and the ΔV10 flicker overall maximum value is
updated once a minute.
• The list is not displayed unless [Flicker] is set to [DV10] in [SYSTEM]-DF1 [MAIN]-F1
[MEASURE].
• In Japan, the average (ΔV10 flicker 1-hour average value) and maximum (ΔV10 flicker
1-hour maximum value, 1-hour fourth-largest value, or overall maximum value) limit values for ΔV10 flicker are 0.32 V and 0.45 V, respectively.
119
Checking Events
(EVENT
screen)
Chapter 8
Data is analyzed on the [EVENT] screen. For more information about events, see "Appendix 2 Explanation of Power Supply Quality Parameters and Events" (p.A4).
Each time an event occurs, an event is
added to the [EVENT LIST] screen.
Event occurrence
Display the event list. (p.121)
You can check events that have occurred on the [EVENT LIST] screen.
Analyze events. (p.124 to p.132)
You can display the screen at the time the selected event occurred.
• When making measurements using events, be sure to set the event setting on the [SYSTEM] screen to ON.
[EVENT1]
[EVENT2]
See: "5.5 Changing Event Settings" (p.66)
• The maximum number of events that can be displayed is 1,000. Depending on the
repeated recording and repeat count settings, up to 55,000 events can be recorded.
(Event data should be analyzed using the 9624-50 PQA Hi-View Pro software.)
8
Chapter 8 Checking Events (EVENT screen)
Events displayed by the PW3198
• Start recording events
• Stop recording events
• Calculation events (events for which one or more thresholds can be set)
• Event waveforms (transient waveforms, high-order harmonic data, fluctuation data)
120
8.1 Using the EVENT screen
8.1
Using the EVENT screen
Pressing the DF1 key on the [EVENT] screen displays the [EVENT LIST] screen.
EVENT screen
About screen configuration (p.20)
EVENT
LIST
The screen shown varies with the instrument's internal operating
state.
Screen operation is limited depending on the instrument's internal operating
state.
Internal operating state
[SETTING]
Display update
None
[RECORDING]
After each event
[ANALYZING]
Stop
Relationship between
instrument status and key
operation
[SETTING]
[RECORDING]
Set
Start
recording
[ANALYZING]
Stop
recording
Revert to [SETTING] mode
When you want to start recording, but
does not
work because the instrument
is in [ANALYZING] mode
[RECORDING]
Start
Return to [SETTING]
mode from [ANALYZING] recording
mode
In [RECORDING]
mode:
When you want to change
settings in [RECORDING]
or [ANALYZING] mode
[SETTING]
Stop recording
In [ANALYZING]
mode:
Revert to [SETTING] mode
[SETTING]
Revert to [SETTING] mode
In both cases, all displayed measurement data will be deleted.
121
8.2 Displaying the Event List
8.2
Displaying the Event List
Displays events in a list.
[EVENT]
[LIST]
Scroll the event list up
and down
See: "Event times, list notation,
and saved items" (p.122)
To analyze the state when the event occurred (p.124)
(Available only in [ANALYING] mode.)
To analyze the transient waveform (p.126)
To view high-order harmonic measured values (p.129)
To check fluctuation data (p.132)
• Information that is recorded as the event includes the start, stop, the PW3198 message, and event
parameters set in the [SYSTEM] screen.
• Up to 1,000 events can be displayed, numbered from 1 to 1,000.
• When events with multiple differing parameters occur during the same approximately 200 ms period,
they are displayed together as a single event. A list of the multiple parameters is shown to the right.
Select an event to display detailed event information and multiple event parameters.
Move the yellow
cursor to select an
event
Select the event
type in the detail
display
The voltage waveform
when the event occurred
is shown.
You can more the yellow cursor up and down 100 rows at
a time with the F1 and F2
keys.
You can move the cursor to the most
recent event with the F4 key.
Chapter 8 Checking Events (EVENT screen)
Displaying event details
8
122
8.2 Displaying the Event List
Event times, list notation, and saved items
Event list
notation
Event items
IN/OUT/
SENSE
Transient overvoltage Tran
IN/OUT
Swell
Swell
IN/OUT
Dip
Dip
IN/OUT
Interruption
Intrpt
IN/OUT
Inrush current
Inrush
(Irms1/2)
IN/OUT
Measurement items
All instantaneous values
(Frequency, voltage, current, power, power factor,
unbalance factor, harmonic
voltage, harmonic current,
harmonic power, harmonic
voltage distortion factor,
harmonic current distortion
factor, K factor, high-order
harmonic voltage component and current component, etc.)
Saved items
Event
High-speed
waveform
waveform
Yes
Transient overvoltage waveform
Yes
Yes
Yes
Yes
Yes
Yes
Yes
Yes
Frequency
Freq
IN/OUT
Frequency cycle
Freq_wav
IN/OUT
Voltage waveform
peak
Upk
IN/OUT
Yes
RMS voltage
Urms
IN/OUT/SENSE
Yes
Voltage DC change
(CH4 only)
Upp
IN/OUT
Yes
Current waveform
peak
Ipk
IN/OUT
Yes
RMS current
Irms
IN/OUT/SENSE
Yes
Current DC change
(CH4 only)
Ipp
IN/OUT
Yes
Active power
P
IN/OUT
Yes
Apparent power
S
IN/OUT
Yes
Reactive power
Q
IN/OUT
Yes
Power factor/
displacement factor
PF
IN/OUT
Yes
Voltage
negative-phase
unbalance factor
Uunb
IN/OUT
Yes
Voltage zero-phase
unbalance factor
Uunb0
IN/OUT
Yes
Current
negative-phase
unbalance factor
Iunb
IN/OUT
Yes
Current zero-phase
unbalance factor
Iunb0
IN/OUT
Yes
Yes
Yes
Harmonic voltage
Uharm
IN/OUT
Yes
Harmonic current
Iharm
IN/OUT
Yes
Harmonic power
Pharm
IN/OUT
Yes
Phase difference of
harmonic voltage and Pphase
harmonic current
IN/OUT
Yes
Total harmonic voltage distortion factor
IN/OUT
Yes
Total harmonic current
Ithd
distortion factor
IN/OUT
Yes
K factor
KF
IN/OUT
Yes
High-order harmonic
voltage component
UharmH
IN/OUT
Yes
High-order harmonic waveform
High-order harmonic
current component
IharmH
IN/OUT
Yes
High-order harmonic waveform
Voltage waveform
comparison
Wave
Uthd
Yes
Timer event
Timer
Yes
Continuous event
Cont
Yes
External event
Ext
Yes
Manual event
Manu
Yes
Start
Start
Yes
Stop
Stop
Yes
GPS_IN
Yes
GPS Note 1
Fluctuation
data
GPS_OUT
Yes
GPS_Err
Yes
123
8.2 Displaying the Event List
Note1
• GPS error (GPS error): GPS IN
• GPS error cleared (GPS positioning): GPS OUT
• GPS time correction failure (GPS time error): GPS Err
IN/OUT rules are irrelevant.
Fluctuation data is only displayed for IN events. If a series of swell, dip, interrupt, or
inrush current IN events occur, fluctuation data may be unavailable.
Event list order
The first event to occur (the start event) is assigned No. 1, and subsequent events are assigned numbers
in order as they occur.
Event list display
Event list
The event list is displayed in the order events occur.
Displayed item
Contents
Example
No.
Order of event occurrence
1
Date
Event occurrence (date)
2001/6/7
Time
Event occurrence (time)
10:05:32.016
EVENT
Event item
Uharm
CH
Event channel (CH1, CH2, CH3, CH4, sum)
CH2
IN/OUT
IN
: Event occurrence
OUT
: Event end
SENSE : Sense event occurrence
IN
When two event IN items occur simultaneously, voltage factor events are given precedence in the display. Similarly,
when two event OUT items occur simultaneously, voltage factor events are given precedence in the display.
Event details list
Displayed item
Contents
Example
EVENT
Event item (variable)
Harmonic and inter-harmonic orders are also shown for harmonic events.
Uharm (2)
CH
Event channel (CH1, CH2, CH3, CH4, sum) and IN (event occurrence),
OUT (event end), and SENSE (sense event occurrence)
For frequency events, the list indicates either up (when the reading was
greater than the threshold) or down (when the reading was less than the
threshold).
CH4 OUT
Date
Indicates the date on which the event was detected.
2001/6/7
Time
Indicates the time at which the event was detected.
10:05:32.016
Threshold
Set event threshold (sense value, measured value)
62.053 V
Level
Measured value when event was detected
For transient overvoltage values, the transient width is also shown in 500 ns 1012.0 V
units.
Duration
Indicates the period after which the reading returned after the threshold was 0:57:12.032
exceeded, or the period from IN to OUT.
10.5μs
Worst
Level
Worst measured value during event period
For transient overvoltage values, the maximum transient overvoltage value
width during the event period is also shown.
120.01 V
10.5 μs
Date
Indicates the date on which the worst value was detected.
2001/6/7
Time
Indicates the time at which the worst value was detected.
10:05:32.016
Channel on which the worst value was detected
CH1
CH
Times
Number of transient overvoltages detected from the transient overvoltage event IN 5Times
to the transient overvoltage event OUT (up to 99,999)
8
Chapter 8 Checking Events (EVENT screen)
Some detailed information cannot be displayed in the event list alone, and multiple events may occur
simultaneously. In that case, representative events are shown in the event list, and other events are
shown with the event description on the details list.
124
8.3 Analyzing the Measurement Line Status When Events Occur
8.3
Analyzing the Measurement Line Status
When Events Occur
You can display the waveform and measured values that obtained when an event occurred on the
[VIEW] screen by selecting the event you wish to analyze on the [EVENT LIST] screen.
[EVENT]
[LIST]
Select a event
Accept setting
The display will switch
to the [VIEW] screen,
and the waveform at
the time of the event
will be displayed.
The event number, event
time, and event type will
be displayed.
Return to
event list
Event waveform
screen
You can analyze the
waveform when the event
occurred.
125
8.3 Analyzing the Measurement Line Status When Events Occur
You can change to the event generation screens (DF1 [WAVE], DF2 [HARMONICS], DF3
[DMM], and DF4 [EVENT]) by pressing a DF key from the event waveform screen.
Screen transitions and measurement data when events occur
Event jump function
Moving the cursor to the event you wish to view on the event list and pressing the ENTER key displays the measurement data
for that time. The screen displayed initially varies with the event that occurred. Subsequently, you can press a DF key to display
the desired screen and check measurement data.
Move the cursor to the event you wish to
view and press the ENTER key.
EVENT
LIST
[ANALYZING] Screen display switching with DF
keys
mode
Frequency, one frequency cycle, voltage, current,
power, power factor, unbalance factor, distortion factor, waveform comparison, timer, continuous, and external events
VOLT/CURR
WAVE
VOLTAGE
CURRENT
VECTOR
HARMONIC
GRAPH
LIST
Harmonic voltage, harmonic current, harmonic
power, and K factor events
8
POWER
DMM
VOLTAGE
Transient events
TRANSIENT
EVENT
HHarmonic
High-order harmonic component events
TrendData
Displays the instant the event occurred.
Swell, dip, interruption, and inrush current IN events
Note1: For OUT events, the display jumps to the [VOLT/
CURR] screen.
Note2: When a series of swell, dip, interruption, or inrush
current IN events occur, there may be no fluctuation data.
How can event waveforms be recorded?
See: "Appendix 4 Recording TIMEPLOT Data and Event Waveforms" (p.A14)
Chapter 8 Checking Events (EVENT screen)
CURRENT
126
8.4 Analyzing Transient Waveforms
8.4
Analyzing Transient Waveforms
Displaying transients
[EVENT]
[LIST]
Select an event for
which “Tran” is
shown on the
event list or event
details list
Accept setting
The display will switch to the
[VIEW] screen, and the
waveform at the time of the
event will be displayed.
Voltage/Transient waveforms display
[TRANSIENT]
Voltage
Waveform
Year, month, day; time; rising peak value; and duration of transient
Transient waveform
Return to event list
Select with the F key.
To enlarge or reduce the transient waveform (p.127)
To scroll transient waveform data (p.128)
127
8.4 Analyzing Transient Waveforms
Enlarging and reducing the transient waveform
[SELECT]
Select the setting
Display the
pull-down menu
Select the setting
Accept setting
Cancel
Y-axis range
To reduce the waveform, increase the voltage value per division.
To enlarge the waveform, reduce the voltage value per division.
Setting Contents:( ∗ : Default setting)
Voltage waveform range (U)
x1/3, x1/2, x1∗, x2, x5, x10, x20, x50
Transient waveform range (T)
x1/2∗, x1, x2, x5, x10, x20
Selects the X-axis scale.
Setting Contents:( ∗ : Default setting)
Voltage waveform range:
5ms/div∗, 10ms/div, 20ms/div, 40ms/div
Transient waveform range:
25μs/div∗, 50μs/div, 100μs/div, 200μs/div, 400μs/div
Chapter 8 Checking Events (EVENT screen)
X-axis range (Tdiv)
(left: voltage waveform range; right: transient waveform range)
8
128
8.4 Analyzing Transient Waveforms
Scrolling the transient waveform
You can check all waveform data by scrolling the waveform horizontally.
[SCROLL]
Scroll the
waveform
Return to
event list
Display scope
Scroll bar
Scroll bar
The display scope on the scroll bar
(shown in white) illustrates which
range of all measurement data is
being shown on the screen.
Display scope
All measurement data
129
8.5 Viewing High-order Harmonic Waveforms
8.5
Viewing High-order Harmonic Waveforms
RMS values for noise components at 2 kHz and higher are known as the high-order harmonic
component. When a high-order harmonic component event is detected, the high-order harmonic
waveform is recorded. The high-order harmonic waveform is a 40 ms instantaneous waveform
sampled at 200 kHz.
[EVENT]
[LIST]
Select a event
Accept setting
The display will switch to
the [VIEW] screen, and
the waveform at the time
of the event will be displayed.
High-order harmonic waveforms
display
[HHarmonic]
8
Return to event list
To enlarge or reduce the graph (p.130)
To read the value above the cursor (p.131)
To scroll waveform data (p.131)
Chapter 8 Checking Events (EVENT screen)
Select with the F key.
130
8.5 Viewing High-order Harmonic Waveforms
Enlarging or reducing the graph (changing the X- and Y-axis scale)
[SELECT]
Select the setting
Display the
pull-down menu
Select the setting
Accept setting
Cancel
Y-axis scale (U: Voltage, I: Current)
When you want to reduce the graph, make the scale smaller.
When you want to enlarge the graph, make the scale larger.
Setting Contents:( ∗ : Default setting)
x1/3, x1/2, x1∗, x2, x5, x10, x20, x50
X-axis scale
Selects the X-axis scale.
Setting Contents:( ∗ : Default setting)
0.5ms/div∗, 1ms/div, 2Ççs/div,5ms/div,10ms/div
The scale can also be changed without using the pull-down menu by
pressing the up and down cursor keys.
131
8.5 Viewing High-order Harmonic Waveforms
Viewing the value and time at the cursor position (Cursor measurements)
You can read the value and time at the cursor position on time series graphs.
[CURSOR]
Move the vertical
cursor left and
right to read the
display value.
Cursor color
Red: CH1
Yellow: CH2
Blue: CH3
Gray: CH4
Cursor value
Cursor
time
Cursor
Scrolling the waveform
During recording, the X-axis is automatically scaled so that the full time series graph fits on the screen.
Once recording has stopped and the X-axis scale has been changed so that the waveforms do not fit on
the screen, you can scroll through the time series graph by moving left, right, up, and down.
Scroll through the
graph
Display scope
Scroll bar
• The display scope on the scroll bar
(shown in white) illustrates which
range of all measurement data is
being shown on the screen.
• The cursor on the scroll bar indicates where the cursor is located
relative to all waveform data.
Scroll bar
Cursor position
Display scope
All waveform data
Chapter 8 Checking Events (EVENT screen)
[SCROLL]
8
132
8.6 Checking Fluctuation Data
8.6
Checking Fluctuation Data
Fluctuation data for swell, dip, interruption, and inrush current events when an event occurs is
displayed for 30 s (from 0.5 s before to 29.5 s after the event IN) as a time series graph (during 400
Hz measurement, from 0.125 s before to 7.375 s after the event IN).
[EVENT]
[LIST]
Select a event
Accept setting
The display will switch
to the [VIEW] screen,
and an event will occur.
Fluctuation data display
[TrendData]
Return to event list
The U1, U2, and U3 time series graphs
are displayed. The pre-trigger and total
recording periods are fixed at 0.5 and 30
s, respectively.
Red: CH1
Yellow: CH2
Blue: CH3
Gray: CH4
The maximum and minimum values during
the TIMEPLOT interval are shown as the
MAX and MIN values.
Select with the F key.
To change the displayed channels (p.133)
To enlarge or reduce the graph (p.133)
To read the value above the cursor (p.134)
To scroll waveform data (p.134)
133
8.6 Checking Fluctuation Data
• Data can be recorded regardless of the recording item settings (p.62) and the TIMEPLOT interval settings (p.63) (SYSTEM-DF1 [RECORDING]).
• When an event occurs while 30 s of fluctuation data is being recorded, fluctuation data is
only recorded for the first event.
• Ultimately, data can be analyzed in detail and reports generated using the 9624-50 PQA
Hi-View Pro software.
Changing the displayed channel and enlarging or reducing the graph
(changing the X-axis scale)
[SELECT]
Select the setting
Display the
pull-down menu
Select the setting
Accept setting
Cancel
8
Setting Contents:( ∗ : Default setting)
CH1∗/ CH2/ CH3/ CH4 (varies with connection)
X-axis scale (Tdiv)
When you want to reduce the graph, make the scale smaller.
When you want to enlarge the graph, make the scale larger.
Setting Contents:( ∗ : Default setting)
AUTO∗, x5, x2, x1, x1/2, x1/5, x1/10
Chapter 8 Checking Events (EVENT screen)
Displayed channel
134
8.6 Checking Fluctuation Data
Viewing the value and time at the cursor position (Cursor measurements)
You can read the value and time at the cursor position on time series graphs.
[CURSOR]
Move the vertical
cursor left and
right to read the
display value.
Cursor
Cursor value
Cursor color
Red: CH1
Yellow: CH2
Blue: CH3
Gray: CH4
Cursor
time
Scrolling the waveform
During recording, the X-axis and Y-axis are automatically scaled so that the full time series graph fits on
the screen. Once recording has stopped and the X-axis or Y-axis scale has been changed so that the
waveforms do not fit on the screen, you can scroll through the time series graph by moving left, right, up,
and down.
[SCROLL]
Display scope
Scroll through the
graph
Scroll bar
• The display scope on the scroll bar
(shown in white) illustrates which
range of all measurement data is being
shown on the screen.
• The cursor on the scroll bar shows
where the cursor is located relative to
all measurement data.
Scroll bar
Display scope
Scroll bar
Cursor position
Display scope
All measurement data
135
9.1 [MEMORY] Screen
Data Saving and File Operations
(SYSTEM-MEMORY
screen)
Chapter 9
The PW3198 saves settings data, measurement data, waveform data, event data, and screen copy
data to an optional SD memory card. (Of this data, only setting conditions can be loaded by the
instrument.)
See:"3.5 Inserting (Removing) an SD Memory Card" (p.32)
9.1
[MEMORY] Screen
This section describes the [MEMORY] screen.
Displays the current display position. This screen indicates that the contents of the PW3198 folder on the SD
memory card are being displayed.
Displays how much of the SD memory
card has been used.
Displays a list of files saved on the SD
memory card.
An error message will be displayed if the SD memory card experiences an error. SD utilization is not shown.
Chapter 9 Data Saving and File Operations
(SYSTEM-MEMORY screen)
Allows you to scroll around the
screen with the up and down cursor keys and displays the current
display position as a white bar.
9
8
9
136
9.1 [MEMORY] Screen
About File Types
The following file data types may be stored.
Name
Type
Description
00000001.SET
SET
Settings file
00000001.BMP
BMP
Screen copy data file
EV000001.EVT
EVT
Event data file
TR000001.TRN
TRN
Transient waveform file
HH000001.HHC
HHC
High-order harmonic waveform file
000001.WDU
WDU
Fluctuation data file
AT000000.BMP
BMP
Screen data file saved once each screen copy interval
PW3198.SET
SET
Settings data file at start of time series measurement
TP0000.ITV
ITV
Time series measurement normal binary file
FL0000.FLC
FLC
Time series measurement flicker data
HARDCOPY
<Folder>
Folder for saving screen copy data files
SETTING
<Folder>
Folder for saving settings
BYYMMDDNN
<Folder>
Folder for saving data (name varies with folder type, date, and
number of folder)(p.140))
EVENT
<Folder>
Folder for saving events
AUTOCOPY
<Folder>
Folder for automatically saving screen data (folder for saving
AT*******.BMP files)
• Files are numbered consecutively inside each folder.
• The first letter of the folder for saving data indicates the data type, while Y represents the last digit of
the year, MM the month, DD the day, and NN the consecutive number for that day.
137
9.1 [MEMORY] Screen
Moving inside folders, moving to the root folder, and list displays
Moving inside a folder
• You can display the contents of a folder by moving the cursor to the folder with the up and down cursor
keys and then pressing the right cursor key.
• While the root folder [/] is being displayed, you can move to the [PW3198] folder with the right cursor
key, regardless of the cursor position.
• To go back one folder when the [HARDCOPY] or [AUTOCOPY] folder is being displayed, press the
ESC key. For other folders, press the left cursor key.
• You cannot move to folders unrelated to the instrument.
List displays
The contents of [HARDCOPY] and [AUTOCOPY] folders are displayed as a list of BMP file thumbnails,
and their contents are displayed in list form. Other folder contents are displayed as a list of filenames.
/
PW3198
HARD
COPY
List of thumbnails
Root folder
SETTING
B0052500
List of filenames
EVENT
AUTO
COPY
List of filenames
List of
thumbnails
9
8
9
Chapter 9 Data Saving and File Operations
(SYSTEM-MEMORY screen)
B0052501
List of
filenames
138
9.2 Formatting SD Memory Cards
9.2
Formatting SD Memory Cards
You will need to use this functionality if the SD memory card being used has not been formatted (initialized). Start the formatting process after inserting the SD memory card you wish to format into the instrument (p.32).
Once formatting is complete, the [PW3198] folder will be automatically created in the root directory (the
uppermost level in the directory structure on the SD memory card).
[SYSTEM]
screen
[LIST]
[FORMAT]
A format confirmation
dialog box will be displayed.
Execute
Cancel
• Formatting erases any data stored on the SD memory card so that it cannot be recovered.
Execute only after confirming that no important files will be lost.
We recommend keeping a backup of any precious data stored on a SD memory card.
• Use the instrument to format cards. Cards formatted on a computer may not use the proper
SD format, resulting in decreased memory card performance.
• The instrument can only store data on memory cards that use the SD format.
139
9.3 Save Operation and File Structure
9.3
Save Operation and File Structure
Save operation
Saving measurement data (p.141)
Saving
method
SD
memory
Data is automatically saved
according to the time control card root
Figure: Time series measurement normal data files
TP0000.ITV
PW3198
B0052500
TP0001.ITV
settings.
TP0204.ITV
• When the file size exceeds 100 MB, the instrument will
create a new file and continue saving data to it.
• The instrument will stop saving data once the SD
memory card is full.
• Up to 204 files can be displayed on the [LIST] screen.
• Up to 100 measurement data files can be created on a
single date.
B0052501
TP0000.ITV
B0052600
TP0001.ITV
Saving screen copies (p.143)
Saving
method
Press the COPY key while
the screen you wish to save
is being displayed.
SD
memory
card root
00000000.BMP
PW3198
HARDCOPY
00000001.BMP
00000102.BMP
• Up to 102 files can be displayed on the [HARDCOPY]
screen.
Saving settings data (p.144)
Saving
method
Move to the folder in which SD
you wish to save the data on memory
the SD memory card screen
card root
and press the F2 key.
00000000.SET
PW3198
SETTING
00000001.SET
00000102.SET
• Up to 102 files can be displayed on the [SETTING]
screen.
9
8
9
Chapter 9 Data Saving and File Operations
(SYSTEM-MEMORY screen)
140
9.3 Save Operation and File Structure
File structure (overall)
SD
PW3198
HARD
COPY
Folder for saving
screen copy data
files
Folder naming conventions
(Example: The first set of binary data recorded on May 25, 2010)
B: “B” for “binary”
SETTING
0: Last digit of year
05: Month
25: Day
File for saving
settings data files 00: Consecutive data number for that day
B0052500
Folder for
saving data
EV000001.EVT
(Event data)
TR000001.TRN
(Transient waveform file)
HH000001.HHC
(High-order harmonic waveform file)
000001.WDU
(Fluctuation data file)
EV000002.EVT
HH000002.HHC
000002.WDU
.
.
.
EVENT
Folder for
saving events
AUTO
COPY
Folder for
automatically
saving screen data
B0052501
Folder for
saving data
AT000000.BMP
AT000001.BMP
AT000002.BMP
.
.
.
This folder is not
created if the
screen copy interval is set to
OFF.
PW3198.SET
TP000.ITV
FL000.FLC
.
.
.
Settings data file at the start of time series
measurement
Time series measurement normal binary data*
Time series measurement flicker data*
Time series
data files
*: When the file size exceeds 100 MB, the instrument will create a new file and continue
saving data to it. Numbers are assigned automatically, as for TP0001.ITV.
141
9.4 Saving and Deleting Measurement Data
9.4
Saving and Deleting Measurement Data
Saving data
Characteristics selected with the [Recording Items] setting are all automatically saved to the SD memory
card in the binary format. Up to 100 measurement data files can be created on a single date.
If an SD memory card is not inserted into the instrument, measurement data will not be
saved.
Save
procedure
1.
Set the recorded items and TIMEPLOT interval.
2.
Set the recording start time and end time (as necessary).
3.
(See "Recording Items" (p.62), "TIME PLOT Interval" (p.63))
(See "Time Start" (p.58))
Press the
key to start recording.
(To cancel recording, press the
key again.)
(A folder will be automatically created, and the data will be stored there. See 9.3 (p.139).)
Save
destination:
SD memory card
File names:
Filenames are automatically created based on the start time and date and given an extension of
“ITV” (time series measurement normal binary data) or “FLC” (time series measurement flicker
data). Numbering starts at 0000 and goes to 9999.
Example: TP0000.ITV (the first set of time series measurement normal binary data saved in the folder)
Remaining storage time
The remaining storage time on the SD memory card being used is displayed when setting the recorded items
and TIMEPLOT interval. The time is calculated and displayed based on the SD memory card’s storage capacity,
the number of items being recorded, and the TIMEPOT interval time. This calculation does not take event data
into account, so the recording time may vary significantly with the number of events.
Recording times for (reference value) a Z4001 SD Memory Card 2GB
(Repeat Record: 1 Week, Repeat Number: 55 times)
Recording parameter setting
ALL DATA
(Saves all data)
P&Harm (Saves RMS values
and harmonics)
Power (Saves RMS
values only)
1sec
16.9 hours
23.6 hours
11.5 days
3sec
2.1days
3.0 days
34.6 days
15sec
10.6 days
14.8 days
24 weeks
30sec
21.1days
29.5 days
49 weeks
1min
42.2 days
8.4 weeks
55 weeks
5min
30.1 weeks
42.1 weeks
55 weeks
10min
55 weeks
55 weeks
55 weeks
15min
55 weeks
55 weeks
55 weeks
30min
55 weeks
55 weeks
55 weeks
1 hour
55 weeks
55 weeks
55 weeks
2 hours
55 weeks
55 weeks
55 weeks
3.0 days
34.6 days
150/180 /1200wave (Approx. 3 sec) 2.1 days
• Recording times do not account for event data and screen copy data. Recording times may be shortened when event data and screen copy data are stored on the card.
• Recording times are not dependent on connections.
• When repeated recording is set to [OFF], the maximum recording time is 35 days.
• When repeated recording is set to [1 Day], the maximum recording time is 55 days.
• When repeated recording is set to [1 Week], the maximum recording time is 55 weeks.
• Harmonics order data is not saved for [Power], but it is saved in THD.
9
8
9
Chapter 9 Data Saving and File Operations
(SYSTEM-MEMORY screen)
TIME PLOT interval
142
9.4 Saving and Deleting Measurement Data
Delete
[SYSTEM] screen
[LIST]
Select the number (No.) you wish
to delete
[DELETE]
A deletion confirmation
dialog box will be displayed.
Execute
Cancel
143
9.5 Saving, Displaying, and Deleting Screen Copies
9.5
Saving, Displaying, and Deleting Screen
Copies
You can save the currently displayed screen as a BMP (256-color) file. The file extension is “.bmp.” If the
instrument is connected to a printer, you can also print screens (in monochrome).
Save
You can save (output) the screen at a given instant to the set SD memory card by pressing the
while the screen you wish to save is displayed.
RS
Connection:
SD memory card or printer
File names:
Auto generated, extension of “.bmp”
00000000.BMP (consecutive numbering in the folder ranges from 00000000 to 99999999)
Example: 00000001.BMP
key
• When saving screen copies to the SD memory card, verify that the [RS-232C] setting on
the [SYSTEM]-DF1 [MAIN]-F2 [HARDWARE] screen is set to [OFF]. (If this parameter
is set to [PRINTER], data will be output to the printer instead of the SD memory card.)
• Up to 102 files can be displayed on the [HARDCOPY] screen.
Displaying and deleting files
[SYSTEM] screen
[HARDCOPY]
Select the file you
wish to display
9
8
9
[VIEW]
The file will be displayed.
(You can also return
with any other key.)
To delete a file:
Select the file you
wish to delete
[DELETE]
A deletion confirmation
dialog box will be displayed.
Execute
Cancel
To view hard copies of screens for which a screen
copy interval was set
Use the cursor keys on the [LIST] screen to move the
cursor to an [AUTO COPY] file to display a thumbnail.
Select the thumbnail whose screen you wish to view
with the cursor keys and press the [VIEW] key to view
hard copies of screens for which a screen copy interval
was set.
Chapter 9 Data Saving and File Operations
(SYSTEM-MEMORY screen)
Return to the list.
144
9.6 Saving and Deleting Settings Files (Settings Data)
9.6
Saving and Deleting Settings Files (Settings
Data)
This section describes how to save the instrument’s current settings.
[SYSTEM] screen
[SETTING]
[SAVE]
The file will be
saved.
To delete a file
Select the number
(No.) you wish to
delete
[DELETE]
A deletion confirmation dialog box will be displayed.
Execute
Cancel
• All filenames are assigned automatically and cannot be changed by the user (for example, 00000000.SET).
See:"9.3 Save Operation and File Structure" (p.139)
• Up to 102 files can be displayed on the [SETTING] screen.
145
9.7 Loading Settings Files (Settings Data)
9.7
Loading Settings Files (Settings Data)
This section describes how to select and load saved settings.
[SYSTEM] screen
[SETTING]
Select the number (No.) you wish
to load.
[LOAD]
9.8
File and Folder Names
The instrument does not allow users to create folders. All folders are created automatically. Additionally, file and folder names cannot be changed.
Changing file and folder names
9
8
9
Chapter 9 Data Saving and File Operations
(SYSTEM-MEMORY screen)
The names of files and folders downloaded to your computer can be changed. Names can be up to 8
characters long. Settings files should be placed in the [SETTING] folder, and screen copy files should be
placed in the [HARDCOPY] folder. Filenames containing characters other than letters and numbers may
not be properly displayed by the instrument.
146
9.8 File and Folder Names
147
10.1 Computer Application (9624-50) Capabilities
Analyzing Data Using the
Computer Application
(9624-50)
Chapter 10
10.1 Computer Application (9624-50) Capabilities
Display and Analyze Measurement Data
Analyze measurement data in greater
detail using the same display as the
PW3198. You can also display and compare multiple graphs.
Print Displayed Windows and
Copying
Print and copy displayed windows for
use in other applications.
Display Measurement and Calculation Values (Maximum, Minimum
and Average)
Generate Measurement Data
Reports
Print any measurement as a report.
You can also save it as a rich text format
file, and use it in other applications.
Convert Measurement Data to
CSV Format
Convert any span of measurement data
to CSV format. Load converted files into
computer spreadsheet programs.
Use the A/B cursors to view maximum,
minimum and average values within any
time span.
Chapter 10 Analyzing Data Using the Computer
The Hioki 9624-50 PQA-HiView Pro is a software application for analyzing binary-format measurement data from the PW3198 on a computer. The 9624-50 can load and read only binary data
recorded with the Hioki PW3198. It cannot read text or CSV data.
10
Calculate Demand and Integral
Power Hioki PW3198
Download measurement data
from the PW3198
From the measurement data, calculate
maximum and average demand values,
and integral power.
Connect the Hioki PW3198 to a computer via LAN to download data from its internal memory and data files from the
PW3198's SD memory card.
Display measurement data in
EN50160 mode
Judge anomalies according to
the ITIC (CBEMA) Curve*
* Commonly used in the USA, the ITIC
Curve is a standard for evaluating voltage anomalies by specifying a range of
acceptable tolerance. A "User-Defined
Curve" can be optionally defined for
voltage anomaly evaluation.
You must use version 2.00 or higher of the 9624-50 application. An upgrade is available
(for a fee) to users of versions prior to 2.00.
148
10.2 Downloading Data from the SD Memory Card
10.2 Downloading Data from the SD Memory Card
Measurement data saved on the SD memory card can be downloaded to a computer using an SD memory card reader or via the instrument’s LAN and USB functions.
See: Connection method: "12.1 Downloading Measurement Data Using the USB Interface" (p.156),
"Connecting the Instrument to a Computer with an Ethernet ("LAN") Cable" (p.161)
See: More detailed information: See the 9624-50 PQA-HiView Pro Instruction Manual.
Data cannot be written from a connected computer to the SD memory card via a USB connection.
149
11.1 Using the External Control Terminal
Connecting
External
Devices
Chapter 11
11.1 Using the External Control Terminal
You can enter events and output event occurrence times with the external control terminals.
Trigger input terminal
Event input terminal (EVENT IN)
Synchronized with an external device,
analyzes anomalies.
When you connect the search signal of an
anomaly search device such as an overcurrent relay to the event input terminal,
you can analyze anomalies using
this device according to anomaly operations.
See: "Using the event input terminal (EVENT IN)"
(p.151)
HIOKI
Memory HiCorder
Event output terminal (EVENT OUT)
This informs an external device when
anomalies occur within the 3196.
When you connect the event output terminal to a trigger input terminal on a
waveform recording device such as the
HIOKI Memory HiCorder, you can record
waveforms on the Memory HiCorder
when events occur.
See: "Using the event input terminal (EVENT
OUT)" (p.152)
To avoid damaging this device, do not input voltages outside the ranges
-0.5 V to +6.0 V (EVENT IN) or -0.5 to +6.0 V (EVENT OUT) to the external control terminals.
When using the external control terminals, to use the external event
function, set the external event to ON. (SYSTEM-DF3 [POWER/etc]-[External
Event: ON])
See: "Generating events using an external input signal (external event settings)" (p.71)
Chapter 11 Connecting External
Anomaly
search device
11
150
11.1 Using the External Control Terminal
Connecting to the External Control Terminal
Be sure to read "Before Connecting Measurement Cables" (p.8) before
attempting to connect the instrument to a computer.
To avoid electric shocks, use the specified material only.
Items to connect (required items):
Electric wires that conform with: single line: φ0.65 mm (AWG22)
twisted wire: 0.32 mm2 (AWG22)
diameter of search wire: φ0.12 mm or more
Supported electric wires
single line: φ0.32 mm to φ0.65 mm (AWG28 to AWG22)
twisted wire: 0.08 mm2 to 0.32 mm2 (AWG28 to AWG22)
diameter of search wire:φ0.12 mm or more
Standard direction wire length
: 9 to 10 mm
Tools that conform to button operations : flat head screwdriver (diameter: 3 mm, width of bladetip: 2.6 mm)
1
3
1 Press down on the terminal button using a tool,
such as a flat head screwdriver.
2
2 While the button is depressed, insert the wire
into the electric wire connection hole.
3 Release the button.
The electric wire is locked in place.
151
11.1 Using the External Control Terminal
Using the event input terminal (EVENT IN)
By inputting a signal to the event input terminal externally, you can make the PW3198 determine that an
external event has occurred when that event was input. Similar to other events, you can record the voltage and current waveforms, and the measurement values of external events.
Using this device, you can analyze power anomalies that occur in other electrical equipment.
To avoid damaging this device, do not input voltages outside the range 0.5 V to +6.0 V to the external control terminals.
Signal input methods
Short-circuit the terminal or input a pulse signal.
Use the event input terminal (EVENT IN) and the ground terminal (GND).
You can control the event input terminal by short-circuiting the terminal (active LOW) or dropping the
pulse signal (1.0 V).
Input voltage range
HIGH level : 3.0 to 5.0 V
LOW level : 0 to 0.8 V
Maximum input voltage
-0.5 to +6.0 V
170 ms or more
Chapter 11 Connecting External
30ms or more
11
152
11.1 Using the External Control Terminal
Using the event input terminal (EVENT OUT)
This indicates events occurring externally that were synchronized with events occurring internally for this
device.
Usage method 1. Connect a warning device.
This is a good way to output warnings when events such an interruptions occur.
Usage method 2. Connect to the trigger input terminal of a Memory HiCorder.
This allows you to record waveforms on the Memory HiCorder when events occur on the PW3198.
You can record between 14 and 16 waveforms on the 3196 when events occur. When you want to record
waveforms for a longer period of time, use the 3196 in parallel with a Memory HiCorder.
To avoid damaging this device, do not input voltages outside the -0.5 V to +6.0 V
range to the external control terminal.
Signal output method
If an event occurs in the PW3198, a pulse signal is output.
Use the event output terminal (EVENT OUT) and the ground terminal (GND).
Output signal
Open collector output (includes voltage output)
Active LOW
Output
voltage range
HIGH level: 4.5 to 5.0 V
LOW level: 0 to 0.5 V
Pulse width
LOW level: longer than 10 ms
Maximum input
voltage
-0.5 V to +6.0 V
10ms or more
(with the short pulse setting)
153
11.1 Using the External Control Terminal
Event output can be set for ENKAKU.
By setting the [External Out] setting to [Long Pulse], the instrument can be configured to generate
event output for the 2300 ENKAKU and similar hardware.
[SYSTEM]
screen
[MAIN]
[HARDWARE]
[External Out]
Display the
pull-down menu
Select
[LongPulse]
Accept the
setting
Cancel
Chapter 11 Connecting External
• When the START event occurs, no pulse signal (Low pulse) is output from the event output terminal.
• The pulse signal from the event output terminal is held Low for about 2.5 seconds. When
events occur continuously (but for not more than 2.5 seconds each), the signal goes Low
at the first event, and remains Low until about 1.5 seconds after the last event occurs.
11
154
11.1 Using the External Control Terminal
155
Operation with a
Computer
Chapter 12
The instrument includes standard USB and Ethernet interfaces to connect a computer for remote
control.
The instrument can be controlled by communication commands, and measurement data can be
transferred to the computer using the dedicated application program.
USB Connection Capabilities
• Measurement data can be transferred to a computer using the dedicated application (optional 9624-50
PQA-HiView Pro). (When the instrument is connected to a host controller, typically a computer, with a
USB cable, the SD memory card in the instrument will be recognized as a removable disk.)
• Control the instrument remotely by internet browser.(p.162)
• Control the instrument remotely using the dedicated application program (optional 9624-50 PQA-HiView Pro) to transfer measurement data to the computer.
Chapter 12 Operation with a Computer
Ethernet ("LAN") Connection Capabilities
8
12
156
12.1 Downloading Measurement Data Using the USB Interface
12.1 Downloading Measurement Data Using the
USB Interface
Since the instrument includes a standard USB interface, measurement data can be transferred to a USBconnected computer (using the instrument’s mass storage function).
Connect the instrument to the computer with a USB cable. No instrument settings are necessary to establish the USB connection.
USB port
USB port on computer
USB cable
(supplied with the instrument)
A message such as the following is displayed on the instrument when it is connected to a computer:
Accessing USB storage.
To stop, hit ESC.
STOP: ESC
• To avoid faults, do not disconnect or reconnect the USB cable during instrument
operation.
• Connect the instrument and the computer to a common earth ground. Using different
grounds could result in potential difference between the instrument and the computer.
Potential difference on the USB cable can result in malfunctions and faults.
If both the instrument and computer are turned off the power while connected by the
USB cable, turn on the power of the computer first. It is not able to communicate if the
instrument is turned on the power first.
After Connecting
Use the following procedure when disconnecting a USB cable connected to the instrument from the computer:
1. Press the ESC key to terminate the USB connection. Alternately, you can use the computer’s “Safely
Remove Hardware” icon to end the connection.
2. Disconnect the USB cable from the computer.
The transferred data can be analyzed using the 9624-50 PQA-HiView Pro application. Files other than
screen copies cannot be opened directly.
157
12.2 Control and Measurement via Ethernet ("LAN") Interface
12.2 Control and Measurement via Ethernet
("LAN") Interface
Measured data can be transferred to a computer remotely using an Internet browser or with a dedicated application (optional 9624-50 PQA-HiView Pro).
Ethernet Interface Jack
To computer’s LAN
interface
LAN cable
(The figure shows the 9642 LAN Cable [option].)
Example of remote operation using wireless LAN
Wi-Fi
Chapter 12 Operation with a Computer
Computer
8
Wireless LAN router
PDA
Tablet
computer
Configure the instruments LAN settings for the network environment, and connect the instrument
to a computer with the Ethernet cable.
When using a wireless LAN router
The instrument does not support network environments where an IP address is automatically acquired
using DHCP. Configure the router to assign a fixed IP address to the PW3198. For more information
about router settings, see the instruction manual for your wireless LAN router.
For more information about how to use the dedicated application (optional 9624-50 PQA-HiView Pro), please see the included Instruction Manual.
12
158
12.2 Control and Measurement via Ethernet ("LAN") Interface
LAN Settings and Network Environment Configuration
Configure the Instruments LAN Settings
• Make these settings before connecting to a network. Changing settings while connected
can duplicate IP addresses of other network devices, and incorrect address information
may otherwise be presented to the network.
• The instrument does not support DHCP (automatic IP address assignment) on a network.
[SYSTEM]
screen
[MAIN]
[HARDWARE]
Select a setting
Select value to
change
Select field
Increase or
decrease value
Accept the setting
Reboot the instrument when changing the network
settings.
Cancel
Setting Items
IP Address
Identifies each device connected on a network.
Each network device must be set to a unique address.
The instrument supports IP version 4, with IP addresses indicated as four decimal octets, e.g., "192.168.0.1".
Subnet Mask
This setting is used to distinguish the address of the network from the addresses
of individual network devices.
The normal value for this setting is the four decimal octets "255.255.255.0".
Default
Gateway
When the computer and instrument are on different but overlapping networks
(subnets), this IP address specifies the device to serve as the gateway between
the networks.
If the computer and instrument are connected one-to-one, no gateway is used,
and the instrument's default setting "0.0.0.0" can be kept as is.
159
12.2 Control and Measurement via Ethernet ("LAN") Interface
Network Environment Configuration
Example 1. Connecting the instrument to an existing network
To connect to an existing network, the network system administrator (IT department) has to assign settings beforehand.
Some network device settings must not be duplicated.
Obtain the administrator's assignments for the following items, and write them down.
IP Address___.___.___.___
Subnet Mask___.___.___.___
Default Gateway___.___.___.___
Example 2. Connecting multiple instruments to a single computer using a hub
When building a local network with no outside connection, the following private IP addresses are recommended.
Configure the network using addresses 192.168.1.0 to 192.168.1.24
IP Address
: Computer : 192.168.1.1
: PW3198 : assign to each instrument in order 192.168.1.2, 192.168.1.3,
192.168.1.4, ...
: 255.255.255.0
Subnet Mask
Default Gateway: Computer : ___.___.___.___
: PW3198 : 0.0.0.0
The 9642 LAN Cable can be used with its supplied connection adapter to connect one instrument to
one computer, in which case the IP address is freely settable. Use the recommended private IP
addresses.
IP Address
: Computer : 192.168.1.1
: PW3198 : 192.168.1.2 (Set to a different IP address than the computer.)
Subnet Mask
: 255.255.255.0
Default Gateway: Computer : ___.___.___.___
: PW3198 : 0.0.0.0
Chapter 12 Operation with a Computer
Example 3. Connecting one instrument to a single computer using the 9642
LAN Cable
8
12
160
12.2 Control and Measurement via Ethernet ("LAN") Interface
Instrument Connection
Connect the instrument to the computer using an Ethernet LAN cable.
Required items:
When connecting the instrument to an existing network
(prepare any of the following):
• Straight-through Cat 5, 100BASE-TX-compliant Ethernet cable (up to 100 m, commercially available).
For 10BASE communication, a 10BASE-T-compliant cable may also be used.
• Hioki 9642 LAN Cable (option)
When connecting one instrument to a single computer
(prepare any of the following):
• 100BASE-TX-compliant cross-over cable (up to 100 m)
• 100BASE-TX-compliant straight-through cable with cross-over adapter (up to 100 m)
• Hioki 9642 LAN Cable (option)
Instrument Ethernet ("LAN") interface
The Ethernet interface jack is on the right side.
Ethernet Interface Jack
The RX/TX LED blinks when sending and
receiving data, and the LINK LED lights
when linked to the destination network
device.
RX/TX LED
LINK LED
161
12.2 Control and Measurement via Ethernet ("LAN") Interface
Connecting the Instrument to a Computer with an Ethernet ("LAN")
Cable
Connect by the following procedure.
When connecting the instrument to an existing network
(connect the instrument to a hub)
1 Connect to the Ethernet jack on the instrument.
2 Connect to a 100BASE-TX hub.
When connecting the instrument to a single computer
(connect the instrument to the computer)
Use the Hioki 9642 LAN Cable and cross-over adapter (9642 accessory)
Ethernet
Interface Jack
Cross-conversion
cable
conversion cable’s connector.
connector to the instrument’s
LAN interface.
3 Connect the other end of the Ethernet cable to the 100BASE-TX Ethernet jack on the computer.
The icon display varies with the state of the LAN connection as follows:
HTTP server and data download connection
Data download connection
HTTP server connection
LAN icon
Chapter 12 Operation with a Computer
2 Connect the cross-conversion
1 Connect the LAN cable to the cross-
8
12
162
12.3 Remote Control of the Instrument by Internet Browser
12.3 Remote Control of the Instrument by Internet Browser
The instrument includes a standard HTTP server function that supports remote control by an internet
browser on a computer.
The instrument's display screen and control panel keys are emulated in the browser. Operating procedures are the same as on the instrument.
• It is recommended to use either Microsoft Internet Explorer version 8 or later or Apple
Safari version 5.0 or later.
• Only one computer can be connected at a time.
• Set the browser security level to “Medium” or “Medium-high,” or enable Active Scripting
settings.
• Unintended operations may occur if remote control is attempted from multiple computers
simultaneously. Use one computer at a time for remote control.
• Remote control can be performed even if the instrument's key lock is active.
Connecting to the Instrument
Launch Internet Explorer (afterwards called IE), and enter "http://" followed by the IP address assigned to
the instrument in the browser's address bar.
For example, if the instrument's IP address is 172.19.112.160, enter as follows.
Enter "http://IP Address/".
A main page such as the following will be displayed when the browser has successfully connected to the
instrument:
If no HTTP screen is displayed
1. Perform this procedure.
(1) Click [Tools]-[Internet Options] to display IE settings.
(2) On the [Advanced] tab, under HTTP 1.1 settings, enable [Use HTTP1.1] and disable [Use
HTTP1.1 through proxy connections].
(3) On the [Connections] tab, click [LAN Settings], and disable [Use a proxy server].
2. LAN communications may not be possible.
(1) Check the network settings on the instrument and the IP address of the computer.
See: "LAN Settings and Network Environment Configuration" (p.158)
(2) Check that the LINK LED in the Ethernet internet jack is lit, and that
displayed on the instrument's screen.
See: "Instrument Connection" (p.160)
(the LAN indicator) is
163
12.3 Remote Control of the Instrument by Internet Browser
Operating Procedure
Click the [Remote Control Screen] link to jump to the Remote Control page.
Click
If a password has been set, the following page will be displayed:
Input
Enter the password and click the [SET] button to display the control panel in the browser window. (If no
password has been set or the password has been set to “0000” [four zeroes], this screen will not be displayed. The default password setting is “0000.”)
Setting a password
You can restrict remote operation by setting a password.
Chapter 12 Operation with a Computer
1. Click [Password Setting] on the main page. (The following page will be displayed.)
8
2. Enter the [Old Password], [New Password], and [Confirm New Password] fields and click
the [SET] button. (Enter up to four English letters. If setting a password for the first time, enter
“0000” (four zeroes) as the [Old Password]. If changing a previously set password, enter the
previously set password.)
The new password will become effective immediately.
If you forget your password
Triggering a boot key reset* on the instrument will cause the password to be reset to its default
value of “0000.” The password cannot be initialized by means of remote operation.
*: The boot key reset will cause the instrument’s settings to be reverted to their default values. You
can revert all settings, including language and communications settings, to their default values
by turning on the instrument while holding down the ENTER or ESC key.
12
164
12.4 Converting Binary Data to Text Data
Instrument screen emulation
Control panel emulation
Auto display update
Click on the control panel keys to perform the same operations as the instrument keys.
To enable automatic browser screen updating, set the Update Time in the Auto Update menu
Auto display
update
The instrument screen emulation updates at the specified interval.
Setting Contents:( ∗ : Default setting)
OFF∗, 0.5/ 1/ 2/ 5/ 10 sec
If the instrument does not accept key input
Is the browser's security level set to “High”, or has JavaScript been disabled?
Change the browser's security setting to Medium or Medium-high.
The displayed information may vary with the browser being used.
12.4 Converting Binary Data to Text Data
The optional 9624-50 PQA-HiView Pro application can be used to convert binary data to text data.
For more information, see the 9624-50 instruction manual.
165
13.1 Environmental Safety Specifications
Chapter 13
13.1 Environmental Safety Specifications
Operating environment
Indoors, altitude up to 3,000 m (measurement category is lowered to 600 V Cat III when above 2,000
m), Pollution degree 2
Storage temperature and humidity -20 to 50°C (-4 to 122°F) 80% RH or less (non-condensating)
(If the instrument will not be used for an extended period of time, remove the battery pack and store
in a cool location [from -20 to 30°C (-4 to 86°F)].)
Chapter 13 Specifications
Specifications
13
Operating temperature and humidity 0 to 50°C (32 to 122°F) 80% RH or less (non-condensating)
Dust and water resistance
IP30 (EN60529)
Applicable standards
Safety EN61010
EMC EN61326 Class A, EN61000-3-2, EN61000-3-3
Maximum input voltage
Voltage input section 1000 VAC, DC±600 V, max. peak voltage ±6000 Vpk
Current input section 3 VAC, DC±4.24 V
Maximum rated voltage to earth
Voltage input terminal 600 V (Measurement Categories IV, anticipated transient overvoltage 8000 V)
Dielectric strength
6.88 kVrms (@50/60 Hz, 1 mA sense current)
Between voltage measurement jacks (U1 to U3) and voltage measurement jacks (U4)
4.30 kVrms (1 mA@50/60 Hz, 1 mA sense current)
Between voltage input terminal (U1 to U3) and current input terminals/interfaces
Between voltage (U4) and current measurement jacks, and interface jacks
13.2 General Specifications
Input Specifications
Measurement line type
One single-phase 2-wire (1P2W), single-phase 3-wire (1P3W), three-phase 3-wire
(3P3W2M,3P4W2.5E) or three-phase 4-wire (3P4W) plus one extra input channel
(must be synchronized to reference channel during AC/DC measurement)
Number of input channels
Voltage: 4 channels U1 to U4
Current: 4 channels I1 to I4
Input methods
Voltage: Isolated and differential inputs (Between U1,U2 and U3: channels not isolated, Between U1
to U3 and U4: channels isolated)
Current: Insulated clamp sensors (voltage output)
Measurement ranges
Voltage measurement: 600.00 V; transient measurement: 6000 Vpk
Current measurement: Using clamp sensors (×10, ×5, ×1 range, max. 2 ranges)
Note: Only CH4 can be configured separately.
Crest factor
Voltage measurement: 2 (in 600 V range); transient overvoltage measurement: 1 (in 6,000 Vpk
range); current measurement: 4 (with f.s. input)
Measurement method
Simultaneous digital sampling of voltage and current,
Sampling frequency
RMS voltage and current, active power, etc. : 200 kHz
Transient overvoltage measurement
: 2 MHz
Harmonic/inter-harmonic analysis
: 4,096 points, 10/12 cycles (50/60 Hz) or 4096 points,
80 cycles (400 Hz)
A/D converter resolution
RMS voltage and current: 16bit; transient overvoltage measurement: 12bit
Compatible clamp sensors
Units with f.s. = 0.5 V output at rated current input (f.s.=0.5 V recommended)
Units with rate of 0.1 mV/A, 1 mV/A, 10 mV/A, or 100 mV/A
10
166
13.2 General Specifications
Basic Specifications
Backup lithium battery life
Clock and settings (Lithium battery), Approx. 10 years @23°C (@73.4°F)
Real-Time Clock function
Auto-calendar, leap-year correcting 24-hour clock
Real-time clock accuracy
±0.3 s per day (instrument on, 23°C±5°C (73°F±9°F)
±1 s per day (instrument on, within operating temperature and humidity range)
±3 s per day (instrument off, @23°C (@73.4°F))
Memory data capacity
SD memory card/ SDHC memory card 2G to 32GB
Maximum recording period
55 weeks (with repeated recording settings of [1 Week], 55 iterations)
55 days (with repeated recording settings of [1 Day], 55 iterations)
35 days (with repeated recording settings of [OFF])
Maximum recordable events
55000 events (with repeated recording on)
1000 events (with repeated recording off)
Power supply
Z1002 AC Adapter (12 VDC)
Rated supply voltage
Recharge function
The battery pack charges regardless of whether the instrument is on or off.
Charge time: Max. 5 hr. 30 min. @23°C (@73.4°F)
Charging temperature range: 10°C to 35°C (50°F to 95°F)
Maximum rated power
35 VA (when charging)
15 VA (when not charging)
: 100 VAC to 240 VAC (Voltage fluctuations of ±10% from the rated
supply voltage are taken into account.)
Rated power supply frequency : 50/60 Hz, maximum rated current:1.7 A, anticipated transient
overvoltage 2500 V
Anticipated transient overvoltage: 2500 V
Z1003 Battery Pack (Ni-MH 7.2VDC 4500 mAh)
Continuous battery operation time Approx. 180 min. (@23°C (@73.4°F), when using Z1003 Battery Pack)
Dimensions
Approx. 300 W× 211 H × 68 D mm (11.81" W × 8.31" H × 2.68" D) (excluding protrusions)
Mass
Approx. 2.2 kg (77.6 oz.) (excluding battery pack)
Mass of battery pack: Approx. 365 g (12.9 oz.)
Power supply quality
measurement method
IEEE1159, IEC61000-4-30Ed2:2008
Display specifications
Display
6.5-inch TFT color LCD (640×480 dots)
Display defects: 5 or fewer dead pixels, 1 or fewer bright pixels
External Interface Specifications
(1) SD card Interface
Slot
SD standard compliant × 1
Compatible card
SD memory card/ SDHC memory card
Supported memory capacity
SD memory card: Up to 2GB, SDHC memory card: Up to 32GB
Functions
Saving of binary data (settings data) (up to 9,999 files)
Up to 100 files of measurement data can be saved on the same date.
Saving of settings files (up to 102 files)
Loading of settings files (up to 102 files)
Saving of screen copies (up to 99,999,999 files)
Loading of screen copies
Formatting of SD memory cards
Deleting of files
Media full processing
Saving of data to SD memory card is stopped (time series data is stored on a first-in, first-out basis.)
(2) RS-232C Interface
Connector
D-sub9 pin ×1
Method
RS-232C “EIA RS-232D”, “CCITT V.24”, “JIS XS101” compliant
Connection destination
Printer, GPS box (cannot be connected to computer)
Functions
Printer : Printing of screen copies
GPS : Measurement and control using GPS-synchronized time
(3) LAN Interface
Connector
RJ-45 × 1
Electrical specifications
IEEE 802.3-compliant Ethernet
Transmission method
10BASE-T/ 100BASE-TX
Protocol
TCP/IP
167
13.2 General Specifications
(3) LAN Interface
Functions
(4) USB-F Interface
Connector
Series B receptacle × 1
Method
USB 2.0 (full-speed, high-speed), mass storage class
Connection destination
Computer (Windows2000/WindowsXP/WindowsVista(32bit)/Windows7 (32/64bit))
Functions
1. Recognition of the SD memory card as a removable disk when connected to a computer
The instrument cannot be connected during recording (including standby operation) or analysis.
2. Downloading of data from the SD memory card using the 9624-50 PQA-HiView Pro
The instrument cannot be connected during recording (including standby operation) or analysis.
(5) External control interface
Connector
4-pin screwless terminal block × 1
External event input: EVENT IN terminal × 1
External event output and V10 alarm: EVENT OUT terminal × 1, GND terminal × 2
External event input
External event input at TTL low level (at falling edge of 1.0 V or less and when shorted) between
GND terminal and EVENT IN terminal
Min. pulse width: 30 ms; rated voltage: -0.5 V to +6.0 V
External event output
External event output item setting Operation
Short pulse output
TTL low output at event generation between [GND] terminal and [EVENT OUT] terminal
Long pulse output
TTL low output at event generation between [GND] terminal and [EVNET OUT] terminal
No external event output at START event
ΔV10 alarm
TTL low output at ΔV10 alarm between [GND] terminal
and [EVENT OUT] terminal
13
Chapter 13 Specifications
1. HTTP server function (compatible software: Internet Explorer Ver.6 or later
Remote operation application function, measurement start and stop control functions, system
configuration function, event list function (capable of displaying event waveforms, event vectors,
and event harmonic bar graphs)
2. Downloading of data from the SD memory card using the 9624-50 PQA-HiView Pro
Pulse width
Low level for 10
ms or more
Low level for approx. 2.5 s
Low level while
alarm occurring;
reverts to high at
data reset
Rated voltage -0.5 V to +6.0 V
Accessories and Options Specifications
Accessories
• Instruction manual ......................................................................................................... 1
• Measurement guide ....................................................................................................... 1
• L1000 Voltage Cord ....................................................................................................... 1
(8 cords, approx. 3 m each: 1 each red, yellow, blue, and gray as well as 4 black;
8 alligator clips: 1 each red, yellow, blue, and gray as well as 4 black)
• Spiral Tube...................................................................................................................20
• Input Cable Labels ......................................................................................................... 1
(For identifying channel of voltage cords and clamp sensors)
• Z1002 AC Adapter ......................................................................................................... 1
• Strap .............................................................................................................................. 1
• USB cable ...................................................................................................................... 1
(CSK00027*K0080 Approx. 1 m in length)
• Z1003 Battery Pack ....................................................................................................... 1
(Ni-MH, 7.2 V/4500 mAh)
• Z4001 SD memory card 2GB............................................................................ 1
Current measurement options
9660 Clamp-On Sensor (100 Arms rating)
9661 Clamp-On Sensor (500 Arms rating)
9667 Flexible Clamp-On Sensor (5000 Arms/500 Arms rating)
9669 Clamp-On Sensor (1000 Arms rating)
9694 Clamp-On Sensor (5 Arms rating)
9695-02 Clamp-On Sensor (50 Arms rating)
9695-03 Clamp-On Sensor (100 Arms rating)
9290-10 Clamp-On Adapter
9219 Connection Cable (for Model 9695-02/9695-03)
9657-10 Clamp-On Leak Sensor (10 Arms rating)
9675 Clamp-On Leak Sensor (10 Arms rating)
Voltage measurement options
Voltage Cord Leads (banana male-to-male with dolphin clip, one each red and black, about 3m long)
9804-01 Magnetic Adapter (1 red)
9804-02 Magnetic Adapter (1 Black)
9243 Grabber Clip (1 each red and black)
10
168
13.2 General Specifications
Accessories and Options Specifications
Printer options
(Not applicable to CE Marking)
9670 Printer (BL-100W made by SANEI ELECTRIC INC.)
9671 AC Adapter (for Model 9670)
9672 Battery Pack (for Model 9670)
9673 Battery Charger (for Model 9672)
9638 RS-232C Cable (for Printer)
9237 Recording Paper (80 mm - 25 m, 4 rolls)
Computer connection options
9642 LAN Cable
9624-50 PQA-HiView Pro (PC application software ver. 2.00 or later)
Other options
Z1002 AC Adapter
Z1003 Battery Pack
Z4001 SD memory card 2GB
C1001 Carrying Case (soft type)
C1002 Carrying Case (hard type)
PW9000 Wiring Adapter (for three-phase 3-wire (3P3W3M) voltage)
PW9001 Wiring Adapter (for three-phase 4-wire voltage)
PW9005 GPS Box (assembled after receiving the order)
169
13.3 Measurement Specifications
13
13.3 Measurement Specifications
(1) Items detected at 2 MHz sampling without a gap
Measurement items
Notation
1P2W
1P3W
3P3W2M
3P3W3M
3P4W
3P4W2.5E
Transient overvoltage
Tran
1,4
1,2,4
1,2,4
1,2,3,4
1,2,3,4
1,3,4
MAX/MIN/AVG
(2) Items measured without gaps for each waveform
Measurement
items
Notation
1P2W
1P3W
3P3W2M
3P3W3M
3P4W
3P4W2.5E
MAX/MIN/AVG
Frequency
cycle
Freq_wav
U1
U1
U1
U1
U1
U1
**
Chapter 13 Specifications
Measurement items
(3) Items measured without gaps with 1 overlapping waveform every half-cycle
(When measuring at 400 Hz, items measured in a wave without gaps)
Measurement items Notation
1P2W
1P3W
3P3W2M
Note1
3P3W3M
3P4W
3P4W2.5E
MAX/MIN/AVG
1,2,3,4
1,2,3,4
1,2,3,4
**
RMS voltage refreshed Urms1/2
each half-cycle
1,4
1,2,4
1,2,3,4
Swell
Swell
1
1,2
1,2
1,2,3
1,2,3
1,2,3
Dip
Dip
1
1,2
1,2
1,2,3
1,2,3
1,2,3
Interruption
Intrpt
Instantaneous flicker S(t)
1
1,2
1,2
1,2,3
1,2,3
1,2,3
1
1,2
1,2
1,2,3
1,2,3
1,2,3
**
(4) Items measured without gaps every half-cycle
Measurement items
Notation
RMS current refreshed each Irms1/2
half-cycle (inrush current)
(Irms1/2)
1P2W
1,4
1P3W
3P3W2M
1,2,4
1,2,3,4
Note1
3P3W3M
3P4W
3P4W2.5E
MAX/MIN/AVG
1,2,3,4
1,2,3,4
1,2,3,4
**
(5) Items measured without gaps and aggregated every approx. 200 ms
(about once every 10 cycles at 50 Hz, every 12 cycles at 60 Hz, or every 80 cycles at 400 Hz)
Measurement items
Notation
1P2W
1P3W
3P3W2M
3P3W3M
3P4W
3P4W2.5E
MAX/MIN
/AVG
Frequency
Freq
U1
U1
U1
U1
U1
U1
*
10-sec frequency
Freq10s
U1
U1
U1
U1
U1
U1
*
Voltage Waveform
Peak
Upk+, Upk-
1,4
1,2,4
1,2,4
1,2,3,4
1,2,3,4
1,2,3,4
*
Current Waveform
Peak
Ipk+,Ipk-
1,4
1,2,4
1,2,4
1,2,3,4
1,2,3,4
1,2,3,4
*
rms voltage
(phase/line)
Urms
1,4
1,2,4,AVG 1,2,3,4,
AVG Note1
1,2,3,4,
AVG
1,2,3,4,
AVG
1,2,3,4,
AVG
*
Voltage DC
Udc
4
4
4
4
4
*
rms current
Irms
1,4
1,2,4,AVG 1,2,3,4,
AVG Note1
1,2,3,4,
AVG
1,2,3,4,
AVG
1,2,3,4,
AVG
*
Current DC
Idc
4
4
4
4
4
*
4
4
Active power
P
1
1,2,sum
1,2,sum
1,2,3,sum
1,2,3,sum 1,2,3,sum
Active energy
WP+, WP-
1
sum
sum
sum
sum
*
sum
Apparent power
S
1
1,2,sum
1,2,sum
1,2,3,sum
1,2,3,sum 1,2,3,sum
*
Reactive power
Q
1
1,2,sum
1,2,sum
1,2,3,sum
1,2,3,sum 1,2,3,sum
*
Reactive energy (lag)
(lead)
WQLAG, WQLEAD
1
sum
sum
sum
sum
1
1,2,sum
1,2,sum
1,2,3,sum
1,2,3,sum 1,2,3,sum
Power factor/displace- PF/DPF
ment power factor*2
sum
*
10
170
13.3 Measurement Specifications
(5) Items measured without gaps and aggregated every approx. 200 ms
(about once every 10 cycles at 50 Hz, every 12 cycles at 60 Hz, or every 80 cycles at 400 Hz)
Measurement items
Notation
1P2W
1P3W
3P3W2M
3P3W3M
3P4W
3P4W2.5E
MAX/MIN
/AVG
Zero-phase voltage
Uunb0, Uunb
unbalance factor
Voltage negativephase unbalance factor
-
-
sum
sum
sum
sum
*
Zero-phase current
Iunb0, Iunb
unbalance factor
Current negative-phase
unbalance factor
-
-
sum
sum
sum
sum
*
High-order harmonic
voltage component
UharmH
1,4
1,2,4
1,2,4
1,2,3,4
1,2,3,4
1,2,3,4
*
High-order harmonic
current component
IharmH
1,4
1,2,4
1,2,4
1,2,3,4
1,2,3,4
1,2,3,4
*
Harmonic voltage
(orders 0 to 50)
Uharm
1,4
1,2,4
1,2,4
1,2,3,4
1,2,3,4
1,2,3,4
*
Harmonic current
(0 to 50th)
Iharm
1,4
1,2,4
1,2,4
1,2,3,4
1,2,3,4
1,2,3,4
*
Harmonic power
(0 to 50th)
Pharm
1
1,2,sum
sum
sum
1,2,3,sum 1,2,3,sum
*
Inter-harmonic voltage
(0.5to 49.5th)
Uiharm
1,4
1,2,4
1,2,4
1,2,3,4
1,2,3,4
1,2,3,4
*
Inter-harmonic current
(0.5 to 49.5th)
Iiharm
1,4
1,2,4
1,2,4
1,2,3,4
1,2,3,4
1,2,3,4
*
Harmonic voltage
phase angle
(1 to 50th)
Uphase
1,4
1,2,4
1,2,4
1,2,3,4
1,2,3,4
1,2,3,4
Harmonic current
phase angle
(1 to 50th)
Iphase
1,4
1,2,4
1,2,4
1,2,3,4
1,2,3,4
1,2,3,4
Harmonic voltage-cur- Pphase
rent phase difference
(1to 50th)
1
1,2,sum
sum
sum
1,2,3,sum 1,2,3,sum
*
Total harmonic voltage Uthd-F/Uthd-R
distortion factor Note2
1,4
1,2,4
1,2,4
1,2,3,4
1,2,3,4
1,2,3,4
*
Total harmonic current Ithd-F/Ithd-R
distortion factor Note2
1,4
1,2,4
1,2,4
1,2,3,4
1,2,3,4
1,2,3,4
*
K factor
KF
1,4
1,2,4
1,2,4
1,2,3,4
1,2,3,4
1,2,3,4
*
Voltage waveform
comparison
Wave
1
1,2
1,2
1,2,3
1,2,3
1,2,3
Note 1: All CH4 displays turn ON when CH4 is set to AC+DC or DC.
Note 2: When CH4 is turned OFF, all CH4 display values and waveforms are also turned OFF.
Note 3: Meaning of "*" in the "MAX/MIN/AVG" column
Indicates that maximum, minimum, and average values (all) can be displayed during the MAX/MIN/AVG TIMEPLOT interval.
Note 4: Meaning of "**" in the "MAX/MIN/AVG" column
Indicates that maximum and minimum values (all) can be displayed, regardless of the MAX/MIN/AVG TIMEPLOT interval.
*1: CH3 is calculated but not displayed. It can be output only as binary data.
*2: Select either.
(6) Flicker measurement items:
Measurement items
Notation
1P2W
1P3W
3P3W2M
3P3W3M
3P4W
3P4W
3P4W2.5E
ΔV10 (every minute, 1-hour av- dV10, dV10 AVG,
erage value, 1-hour maximum
dV10max,dV10max4,
value, 1-hour fourth-largest val- dV10 total max
ue, overall maximum value [during measurement period])
1
1,2
1,2
1,2,3
1,2,3
1,2,3
Short interval voltage flicker Pst Pst, Plt
Long interval voltage flicker Plt
1
1,2
1,2
1,2,3
1,2,3
1,2,3
MAX/MIN
/AVG
171
13.3 Measurement Specifications
Conditions of Guaranteed Accuracy
Warm-up time of at least 30 minutes, power factor = 1, common-mode voltage of 0 V, input of at
least 1.666% f.s. to reference channel after zero adjustment
Temperature and humidity for
guaranteed accuracy
23±5°C (73±9°F), 80%RH or less (applies to all specifications unless otherwise noted))
Period of guaranteed accuracy
1 year
Fundamental waveform range
for guaranteed accuracy
When measurement frequency is set to 50 Hz : 40 to 58 Hz
When measurement frequency is set to 60 Hz : 51 to 70 Hz
When measurement frequency is set to 400 Hz: 360 Hz to 440 Hz
Display
Total display area
Voltage : 0.08% to 130% of selected range (display suppressed to zero when less than 0.08% f.s.)
Current : 0.5% to 130% of the range (Display is suppressed to zero when less than 0.5%.)
Power : 0.1% to 130% of the range (Display is suppressed to zero when less than 0.1%.)
Measurement items other than above: 0% to 130% of the range
Effective measuring range
Voltage : 1.666% to 130% of selected AC range (actual input of 10 to 780 V), 0.1666% to 100% of
selected DC range (actual input of 1 to 600 V))
Current : 1% to 110% of the range
Power : 0.15% to 130% of the range (with both voltage and current within valid measurement range)
Note: See separate specifications for harmonic measurement.
13
Chapter 13 Specifications
Conditions of guaranteed
accuracy
Measurement items
There are no accuracy specifications where measurement accuracy is not noted or for 3P3W2M CH3 measured values.
Transient overvoltage (Tran)
Measurement method
Detected from waveform obtained by eliminating the fundamental component (50/60/400 Hz) from
the sampled waveform. Detection occurs once for each fundamental voltage waveform.
Sampling frequency
2 MHz
Displayed item
Transient voltage value
Measurement range, resolution
±6.0000k Vpk
Measurement band
5 kHz (-3dB) to 700 kHz (-3dB), specified at 20 Vrms
Min. detection width
0.5 μs
Measurement accuracy
±5.0% rdg.±1.0%f.s. (specified at 1,000 Vrms/30 Hz and 700 Vrms/100 kHz)
Event threshold
Set as an absolute value relative to the peak value (crest value) of the waveform obtained by eliminating the 6,000.0 V resolution fundamental component
Event IN
First transient overvoltage detected in an approx. 200 ms aggregation interval.The event occurrence time indicates the peak voltage value and transient width when the threshold was exceeded.
Event OUT
Start of approx. 200 aggregation in which no transient overvoltage was detected for any channel
within the first approx. 200 ms aggregation period following the transient event IN state. The transient period (difference between the IN and OUT times) is indicated.
Multiple-phase system treatment
Begins when a transient is detected for any one of the U1 to U4 channels and ends when no transient is detected for any of the channels.
Saved waveforms
Event waveforms, Transient waveforms
Waveforms are saved for 2 ms before and after the position at which the transient overvoltage
waveform was detected for the first transient IN and 2 ms before and after the point at which the
transient maximum voltage waveform was detected between the IN and OUT points.
: Waveform peak value during 4 ms period after elimination of fundamental component
Transient width
: Period during which threshold is exceeded (2 ms max.)
Max. transient voltage value : Max. peak value of waveform obtained by eliminating the fundamental component during the period from transient IN to transient
OUT (leaving channel information)
Transient period
: Period from transient IN to transient OUT
Transient count during period : Number of transients occurring during period from transient IN to
transient OUT (transients occurring across all channels or simultaneously on multiple channels count as 1)
RMS transient
: For testing purposes
10
172
13.3 Measurement Specifications
Frequency cycle (Freq_wav)
Measurement method
Calculated as the reciprocal of the accumulated whole-cycle time during one U1 (reference channel) cycle.
Frequency is given per waveform.
When set to a measurement frequency of 400 Hz, calculated as the reciprocal of the accumulated
whole-cycle time during 8 cycles.
Average frequency is given for 8 waveforms.
Sampling frequency
200 kHz
Displayed item
Worst frequency cycle value between EVENT IN and EVENT OUT (max. deviation).
Measurement range, resolution
When the measurement frequency is set to 50/60 Hz: : 70.000 Hz
When the measurement frequency is set to 400 Hz : 440.00 Hz
Measurement band
When the measurement frequency is set to 50/60 Hz : 40.000 to 70.000 Hz
When the measurement frequency is set to 400 Hz : 360.00 to 440.00 Hz
Measurement accuracy
When the measurement frequency is set to 50/60 Hz:
±0.200 Hz or less (for input from 10% f.s. to 110% f.s.)
When the measurement frequency is set to 400 Hz:
±2.00 Hz or less (for input from 10% f.s. to 110% f.s.)
Event threshold
Specified as deviation of 0.1 to 9.9 Hz in 0.1 Hz increments.
Event IN
±Start time of waveform exceeding threshold
Event OUT
±Start time of waveform returning to (threshold - 0.1 Hz)
Note: Equivalent to 0.1 Hz frequency hysteresis.
Multiple-phase system treatment
None
Saved waveforms
Event waveforms
RMS voltage refreshed each half-cycle (Urms1/2)
Measurement method
True RMS type IEC6100-4-30 compliant
When the measurement frequency is set to 50/60 Hz, RMS voltage values are calculated using
sample data for 1 waveform derived by overlapping the voltage waveform every half-cycle. When
the measurement frequency is set to 400 Hz, the RMS voltage value is calculated for each voltage
waveform. The line voltage is used for 3-phase 3-wire (3P3W3M) connections, while the phase
voltage is used for 3-phase 4-wire connections.
Sampling frequency
200 kHz
Displayed item
RMS voltage refreshed each half-cycle
Measurement range, resolution
600.00 V
Measurement band
See RMS frequency characteristics.
Measurement accuracy
When the measurement frequency is set to 50/60 Hz:
With 1.666% f.s. to 110% f.s. input:
Specified as 0.2% of nominal voltage with a nominal input voltage (Udin) of at least 100 V.
With input outside the range of 1.666% f.s. to 110% f.s. or a nominal input voltage (Udin) of less
than 100 V: 0.2% rdg. 0.08% f.s. to
When the measurement frequency is set to 400 Hz: ±0.4% rdg.±0.50%f.s.
Event threshold
See dips/swells/interruptions.
Event IN
See Dip/ Swell/Interruption
Event OUT
See Dip/ Swell/Interruption
Multiple-phase system treatment
None
Saved waveforms
None
Constraints
With a 400 Hz measurement frequency, measured values recorded on the event voltage fluctuation graph consist of RMS voltage values for each waveform.
173
13.3 Measurement Specifications
RMS current refreshed each half-cycle (Irms1/2)
IEC61000-4-30 compliant
When the measurement frequency is set to 50/60 Hz, the RMS current is calculated using current
waveform data sampled every half-cycle (synchronized to the voltage of the channel in question).
When the measurement frequency is set to 400 Hz, the RMS current is calculated for the current
waveform once each cycle.
Sampling frequency
200 kHz
Displayed item
RMS current refreshed each half-cycle
Measurement range, resolution
Varies with sensor used (see input specifications).
Measurement band
See RMS frequency characteristics.
Measurement accuracy
When the measurement frequency is set to 50/60 Hz: ±0.3% rdg.±0.5%f.s. + clamp sensor accuracy
When the measurement frequency is set to 400 Hz: ±0.4% rdg.±1.0%f.s. +clamp sensor accuracy
Event threshold
See inrush current.
Event IN
See inrush current.
Event OUT
See inrush current.
Multiple-phase system treatment
See inrush current.
Saved waveforms
See inrush current.
Other
Generates events as inrush current.
13
Chapter 13 Specifications
Measurement method
l
Swell (Swell)
Measurement method
IEC61000-4-30 compliant
During 50/60 Hz measurement, a swell is detected when the RMS voltage refreshed each halfcycle exceeds the threshold in the positive direction.
During 400 Hz measurement, a swell is detected when the maximum of 4 RMS voltage values occurring within 10 ms (values calculated for one 400 Hz waveform) exceeds the threshold in the
positive direction.
Sampling frequency
200 kHz
Displayed item
Swell height: Worst value for RMS voltage refreshed each half-cycle [V]
Swell duration: Period from the time a U1 to U3 swell is detected until the reading exceeds the value obtained by subtracting the hysteresis from the threshold in the negative direction
Measurement range, resolution
600.00 V
Measurement band
See RMS frequency characteristics.
Measurement accuracy
Same as for RMS voltage refreshed each half-cycle
Within half a cycle of the start accuracy time, within half a cycle of the end accuracy time (not specified for 400 Hz measurement)
Event threshold
Percentage of the nominal voltage or percentage of the slide reference voltage (user-selectable)
Event IN
Start of the waveform for which the RMS voltage refreshed each half-cycle exceeded the threshold
in the positive direction
Event OUT
Start of the waveform for which the RMS voltage refreshed each half-cycle exceeded the value
obtained by subtracting the hysteresis from the threshold in the negative direction
Multiple-phase system treatment
Starts when any of the U1 to U3 channels experiences a swell and ends when the swell has ended
for all channels.
Saved waveforms
Event waveforms
Fluctuation data
RMS data refreshed each cycle is saved from 0.5 s before to 29.5 s after the EVENT IN. When set
to 400 Hz, RMS data refreshed each cycle is saved from 0.125 s before to 7.375 s after.
10
174
13.3 Measurement Specifications
Dip (Dip)
Measurement method
IEC61000-4-30 compliant
During 50/60 Hz measurement, a dip is detected when the RMS voltage refreshed each half-cycle
exceeds the threshold in the negative direction.
During 400 Hz measurement, a dip is detected when the minimum of 4 RMS voltage values occurring within 10 ms (values calculated for one 400 Hz waveform) exceeds the threshold in the negative direction.
Sampling frequency
200 kHz
Displayed item
Dip depth : Worst value for RMS voltage refreshed each half-cycle [V]
Dip duration: Period from the time a U1 to U3 dip is detected until the reading exceeds the value
obtained by subtracting the hysteresis from the threshold in the positive direction
Measurement range, resolution
600.00 V
Measurement band
See RMS frequency characteristics.
Measurement accuracy
Same as for RMS voltage refreshed each half-cycle
Within half a cycle of the start accuracy time, within half a cycle of the end accuracy time (not specified for 400 Hz measurement)
Event threshold
Percentage of the nominal voltage or percentage of the slide reference voltage (user-selectable)
Event IN
Start of the waveform for which the RMS voltage refreshed each half-cycle exceeded the threshold
in the negative direction
Event OUT
Start of the waveform for which the RMS voltage refreshed each half-cycle exceeded the value
obtained by adding the hysteresis to the threshold in the negative direction
Multiple-phase system treatment
Starts when any of the U1 to U3 channels experiences a dip and ends when the dip has ended for
all channels.
Saved waveforms
Event waveforms
Fluctuation data
RMS data refreshed each cycle is saved from 0.5 s before to 29.5 s after the EVENT IN. When set
to 400 Hz, RMS data refreshed each cycle is saved from 0.125 s before to 7.375 s after.
Interruption (Intrpt)
Measurement method
IEC61000-4-30 compliant
During 50/60 Hz measurement, an interruption is detected when the RMS voltage refreshed each
half-cycle exceeds the threshold in the negative direction.
During 400 Hz measurement, an interruption is detected when the minimum of 4 RMS voltage values occurring within 10 ms (values calculated for one 400 Hz waveform) exceeds the threshold in
the negative direction.
Sampling frequency
200 kHz
Displayed item
Interruption depth : Worst value for RMS voltage refreshed each half-cycle [V]
Interruption duration : Period from the time a U1 to U3 interruption is detected until the reading exceeds the value obtained by adding the hysteresis to the threshold in the
positive direction
Measurement range, resolution
600.00 V
Measurement band
See RMS frequency characteristics.
Measurement accuracy
Same as for RMS voltage refreshed each half-cycle
Within half a cycle of the start accuracy time, within half a cycle of the end accuracy time (not specified for 400 Hz measurement)
Event threshold
Percentage of the nominal voltage
Event IN
Start of the waveform for which the RMS voltage refreshed every cycle exceeded the threshold in
the negative direction
Event OUT
Start of the waveform for which the RMS voltage refreshed each half-cycle exceeded the value
obtained by adding the hysteresis to the threshold in the positive direction
Multiple-phase system treatment
Starts when all of the U1 to U3 channels experience an interruption and ends when the interruption
ends for any of the channels.
Saved waveforms
Event waveforms
Fluctuation data
RMS data refreshed each cycle is saved from 0.5 s before to 29.5 s after the EVENT IN. When set
to 400 Hz, RMS data refreshed each cycle is saved from 0.125 s before to 7.375 s after.
175
13.3 Measurement Specifications
Instantaneous flicker value (S(t))
As per IEC61000-4-15
User-selectable from 230 Vlamp/120 Vlamp (when Pst and Plt are selected for flicker measurement)/4 types of Ed2 filter (230 Vlamp 50/60 Hz, 120 Vlamp 60/50 Hz)
Displayed item
Instantaneous flicker value
Measurement range, resolution
99.999, 0.001
Measurement band
See RMS frequency characteristics.
Measurement accuracy
-
Event threshold
None
Frequency (Freq or f)
Measurement method
Calculated as the reciprocal of the accumulated whole-cycle time during approx. 200 ms period of
10, 12, or 80 U1 (reference channel) cycles.
Sampling frequency
200 kHz
Displayed item
Frequency
Measurement range, resolution
When the measurement frequency is set to 50/60 Hz : 70.000 Hz
When the measurement frequency is set to 400 Hz : 440.00 Hz
Measurement band
When the measurement frequency is set to 50/60 Hz : 40.000 to 70.000 Hz
When the measurement frequency is set to 400 Hz : 360.00 to 440.00 Hz
Measurement accuracy
When the measurement frequency is set to 50/60 Hz : ±0.020 Hz or less
When the measurement frequency is set to 400 Hz : ±0.20 Hz or less (with input voltage of 4%
f.s. to 110% f.s.)
Event threshold
Specified as deviation from 0.1 Hz to 9.9 Hz in 0.1 Hz increments
Event IN
Start of approx. 200 ms aggregation in which ±threshold was exceeded
Event OUT
Start of approx. 200 ms aggregation in which reading returned to ±(threshold - 0.1 Hz)
Note: Equivalent to 0.1 Hz frequency hysteresis.
Multiple-phase system treatment
None
Saved waveforms
Event waveforms
13
Chapter 13 Specifications
Measurement method
10-sec frequency (Freq10s or f10s)
Measurement method
Calculated as the reciprocal of the accumulated whole-cycle time during the specified 10 s period
for U1 (reference channel) as per IEC61000-4-30. (To ensure measurement precision, it is necessary to wait a maximum of 20 s after inputting the signal.)
Sampling frequency
200 kHz
Displayed item
10-sec frequency
Measurement range, resolution
When the measurement frequency is set to 50/60 Hz : 70.000 Hz
When the measurement frequency is set to 400 Hz : 440.00 Hz
Measurement band
When the measurement frequency is set to 50/60 Hz : 40.000 to 70.000 Hz
When the measurement frequency is set to 400 Hz : 360.00 to 440.00 Hz
Measurement accuracy
When the measurement frequency is set to 50/60 Hz : ±0.010 Hz or less
When the measurement frequency is set to 400 Hz : ±0.10 Hz or less (with input voltage of
1.666% f.s. to 110% f.s.)
Event threshold
N/A
10
176
13.3 Measurement Specifications
Voltage waveform peak (Upk)
Measurement method
Measured every 10 cycles (50 Hz) or 12 cycles (60 Hz); maximum and minimum points sampled
during approx. 200 ms aggregation.
During 400 Hz measurement, measured every 80 cycles; maximum and minimum points sampled
during approx. 200 ms aggregation.
Sampling frequency
200 kHz
Displayed item
Positive peak value and negative peak value
Measurement range, resolution
Area of the RMS voltage range to which the crest factor was added. ±1200.0 Vpk
Measurement band
See RMS frequency characteristics.
Measurement accuracy
-
Event threshold
0 to 1200 V (value before setting VT ratio) 1 V increments, absolute value comparison
Event IN
Start of approx. 200 ms aggregation in which ±threshold was exceeded
Event OUT
Start of first approx. 200 ms aggregation after IN state in which ±threshold was not exceeded
Multiple-phase system treatment
Separate by channel
Saved waveforms
Event waveforms
Current waveform peak (Ipk)
Measurement method
Measured every 10 cycles (50 Hz) or 12 cycles (60 Hz); maximum and minimum points sampled
during approx. 200 ms aggregation.
During 400 Hz measurement, measured every 80 cycles; maximum and minimum points sampled
during approx. 200 ms aggregation.
Sampling frequency
200 kHz
Displayed item
Positive peak value and negative peak value
Measurement range, resolution
Area of the current range to which the crest factor was added.
Measurement band
See RMS frequency characteristics.
Measurement accuracy
-
Event threshold
0 to (rated current of clamp sensor being used × 4) A (value before setting CT), absolute value
comparison
Event IN
Start of approx. 200 ms aggregation in which ±threshold was exceeded
Event OUT
Start of first approx. 200 ms aggregation after IN state in which ±threshold was not exceeded
Multiple-phase system treatment
Separate by channel
Saved waveforms
Event waveforms
177
13.3 Measurement Specifications
RMS voltage (Urms)
AC+DC True RMS type
IEC61000-4-30 compliant: 10 cycles (50 Hz) or 12 cycles (60 Hz) (approx. 200 ms aggregation)
During 400 Hz measurement, calculated from 80 cycles (approx. 200 ms aggregation)
When set to 3P3W3M/3P4W/3P4W2.5E, the phase voltage/line voltage setting is applied to the
RMS voltage Urms.
Includes zero suppression.
Sampling frequency
200 kHz
Displayed item
RMS voltage for each channel and AVG (average) RMS voltage for multiple channels
(for more information, "13.10 Calculation Formula" (p.198))
Measurement range, resolution
600.00 V
Measurement band
See RMS frequency characteristics.
Measurement accuracy
When the measurement frequency is set to 50/60 Hz:
With input from 1.66% f.s. to 110% f.s.: Specified as 0.1% of nominal voltage with a nominal input
voltage (Udin) of at least 100 V.
With input outside the range of 1.666% f.s. to 110% f.s. or a nominal input voltage (Udin) of less
than 100 V: ±0.2% rdg.±0.08% f.s.
When the measurement frequency is set to 400 Hz: ±0.2% rdg.±0.16%f.s.
Event threshold
Upper and lower limits set separately from 0 to (lower limit) to (upper limit) to 780 V (value before
setting VT ratio)
When set to 3P3W3M/3P4W/3P4W2.5E, the phase voltage/line voltage setting is applied.
Sense
Set from 0 to 600 V.
Event IN
Start of the approx. 200 ms aggregation during which the reading was greater than the upper limit
or less than the lower limit
Event OUT
Start of the approx. 200 ms aggregation during which the reading was less than (upper limit - hysteresis) after being greater than the upper limit or was greater than (lower limit + hysteresis) after
being less than the lower limit
Multiple-phase system treatment
Separate by channel
Saved waveforms
Event waveforms
13
Chapter 13 Specifications
Measurement method
Voltage DC value (Udc)
Measurement method
Average value during approx. 20 ms aggregation synchronized with the reference channel (CH4 only)
Includes zero suppression.
Sampling frequency
200 kHz
Displayed item
Voltage DC value
Measurement range, resolution
600.00 V
Measurement band
See RMS frequency characteristics.
Measurement accuracy
±0.3% rdg.±0.08%f.s.
Event threshold
0 V to 1,200 V
The difference between the positive and negative waveform peak values in the 200 ms aggregation is compared to the threshold to generate DC fluctuation events.
Sense
Set from 0 to 600 V.
Event IN
Start of the 200 ms aggregation in which the threshold was exceeded
Event OUT
Start of the first 200 ms aggregation after the IN state in which the threshold was not exceed
Multiple-phase system treatment
None
Saved waveforms
Event waveforms
10
178
13.3 Measurement Specifications
RMS current (Irms)
Measurement method
AC+DC True RMS type
IEC61000-4-30 compliant: 10 cycles (50 Hz) or 12 cycles (60 Hz) (approx. 200 ms aggregation)
During 400 Hz measurement, 200 kHz sampling at 80 cycles (approx. 200 ms aggregation)
Includes zero suppression.
Sampling frequency
200 kHz
Displayed item
RMS current for each channel and AVG (average) RMS current for multiple channels
(for more information, "13.10 Calculation Formula" (p.198))
Measurement range, resolution
See input specifications.
Measurement band
See RMS frequency characteristics.
Measurement accuracy
When the measurement frequency is set to 50/60 Hz: ±0.2% rdg.±0.1%f.s. + clamp sensor accuracy
When the measurement frequency is set to 400 Hz: ±0.2% rdg.±0.6%f.s. +clamp sensor accuracy
Event threshold
0 to current range
Sense
0 to current range
Event IN
Start of approx. 200 ms aggregation in which threshold was exceeded
Event OUT
Start of approx. 200 ms aggregation in which reading was less than (threshold - hysteresis)
Multiple-phase system treatment
Separate by channel
Saved waveforms
Event waveforms
Current DC value (Idc)
Measurement method
Average value during approx. 200 ms aggregation synchronized to reference channel (CH4 only)
Includes zero suppression.
Sampling frequency
200 kHz
Displayed item
Current DC value
Measurement range, resolution
Varies with clamp sensor used (CH4 only).
Measurement band
See RMS frequency characteristics and consider clamp sensor measurement band.
Measurement accuracy
±0.5% rdg.±0.5%f.s. + clamp sensor specifications accuracy
Not specified when using AC dedicated clamp sensor.
Event threshold
0 to (rated current of clamp sensor being used × 4) A
The difference between the positive and negative waveform peak values in the 200 ms aggregation is compared to the threshold to generate DC fluctuation events.
Sense
0 to current range
Event IN
Start of the 200 ms aggregation in which the threshold was exceeded
Event OUT
Start of the first 200 ms aggregation after the IN state in which the threshold was not exceed
Multiple-phase system treatment
None
Saved waveforms
Event waveforms
179
13.3 Measurement Specifications
Active power (P)
Measured every 10 cycles (50 Hz) or 12 cycles (60 Hz) (approx. 200 ms aggregation).
During 400 Hz measurement, measured every 80 cycles (approx. 200 ms aggregation)
Includes zero suppression.
Sampling frequency
200 kHz
Displayed item
Active power for each channel and sum value for multiple channels
(for more information, see "13.10 Calculation Formula" (p.198))
Sink (consumption) : Unsigned
Source (regeneration) : Negative
Measurement range, resolution
Combination of voltage × current range (see "13.11 Clamp Sensors and Ranges" (p.211))
Measurement band
See RMS frequency characteristics and consider clamp sensor measurement band.
Measurement accuracy
When the measurement frequency is set to 50/60 Hz:
±0.2% rdg.±0.1%f.s. + clamp sensor accuracy (sum value is sum for channels being used)
When the measurement frequency is set to 400 Hz:
±0.4% rdg.±0.6%f.s. +clamp sensor accuracy (The total is the sum of the channels used.)
Event threshold
Comparison of power range absolute values
Event IN
Start of approx. 200 ms aggregation in which the absolute value was greater than the threshold
Event OUT
Start of approx. 200 ms aggregation in which the reading was less than (threshold - hysteresis)
following the EVENT IN state
Multiple-phase system treatment
Separate by channel
Saved waveforms
Event waveforms
13
Chapter 13 Specifications
Measurement method
Active energy and reactive energy (WP+, WP-/WQLAG, WQLEAD)
Measurement method
Measured every 10 cycles (50 Hz) or 12 cycles (60 Hz) (approx. 200 ms).
During 400 Hz measurement, measured every 80 cycles using the 8-cycle waveform (approx. 200
ms).
Integrated separately by consumption and regeneration from active power.
Integrated separately by lag and lead from reactive power.
Recorded at the specified TIMEPLOT interval. Data is updated every 10 cycles (50 Hz), 12 cycles
(60 Hz), or 80 cycles (400 Hz) (approx. 20 ms).
Integration starts at the same time as recording and continues to previous TIMEPLOT update at
termination of recording.
Sampling frequency
200 kHz
Displayed item
Active energy: WP+ (consumption), WP- (regeneration)
Sum of multiple channels (for more information, see "13.10 Calculation Formula" (p.198))
Reactive energy: WQLAG (lag), WQLEAD (lead)
Sum for multiple channels (for more information, see "13.10 Calculation Formula" (p.198))
Elapsed time
Measurement range, resolution
Combination of voltage × current range (See "13.11 Clamp Sensors and Ranges" (p.211))
Measurement band
See RMS frequency characteristics and consider clamp sensor measurement band.
Measurement accuracy
Active energy
: Active power measurement accuracy ±10 dgt.
Reactive energy
: Reactive power measurement accuracy ±10 dgt.
Cumulative time accuracy : 10 ppm 1 s (23°C [73°F])
Event threshold
N/A
10
180
13.3 Measurement Specifications
Apparent power (S)
Measurement method
Calculated from RMS voltage U and RMS current I.
No polarity
Sampling frequency
200 kHz
Displayed item
Apparent power of each channel and its sum for multiple channels.
(For details, see "13.10 Calculation Formula" (p.198))
Measurement range, resolution
Depends on the voltage × current range combination.
(See "13.11 Clamp Sensors and Ranges" (p.211))
Measurement band
See RMS frequency characteristics and consider clamp sensor measurement band.
Measurement accuracy
±1 dgt. for calculations derived from the various measurement values. (sum is ±3 dgt.)
Event threshold
Power range
Event IN
Start of approx. 200 ms aggregation in which the absolute value was greater than the threshold
Event OUT
Start of approx. 200 ms aggregation in which the reading was less than (threshold - hysteresis)
following the EVENT IN state
Multiple-phase system treatment
Separate by channel
Saved waveforms
Event waveforms
Reactive power (Q)
Measurement method
Calculated using apparent power S and active power P.
Lag phase (LAG: current lags voltage): Unsigned
Lead phase (LEAD: current leads voltage): Negative
Sampling frequency
200 kHz
Displayed item
Reactive power of each channel and its sum for multiple channels. (For details, see"13.10 Calculation Formula" (p.198).)
Measurement range, resolution
Depends on the voltage × current range combination.
(See "13.11 Clamp Sensors and Ranges" (p.211))
Measurement band
See RMS frequency characteristics and consider clamp sensor measurement band.
Measurement accuracy
±1 dgt. for calculations derived from the various measurement values. (sum is ±3 dgt.)
Event threshold
Power range
Event IN
Start of approx. 200 ms aggregation in which the absolute value was greater than the threshold
Event OUT
Start of approx. 200 ms aggregation in which the reading was less than (threshold - hysteresis)
following the EVENT IN state
Multiple-phase system treatment
Separate by channel
Saved waveforms
Event waveforms
181
13.3 Measurement Specifications
Power factor and displacement power factor (PF, DPF)
Power factor
: Calculated from RMS voltage U, RMS current I, and
active power P.
Displacement power factor
: Calculated from the phase difference between the
fundamental voltage wave and the fundamental current wave.
Lag phase (LAG: current lags voltage)
: Unsigned
Lead phase (LEAD: current leads voltage) : Negative
DPF values for all channels (excluding sum values) during 3P3W2M and 3P3W3M connections
are undefined.
Sampling frequency
200 kHz
Displayed item
Displacement power factor of each channel and its sum value for multiple channels. (For details,
see "13.10 Calculation Formula" (p.198).)
Measurement range, resolution
-1.0000 (lead) to 0.0000 to 1.0000 (lag)
Measurement band
See RMS frequency characteristics and consider clamp sensor measurement band
Measurement accuracy
13
Chapter 13 Specifications
Measurement method
-
Event threshold
0.000 to 1.000
Event IN
Start of approx. 200 ms aggregation in which the absolute value was less than the threshold
Event OUT
Start of the approx. 200 ms aggregation in which the reading was greater than (absolute value +
hysteresis) following the EVENT IN state
Multiple-phase system treatment
Separate by channel
Saved waveforms
Event waveforms
Voltage unbalance factor (negative-phase unbalance factor, zero-phase unbalance factor) (Uunb, Uunb0)
Measurement method
Calculated using various components of the three-phase fundamental voltage
wave (line-to-line voltage) for three-phase 3-wire (3P3W2M, 3P3W3M) and three-phase
4-wire connections. (For details, see "13.10 Calculation Formula" (p.198))
Sampling frequency
200 kHz
Displayed item
Negative-phase unbalance factor (Uunb), zero-phase unbalance factor (Uunb0)
Measurement range, resolution
Component is V and unbalance factor is 0.00% to 100.00%.
Measurement band
See "13.10 Calculation Formula" (p.198).
Measurement accuracy
When the measurement frequency is set to 50/60 Hz ±0.15%
(0.0% to 5.0% range specified for IEC61000-4-30 performance testing)
Event threshold
0.0% to 100.0%
Event IN
Start of approx. 200 ms aggregation in which reading was greater than the threshold
Event OUT
Start of approx. 200 ms aggregation in which the reading was less than (threshold - hysteresis)
Multiple-phase system treatment
None
Saved waveforms
Event waveforms
10
182
13.3 Measurement Specifications
Current unbalance factor (negative-phase unbalance factor, zero-phase unbalance factor) (Iunb, Iunb0)
Measurement method
For 3-phase 3-wire (3P2W2M and 3P3W3M) and 3-phase 4-wire, calculated using 3-phase fundamental current component (For details, see "13.10 Calculation Formula" (p.198).)
Sampling frequency
200 kHz
Displayed item
Negative-phase unbalance factor (Iunb), zero-phase unbalance factor (Iunb0)
Measurement range, resolution
Component is A and unbalance factor is 0.00% to 100.00%.
Measurement band
Fundamental component
Measurement accuracy
-
Event threshold
0.0% to 100.0%
Event IN
Start of approx. 200 ms aggregation in which reading was greater than the threshold
Event OUT
Start of approx. 200 ms aggregation in which the reading was less than (threshold - hysteresis)
Multiple-phase system treatment
None
Saved waveforms
Event waveforms
High-order harmonic voltage component and high-order harmonic current component (UharmH, IharmH)
Measurement method
The waveform obtained by eliminating the fundamental component is calculated using the true
RMS method during 10 cycles (50 Hz), 12 cycles (60 Hz), or 80 cycles (400 Hz) of the fundamental
wave (approx. 200 ms aggregation).
Sampling frequency
200 kHz
Displayed item
High-order harmonic voltage component value:
RMS voltage for the waveform obtained by eliminating the fundamental component
High-order harmonic current component value:
RMS current for the waveform obtained by eliminating the fundamental component
High-order harmonic voltage component maximum value:
Maximum RMS value for the waveform obtained by eliminating the fundamental component for the
period from EVENT IN to EVENT OUT (leaving channel information)
High-order harmonic current component maximum value:
Maximum RMS value for the waveform obtained by eliminating the fundamental component for the
period from EVENT IN to EVENT OUT (leaving channel information)
High-order harmonic voltage component period:
Period from high-order harmonic voltage component EVENT IN to EVENT OUT
High-order harmonic current component period:
Period from high-order harmonic current component EVENT IN to EVENT OUT
Measurement range, resolution
High-order harmonic voltage component: 600.00 V
High-order harmonic current component: Varies with current range; see input specifications.
Measurement band
2 kHz (-3dB) to 80 kHz (-3dB)
Measurement accuracy
High-order harmonic voltage component:
±10% rdg.±0.1%f.s. (specified for 10 V sine wave at 5 kHz, 10 kHz, and 20 kHz)
High-order harmonic current component:
±10% rdg.±0.2%f.s. + clamp sensor accuracy (specified as 1% f.s. sine wave at 5 kHz, 10 kHz,
and 20 kHz)
Event threshold
High-order harmonic voltage component: 0 V or greater, 600.00 V or less
High-order harmonic current component: 0 A or greater, current range or less
Event IN
Start of approx. 200 ms aggregation in which reading was greater than the threshold
Event OUT
Start of approx. 200 ms aggregation in which high-order harmonics were not detected during the
first approx. 200 ms aggregation following the IN state
Multiple-phase system treatment
Separate by channel
Saved waveforms
Event waveforms
High-order harmonic waveform
40 ms from the end of the first approx. 200 ms aggregation interval in which the reading was greater than the threshold (8,000 data points)
183
13.3 Measurement Specifications
Harmonic voltage and harmonic current (including fundamental component) (Uharm/Iharm)
Uses IEC61000-4-7:2002.
Max. order: 50th
Anti-aliasing low-pass filter causes attenuation of frequencies other than measurement target of at
least 50 dB.
Indicated harmonic voltage and harmonic current values incorporate inter-harmonics components
adjacent to the next whole-number harmonic component after harmonic analysis. (For details see
"13.10 Calculation Formula" (p.198).)
Measurement accuracy is specified for input that is 10% to 200% of IEC61000-2-4 Class 3.
Analysis window width
10 cycles (50 Hz), 12 cycles (60 Hz), or 80 cycles (400 Hz)
No. of window points
Rectangular, 4,096 points
Displayed item
From order 0 to 50 (with a fundamental wave of 40 to 70 Hz)
From order 0 to 10 (with a fundamental wave of 360 to 440 Hz)
Select either RMS or content percentage (When using content percentage, zero suppression
causes all orders to be given as 0% when the RMS value is 0.)
Measurement range, resolution
Harmonic voltage: 600.00 V
Harmonic current: Varies with current range (see input specifications).
Measurement accuracy
See measurement accuracy with a fundamental wave of 50/60 Hz and measurement accuracy
with a fundamental wave of 400 Hz.
Event threshold
Harmonic voltage: 0.00 to 780.00 V (order 0: absolute value comparison)
Harmonic current : Varies with clamp sensor ×1.3 (see input specifications) (order 0: absolute value comparison).
Event IN
Start of approx. 200 ms aggregation in which readings were greater than the threshold for each order
Event OUT
Start of approx. 200 ms aggregation in which readings were less than (threshold - hysteresis) for each order
Multiple-phase system treatment
Separate by channel
Saved waveforms
Event waveforms
Constraints
When using an AC-only clamp sensor, order 0 is not specified for current and power.
13
Chapter 13 Specifications
Measurement method
Harmonic power (including fundamental component) (Pharm)
Measurement method
Uses IEC61000-4-7:2002.
Max. order: 50th
Anti-aliasing low-pass filter causes attenuation of frequencies other than measurement target of at
least 50 dB.
Indicates harmonic power values consisting of harmonic power for each channel and the sum of
multiple channels. (For details see "13.10 Calculation Formula" (p.198).)
Analysis window width
10 cycles (50 Hz), 12 cycles (60 Hz), or 80 cycles (400 Hz)
No. of window points
Rectangular, 4,096 points
Displayed item
From order 0 to 50 (with a fundamental wave of 40 to 70 Hz)
From order 0 to 10 (with a fundamental wave of 360 to 440 Hz)
Select either RMS or content percentage (When using content percentage, zero suppression
causes all orders to be given as 0% when the RMS value is 0.)
Measurement range, resolution
See power ranges.
Measurement accuracy
See measurement accuracy with a fundamental wave of 50/60 Hz and measurement accuracy
with a fundamental wave of 400 Hz.
Event threshold
0 to (varies with range) (specified as absolute value)
Event IN
Start of approx. 200 ms aggregation in which the reading is greater than the threshold (when the
threshold is positive) or less than the threshold (when the threshold is negative)
Event OUT
Start of the approx. 200 ms aggregation in which the reading is less than (threshold - hysteresis)
(when the threshold is positive) or greater than (threshold + hysteresis) (when the threshold is negative) in the EVENT IN state
Multiple-phase system treatment
Separate by channel
Saved waveforms
Event waveforms
Constraints
When using an AC-only clamp sensor, order 0 is not specified for current and power.
10
184
13.3 Measurement Specifications
Measurement accuracy with a fundamental wave of 50/60 Hz
Harmonic input Measurement accuracy
Notes
Voltage At least 1% of
nominal
voltage
Order 0
Order 1+
: ±0.3% rdg.±0.08%f.s.
: ±5.00% rdg.
Specified with a nominal
voltage of at least 100 V.
<1% of nominal voltage
Order 0
Order 1+
: ±0.3% rdg.±0.08%f.s.
: ±0.05% of nominal voltage
Specified with a nominal
voltage of at least 100 V.
Current
Order 0
: ±0.5% rdg.±0.5%f.s.
Orders 1 to 20th : ±0.5% rdg.±0.2%f.s.
Orders 21 to 50th : ±1.0% rdg.±0.3%f.s.
Add clamp sensor accuracy.
Power
Order 0
: ±0.5% rdg.±0.5%f.s.
: ±0.5% rdg.±0.2%f.s.
1 to 20th
: ±1.0% rdg.±0.3%f.s.
21 to 30th
Orders 31 to 40th : ±2.0% rdg.±0.3%f.s.
Orders 41 to 50th : ±3.0% rdg.±0.3%f.s.
Add clamp sensor accuracy.
Measurement accuracy with a fundamental wave of 400 Hz
Harmonic input Measurement accuracy
Notes
: ±0.5% rdg.±0.08%f.s.
: ±0.5% rdg.±0.20%f.s.
: ±1.0% rdg.±0.30%f.s.
: ±5.0% rdg.±0.30%f.s.
Voltage
Order 0
Orders 1 to 2th
Orders 3 to 6th
Orders 7 to 10th
Current
Order 0
1 to 2th
3 to 6th
7 to 10th
: ±0.5% rdg.±0.5%f.s.
: ±0.5% rdg.±0.2%f.s.
: ±1.0% rdg.±0.3%f.s.
: ±5.0% rdg.±0.3%f.s.
Add clamp sensor accuracy.
Power
Order 0
1 to 2th
3 to 6th
7 to 10th
: ±0.5% rdg.±0.5%f.s
: ±0.5% rdg.±0.2%f.s.
: ±1.0% rdg.±0.3%f.s.
: ±7.0% rdg.±0.3%f.s.
Add clamp sensor accuracy.
Inter-harmonic voltage and inter-harmonic current (Uiharm, Iiharm)
Measurement method
Uses IEC61000-4-7:2002.
Anti-aliasing low-pass filter causes attenuation of frequencies other than measurement target of at
least 50 dB.
After harmonic analysis, harmonic voltage and current are summed and displayed as inter-harmonic contents with the harmonic contents according to harmonic order
Measurement accuracy is specified for input that is 10% to 200% of IEC61000-2-4 Class 3.
Analysis window width
10 cycles (50 Hz) or 12 cycles (60 Hz)
No. of window points
Rectangular, 4,096 points
Displayed item
0.5 to 49.5 orders (of 42.5- to 70-Hz fundamental waveform)
Select either RMS or content percentage (When using content percentage, zero suppression
causes all orders to be given as 0% when the RMS value is 0.)
Measurement range, resolution
Inter-harmonic voltage: U1 to U4, 600.00 V
Inter-harmonic current: I1 to I4, Varies with current range (see input specifications).
Measurement accuracy
Inter-harmonic voltage (Specified with a nominal voltage of at least 100 V.)
At least 1% of harmonic input nominal voltage:: ±5.00% rdg.
<1% of harmonic input nominal voltage: ±0.05% of nominal voltage
Inter-harmonic current: Unspecified
Event threshold
N/A
Constraints
Not displayed for 400 Hz measurement.
185
13.3 Measurement Specifications
Harmonic voltage phase angle and Harmonic current phase angle (including fundamental component)
(Uphase/Iphase)
Uses IEC61000-4-7:2002.
Max. order: 50th
Anti-aliasing low-pass filter causes attenuation of frequencies other than measurement target of at
least 50 dB.
Analysis window width
10 cycles (50 Hz), 12 cycles (60 Hz), or 80 cycles (400 Hz)
No. of window points
Rectangular, 4,096 points
Displayed item
After harmonic analysis, the harmonic phase angle components for whole orders are displayed.
(Reference channel’s fundamental wave phase angle must be 0°.)
Measurement range, resolution
0.00 to ±180.00°
Measurement accuracy
Event threshold
N/A
13
Chapter 13 Specifications
Measurement method
Harmonic voltage-current phase angle (including fundamental component) (Pphase/ θ)
Measurement method
Uses IEC61000-4-7:2002.
Max. order: 50th
Anti-aliasing low-pass filter causes attenuation of frequencies other than measurement target of at
least 50 dB.
Analysis window width
10 cycles (50 Hz), 12 cycles (60 Hz), or 80 cycles (400 Hz)
No. of window points
Rectangular, 4,096 points
Displayed item
Indicates the difference between the harmonic voltage phase angle and the harmonic current
phase angle.
Harmonic voltage-current phase difference for each channel and sum (total) value for multiple
channels (For details, see "13.10 Calculation Formula" (p.198).)
Measurement range, resolution
0.00to ±180.00°
Measurement accuracy
At 50/60 Hz:
1st to 3rd orders : ± 2°
4th to 50th orders: ±(0.05°×k+2°) (k: harmonic orders)
At 400 Hz:
1st to 10th orders: ±(0.16°×k+2°) (k: harmonic orders)
Note1: However, clamp sensor accuracy is added.
Note2: Specified with a harmonic voltage of 1 V for each order and a current level of at 1% f.s. or greater.
Event threshold
Specified from 0° to 180° in 1° intervals.
Event IN
Start of approx. 200 ms aggregation in which the absolute value is greater than the threshold.
Event OUT
Start of the approx. 200 ms aggregation in which the absolute value is less than (threshold - hysteresis) in the EVENT IN state.
Multiple-phase system treatment
Separate by channel
Saved waveforms
Event waveforms
10
186
13.3 Measurement Specifications
Total harmonic voltage and Total harmonic current distortion factor (Uthd, Ithd)
Measurement method
Uses IEC61000-4-7:2002.
Max. order: 50th
Anti-aliasing low-pass filter causes attenuation of frequencies other than measurement target of at
least 50 dB.
Analysis window width
10 cycles (50 Hz), 12 cycles (60 Hz), or 80 cycles (400 Hz)
No. of window points
Rectangular, 4,096 points
Displayed item
THD-F (total harmonic distortion factor for the fundamental wave)
THD-R (total harmonic distortion factor for the total harmonic including the fundamental wave)
Measurement range, resolution
0.00 to 100.00%(Voltage), 0.00 to 500.00%(Current)
Measurement accuracy
-
Event threshold
0.00 to 100.00%
Event IN
Start of approx. 200 ms aggregation in which the absolute value was greater than the threshold
Event OUT
Start of approx. 200 ms aggregation in which the reading was less than (threshold - hysteresis)
following the EVENT IN state
Multiple-phase system treatment
Separate by channel
Saved waveforms
Event waveforms
K Factor (multiplication factor) (KF)
Measurement method
Calculated using the harmonic RMS current of the 2nd to 50th orders.
(For details, see "13.10 Calculation Formula" (p.198).)
Analysis window width
10 cycles (50 Hz), 12 cycles (60 Hz), or 80 cycles (400 Hz)
No. of window points
Rectangular, 4,096 points
Displayed item
K factor
Measurement range, resolution
0.00 to 500.00
Measurement accuracy
-
Event threshold
0 to 500.0
Event IN
Start of approx. 200 ms aggregation in which the absolute value was greater than the threshold
Event OUT
Start of approx. 200 ms aggregation in which the reading was less than (threshold - hysteresis)
following the EVENT IN state
Multiple-phase system treatment
Separate by channel
Saved waveforms
Event waveforms
187
13.3 Measurement Specifications
Voltage waveform comparison (Wave)
A judgment area is automatically generated from the previous 200 ms aggregation waveform, and
events are generated based on a comparison with the judgment waveform. Waveform judgments
are performed once for each 200 ms aggregation.
Comparison window width
10 cycles (50 Hz), 12 cycles (60 Hz), or 80 cycles (400 Hz)
No. of window points
4,096 points synchronized with harmonic calculations
Displayed item
Event detection only
Event threshold
0.0% to 100.0% of nominal voltage RMS value
Event IN
First time at which waveform diverges from judgment area
Event OUT
None
Multiple-phase system treatment
Separate by channel
Saved waveforms
Event waveforms
13
Chapter 13 Specifications
Measurement method
Inrush current (Irms1/2 , Inrush)
Measurement method
Detected using the current RMS Irms 1/2.
For 400 Hz measurement, inrush current is detected when the maximum of 4 RMS current values
existing within the same 10 ms period (calculated values for one 400 Hz waveform) is greater than
the threshold in the positive direction.
Displayed item
Maximum RMS current Irms 1/2 current
Measurement range, resolution
Varies with clamp sensor used (see input specifications).
Measurement accuracy
Same as RMS current refreshed each half-cycle Irms 1/2
Event threshold
Varies with set range.
Event IN
Time at the start of each channel's voltage half-cycle waveform for which the RMS current refreshed each half-cycle exceeded the threshold
Event OUT
Time at the start of the voltage half-cycle waveform in which the RMS current refreshed each halfcycle exceeded (threshold - hysteresis) in the negative direction
Multiple-phase system treatment
None
Saved waveforms
Event waveforms
Fluctuation data
With a measurement frequency of 50/60 Hz:
RMS current Irms 1/2 values are saved from 0.5 s before to 29.5 s after the event.
With a measurement frequency of 400 Hz:
RMS current Irms 1/2 values are saved from 0.125 s before to 7.375 s after the event.
10
188
13.3 Measurement Specifications
ΔV10 Flicker (dV10)
Measurement method
"13.10 Calculation Formula" (p.198)
Calculated values are subject to 100 V conversion following gap-less measurement once each minute.
Standard voltage
Automatic (with AGC)
Displayed item
Δ V10 measured at one minute intervals, average value for one hour, maximum value for one hour,
fourth largest value for one hour, total (within the measurement interval) maximum value
Measurement range, resolution
0.000 to 99.999 V
Measurement accuracy
±2% rdg.±0.01 V (with a fundamental wave of 100 Vrms [50/60 Hz], a fluctuation voltage of 1 Vrms,
and a fluctuation frequency of 10 Hz)
Threshold
0.00 to 9.99V Alarm output is generated when the reading for each minute is compared to the
threshold and found to be greater
Event IN
N/A
Event OUT
N/A
Multiple-phase system treatment
None
IEC Flicker (Pst, Plt)
Measurement method
Uses IEC61000-4-15:1997 +A1:2003 Ed1/Ed2, Calculated as described in "13.10 Calculation Formula" (p.198).
Pst is calculated after 10 minutes of continuous measurement and Plt after 2 hours of continuous
measurement.
Displayed item
Short interval flicker Pst, long interval flicker Plt
Measurement range, resolution
0.0001 to 10000 PU broken into 1,024 segments with a logarithm
Flicker filter
Select 230 V lamp Ed1, 120 V lamp Ed1, 230 V lamp Ed2, or 120 V lamp Ed2.
Measurement accuracy
Pst ±5% rdg. (Specified within range 0.1000 to 20.000 using IEC61000-4-15 Ed1.1 and IEC610004-15 Ed2 Class F1 performance test.)
Other Characteristics
RMS frequency characteristics
Frequency
Voltage
Current
Power
40 Hz to 70 Hz
Specified as RMS value
Specified as RMS value
Specified as RMS value
70 Hz to 360 Hz
±1% rdg.±0.2%f.s.
±1% rdg.±0.5%f.s.
±1% rdg.±0.5%f.s.
360 Hz to 440 Hz
Specified as RMS value
Specified as RMS value
Specified as RMS value
440 Hz to 5kHz
±5% rdg.±0.2%f.s.
±5% rdg.±0.5%f.s.
±5% rdg.±1%f.s.
5kHz to 20 kHz
±5% rdg.±0.2%f.s.
±5% rdg.±0.5%f.s.
20 kHz to 50 kHz
±20% rdg.±0.4%f.s.
±20% rdg.±0.5%f.s.
80 kHz
-3dB
-3dB
Specified for RMS voltage Urms and RMS current Irms. Current and power values incorporate clamp sensor accuracy.
Temperature characteristic: Specified within operating temperature and humidity range.
Voltage, Current, Power ±0.03%f.s./°C
Add ±0.05% f.s./×C for DC measured values.
Effect of common mode voltage
±0.2%f.s. or less
600 Vrms, 50/60 Hz, Between voltage measurement jacks and instrument chassis
±2%f.s. or less
600 Vrms, 400 Hz, Between voltage measurement jacks and instrument chassis
Magnetic field interference
Voltage
±0.5f.s. or less (in a magnetic field of 400 A/m rms, 50/60 Hz)
Current, Power
±1.5%f.s. or less (in a magnetic field of 400 A/m rms, 50/60 Hz)
189
13.4 Event Specifications
Flag concept
13.4 Event Specifications
13
Chapter 13 Specifications
IEC61000-4-30 flag concept
When a dip, swell, or interruption compromises the reliability of a value, a flag is attached to the measurement
data. Flags are referenced when determining the slide reference voltage and interruption frequency and
recorded along with TIMEPLOT data status information. Even when dip, swell, and interruption events have
been turned off, flags are attached to measurement data when a dip or interruption (when the voltage falls
10% relative to the nominal voltage) or swell (when the voltage rises 200%) is judged to have occurred. Flags
can be reviewed on the TIMEPLOT trend, detailed trend, and flicker (Pst, Plt) graphs. They are shown on
trend graphs and can also be reviewed with the measurement data using the 9624-50 PQA-HiView Pro software.
Event detection
Event detection method
• The detection method relative to measured values for each event target is listed in the measurement specifications.
• External events are detected by detecting signal input to the external event (EVENT IN) terminal.
• Manual events are detected when the MANU EVENT key is pressed.
• Enabled measurement item events are detected using OR logic.
• Events cannot be detected using maximum, minimum, or average values.
• The threshold setting error is ±1 dgt. relative to the setting.
Event-synchronized save functionality
Event waveform
Approx. 200 ms aggregation (10 cycle/12 cycle) + instantaneous waveforms for 2 cycles before
and after (20 kS/s) (for 400 Hz measurement, 80 cycles + 16 cycles before and after)
Transient waveform
Instantaneous waveform for 2 ms before and after the transient overvoltage waveform detection
position (2 MS/s)
High-order harmonic waveform
Instantaneous waveform for 40 ms following the first approx. 200 ms aggregation period in which
the reading is greater than the threshold (200 kS/s)
8,000 data points
Fluctuation data
Display of RMS fluctuation data every half cycle equivalent to from 0.5 s before the event to 29.5 s
after event (for 400 Hz, measurement, from 0.125 s before to 7.375 s after) as a detailed trend graph
Sense function
A SENSE START event occurs and sense starts when the upper or lower value is exceeded while sense
is on. While the sense function is operating, measured values are continuously compared to the range
defined by (the measured value when the event last occurred + the sense threshold) and (the measured
value when the event last occurred - the sense threshold). If the value falls outside this range, a sense
event is generated, and the sense range is updated. When the upper limit or lower limit exceeded event
ends, a SENSE END event is generated, and sense function operation terminates.
10
190
13.5 Operating Specifications
13.5 Operating Specifications
Operating modes
Three modes: [SETTING], [RECORDING] (including [WAITING]), and [ANALYZING]
A group of screens including [SYSTEM], [VIEW], [TIMEPLOT], and [EVENT]
displays groups exists for each mode.
Recording start
timing
Recording starts at a round TIMEPLOT interval time. For TIMEPLOT intervals of
150/180 cycles, recording starts in 1-minute increments.
Power outage
processing
In the event of a power outage during recording, the instrument resumes recording once the power is back on (integral power starts from 0).
[SETTING]
(SETTING)
[WAITING]
(WAITING)
[RECORDING]
(RECORDING)
[ANALYZING]
(ANALYZING)
Instrument has been turned on, and there is no data stored internally.
[SYSTEM]
Settings can be changed, and measured values are updated approximately once every 0.5 s.
[VIEW]
Screen updated approximately once every 0.5 s
[TIME PLOT]
None
[EVENT]
None
START LED
Off
Effective from the time the START/STOP button is pressed until the recording
start time
[SYSTEM]
Settings cannot be changed, and measured values are updated approximately once every 0.5 s.
[VIEW]
Screen updated approximately once every 0.5 s
[TIME PLOT]
Standby display with time series graph
[EVENT]
Standby display
START LED
Flashing
Recording has started, and measurement data is being saved on the SD memory card.
[SYSTEM]
Settings cannot be changed, and measured values are updated approximately once every 0.5 s.
[VIEW]
Screen updated approximately once every 0.5 s
[TIME PLOT]
Screen updated every TIMEPLOT interval
[EVENT]
Screen updated every time an event occurs
START LED
On
Recording has stopped, and the instrument's internal measurement data can be
analyzed.
[SYSTEM]
Settings cannot be changed, and measured values are updated approximately once every 0.5 s.
[VIEW]
Analysis of event specified on the [TIMEPLOT] or [EVENT] screen
[TIME PLOT]
Time series graph display
[EVENT]
Event display
START LED
Off
191
13.6 Measurement and Analysis Function Specifications
13.6 Measurement and Analysis Function Specifications
Mode
Display
[SETTING]
Real-time data
[RECORDING]
[ANALYZING]
Display
updates
Displayed screens
Approx.
0.5 s
Waveform display, vector display, DMM display, harmonic bar graph
display, harmonic list display
Event data selected on
[TIMEPLOT] or [EVENT] screen
Waveform display, transient overvoltage waveform display, DC waveform display, vector display, DMM display, harmonic bar graph display, harmonic list display, high-order harmonics
Note: Maximum, minimum, and average data is not shown on the [VIEW] screen.
Chapter 13 Specifications
[VIEW] screen
13
Waveform display
Displayed screens
1. Voltage/ Current
: 2-segment split display (voltage waveform (U1 to U4) Current waveform (I1
to I4))
2. Voltage 4 channels: 4-segment split display (voltage waveform (U1 to U4))
3. Current 4 channels: 4-segment split display (current waveform (I1 to I4))
Harmonic display
Displayed screens
Vector/harmonic graph/harmonic list
The screen displays 10-/12-cycle RMS values based on the IEC61000-4-30 standard for the RMS
voltage, RMS current, and power for each order on the vector, graph, and list screens.
DMM display
Displayed screens
1. Power, 2. Voltage, 3. Current
The screen shows 10-/12-cycle RMS values based on the IEC61000-4-30 standard for RMS voltage and RMS current on the DMM screen.
Transient overvoltage waveform display
Display conditions
When an event is selected (event is selected on the waveform display screen)
Display selection
All voltage channels
Display period
2 ms before and 2 ms after trigger point
High-order harmonics display
Display conditions
When an event is selected (event is selected on the waveform display screen)
Display format
High-order harmonic voltage component and current component waveforms
Display selection
Channel: Select from CH1, CH2, CH3, and CH4
Display period
40 ms starting after the first approx. 200 ms aggregation interval in which event occurred (8,000
data points)
10
192
13.6 Measurement and Analysis Function Specifications
[TIME PLOT] screen
Trend graph display
Displayed screens
1-screen/2-screen/Energy
Displayed content
Time series graph of maximum, minimum, and average values for 1 item on 1-screen display or 2
items on 2-screen display
Select from Freq, Freq10s, Upk+, Upk-, Ipk+, Ipk-, Urms, UrmsAVG, Udc, Irms, IrmsAVG, Idc, P, S,
Q, PF, DPF, Uunb0, Uunb, Iunb0, Iunb, UharmH, IharmH, Uthd-F, Uthd-R, Ithd-F, Ithd-R, and KF.
"Integration" refers to a time series graph of 1 integrated item.
Display update rate during
measurement
Every TIMEPLOT interval
Detailed trend graph display (interval)
Displayed screens
Time series graph of maximum and minimum values for fluctuation data
Displayed content
Select any 1 of Urms1/2, Irms1/2, S(t), and frequency cycle.
(S(t) cannot be selected during 400 Hz measurement.)
Display update rate during
measurement
Every TIMEPLOT interval
Fluctuation data display (detailed trend graph at event occurrence)
Displayed screens
Time series graph of fluctuation data at event occurrence (from 0.5 s before to 29.5 s after event
occurrence for 50/60 Hz measurement; from 0.125 s before to 7.375 s after event occurrence for
400 Hz measurement)
Displayed content
Either Urms1/2 or Irms1/2 (inrush current)
Display update rate during
measurement
Each time a displayed event occurs (display is overwritten)
Harmonic trend graph display
Displayed screens
1-screen display
Displayed content
Time series graph of maximum, minimum, and average values for up to 6 items
Display update rate during
measurement
Every TIMEPLOT interval
Inter-harmonics trend graph display
Displayed screens
1-screen display
Displayed content
Time series graph of maximum, minimum, and average values for up to 6 items
Display update rate during
measurement
Every TIMEPLOT interval
ΔV10 flicker graph display (when flicker is set to ΔV10)
Displayed content
Time series graph of ΔV10 (instantaneous value)
(simultaneous display for all measurement channels)
Constraints
No display for 400 Hz measurement
ΔV10 flicker list display (when flicker is set to ΔV10)
Displayed content
ΔV10 1-hour average value, ΔV10 1-hour maximum value, ΔV10 1-hour fourth-largest value, ΔV10
overall maximum value
193
13.6 Measurement and Analysis Function Specifications
ΔV10 flicker list display (when flicker is set to ΔV10)
Every 1 min (ΔV10 overall maximum value), every 1 hr (others)
Display selection
CH1 to CH3 (varies with connection)
Constraints
No display for 400 Hz measurement
IEC flicker graph display (when flicker is set to IEC [Pst, Plt])
Displayed content
Time series graph of Pst and Plt values
Constraints
No display for 400 Hz measurement
IEC flicker list display (when flicker is set to IEC [Pst, Plt])
Displayed content
Pst and Plt values
Display refresh rate
Each time Pst is updated
Constraints
No display for 400 Hz measurement
13
Chapter 13 Specifications
Display refresh rate
[EVENT] screen
Event list display
Display format
• Event list display
• Event details display (detailed information for event selected on event list)
• Waveform display (waveform for event selected on event list; either voltage or current screen as
set with [VIEW] screen's [VOLT/CURR] display setting)
Event list display order
Order of occurrence
Event jump function
Allows details for specified event to be analyzed on [VIEW] screen.
10
194
13.7 Configuration Function Specifications
13.7 Configuration Function Specifications
Detailed description of Urms type, PF type, THD type, and harmonics
Details
Selection
Measured value
(DMM screen)
Measured value display
switching
(DMM screen display only)
TIMEPOT and events
Urms type
PF type
Selection is applied to RMS voltage (Urms) only
and does not affect RMS voltage refreshed
each half-cycle or transient measured values.
Harmonics
Selection is
applied.
Selection is
applied.
Selection is applied.
-
-
Level/content
percentage switched
on DMM screen.
Phase voltage/line voltage switched on
DMM screen.
Selection on main settings screen is applied
Selection on
Selection on main
to RMS voltage (Urms) but does not affect
main settings
settings screen is
RMS voltage refreshed each half-cycle or
screen is applied.
applied.
transient events.
Binary data storage
(displayed on computer ap- Phase voltage and line voltage
plication)
Other
THD type
Power factor and
displacement
power factor
THD-F and
THD-R
Selection on main
settings screen is
applied.
Level and content
percentage
DPF values for
channels (excluding sum valValid with 3P3W3M, 3P4W, and 3P4W2.5E
ues) for 3P3W2M
connections. Does not apply to waveform.
and 3P3W3M
connections are
undefined.
Power (small) / P&Harm (normal) / all data (full) details
Recorded item
Power
P&Harm
All Data
RMS voltage refreshed
each half-cycle
Yes
Yes
Yes
RMS current refreshed
each half-cycle
Yes
Yes
Recorded item
Power
P&Harm
All Data
Harmonic voltage
Yes
Yes
Yes
Harmonic current
Yes
Yes
Frequency
Yes
Yes
Yes
Harmonic power
Yes
Yes
Frequency cycle
Yes
Yes
Yes
Harmonic voltage and
current phase difference
Yes
Yes
10-sec frequency
Yes
Yes
Yes
Harmonic voltage phase
angle
Yes
Yes
RMS voltage
Yes
Yes
Yes
Harmonic current phase
angle
Yes
Yes
RMS current
Yes
Yes
Yes
Voltage waveform peak
Yes
Yes
Yes
Inter-harmonic voltage
Yes
Current waveform peak
Yes
Yes
Yes
Inter-harmonic current
Yes
Active power
Yes
Yes
Yes
Total harmonic voltage
distortion factor
Yes
Yes
Yes
Apparent power
Yes
Yes
Yes
Total harmonic current
distortion factor
Yes
Yes
Yes
Reactive power
Yes
Yes
Yes
Power factor/displacement power factor
Yes
Yes
Yes
High-order harmonic
voltage component
Yes
Yes
Yes
Voltage unbalance factor
Yes
Yes
Yes
High-order harmonic
current component
Yes
Yes
Yes
Current unbalance factor
Yes
Yes
Yes
K factor
Yes
Yes
Yes
Instantaneous flicker
value
Yes
Yes
Yes
Integral power
Yes
Yes
Yes
Flicker (ΔV10/Pst, Plt)
Yes
Yes
Yes
195
13.7 Configuration Function Specifications
Quick setup pattern details
Pattern
Setting
Abnormal voltage
detection
Set in advance
Set in advance
CT, PT ratios
Set in advance
Inrush current
measurement
Measured value
recording
EN50160
Measurement frequen- Automatic detection of 50/60/400 Hz; if unable to detect, user (manual) setting
cy
Nominal input voltage
Automatic detection; if unable to detect, user (manual) setting
Flicker/ΔV10
(depends on selected
language)
Pst, Plt
(when Japanese is
selected, ΔV10)
Pst, Plt
(when Japanese is
selected, ΔV10)
Pst, Plt
(when Japanese is
selected, ΔV10)
Pst, Plt
(when Japanese is
selected, ΔV10)
Pst,Plt
Measurement RMS
voltage selection
Default
Default
Default
Default
Default
Measurement
harmonics selection
RMS value
RMS value
RMS value
RMS value
Content percentage
Total harmonic
THD_F
distortion factor selection
THD_F
THD_F
THD_F
THD_F
Power factor selection
PF
PF
PF
PF
PF
Repeat setting and
iterations
OFF (max. 35 days) OFF (max. 35 days) OFF (max. 35 days) OFF (max. 35 days) OFF (max. 35 days)
Recorded items setting P&Harm (Normal)
All Data (Full)
P&Harm (Normal)
All Data (Full)
TIMEPLOT interval
1 minute
10 minutes
1 minute
10 minutes
10 minutes
Current range
Automatic detection
Automatic detection
Max. range
Automatic detection
Automatic detection
All Data (Full)
Event hysteresis
1%
1%
1%
1%
2%
Transient overvoltage
70% of nominal
voltage
70% of nominal
voltage
OFF
OFF
100% of nominal
voltage
Voltage swell
110% of nominal
voltage
110% of nominal
voltage
OFF
OFF
110% of nominal
voltage
Voltage dip
90% of nominal
voltage
90% of nominal
voltage
OFF
OFF
90% of nominal
voltage
Interruption
10% of nominal
voltage
10% of nominal
voltage
OFF
OFF
1% of nominal
voltage
Frequency
±5 Hz of nominal
frequency
±0.5 Hz of nominal
frequency
OFF
OFF
±0.5 Hz of nominal
frequency
Frequency cycle
OFF
OFF
OFF
OFF
OFF
Voltage waveform
peak (±)
150% of reference
value
150% of reference
value
OFF
OFF
170% of nominal
voltage
Voltage DC fluctuation
±10% based on DC
(±) (when DC is selected) measured value
±10% based on DC
measured value
OFF
OFF
OFF
Current waveform
peak (±)
200% of reference
value
300% of reference
value
OFF
OFF
±10% based on DC
measured value
OFF
OFF
OFF
RMS voltage
10% of reference
10% of reference
OFF
value
value
SENSE width: ±10 V SENSE width: ±10 V
OFF
OFF
RMS current
OFF
SENSE width: OFF
50% of reference
value
SENSE width: OFF
OFF
SENSE width: OFF
OFF
SENSE width: OFF
OFF
SENSE width: OFF
Inrush current
(Irms 1/2)
OFF
OFF
200% of reference
value
OFF
OFF
OFF
Current DC fluctuation (±) ±10% based on DC
(when DC is selected)
measured value
13
Chapter 13 Specifications
Connection
Clamp sensor
Basic power supply
quality measurement
Active power
OFF
OFF
OFF
OFF
OFF
Apparent power
OFF
OFF
OFF
OFF
OFF
Reactive power
OFF
OFF
OFF
OFF
OFF
Power factor/displacement power factor
OFF
OFF
OFF
OFF
OFF
10
196
13.7 Configuration Function Specifications
Quick setup pattern details
Pattern
Setting
Abnormal voltage
detection
Basic power supply
quality measurement
Inrush current
measurement
Measured value
recording
EN50160
Voltage unbalance
factor (zero-phase,
negative-phase)
OFF, 3%
OFF, 3%
OFF, OFF
OFF, OFF
OFF, 2%
Current unbalance
factor (zero-phase,
negative-phase)
OFF, OFF
OFF, OFF
OFF, OFF
OFF, OFF
OFF, OFF
Harmonic voltage
fundamental wave
order 0
Harmonic
orders 3, 5, 7, 9 11
OFF
OFF
OFF
OFF
5% of nominal
voltage
10% of nominal
voltage
OFF
OFF
OFF
OFF
OFF
OFF
As per EN50160
harmonic voltage
limit value; see table
below.
Harmonic current
fundamental wave
order 0
Harmonic
orders 3, 5, 7, 9, 11
OFF
OFF
OFF
OFF
5% of range
OFF
OFF
OFF
OFF
OFF
OFF
OFF
OFF
OFF
OFF
Harmonic power
fundamental wave
order 0
Harmonic
orders 3, 5, 7, 9 11
OFF
OFF
OFF
OFF
OFF
OFF
OFF
OFF
OFF
OFF
OFF
OFF
OFF
OFF
OFF
Harmonic voltage and
OFF
current phase difference
OFF
OFF
OFF
OFF
Total harmonic voltage 5%
distortion factor
7%
OFF
OFF
OFF
Total harmonic current OFF
distortion factor
OFF
OFF
OFF
OFF
K factor
OFF
OFF
OFF
OFF
OFF
High-order harmonic
voltage component
OFF
OFF
OFF
OFF
OFF
High-order harmonic
current component
OFF
OFF
OFF
OFF
OFF
Voltage waveform
comparison
±15%
±10%
OFF
OFF
OFF
• When the RMS voltage is less than 3% f.s. of the range, 5% of the range is used as the upper limit, and 0% of the range is used as the
lower limit.
• When the voltage peak value is less than 3% f.s. of the range, 5% of the range is used as the threshold.
• Harmonic voltage and current distortion factor calculation are turned off when the harmonic voltage is less than 3% f.s. of the range.
• A value of 10% of the range is used as the threshold when the current and power reference value (measured values) are 10% or less of
the range.
• Changing VT or CT after quick setup causes the threshold and sense to change (this also applies when not using quick setup).
• As a rule, settings not included in the table are set to OFF (other than manual events).
• When EN50160 is selected, the EN50160 analysis function using Model 9624-50 PQA-HiView Pro software is only available when the
interval time is set to 10 minutes.
EN50160 harmonic voltage limits
Odd harmonics
Even harmonics
Not multiples of 3
Multiples of 3
Order h
Relative voltage (Un)
Order h
Relative voltage (Un)
Order h
5
6.0%
3
5.0%
2
2.0%
7
5.0%
9
1.5%
4
1.0%
6...24
0.5%
11
3.5%
15
0.5%
13
3.0%
21
0.5%
17
2.0%
19
1.5%
23
1.5%
25
1.5%
Un = nominal voltage (Uref)
Relative voltage (Un)
197
13.8 GPS Time Synchronization Function
13.8 GPS Time Synchronization Function
GPS settings and status display function
GPS box connection setting
RS connected device: GPS
GPS reception status display
Positioning status
GPS mark
A GPS mark is displayed among other icons along the top of the screen to indicate the GPS positioning status.
: Err (no positioning data), 2D (2D independent positioning), 3D (3D independent positioning), D2D (differential 2D positioning), D3D (differential 3D positioning)
No. of positioning satellites : 0 to 12 (no. of satellites that can be used in position calculation)
DOP value
: 0 to 9,999 (GPS positioning status reliability) (smaller values other
than 0 indicate higher reliability)
Chapter 13 Specifications
The GPS BOX PW9005 can be connected to the instrument to synchronize the instrument’s time
with the GPS satellite time (coordinated universal time).
13
Blue GPS mark : Time correction has been performed.
Yellow GPS mark : The device is unable to acquire GPS satellites or unable to calculate its position. The yellow mark is also shown when time correction is canceled during
recording.
Red GPS mark : The PW3198 has not detected the GPS box.
Time correction function
Corrected time and correction
accuracy
Set to amount of variation from universal coordinated time (UTC).
The instrument’s clock is corrected within ±2 ms of the GPS time accuracy.
Initial position
1. The GPS mark is yellow after connecting the GPS BOX PW9005 to the instrument.
2. The GPS mark turns blue after the unit has acquired GPS satellites and positioning status and
finished correcting the instrument time.
Time correction processing
• Time correction is performed once every 1 s (during recording, once every 30 s).
• If the time variation is 16 ms or less during recording, time correction is performed every second
with ms-order precision. If the time variation is greater than 16 ms, a GPS Err event occurs, and
time correction is not performed.
• When synchronizing the time among multiple PW3198 instruments, 200 ms aggregation start
times may vary for up to 10 minutes from the start of recording.
GPS event function
When recording is started in the time-corrected state (while the GPS mark is blue), a GPS event
is generated when any of the following occur during recording:
• GPS error (GPS error): GPS IN
• GPS error cleared (GPS positioning): GPS OUT
• GPS time correction failure (GPS time error): GPS Err
13.9 Other Functions
Warning functions
Out of range
When the input exceeds the range by 130%, displays ---.---.
Phase/line voltage setting is irrelevant.
Out of crest factor
When the waveform peak exceeds 2 the voltage range or 4 the current range, "crest factor exceeded" is displayed. The phase/line voltage setting is irrelevant.
10
198
13.10 Calculation Formula
13.10 Calculation Formula
RMS voltage refreshed each half-cycle (Urms1/2), Dip (Dip), Swell (Swell), interruption (Intrpt), RMS current refreshed each half-cycle (Irms1/2), inrush current (Irms1/2)
Connection setting
Single-phase 2-wire
1P2W
Items
Urms1/2
Dip
Swell
Intrpt
U1
U2
U1
U4
Uc=
Singlephase 3wire
1P3W
Three-phase 3-wire
3P3W2M
Line-to-line voltage
U12=
M–1
1---M
U4
2
1- M – 1
---( Ucs )
M
U32=
s=0
( U1s )
2
Line-to-line voltage
U12= 1 M – 1
2
----M
s=0
1 M–1
2
----- ( U2s )
M
U23=
( U1s )
s=0
1- M – 1
2
---( U2s )
M
s=0
s=0
U31 is calculated from the
RMS value for (U3s=U2sU1s).
Three-phase
4-wire
3P4W
Three-phase 3-wire
3P3W3M
U31=
U1
U2
U3
U4
With 3P4W2.5E
connections
U2(U2s=-U1s-U3s)
(Assumes U1s +
U2s + U3s = 0.)
1 M–1
2
----- ( U3s )
M
s=0
U4
U4
• For 50/60 Hz measurement, calculated with 1 overlapping waveform each half-cycle.
• For 400 Hz measurement, calculated with 1 waveform (M = number of samples in one 400 Hz period).
Irms1/2 (Inrush current)
I1
I1
I2
I4
Ic=
I4
1 M–1
2
----- ( Ics )
M
Line-to-line voltage
I1=
M–1
1---M
I2=
( I1s )
2
Line-to-line voltage
I1=
M–1
1
----M
s=0
1 M–1
2
----- ( I2s )
M
I2=
I3 is calculated from the
RMS value for (I3s=-I1sI2s).
I3=
s=0
s=0
( I1s )
2
s=0
I1
I2
I3
I4
1 M–1
2
----- ( I2s )
M
s=0
1 M–1
2
----- ( I3s )
M
s=0
I4
I4
• For 50/60 Hz measurement, calculated each half-cycle.
• For 400 Hz measurement, calculated with 1 waveform.
Note) c: measured channel, M: number of samples per period, s: number of sampling points
Voltage Waveform Peak (Upk), Current Waveform Peak (Ipk)
Phase System
Items
Upk+
Upk-
Single Phase 2-wire Single Phase 3-wire
1P2W
1P3W
3-Phase, 3-Wire,
2-Measurement
3P3W2M
Up1
Up1
Up2
Up12
Up23
Up4
Up4
Up4
3-Phase, 3-Wire,
3-Measurement
3P3W3M
Up12
Up23
Up31
Up4
3-Phase, 4-Wire
3P4W
Up1
Up2
Up3
Up
• The maximum positive and negative values are calculated for all points with 10 waveforms (50 Hz measurement) or 12 waveforms (60 Hz measurement). For 400 Hz measurement, the calculation is performed with 80
waveforms.
• The CH4 voltage peak value can be calculated regardless of the connection type.
Ipk+
Ipk-
Ip1
Ip1
Ip2
Ip1
Ip2
Ip4
Ip4
Ip4
Ip1
Ip2
Ip3
Ip4
Ip1
Ip2
Ip3
Ip4
• The maximum positive and negative values are calculated for all points with 10 waveforms (50 Hz) or 12
waveforms (60 Hz). During 400 Hz measurement, the calculation is performed with 80 waveforms.
• The voltage waveform peak for CH4 can be calculated regardless of the connection method.
Note) c: measured channel, M: number of samples per period, s: number of sampling points
199
13.10 Calculation Formula
RMS Voltage (Urms), RMS Current (Irms)
Phase
System
Urms
U1
Line-to-line voltage
U12=
M–1
U1
U2
U4
Uc=
3-Phase, 3-Wire,
2-Measurement
3P3W2M
1
----M
U4
U32=
1- M – 1
2
---( Ucs )
M
( U1s )
3-Phase, 3-Wire,
3-Measurement
3P3W3M
2
Line-to-line voltage
U12=
M–1
1
----M
s=0
( U1s )
3-Phase, 4-Wire
3P4W
Phase voltage
U1
U2
U3
2
s=0
1- M – 1
2
---( U2s )
M
U23=
U31 is calculated from
the RMS value for
(U3s=U2s-U1s).
U31=
U4
U4
U4
Phase voltage
Phase voltage
U1=
Phase voltage
U12=
s=0
1- M – 1
2
---( U2s )
M
s=0
s=0
1 M–1
2
----- ( U3s )
M
s=0
1 M – 1 U1s – U3s 2
----- --------------------------
M
3
1 M–1
2
----- ( U1s – U2s )
M
s=0
U2=
s=0
U23=
1- M – 1 U2s
– U1s- 2
---------------------------
M
3
1- M – 1
2
---( U2s – U3s )
M
s=0
U3=
1
----M
Uave=
1
--- ( U 1 + U2
2
Line-to-line voltage
Uave=1
--- ( U 12 + U 32 )
2
Phase voltage
s=0
U31=
M–1
s=0
– U2s
U3s
--------------------------
3
1 M–1
2
----- ( U3s – U1s )
M
2
s=0
U4
U4
Line-to-line voltage
Uave=
Phase voltage
Uave=1
--- ( U 1 + U 2 + U 3 )
3
1
--- ( U 12 + U23 + U 31 )
3
Phase voltage
Uave=1
--- ( U 1 + U 2 + U 3 )
3
Line-to-line voltage
Uave=
1
--- ( U 12 + U 23 + U 31 )
3
• Calculated with 10 waveforms (50 Hz measurement) or 12 waveforms (60 Hz measurement). For 400 Hz measurement,
the calculation is performed with 80 waveforms.
• For 3-phase 3-wire connections, the phase voltage is calculated so that the neutral point is at the center. The CH4 RMS
voltage can be calculated regardless of the connection type.
Irms
I1
I2
I1
I4
Ic=
I4
1---M
M–1
( Ics )
2
I1
I2
I3 is calculated from
the RMS value for
(I3s=-I1s-I2s).
I4
I1
I2
I3
I4
I1
I2
I3
I4
Iave=1
Iave=1
s=0
Iave=1
--- ( I 1 + I 2 )
2
--- ( I 1 + I 2 )
2
13
Chapter 13 Specifications
Items
Single Phase
3-wire
1P3W
Single Phase 2-wire
1P2W
--- ( I 1 + I 2 + I3 )
3
Iave= 1
--- ( I 1 + I 2 + I 3 )
3
• Calculated with 10 waveforms (50 Hz measurement) or 12 waveforms (60 Hz measurement). For 400 Hz measurement,
the calculation is performed with 80 waveforms.
• The CH4 RMS current can be calculated regardless of the connection type.
Note) c: measured channel, M: number of samples per period, s: number of sampling points
10
200
13.10 Calculation Formula
Active Power (P), Apparent Power (S), Reactive Power (Q)
Phase
System
Items
P
Single Phase 2-wire
1P2W
P1
Pc= 1 M – 1
----M
Single Phase
3-wire
1P3W
3-Phase, 3-Wire,
2-Measurement
3P3W2M
3-Phase, 3-Wire,
3-Measurement
3P3W3M
3-Phase, 4-Wire
3P4W
P1
P2
P1
P2
P1
P2
P3
P1
P2
P3
Psum=P1+P2
Psum=P1+P2
Psum=P1+P2+P3
Psum=P1+P2+P3
( Ucs × Ics )
S=0
• Calculated with 10 waveforms (50 Hz measurement) or 12 waveforms (60 Hz measurement). For 400 Hz measurement, the calculation is performed with 80 waveforms.
• For 3P3W3M and 3P4W systems, phase voltage is used for waveform voltage Ucs.
(3P3W3M: U1s=(U1s-U3s)/3, U2s=(U2s-U1s)/3, U3s=(U3s-U2s)/3)
• The polarity sign for active power indicates power flow direction: positive (+P) for forward power (consumption), and
negative (-P) for reverse power (regeneration), and indicates net current flow for power.
S
S1
S1
S2
S1
S2
Ssum=S1+S2
Ssum= 3
Sc= Uc×Ic
(When P>, make P =S.)
------- ( S 1 + S 2 )
2
S1
S2
S3
S1
S2
S3
Ssum=S1+S2+S3
Ssum=S1+S2+S3
For 3P3W3M and 3P4W systems, phase voltage is used for waveform voltage Uc.
Q
Q1
Qc= sic Sc 2 – Pc 2
Q1
Q2
Q1
Q2
Q1
Q2
Q3
Q1
Q2
Q3
Qsum=Q1+Q2
Qsum=Q1+Q2
Qsum=Q1+Q2+Q3
Qsum=Q1+Q2+Q3
• The polarity sign (sic) for reactive power (Q) is indicated by [none] for lag or [-] for lead.
• The reverse of the fundamental wave reactive power (using k = 1 (1st order)) after calculating the harmonic reactive power
for each measurement channel (c) is used as the polarity sign sic. (See the harmonic reactive power formula.)
Note) c: measured channel, M: number of samples per period, s: number of sampling points
201
13.10 Calculation Formula
Power factor (PF), Displacement power factor (DPF)
PF
Single Phase
2-wire
1P2W
PF1
Pc
PFc= sic ------
Single Phase 3-wire
1P3W
3-Phase, 3-Wire,
2-Measurement
3P3W2M
PF1
PF2
PF1
PF2
PF1
PF2
PF3
Sc
PFsum=
P sum
sisum ----------S sum
PFsum=
3-Phase, 3-Wire,
3-Measurement
3P3W3M
P sum
sisum ----------S sum
PFsum=
3-Phase, 4-Wire
3P4W
PF1
PF2
PF3
P sum
sisum ----------S sum
PFsum=
P sum
sisum ----------S sum
• The polarity symbol si for power factors indicates a LEAD or LAG in polarity; no symbol indicates a LAG, while the "-"
symbol indicates a LEAD.
• Calculate the harmonic reactive power using the polarity symbol sic and attach the opposit symbol for the fundamental
wave reactive power (using k = 1 (1st order) for each measured channel (c)).
• Calculate the harmonic reactive power using the polarity symbol sisum and attach the opposite symbol of the sum of
the fundamental wave reactive power (using k = 1 (1st order)). (See the harmonic reactive power formula.)
DPF
DPF1
DPFc= sic cos θ c1
DPF1
DPF2
DPF1
DPF2
DPF1
DPF2
DPF3
DPF1
DPF2
DPF3
DPFsum=
DPFsum=
DPFsum=
DPFsum=
P sum1
sisum -------------S sum1
P sum1
sisum ------------S sum1
P sum1
sisum ------------S sum1
P sum1
sisum -------------S sum1
13
Chapter 13 Specifications
Phase
System
Items
• The polarity symbol si of power factors indicates a LEAD or LAG in polarity; no symbol indicates a LAG,
• while the "-" symbol indicates a LEAD.
• Calculate the harmonic reactive power using the polarity symbol sic and attach the opposit symbol for the fundamental
wave reactive power (using k = 1 (1st order) for each measured channel (c)).
• Calculate the harmonic reactive power using the polarity symbol sisum and attach the opposite symbol for the sum of
the fundamental wave reactive power (using k = 1 (1st order)). (See the harmonic reactive power formula.)
• θc1 indicates the voltage-current phase difference for the fundamental wave. (See the voltage-current phase difference
formula.)
• Psum1 indicates the total of fundamental wave power and the formula becomes k = 1 for the sum of harmonic power.
(See the harmonic power formula.)
• Ssum1 indicates the total of fundamental wave apparent power and can be calculated using the fundamental wave
RMS voltage and fundamental wave RMS current. (For information on the formulae for harmonic voltage, harmonic
current, and the sum of apparent power, see.)
Note) c: measured channel, k: order for analysis
10
202
13.10 Calculation Formula
Voltage unbalance factor, Current unbalance factor
Phase
System
Single
Phase
2-wire
1P2W
Single
Phase
3-wire
1P3W
3-Phase, 3-Wire,
2-Measurement
3P3W2M
3-Phase, 3-Wire,
3-Measurement
3P3W3M
3-Phase, 4-Wire
3P4W
Voltage
unbalance factor
Uunb0 [%]
Uzero
Uunb0 = ---------------- × 100
Upos
Uzero
Uunb0 = ---------------- × 100
Upos
Uzero
Uunb0 = ---------------- × 100
Upos
Voltage
unbalance factor
Uunb [%]
Same as 3P3W3M
(U31 is computed by
means of vector calculations.)
Items
Uunb =
1 – 3 – 6β- × 100 Uunb =
---------------------------1 + 3 – 6β
where
4
1 – 3 – 6β- × 100
---------------------------1 + 3 – 6β
where
4
4
U12 U 23 U 31
+
+
β = -----------------------------------------------22
2
2
U12 + U 23 + U 31
4
4
4
U 12 U 23 U 31
+
+
β = -----------------------------------------------22
2
2
U 12 + U 23 + U 31
• For U12, U23, and U31, use the fundamental wave RMS voltage from the calculated harmonics results.
• For three-phase 4-wire configurations, this is detected using phase-to-neutral voltage but can be converted and
calculated using line-to-line voltage.
Current
unbalance factor
Iunb0 [%]
Izero
Iunb0 = ------------- × 100
Ipos
Current
unbalance factor
Iunb [%]
Izero
Iunb0 = ------------- × 100
Ipos
Same as 3P3W3M
(I31 is computed by
Iunb =
means of vector calculations.)
1 – 3 – 6β- × 100
---------------------------1 + 3 – 6β
Izero
Iunb0 = ------------- × 100
Ipos
Iunb =
where
4
I 12
4
I 23
1 – 3 – 6β
----------------------------- × 100
1 + 3 – 6β
where
4
I31
+
+
β = ----------------------------------------22
2
2
I 12 + I 23 + I31
4
4
4
I 12 I 23 I31
+
+
β = ----------------------------------------22
2
2
I 12 + I 23 + I31
• For I12, I23, and I31, use the fundamental wave RMS current (line-to-line current) from the calculated harmonics
results.
• For three-phase 3-wire and three-phase 4-wire configurations this is detected using phase current, but can be converted and calculated using line-to-line current.
Voltage zero-phase component Uzero [V]
1
Uzero = --3
2
( U1 • cos ( α ) + U2 • cos ( β + seq2 ) + U3 • cos ( ϒ + seq3 ) ) + ( U1 • sin ( α ) + U2 • sin ( β + seq2 ) + U3 • sin ( ϒ + seq3 ) )
2
The fundamental RMS voltage (phase voltage) from harmonic calculations is used for U1, U2, and U3.
For 3-phase 3-wire connections, the value is detected as a line voltage and then converted to a phase voltage.
At the zero-phase, seq2=0°, seq3=0°
α=U1 phase angle, β=U2 phase angle, γ=U3 phase angle
Voltage positive-phase component Upos [V]
1
Upos = --3
2
( U1 • cos ( α ) + U2 • cos ( β + seq2 ) + U3 • cos ( ϒ + seq3 ) ) + ( U1 • sin ( α ) + U2 • sin ( β + seq2 ) + U3 • sin ( ϒ + seq3 ) )
2
The fundamental RMS voltage (phase voltage) from harmonic calculations is used for U1, U2, and U3.
For 3-phase 3-wire connections, the value is detected as a line voltage and then converted to a phase voltage.
At the positive-phase, seq2=120°, seq3=240°
α=U1 phase angle, β=U2 phase angle, γ=U3 phase angle
Voltage negative-phase component Uneg [V]
1
Uneg = --3
2
( U1 • cos ( α ) + U2 • cos ( β + seq2 ) + U3 • cos ( ϒ + seq3 ) ) + ( U1 • sin ( α ) + U2 • sin ( β + seq2 ) + U3 • sin ( ϒ + seq3 ) )
The fundamental RMS voltage (phase voltage) from harmonic calculations is used for U1, U2, and U3.
For 3-phase 3-wire connections, the value is detected as a line voltage and then converted to a phase voltage.
At the negative-phase, seq2=240°, seq3=120°
α=U1 phase angle, β=U2 phase angle, γ=U3 phase angle
2
203
13.10 Calculation Formula
Current zero-phase component Izero [A]
Izero
The fundamental RMS current (phase current) from harmonic calculations is used for I1, I2, and I3.
At the zero-phase, seq2=0°, seq3=0°
α=I1 phase angle, β=I2 phase angle, γ=I3 phase angle
Current positive-phase component Ipos [A]
Ipos
1
2
2
= --- ( I1 • cos ( α ) + I2 • cos ( β + seq2 ) + I3 • cos ( ϒ + seq3 ) ) + ( I1 • sin ( α ) + I2 • sin ( β + seq2 ) + I3 • sin ( ϒ + seq3 ) )
3
The fundamental RMS current (phase current) from harmonic calculations is used for I1, I2, and I3.
At the positive-phase, seq2=120°, seq3=240°
α=I1 phase angle, β=I2 phase angle, γ=I3 phase angle
13
Chapter 13 Specifications
1
2
2
= --- ( I1 • cos ( α ) + I2 • cos ( β + seq2 ) + I3 • cos ( ϒ + seq3 ) ) + ( I1 • sin ( α ) + I2 • sin ( β + seq2 ) + I3 • sin ( ϒ + seq3 ) )
3
Current negative-phase component Ineg [A]
Ineg
1
2
2
= --- ( I1 • cos ( α ) + I2 • cos ( β + seq2 ) + I3 • cos ( ϒ + seq3 ) ) + ( I1 • sin ( α ) + I2 • sin ( β + seq2 ) + I3 • sin ( ϒ + seq3 ) )
3
The fundamental RMS current (phase current) from harmonic calculations is used for I1, I2, and I3.
At the negative-phase, seq2=240°, seq3=120°
α=I1 phase angle, β=I2 phase angle, γ=I3 phase angle
10
204
13.10 Calculation Formula
Harmonic Voltage (Uharm), Harmonic Current (Iharm), Inter-harmonic voltage
(Uiharm), Inter-harmonic current (Iiharm)
Phase System
Single Phase 2-wire
1P2W
Items
Uharm[Vrms]=Uck
(including adjacent inter-harmonic components)
U1k
U4k
U’ck=
2
2
{ ( Uckr ) + ( Ucki ) }
Single
Phase
3-wire
1P3W
3-Phase,
3-Phase,
3-Wire,
3-Wire,
2-Measure- 3-Measurement
ment
3P3W2M
3P3W3M
U1k
U2k
U12k
U32k
U4k
U4k
U12k
U23k
U31k
U4k
3-Phase,
4-Wire
3P4W
U1k
U2k
U3k
U4k
1
Uck=
′2
U c ( ( 10k + n ) ⁄ 10 )
n = –1
• For 3-phase 3-wire connections, indicates the result of harmonic calculations using the
line voltage. For 3-phase 4-wire connections, indicates the result of harmonic calculations
using the phase voltage.
• The harmonic voltage content percentage is calculated by dividing the harmonic voltage
component for the specified order by the fundamental voltage component and multiplying
by 100.
• For 60 Hz measurement, the value 10 in the formula is replaced with 12. For 400 Hz measurement, the value 10 in the formula is replaced with 80.
• When K = 0, the Uc0 component is treated as DC for order 0.
Iharm[Arms]=Ick
(including adjacent inter-harmonic components)
I1k
I4k
I’ck=
2
2
{ ( Ickr ) + ( Icki ) }
I1k
I2k
I1k
I2k
I4k
I4k
I1k
I2k
I3k
I4k
I1k
I2k
I3k
I4k
1
Ick=
′2
I c ( ( 10k + n ) ⁄ 10 )
n = –1
• The harmonic current content percentage is calculated by dividing the harmonic current
component for the specified order by the fundamental current component and multiplying
by 100.
• When using 60 Hz, the number "10" in the expression above is "12." When using 400 Hz,
the number "10" in the expression above is "80."
• When K = 0, the Ic0 component is treated as DC for order 0.
Uiharm[Vrms]=Uck
U1k
U4k
U’ck=
2
2
{ ( Uckr ) + ( Ucki ) }
U1k
U2k
U12k
U32k
U4k
U4k
U12k
U23k
U31k
U4k
U1k
U2k
U3k
U4k
3
Uck=
′2
U c ( ( 10k + n ) ⁄ 10 )
n = –3
• The values 3 and -3 in the formula apply to 50 Hz measurement and are replaced with 4
and -4 for 60 Hz measurement. In the formula, k = 0.5, 1.5, 2.5, 3.5,...
• For 3-phase 3-wire connections, indicates the result of harmonic calculations using the
line voltage. For 3-phase 4-wire connections, indicates the result of harmonic calculations
using the phase voltage.
• The inter-harmonic voltage content percentage is calculated by dividing the inter-harmonic
voltage component for the specified order by the fundamental voltage component and
multiplying by 100.
• For 60 Hz measurement, the value 10 in the formula is replaced with 12.
205
13.10 Calculation Formula
Harmonic Voltage (Uharm), Harmonic Current (Iharm), Inter-harmonic voltage
(Uiharm), Inter-harmonic current (Iiharm)
Single Phase 2-wire
1P2W
Items
Iiharm[Arms]=Ick
I1k
I4k
I’ck=
2
2
{ ( Ickr ) + ( Icki ) }
Single
Phase
3-wire
1P3W
I1k
I2k
I1k
I2k
I4k
I4k
I1k
I2k
I3k
I4k
3-Phase,
4-Wire
3P4W
I1k
I2k
I3k
I4k
3
Ick=
′2
I c ( ( 10k + n ) ⁄ 10 )
n = –3
• The values 3 and -3 in the formula apply to 50 Hz measurement and are replaced with 4
and -4 for 60 Hz measurement. In the formula, k = 0.5, 1.5, 2.5, 3.5, ...
• For 60 Hz measurement, the value 10 in the formula is replaced with 12.
• The inter-harmonic current content percentage is calculated by dividing the inter-harmonic
current component for the specified order by the fundamental current component and multiplying by 100.
13
Chapter 13 Specifications
Phase System
3-Phase,
3-Phase,
3-Wire,
3-Wire,
2-Measure- 3-Measurement
ment
3P3W2M
3P3W3M
Note) c: Measurement channel, k: Order of analysis, r: resistance after FFT, i: reactance after FFT
However, for 60 Hz measurement, the value 10 in the formula is replaced with 12.
10
206
13.10 Calculation Formula
Harmonic Power (Pharm), Harmonic Reactive Power (Qharm), K Factor (KF)
Phase System
Items
Pharm[W]=Pck
Single Phase 2wire
1P2W
Single
Phase
3-wire
1P3W
P1k
P2k
P1k
3-Phase,
3-Wire,
2-Measurement
3P3W2M
P1k
P2k
Pck=
Uckr×Ickr+Ucki×Icki
3-Phase, 3-Wire, 3-Measurement
3P3W3M
P1k=
1
1
--- ( U 1kr – U 3kr ) × I1kr + --- ( U 1ki – U 3ki ) × I 1ki
3
3
3-Phase,
4-Wire
3P4W
P1
P2
P3
P2k=
1
1
--- ( U 2kr – U 1kr ) × I2kr + --- ( U 2ki – U 1ki ) × I 2ki
3
3
P3k=
1
1
--- ( U 3kr – U 2kr ) × I3kr + --- ( U 3ki – U 2ki ) × I 3ki
3
3
Psumk=
P1k+P2k
Psumk=
P1k+P2k
Psumk=
P1k+P2k+P3k
Psumk=
P1k+P2k+P3k
• The harmonic power content percentage is calculated by dividing the harmonic power component for the
specified order by the absolute value of the fundamental power component and multiplying by 100.
• For 3P3W2M and 3P3W3M connections, CH1 to CH3 values are used only for internal calculations.
Only for use with internal calculation
Qharm[var]=Qck
Q1k
Q2k
Q1k
Q1k
Q2k
Qck=
Uckr×Icki-Ucki×Ickr
Q1k=
1
1
--- ( U 1kr – U 3kr ) × I 1ki – --- ( U 1ki – U 3ki ) × I1kr
3
3
Q1
Q2
Q3
Q2k=
1
1
--- ( U 2kr – U 1kr ) × I 2ki – --- ( U 2ki – U 1ki ) × I2kr
3
3
Q3k=
1--1
( U – U 2kr ) × I 3ki – --- ( U 3ki – U 2ki ) × I3kr
3 3kr
3
KF[ ]
KF1
KF4
KFc=
k2 × I 2
ck
k = 1
----------------------------------50
50
Qsumk=
Q1k+Q2k
Qsumk=
Q1k+Q2k
Qsumk=
Q1k+Q2k+Q3k
Qsumk=
Q1k+Q2k+Q3k
KF1
KF2
KF1
KF2
KF4
KF4
KF1
KF2
KF3
KF4
KF1
KF2
KF3
KF4
2
Ick
k=1
• The K factor is also called the multiplication factor, and indicates the power loss using the harmonic RMS current for the electrical transformer.
Note) c: Measurement channel, k: Order of analysis, r: resistance after FFT, i: reactance after FFT
207
13.10 Calculation Formula
Total Harmonic Voltage Distortion Factor (Uthd-F, Uthd-R) and Total Harmonic Current Distortion Factor (Ithd-F, Ithd-R)
Items
Uthd-F[%]
Single Phase 2-wire
1P2W
THDUF1
THDUF4
THDUFc=
K
( Uck )
2
Single Phase
3-wire
1P3W
THDUF1
THDUF2
THDUF12
THDUF32
THDUF4
THDUF4
THDUF12
THDUF23
THDUF31
THDUF4
3-Phase,
4-Wire
3P4W
THDUF1
THDUF2
THDUF3
THDUF4
k=2
------------------------------- × 100
U c1
• For 3-phase 3-wire connections, indicated values represent harmonic calculation results obtained
using line voltage.
• The value K in the equation indicates the total number of analyzed orders.
Ithd-F[%]
THDIF1
THDIF4
THDIFc=
K
( Ick )
2
THDIF1
THDIF2
THDIF1
THDIF2
THDIF4
THDIF4
THDIF1
THDIF2
THDIF3
THDIF4
13
Chapter 13 Specifications
Phase System
3-Phase,
3-Phase,
3-Wire,
3-Wire,
2-Measurement 3-Measurement
3P3W2M
3P3W3M
THDIF1
THDIF2
THDIF3
THDIF4
k=2
----------------------------- × 100
I c1
• The value K in the equation indicates the total number of analyzed orders.
Uthd-R[%]
THDUR1
THDUR4
THDURc=
K
( Uck )
2
THDUR1
THDUR2
THDUR12
THDUR32
THDUR4
THDUR4
THDUR12
THDUR23
THDUR31
THDUR4
THDUR1
THDUR2
THDUR3
THDUR4
k=2
------------------------------- × 100
K
( Uck )
2
k=1
• For 3-phase 3-wire connections, indicated values represent harmonic calculation results obtained
using line voltage.
• The value K in the equation indicates the total number of analyzed orders.
Ithd-R[%]
THDIR1
THDIR4
THDIRc=
K
( Ick )
2
THDIR1
THDIR2
THDIR1
THDIR2
THDIR4
THDIR4
THDIR1
THDIR2
THDIR3
THDIR4
THDIR1
THDIR2
THDIR3
THDIR4
k=2
----------------------------- × 100
K
( Ick )
2
k=1
• The value K in the equation indicates the total number of analyzed orders.
10
208
13.10 Calculation Formula
Harmonic Voltage Phase Angle (Uphase), Harmonic Current Phase Angle (Iphase),
Phase Difference Of Harmonic Voltage And Harmonic Current (Pphase)
Phase System
Single Phase 2-wire
1P2W
Items
Uphase[deg]=θUk
θU1k
θU4k
Uckr
θUck=tan-1 ---------------
Single Phase 3-wire
1P3W
θU1k
θU2k
3-Phase, 3-Wire,
2-Measurement
3P3W2M
θU12k
θU32k
– Ucki θU4k
3-Phase, 3-Wire,
3-Measurement
3P3W3M
θU12k
θU23k
θU31k
θU4k
θU4k
3-Phase, 4-Wire
3P4W
θU1k
θU2k
θU3k
θU4k
• For 3-phase 3-wire connections, indicated values represent harmonic calculation results obtained using line voltage.
• The harmonic voltage phase angle is displayed after correction using the reference channel’s fundamental
wave to 0°.
• When Uckr=Ucki=0, θuk=0°
• The harmonic voltage used in calculations is calculated using only whole-number orders.
Iphase[deg]=θIk
θI1k
θI4k
Ickr
θIck=tan-1 -------------
– Icki
θI1k
θI2k
θI1k
θI2k
θI4k
θ4k
θI1k
θI2k
θI3k
θI4k
θI1k
θI2k
θI3k
θI4k
• The harmonic voltage phase angle is displayed after correction using the reference channel’s fundamental
wave to 0°.
• When Ickr=Icki=0, θIk=0°
• The harmonic voltage used in calculations is calculated using only whole-number orders.
Pphase[deg]=θk
θ1k
θ1k
θ2k
θck=θcIk-θcUk
θ1k
θ2k
θ3k
Qsumk
Psumk
Qsumk
Psumk
Qsumk
Psumk
Qsumk
Psumk
θsum=tan-1 ------------------ θsum=tan-1 ------------------ θsum=tan-1 ------------------ θsum=tan-1 ------------------
• When Psumk=Qsumk=0, θk=0°
• Psumk indicates the total harmonic power (see the equations for harmonic power).
• Qsumk indicates total harmonic reactive power (see the equations for harmonic reactive power).
Note: c: measurement channel; k: order of analysis; r: resistance after FFT; i: reactance after FFT
Voltage Flicker (dV10), Short Interval Voltage Flicker (Pst), and Long Interval Voltage
Flicker (Plt)
Phase System
Single Phase 2-wire
1P2W
Items
dV10=ΔV10
ΔV10(1)
100
ΔV10(c)= --------2
Uf
( an × ΔUn )
2
Single Phase
3-wire
1P3W
3-Phase,
3-Wire,
2-Measurement
3P3W2M
3-Phase,
3-Wire,
3-Measurement
3P3W3M
ΔV10(1)
ΔV10(2)
ΔV10(12)
ΔV10(32)
ΔV10(12)
ΔV10(23)
ΔV10(31)
3-Phase,
4-Wire
3P4W
ΔV10(1)
ΔV10(2)
ΔV10(3)
• Uf represents the reference voltage for voltage flicker and indicates the 1-minute average of RMS voltage values.
• an represents the flicker luminosity coefficient corresponding to the fluctuation frequency fn [Hz] calculated from
the flicker luminosity curve.
• ΔUn represents the voltage fluctuation in fn.
Pst
Pst1
Pst2
Pst1
Pstc=
Pst1
Pst2
K 1 P 0.1 + K 2 P 1s + K 3 P 3s + K 4 P 10s + K 5 P 50s
Pst1
Pst2
Pst3
Pst1
Pst2
Pst3
• Indicates values for K1=0.0314, K2=0.0525, K3=0.0657, K4=0.28, and K5=0.08.
• Calculations are performed using a 1,024-class cumulative probability function (CPF).
• Results are calculated from cumulative probability (Pi) values using linear interpolation, smoothed using the following methods, and used to calculate the cumulative probability (Pis):
P1s=(P0.7+P1+P1.5)/3, P3S=(P2.2+P3+P4)/3, P10s=(P6+P8+P10+P13+P17)/5, P50s=(P30+P50+P80)/3
Plt
Plt1
Pltc=
N
( Pstn )
3 n=1
3
----------------------------N
Plt1
Plt2
Plt1
Plt2
Plt1
Plt2
Plt3
Plt1
Plt2
Plt3
• N indicates the number of measurements (N=12). (When N<12, the number of measurements is used as N.)
Note: c: measurement channel
209
13.10 Calculation Formula
Active energy (WP), reactive energy (WQ)
Phase System
3-Phase,
3-Wire,
2-Measurement
3P3W2M
WP+
WP1+=
WPsum+=
• h: measurement period; k: coefficient for converting to 1 hour
• (+): Value is only used when positive (consumption).
WPWP1-=
WPsum+=
• h: measurement time, k: coefficient converted to 1 hour
• (-): Value is only used when negative (regeneration).
3-Phase,
3-Wire,
3-Measurement
3P3W3M
3-Phase,
4-Wire
3P4W
13
Chapter 13 Specifications
Items
Single Phase 2-wire
1P2W
Single Phase
3-wire
1P3W
WQLAG
WQLag=
WQLAG=
• h: measurement time, k: coefficient converted to 1 hour
• (+): Value is only used when positive (lag).
WQLEAD
WQLEAD=
WQLEAD=
• h: measurement time, k: coefficient converted to 1 hour
• (-): Value is only used when negative (lead).
10
210
13.10 Calculation Formula
Average calculation
Average calculation methods
CH1 to 4
sum/AVG
Comment
Freq
Signed average
-
Upk
Signed average
-
Ipk
Signed average
-
Urms
RMS
Average results for all channels are averaged.
Irms
RMS
Average results for all channels are averaged.
Udc
Signed average
Same as Freq10s.
-
Idc
Signed average
-
P
Signed average
Average results for all channels are totaled.
S
Signed average
Average results for all channels are totaled.
Q
Signed average
Average results for all channels are totaled.
PF/DPF
See Note 1.
Sum value is calculated using the
formula described in Note 1 below.
This calculation is used for both PF and DPF.
Uunb
RMS
-
Same applies to Uunb0.
Iunb
RMS
-
Same applies to Iunb0.
Uharm
RMS
-
For content percentage and order 0, signed average.
Same applies to Uiharm.
Iharm
RMS
-
For content percentage and order 0, signed average.
Same applies to Iiharm.
Pharm
Signed average
Average results for all channels are to- The content percentage is calculated from the sum value
taled.
calculated from the level.
Uphase
See *2 below.
See *2 below.
Iphase
See *2 below.
See *2 below.
Pphase
See *2 below.
See *2 below.
Uthd
Calculated from RMS
value of RMS values.
-
This calculation is used for both THD-F and THD-R.
Ithd
Calculated from RMS
value of RMS values.
-
This calculation is used for both THD-F and THD-R.
KF
Signed average
-
UharmH
RMS
-
IharmH
RMS
-
Signed average: Signs of values are included in average calculation.
"(AVG)" following a parameter indicates the average result.
*1 PF/DPF average calculation
Addition processing
: If the power factor value is negative, it is multiplied by (-1). If the power factor value is positive, it is multiplied by
(-1), and the value 2 is added. The resulting value is integrated.
Averaging processing : The result of addition processing described above is divided by the number of added data points. If the result is
less than 1, it is multiplied by (-1). If it is greater than or equal to 1, it is multiplied by (-1), and the value 2 is added.
*2 Phase average calculation
Uphase average calculation
Uckr and Ucki represent the signed averages for each channel.
Iphase average calculation
I
Ickr and Icki represent the signed averages for each channel.
Pphase average calculation
(Channel averaging processing) :
Qharmk and Pharmk represent the signed averages for each channel.
(Sum averaging processing)
Qsumk and Psumk represent the signed averages for each channel.
:
211
13.11 Clamp Sensors and Ranges
13
13.11 Clamp Sensors and Ranges
When using 0.1 mV/A (5,000 A) clamp sensors
Current range
500.00 A
5.0000 kA
Voltage
Current range
50.000 A
500.00 A
30.000k
300.00k
Voltage
600.00 V
300.00k
3.0000M
When using 9660 sensors
Current range
50.000 A
600.00 V
When using 10 mV/A (50 A) sensors and
9694 sensors
100.00 A
Voltage
Current range
5.0000 A
50.000 A
3.0000k
30.000k
Voltage
600.00 V
30.000k
60.000k
When using 100 mV/A (5 A) clamp sensors
Current range
500.00 mA
600.00 V
When using 9667 sensors in the 5,000 A
range
5.0000 A
Voltage
Current range
500.00 A
5.0000 kA
300.00k
3.0000M
Voltage
600.00 V
300.00
3.0000k
When using 9667 sensors in the 500 A range
Current range
50.000 A
600.00 V
When using 9669 sensors
500.00 A
Voltage
600.00 V
When using 1 mV/A (500 A) sensors and
9661 sensors
Chapter 13 Specifications
These values are applied to the active power (unit: W), apparent power (unit: VA), and reactive power (unit:
var) for each channel.
Current range
100.00 A
1.0000 kA
60.000k
600.00k
Voltage
30.000k
300.00k
600.00 V
10
212
13.11 Clamp Sensors and Ranges
The instrument's current ranges are as follows:
Current
range
0.1 mV/A
500A, 5000A
1 mV/A (9661)
50A, 500A
1 mV/A (9660)
50A, 100A
10 mV/A (9694)
5A, 50A
100 mV/A
0.5A, 5A
5000 A 9667
500A, 5000A
500 A 9667
50A, 500A
1000 A 9669
100A, 1000A
The display range and valid measurement range (guaranteed accuracy range) for each current range are as
follows:
Input
voltage
入力電圧
Current range
○電流レンジ
5500A
Effective 有効測定範囲
measuring range
5000A
range
5000Aレンジ
7.5A
500A
500Aレンジ
range
0.75A
50A
5000A 6500A
550A
Effective有効測定範囲
measuring range
500A 650A
5A
1A
10A
100A
1000A
10000A
110A
100A
100Aレンジ
range
Effective有効測定範囲
measuring range
150mA
100A 130A
55A
1A
50A
50Aレンジ
range
Effective
measuring range
有効測定範囲
75mA
10mA
50A 65A
500mA
100mA
1A
10A
100A
5.5A
5A range
5Aレンジ
Effective有効測定範囲
measuring range
7.5mA
0.5A
0.5Aレンジ
range
50mA
5A
550mA
6.5A
Effective
measuring range
有効測定範囲
0.75mA
1mA
500mA 650mA
5mA
10mA
Input
current
入力電流
100mA
1A
10A
213
13.12 Block Diagram
13
13.12Block Diagram
High-Speed
Power Analysis
Engine
HiPAC-PQ
Key
Chapter 13 Specifications
Voltage Input Circuit U1 to U3
SD memory
card
Insulated
Voltage Input Circuit U4
Insulated
Current Sensor Input Circuit
10
214
13.12 Block Diagram
215
14.1 Cleaning
Maintenance
and Service
Chapter 14
Instrument
• To clean the instrument/ device/ product, wipe it gently with a soft cloth moistened
with water or mild detergent. Never use solvents such as benzene, alcohol, acetone,
ether, ketones, thinners or gasoline, as they can deform and discolor the case.
• Wipe the LCD gently with a soft, dry cloth.
Clamp Sensor
Measurements are degraded by dirt on the mating surfaces of the clamp-on sensor, so
keep the surfaces clean by gently wiping with a soft cloth.
Chapter 14 Maintenance and Service
14.1 Cleaning
14
216
14.2 Trouble Shooting
14.2 Trouble Shooting
Before having the instrument repaired or inspected, check the information described in "Before having
the instrument repaired" (p.217) and "14.3 Error Indication" (p.218).
Inspection and Repair
Do not attempt to modify, disassemble or repair the instrument; as fire, electric
shock and injury could result.
• If damage is suspected, check the "Before having the instrument repaired" (p.217) section before contacting your dealer or Hioki representative.
However, in the following circumstances, you should stop using the instrument, unplug the power cord,
and contact your nearest Hioki distributor:
• When you are able to confirm that the instrument is damaged
• When you are unable to make measurements
• When the instrument has been stored for an extended period of time in a hot, humid, or otherwise
undesirable environment
• When the instrument has been subjected to the stress of being transported under harsh conditions
• When the instrument has gotten wet or soiled with oil or dust (ingress of water, oil, or dust into the
enclosure may cause electrical insulation to deteriorate, increasing the hazard of electric shock or fire)
When transporting the instrument
When transporting the instrument, use the original packing materials in which it was shipped, and pack in
a double carton. Pack the instrument so that it will not sustain damage during shipping, and include a
description of existing damage. We do not take any responsibility for damage incurred during shipping.
Replaceable Parts and Operating Lifetimes
Certain parts require replacement periodically and at the end of their useful life: (Useful life depends on
the operating environment and frequency of use. Operation cannot be guaranteed beyond the following
periods)
Part
Life
Remarks
Electrolytic Capaci- Approx. 10 years
tors
The service life of electrolytic capacitors varies with the operating environment. Requires periodic replacement.
Lithium battery
The instrument contains a built-in backup lithium battery, which offers a
service life of about ten years. If the date and time deviate substantially
when the instrument is switched on, it is the time to replace that battery.
Contact your dealer or Hioki representative.
Approx. 10 years
LCD backlight (50% Approx. 50,000 hr
drop-off in brightness)
Requires periodic replacement.
Z1003 Battery Pack Approx. 1 year or
Requires periodic replacement.
approx. 500 charge/
recharge cycles
Z4001 SD Memory
Card 2GB
Data storage of
The SD card service life varies with the manner in which it is are used.
approx. 10 years or Requires periodic replacement.
approx. 2 million
rewrites
217
14.2 Trouble Shooting
Before having the instrument repaired
Before returning for repair
Symptom
Check Item, or Cause
Remedy and Reference
Verify that the power cord is connected
properly.
Keys do not work.
Has the key lock been activated?
Press and hold the ESC key for at least 3
seconds to cancel the key lock.
Cannot print.
Has recording paper been properly loaded into
the printer?
Is the printer configured properly (baud rate,
interface, etc.)?
Is the instrument connected to the printer with
the appropriate cable?
See: "3.4 Connecting the AC Adapter" (p.32)
-
Voltage or current Are the voltage cords or clamp sensors con- Verify connections.
measured
values nected improperly?
See: "3.6 Connecting the Voltage Cords" (p.34)
to "4.6 Verifying Correct Wiring (Connecare not being distion Check)" (p.48)
played.
Are the input channels and display channels
incorrect?
The instrument cannot measure the frequency.
Measured values do
not stabilize.
Is the input frequency within the guaranteed
accuracy range?
For a measurement frequency of 50 Hz, 40 to 48
Hz
For a measurement frequency of 60 Hz, 51 to 70
Hz
For a measurement frequency of 400 Hz, 360 to
440 Hz
Measurement cannot be performed if the input
frequency is outside the guaranteed accuracy
fundamental wave range.
Is the input frequency lower than the setting?
Is a signal being input to U1?
Stable measurement may not be possible if input
of at least 2% f.s. is not being supplied to U1 (the
reference channel).
When no apparent cause can be established
Perform a system reset.
This will return all settings to their factory defaults.
See: "5.6 Initializing the Instrument (System Reset)" (p.73)
-
-
14
Chapter 14 Maintenance and Service
The display does Has the power cord been disconnected?
not appear when Is it connected properly?
you turn the power
on.
218
14.3 Error Indication
14.3 Error Indication
Any instrument errors are displayed on the screen. If you experience an error, check the appropriate corrective action. To clear the error display, press any key.
Error display
Cause
FPGA initializing error
FPGA initializing error.
DRAM1, 2 error
DRAM error.
SRAM error
SRAM error.
Invalid FLASH.
FLASH error.
Invalid ADJUST.
Adjustment value error.
Invalid Backuped values.
One or more erroneous
backed-up system variables
have created a conflict.
*** CARD ERROR ***
Error while attempting
access the SD Card.
Corrective action/more information
The instrument needs to be repaired. Contact your Hioki
distributor.
Attempted to access a corrupt
to file or corrupt SD memory
card. The SD memory card
was removed while it was
being accessed.
Back up the SD memory card’s contents on a computer
and then format the card with the instrument. Remove
the SD memory card and then insert it again.
See: "9.2 Formatting SD Memory Cards" (p.138),
"3.5 Inserting (Removing) an SD Memory Card"
(p.32)
*** CARD ERROR ***
Save failed.
Attempted to write data to a
write-protected file. The SD
memory card was removed
while data was being saved, or
a similar issue occurred.
Using a computer, check whether the file attributes are
set to read-only. If the attributes are set to read-only,
clear that setting. Check whether the SD memory card is
inserted into the instrument.
See: "3.5 Inserting (Removing) an SD Memory Card"
(p.32)
*** CARD ERROR ***
Load failed.
The file being loaded does not
exist on the SD memory card.
The file being loaded is corrupt.
Update the instrument’s file list. You can update the file
list by accessing another screen, for example by pressing the DF1 key, and then pressing the DF4 key again. If
the file is corrupt, it is recommended to back up the file
on a computer (if possible) and then format the SD
memory card.
See: "9.2 Formatting SD Memory Cards" (p.138)
*** CARD ERROR ***
Formatting failed.
An SD memory card error Reinsert the SD memory card or replace the SD memoccurred, or the SD memory ory card.
card was removed during for- See: "3.5 Inserting (Removing) an SD Memory Card"
matting.
(p.32)
*** CARD ERROR ***
SD Card locked.
The SD
locked.
*** CARD ERROR ***
SD Card full.
Unable to save file due to Delete files to make space or replace the SD memory
insufficient space on the SD card.
memory card.
See: "3.5 Inserting (Removing) an SD Memory Card"
(p.32)
*** CARD ERROR ***
SD Card not found.
No memory card is inserted.
*** CARD ERROR ***
SD Card not compatible.
An unsupported card such as Use a compatible SD memory card.
an SDXC memory card has
been inserted into the instrument.
*** CARD ERROR ***
No readable files found.
Unable to load files in the The [PW3198] folder is created when the SD memory
[PW3198] folder as it has been card is formatted. It is also automatically created when
deleted.
recording is started.
See: "9.2 Formatting SD Memory Cards" (p.138)
memory
card
is Unlock the SD memory card.
Insert an SD memory card.
See: "3.5 Inserting (Removing) an SD Memory Card"
(p.32)
219
14.3 Error Indication
Error display
Cause
Corrective action/more information
If the SD memory card is locked, unlock it. If the file or
folder is set to read-only, change its attributes on a computer and then delete it.
*** CARD ERROR ***
The maximum number of files
Maximum files reached. Addi- that can be created during a
tional files cannot be created. single recording period was
exceeded. The number of settings files exceeded 102. The
number of measurement folders created on a single day
exceeded 100.
Change the event detection items and detection levels to
reduce the number of events that occur. Delete unnecessary
settings files. Delete unnecessary measurement folders.
See: "5.5 Changing Event Settings" (p.66),
"9.6 Saving and Deleting Settings Files (Settings
Data)" (p.144),
"9.4 Saving and Deleting Measurement Data" (p.141)
*** CARD ERROR ***
The SD memory card has not Format the card with the instrument.
SD Card is not formatted for been formatted using the SD See: "9.2 Formatting SD Memory Cards" (p.138)
this device.
format.
*** SETTING ERROR ***
Folder cannot be moved.
Attempted to move to a folder When viewing folders other than the [PW3198] folder,
other than the [PW3198] folder. use the mass storage function or access the card
directly using a computer.
See: "12.1 Downloading Measurement Data Using the
USB Interface" (p.156)
*** OPERATION ERROR *** Attempted
to
delete
the These folders are required for the instrument to operate.
This folder cannot be deleted. [PW3198], [SETTING], or To delete them, use a computer.
[HARDCOPY] folder.
*** CARD ERROR ***
SD-CARD ERROR.
An SD memory card error Contact Hioki with information about the instrument’s
other than those listed above operational status at the time of the error.
occurred.
*** PRINTER ERROR ***
Printer Communication Error
Unable to recognize printer pro- Check whether the printer and RS-232C cable are rectocol or unable to configure ommended models. Verify that the RS-232C cable is
printer. An RS-232C cable error securely connected to the instrument and printer.
may have occurred, or a nonrecommended printer model
may be connected to the instrument.
*** OPERATION ERROR *** Attempted to set a voltage out- Use a nominal input voltage of 50 to 780 V.
Outside of settings range.
side the valid range when
using a user-defined nominal
input voltage.
*** OPERATION ERROR *** Attempted to change a setting If you need to change the settings, stop recording operCannot modify settings while that cannot be changed while ation with the START/STOP key and then reset the
recording is in progress.
recording is in progress.
measurement data with the DATA RESET key.
*** OPERATION ERROR *** Attempted to change a setting If you need to change the settings, reset the measureCannot modify settings while that cannot be changed while ment data with the DATA RESET key.
analyzing is in progress.
analyzing data.
*** OPERATION ERROR *** Attempted to change a setting If you need to change the settings, stop recording operCannot modify settings while that cannot be changed while ation with the START/STOP key. If the instrument is in
waiting is in progress.
in the standby state.
the standby state during repeated recording (after
recording has paused and before recording starts
again), reset the measurement data with the DATA
RESET key after stopping recording operation with the
START/STOP key.
*** OPERATION ERROR *** A key such as the DATA If you need to change the settings, stop recording operOperation not available while RESET key that cannot be ation with the START/STOP key and then reset the
recording is in progress.
used during recording was measurement data with the DATA RESET key.
pressed.
*** OPERATION ERROR *** A key such as the START/ If you need to change the settings, reset the measureOperation not available while STOP key that cannot be used ment data with the DATA RESET key.
analyzing is in progress.
during analysis was pressed.
14
Chapter 14 Maintenance and Service
*** CARD ERROR ***
Unable to delete file or folder.
File or folder could not be
deleted.
220
14.3 Error Indication
Error display
Cause
*** OPERATION ERROR *** A key such as the DATA
Operation not available while RESET key that cannot be
waiting is in progress.
used while in the standby state
was pressed.
Corrective action/more information
In the standby state before recording has begun, stop
recording with the START/STOP key. If the instrument is
in the standby state during repeated recording (after
recording has paused and before recording starts
again), reset the measurement data with the DATA
RESET key after stopping recording operation with the
START/STOP key.
*** OPERATION ERROR *** A key such as the START/ Wait a while and then press the key again.
Recovering from a power inter- STOP key that cannot be used
ruption. Please wait.
while performing power outage
recovery
processing
immediately after the instrument was turned on was
pressed.
*** OPERATION ERROR *** Attempted to change a setting Change the connection (CH4) as necessary.
Settings cannot be modified whose value is constrained by
under present 4ch wiring.
the CH4 setting conditions, for
example by changing a DC
fluctuation event while CH4 is
set to ACDC.
*** OPERATION ERROR *** Attempted to change a setting Change the connection (CH123) as necessary.
Settings cannot be made whose value is constrained by
under present wiring.
the connection, for example by
changing the Urms type
(phase/line
voltage)
while
CH123 is set to 1P2W.
*** OPERATION ERROR *** Attempted to set a sense event Set the sense event after setting the RMS event threshCannot be configured when while the RMS event is in the old.
the RMS level is set to OFF.
OFF state.
*** OPERATION ERROR ***
This operation is unavailable
when using Preset. ESC to
exit.
A key other than F1 to F4, the Exit the quick setup display with the ESC key.
cursor arrows, ENTER, or the
ESC key was pressed on the
quick setup screen.
*** SETTING ERROR ***
Unable to perform quick setup. Check connections, verify that appropriate input is being
Preset configuration could not
provided, and repeat the quick setup process.
be completed.
*** SETTING ERROR ***
Unable to start recording Change the start and stop time and date for real-time
Check the actual time control because the start and stop control.
settings.
time and date for real-time See: "5.2 Changing the Measurement Period" (p.58)
control were set to a time and
date in the past.
*** Zero Adjustment Failed *** Zero adjustment did not termi- Perform zero adjustment again with the instrument in
Zero adjustment failed.
nate normally.
the no-input state. If the instrument is located close to a
noise source, place it further away and repeat zero
adjustment.
Maximum number of record- More than 1,000 events Change the event threshold setting so that the number
able events exceeded.
occurred during the recording of events does not exceed 1,000 during the recording
period.
Consequently, period.
recorded results could not be
saved.
Contact your dealer (agent) or local sales office if a repair should become necessary.
Turning on the instrument while the measurement target line is live may damage the
instrument, causing an error to be displayed when it is turned on. Always turn on the
instrument first and only activate power to the measurement line after verifying that the
instrument is not displaying any errors.
221
14.4 Disposing of the Instrument
14.4 Disposing of the Instrument
The PW3198 uses lithium batteries as a power source for saving measurement conditions.
When disposing of this instrument, remove the lithium battery and dispose of battery and instrument in accordance with local regulations.
Dispose the other options appropriately.
Lithium Battery Removal
You will need: 1 Phillips head screwdriver (No. 2) and 1 pair of tweezers
1. Turn off the instrument’s power switch.
2. Disconnect all cords, including clamp sen-
4. Remove the rear cover and remove the
screw attaching the metal plate.
Rear cover
sors, voltage cords, and the AC adapter.
3. Remove the 11 screws shown in the follow-
ing diagram with the Phillips head screwdriver and remove the battery pack cover
and side covers.
Side covers
Battery pack cover
5. Remove the 2 screws on the front cover.
Chapter 14 Maintenance and Service
• To avoid electric shock, turn off the POWER switch and disconnect the power
cord, voltage cord, and clamp sensor before removing the lithium battery.
• To avoid the possibility of explosion, do not short circuit, disassemble or incinerate battery pack. Handle and dispose of batteries in accordance with local
regulations.
• Keep batteries away from children to prevent accidental swallowing.
14
222
14.4 Disposing of the Instrument
6. Remove the 17 screws shown in the following
diagram and remove the upper chassis.
Upper
chassis
7. Insert the tweezers between the battery
holder and the battery and lift up the
battery to remove it.
Lithium
battery
CALIFORNIA, USA ONLY
This product contains a CR Coin Lithium
Battery which contains Perchlorate Material
- special handling may apply.
See
www.dtsc.ca.gov/hazardouswaste/
perchlorate
A
1
Appendix 1 Procedure for Investigating Power Supply Quality
Appendix
Appendix 1 Procedure for Investigating Power
Supply Quality
By measuring power supply quality parameters, you can assess the power supply's quality and
identify the causes of various power supply malfunctions. The PW3198's ability to measure all
power supply quality parameters simultaneously makes this process a quick and simple one.
This appendix describes the power supply quality investigation process.
Step 1: Identifying a clear objective
1
2
To assess power supply quality (power quality)
(There is no known problem with the power supply, and you simply wish to assess its quality.)
• Periodic power supply quality statistical investigations
• Testing after the installation of electric or electronic equipment
• Load investigation
• Preventive maintenance
To find the cause of a power supply malfunction
(You have discovered a power supply malfunction such as an equipment failure or malfunction
and wish to address it quickly.)
Go to Step 3.
Go to Step 2.
Step 2: Identifying the malfunctioning component (measurement location)
Check the following:
1
Where is the issue occurring?
• Principal electrical system
(Large copier, uninterruptible power supply, elevator, air compressor, air conditioning compressor, battery
charger, cooling system, air handler, time-controlled lighting, variable-speed drive, etc.)
• Electric distribution system
(Conduit [electrical conduit] damage or corrosion, transformer heating or noise, oil leak, circuit breaker
operation or overheating)
When does the issue occur?
• Does it occur continuously, regularly, or intermittently?
• Does it occur at a specific time of day or on a specific day?
Appendix
2
A
2
Appendix 1 Procedure for Investigating Power Supply Quality
3
What type of investigation (measurement) should be performed to find the cause?
(It is recommended to measure voltage, current, and possibly power continuously. By analyzing voltage and
current trends when the issue occurs, it will be easier to pinpoint the cause of the problem. Additionally,
simultaneously measuring multiple locations is an effective way to quickly identify the cause.)
• Electrical substation internal lines (power companies only)
• High or low voltage at a service line entrance
• Distribution boards and switchboards
• Outlets and other points of power supply for electric and electronic equipment
4
What is the expected cause?
• Voltage abnormalities (RMS value fluctuations, waveform distortion, transient voltages, high-order harmonics [noise at frequencies of several kilohertz and above])
• Current abnormalities (leak current, inrush current)
Step 3: Checking investigation (measurement) locations (collecting site data)
Collect information (site data) from as many locations as possible to prepare for the investigation. Check
the following:
1. Connection (1P2W/1P3W/3P3W2M/3P3W3M/3P4W/3P4W2.5E)
2. Nominal input voltage (100 to 600 V)
3. Frequency (50/60 Hz)
4. Need for neutral wire measurement and DC voltage measurement
5. Current capacity (necessary in order to select clamp sensor to use for measurement)
6. Other items related to the facility as a whole (check for presence of other systems with malfunctioning
power supplies, principal electrical system operating cycle, additions or changes to facility equipment,
facility distribution circuitry)
Step 4: Making measurements with the power supply quality analyzer
Measurements are performed using the following procedure:
1. Perform quick setup and adjust the relevant settings.
• Connect the measurement line and select the quick setup according to your objective.(When using the
instrument to identify a power supply malfunction whose cause is unknown, it is recommended to
select the voltage abnormality detection pattern.)
• Verify that the proper connection has been selected on the [SYSTEM] screen and that the settings
have been configured appropriately (nominal input voltage, frequency, range, interval time, etc.). Verify
that events are not being generated too frequently.
• If, based on the information obtained in Steps 2 and 3 above, you find that some necessary settings have
not been configured by the quick setup process, reconfigure them on the [SYSTEM] screen.
• Check instantaneous values (voltage level, voltage waveform, current waveform, voltage waveform
distortion [THD]) on the [VIEW] screen.
2. Start recording.
• Press the START/STOP button to start recording. (Thresholds will have already been set during the
quick setup process.)
• Check the event detection state on the [EVENT] screen. If necessary, cancel recording and change
the settings or thresholds. (If too many events are occurring, you can increase the thresholds based on
measurement results.)
• Continue recording for the necessary period, check the state of the power supply malfunction based on
the detected events, and take corrective action as appropriate. (The PW3198 can be used not only for
the investigation phase, but also to verify the effectiveness of corrective action taken.)
A
3
Appendix 1 Procedure for Investigating Power Supply Quality
Advice for identifying the cause of abnormalities
Record voltage and current trends at the power circuit inlet.
If current consumption in a building is high while the voltage is low, the cause likely lies inside the building. If the voltage and current are both low, the cause is likely to lie outside the building. It's extremely
important to select the right measurement locations and to measure current.
Check power trends.
Overloaded equipment can cause problems. By understanding power trends, you can more easily identify problematic equipment and locations.
Check when the problem occurs.
Equipment that is operating or turning off or on when abnormalities (events) are recorded may be problematic. By understanding the precise times at which abnormalities (events) start and stop, you can more
easily identify problematic equipment and locations.
Check for heat and unusual sounds.
Motors, transformers, and wiring may produce heat or unusual sounds due to causes such as overloading or harmonics.
Appendix
A
4
Appendix 2 Explanation of Power Supply Quality Parameters and Events
Appendix 2 Explanation of Power Supply Quality
Parameters and Events
Power supply quality parameters are necessary in order to investigate and analyze the phenomenon of power supply problems*. By measuring these parameters, it is possible to assess power
supply quality. In order to allow the PW3198 to detect abnormal values and abnormal waveforms,
you set thresholds. When these thresholds are exceeded, events are generated.
*: Thresholds are set based on an estimation of abnormal values, so events do not necessarily indicate a
problem.
Principal
parameters
indicating
power quality
Waveform
PW3198 events and
measurements
Phenomenon
Primary issues
Frequency
fluctuations
Occurs due to line
separation caused by
changes in the supply/
demand balance of
active power, the shutdown of a high-capacity generator, or circuit
issues.
Changes in the speed
of synchronized
motors may cause
product defects.
Events are detected
using frequency (Freq)
and frequency cycle
(Freq_wav). Measurement items include
IEC61000-4-30 10second average frequency and 10-second
frequency (Freq10s).
Transient
overvoltage
(impulse)
Occurs due to phenomena such as lightning, breaker point
damage, or closure on
the circuit breaker or
relay.
Often occurs when
there is a radical
change in voltage or
when the peak voltage is high.
Close to the source of
the break, the device's
power is damaged
because of exceptionally high voltages and
this may cause the
device to reset.
Events involving transients of 5 kHz or
more are detected
using transient overvoltage. They can also
be detected as voltage
waveform distortions
using voltage waveform peak and voltage
waveform comparison
functionality.
Voltage dip
(SAG)
Most dips are caused
by natural phenomena such as lighting.
When an equipment
fault is detected and
taken offline due to the
occurrence of a power
system ground fault or
short-circuit, a large
inrush current caused
by a motor startup or
other load can occur,
causing a temporary
voltage dip.
Dips in the supply volt- Events are detected
age can cause equip- using dips.
ment to stop operating
or be reset, discharge
lamps to turn off, electric motors to increase
or decrease in speed
or stop, or synchronized motors and generators to lose
synchronization.
A surge in voltage may Events are detected
cause the device's
using swells.
power to be damaged
or the device to reset.
Voltage swell
(SURGE)
Swells occur when the
voltage rises momentarily, for example when
a power line turns on or
off due to lightning or a
heavy load, when a
high-capacity capacitor
bank is switched, when
a one-line ground
occurs, or when a highcapacity load is cut off.
This phenomenon also
includes voltage surges
due to grid-tied dispersed power supplies
(solar power, etc.).
A
5
Appendix 2 Explanation of Power Supply Quality Parameters and Events
Principal
parameters
indicating
power quality
Waveform
Phenomenon
Primary issues
PW3198 events and
measurements
Flicker consists of voltage fluctuations resulting from causes such
as blast furnace, arc
welding, and thyristor
control loads. Manifestations include light
bulb flicker.
Because this phenom- Events are measured
enon reoccurs reguusing ΔV10 flicker and
larly, it may cause the IEC flicker Pst and Plt.
light to flicker or the
device to malfunction.
Large flicker values
indicate that most people would find the flickering of lighting
unpleasant.
Interruptions consist of
momentary, shortterm, or extended
power supply outages
as a result of factors
such as circuit breakers being tripped due
primarily to power
company issues (interruption of power due
to lightning strikes,
etc.) or power supply
short-circuits.
Recently, due to the
Events are detected
spread of UPS (unin- using interruptions.
terruptible power
sources), most of
these problems can be
fixed using a computer, but this may
cause the device to
stop operating due to
an interruption or to
reset.
Harmonics are caused
by distortions of the
voltage and current
waveforms when a
device’s power supply
uses semiconductor
control devices.
Large harmonic components can lead to
major malfunctions,
including overheating
of motors and transformers and burnout of
reactors connected to
phase advance capacitors.
Events are detected
using harmonic voltage, harmonic current, and harmonic
power. They can also
be detected as voltage
waveform distortions
using voltage waveform comparison functionality.
Displacement of the
voltage waveform
zero-cross may damage equipment, cause
it to malfunction, or
degrade its performance.
Inter-harmonics
Inter-harmonics are
caused when the voltage or current waveform is distorted due to
static frequency conversion equipment,
cycloconverters,
Scherbius machines,
induction motors,
welders, or arc furnaces. The term refers
to frequency components that are not a
whole multiple of the
fundamental wave.
Inter-harmonics are
measured using interharmonic voltage and
inter-harmonic current. Events are not
supported, but it may
be possible to detect
events as voltage
waveform distortions
using voltage waveform comparison functionality.
Voltage unbalance,
negative-phase voltage, and harmonics
can cause issues
including variations in
motor speed and
noise, reduced torque,
tripping of 3E breakers, overloading and
heating of transformers, and increased
loss in capacitor
smoothing rectifiers.
Events are detected
using voltage unbalance factor and current unbalance factor.
Unbalance
Unbalance is caused
by increases or
decreases in the load
connected to each
phase of a power line,
or by distortions in
voltage and current
waveforms, voltage
dips, or negativephase voltage caused
by the operation of
unbalanced equipment
or devices.
Flicker
Interruption
((momentary
power outage)
Harmonic
Appendix
A
6
Appendix 2 Explanation of Power Supply Quality Parameters and Events
Principal
parameters
indicating
power quality
Waveform
Voltage waveform
Inrush current
High-order
harmonic
component
Current
waveform
Phenomenon
Primary issues
PW3198 events and
measurements
Inrush current is a
large current that flows
momentarily, for example when electric
equipment is turned
on.
Inrush current can
Events are detected
cause power switch
using inrush current.
contact and relay fusing, fuse blowouts, circuit breaker
disconnections, issues
with rectifying circuits,
and supply voltage
instability, causing
equipment sharing the
same power supply to
stop operating or be
reset.
The high-order harmonic component consists of noise
components of several kHz or more
caused by voltage and
current waveform distortions when equipment power supplies
use semiconductor
devices. It includes
various frequency
components.
The high-order harmonic component can
damage equipment
power supplies, cause
equipment operation
to be reset, or result in
abnormal sound from
TVs and radios.
Events are detected
using high-order harmonic voltage component RMS values and
high-order harmonic
current component
RMS values.
Note: Meaning issues caused by a reduction in power supply quality, resulting in the following substation issues and
electronically controlled device malfunctions: lighting flicker, frequent burning out of incandescent light bulbs,
malfunctioning office equipment, occasional abnormal machine operation, overheating of reactor-equipped
capacitor equipment, and occasional malfunctioning of overload, negative-phase, and open-phase relays.
A
7
Appendix 3 Event Detection Methods
Appendix 3 Event Detection Methods
Transient overvoltage
Measurement method:
• Detected when the waveform obtained by eliminating the fundamental component (50/60/400 Hz) from a waveform
sampled at 2 MHz exceeds a threshold specified as an absolute value.
• Detection occurs once for each fundamental voltage waveform, and voltages of up to ±6,000 V can be measured.
Recorded data:
Transient voltage value
: Peak value of waveform during 4 ms period after elimination of fundamental component
Transient width
: Period during which threshold is exceeded (2 ms max.)
Max. transient voltage value: : Max. peak value of waveform obtained by eliminating the fundamental component during
the period from transient IN to transient OUT (leaving channel information)
Transient period
: Period from transient IN to transient OUT
Transient count during period : Number of transients occurring during period from transient IN to transient OUT (transients occurring across all channels or simultaneously on multiple channels count as 1)
Transient waveforms
: Event waveform and transient waveform
(Waveforms are saved for 2 ms before and after the position at which the transient overvoltage waveform was detected for the first transient IN and 2 ms before and after the
point at which the transient maximum voltage waveform was detected between the IN
and OUT points.)
Sampled
waveform
2 MHz
Elimination of fundamental component (5 kHz) and
lower
Transient waveform after elimination of fundamental
component
Threshold
Transient voltage
Threshold
Transient width
Event IN
2 ms
2 ms
Event IN and OUT
Event IN
: The event occurrence time when the first transient overvoltage is detected during an aggregation period of
approx. 200 ms. indicates the peak voltage value and transient width detected when the threshold was exceeded.
Event OUT : Indicates the first transient period (difference between the IN time and OUT time) for the approx. 200 ms
aggregation period during which no transient overvoltage was detected for any channel within the first approx. 200 ms aggregation period following the transient event IN state.
Approx. 200 ms
aggregation
Approx. 200 ms
aggregation
Approx. 200 ms
aggregation
Event IN
Approx. 200 ms
aggregation
Event OUT
Event period
Threshold
Threshold
2 ms
Transient waveform (including
fundament component)
The first detected transient waveform after event IN is saved.
2 ms
2 ms
Transient waveform (including
fundament component)
The waveform with the largest transient
voltage value from the IN to the OUT
point is saved at event OUT.
Appendix
2 ms
Event IN
A
8
Appendix 3 Event Detection Methods
Voltage Swells, Voltage Dips, and Interruptions
Measurement method:
1
3
5
RMS voltage
refreshed each
half-cycle
2
4
Swell
Hysteresis
Threshold
RMS voltage
refreshed
each half-cycle
EVENT IN
EVENT OUT
Dip, Interruptions
RMS voltage
refreshed each
half-cycle
Hysteresis
Threshold
EVENT IN
• When the measurement frequency is set to 50/60 Hz, events
are detected using the RMS voltage refreshed each half-cycle
based on sample data for 1 waveform derived by overlapping
the voltage waveform every half-cycle.
• When the measurement frequency is set to 400 Hz, events are
detected using the RMS voltage refreshed each half-cycle
based on sample data for each waveform.
• Events are detected using line voltage for 3-phase 3-wire connections and phase voltage for 3-phase 4-wire connections.
• Swells are detected when the RMS voltage refreshed each
half-cycle exceeds the threshold in the positive direction, while
dips and interruptions are detected when the RMS voltage
refreshed each half-cycle exceeds the threshold in the negative direction (hysteresis applies in all cases).
Event IN and OUT:
Event IN
: Start of the waveform during which the RMS voltage
refreshed each half-cycle exceeds the threshold in
the positive direction
Event OUT : Start of the waveform during which the RMS voltage
refreshed each half-cycle exceeds the value obtained by subtracting the hysteresis from the threshold in the negative direction
EVENT OUT
Frequency
Measurement method:
Frequency is calculated as the reciprocal of the accumulated whole-cycle time during 10, 12, or 80 U1 (reference channel) cycles. This value is detected when the absolute value is exceeded.
Approx. 200 ms aggregation
Frequency
Approx. 200 ms aggregation
Frequency
Event IN and OUT:
Event IN
: Start of the approx. 200 ms aggregation in which the reading is greater than ±threshold
Event OUT : Start of the approx. 200 ms aggregation in which the reading returns to ± (threshold - 0.1 Hz)
Note: Equivalent to 0.1 Hz frequency hysteresis.
A
9
Appendix 3 Event Detection Methods
Frequency cycle
Measurement method:
• Frequency for every U1 (reference channel) waveform, calculated using the reciprocal method.
• When the measurement frequency is set to 400 Hz, the frequency cycle is calculated as the reciprocal of the accumulated whole-cycle time during 8 cycles.
• The frequency cycle is calculated as the average frequency for 8 waveforms.
Approx. 200 ms aggregation
1 frequency cycle
1 frequency cycle
.....
Event IN and OUT:
Event IN
: Start time of waveform exceeding ±threshold
Event OUT : Start time of waveform returning to ±(threshold -0.1 Hz)
Note Equivalent to 0.1 Hz frequency hysteresis.
Voltage Waveform Peak, Current Waveform Peak, RMS Voltage, RMS Current, Active Power, Reactive Power, Apparent Power, Power Factor, and Displacement Power Factor
Measurement method:
• Events are detected when the value in question calculated
from the approx. 200 ms aggregation of 10 cycles (50 Hz), 12
cycles (60 Hz), or 80 cycles (400 Hz) is greater than or less
50 Hz: 10 waveforms; 60 Hz: 12 waveforms; 400 Hz:
than the threshold.
80 waveforms
• RMS values are calculated from an approx. 200 ms aggregation of 10 cycles (50 Hz), 12 cycles (60 Hz), or 80 cycles (400
RMS value calculation
Hz) as per IEC61000-4-30.
RMS voltage (upper limit)
Event IN and OUT:
Event IN
Sense
Hysteresis
Threshold
RMS
value
EVENT Sense
IN
Sense
EVENT
OUT
: Start of the approx. 200 ms aggregation in which the
reading is greater than the upper limit or less than
the lower limit
Event OUT : Start of the first approx. 200 ms aggregation in which
the reading is less than (the upper limit - hysteresis)
after being greater than the upper limit, or in which
the reading is greater than (the lower limit + hysteresis) after being less than the lower limit
Sense
: Sense events are detected when the reading is
greater than or less than the sense upper limit between the event IN and event OUT.
(When event OUT conditions are fulfilled, the event
OUT takes precedence.)
Appendix
A
10
Appendix 3 Event Detection Methods
Voltage DC Value, Current DC Value (CH4 only)
Measurement method:
Values are detected when the average value for the approx. 200 ms aggregation synchronized to the reference channel
U1 exceeds a threshold specified as an absolute value.
Event IN and OUT:
Event IN
: Start of the approx. 200 ms aggregation in which the reading is greater than the upper limit or less than the
lower limit
Event OUT : Start of the first approx. 200 ms aggregation in which the reader is less than (the upper limit - hysteresis)
after being greater than the upper limit, or in which the reading is greater than (the lower limit + hysteresis)
after being less than the lower limit
Voltage DC Change and Current DC Change (CH4 only)
Measurement method:
DC fluctuation events are detected when the difference between the positive and negative waveform peak values in an
approx. 200 ms aggregation exceeds the set threshold.
Sampled waveform
Difference between positive
Positive waveform peak value
and negative waveform peak
values
DC value (average value)
Negative waveform peak value
Approx. 200 ms
aggregation
Approx. 200 ms Approx. 200 ms
aggregation
aggregation
Event IN
Approx. 200 ms
aggregation
Event OUT
Measured values in the event list are displayed as the voltage or current value for the difference between the positive and
negative waveform peak values. (These measured values are not recorded.)
Voltage Unbalance Factor, Current Unbalance Factor, Harmonic Voltage,
Harmonic Current, Harmonic Power, Harmonic Voltage-Current Phase Difference, Total Harmonic Voltage Distortion Factor, Total Harmonic Current
Distortion Factor, and K Factor
Measurement method:
50 Hz: 10 cycles, 60 Hz: 12 cycles, 400 Hz: 80 cycles
Harmonic calculation using rectangular window
Event IN and OUT:
Event IN
3rd-order harmonic voltage
Hysteresis
Threshold
EVENT
IN
Measured values are calculated for a rectangular window of 4,096
points in an approx. 200 ms aggregation of 10 cycles (50 Hz), 12
cycles (60 Hz), or 80 cycles (400 Hz), and events are detected
when the calculated values are greater than or less than the corresponding threshold.
EVENT
OUT
: Start of the approx. 200 ms aggregation in which the
reading is greater than the threshold
Event OUT : Start of the approx. 200 ms aggregation in which the
reading is less than (the threshold - hysteresis)
A
11
Appendix 3 Event Detection Methods
Voltage Waveform Comparison
Measurement method:
• A judgment area is automatically generated from the previous 200 ms aggregation waveform, and events are generated based on a comparison with the judgment waveform.
• Waveform comparison is performed at once for the entire 200 ms aggregation. Thresholds are applied as a percentage of the nominal input voltage RMS value.
Approx. 200 ms aggregation
Approx. 200 ms aggregation
Judgment waveform
Threshold
(% of nominal input voltage)
Judgment area
Dotted line: Judgment area
Solid line: Judgment waveform (measured waveform)
Event IN
Threshold
(% of nominal input voltage)
Event IN and OUT:
Event IN
: First time at which waveform diverges from judgment area
Event OUT : None
Appendix
A
12
Appendix 3 Event Detection Methods
Inrush current
Measurement method:
• Events are detected when the RMS current refreshed each half-cycle Irms1/2 is greater than the threshold.
• For 400 Hz measurement, events are detected when the maximum of 4 RMS current values existing within the same
10 ms period (calculated values for one 400 Hz waveform) is greater than the threshold in the positive direction.
Threshold
Hysteresis
Irms1/2
EVENT
IN EVENT
OUT
0.5 s
29.5 s
RMS current refreshed each half-cycle Irms1/2 values are saved from
0.5 s before the event to 29.5 s after the event as fluctuation data.
Event IN and OUT:
Event IN
: Time of start of channel half-cycle voltage waveform in which the RMS current refreshed each half-cycle
was greater than the threshold.
Event OUT : Time at the start of the voltage half-cycle waveform in which the RMS current refreshed each half-cycle exceeded (threshold - hysteresis) in the negative direction
Voltage waveform
Current waveform
Event IN
Event OUT
A
13
Appendix 3 Event Detection Methods
High-order Harmonic Voltage Component and High-order Harmonic Current
Component
Measurement method:
• The waveform obtained by eliminating the fundamental component is calculated using the true RMS method during
10 cycles (50 Hz), 12 cycles (60 Hz), or 80 cycles (400 Hz) of the fundamental wave. Events are detected when this
RMS value is greater than the threshold.
• When an event is detected, the high-order harmonic waveform is recorded in addition to the event waveform for 40
ms (8,000 points of data) from the end of the first approx. 200 ms aggregation interval in which the reading was
greater than the threshold.
Elimination of fundamental
component (2 kHz or less)
Sampled waveform
200 kHz
High-order harmonic component
waveform after elimination of
fundamental component
Approx. 200 ms aggregation
Threshold is given as an
RMS value.
for 40 m
High-order harmonic component waveform (including fundamental component)
Event IN and OUT:
Event IN
: Start of the approx. 200 ms aggregation in which the reading is greater than the threshold
Event OUT : Start of the approx. 20 ms aggregation in which no high-order harmonics were detected during the first approx. 200 ms aggregation following the IN state
Timer Events
Events are generated at the set interval. When a timer is set as an event, the external event setting is forcibly turned on. Once recording has started, timer events are recorded at a fixed interval (the set time) starting with the start time.
Interval
Start of
recording
Interval
Event recorded
Ext
Interval
Event recorded
Ext
Interval
Event recorded
Ext
Event recorded
Ext
External Events
External events are detected using external control terminal (EVENT IN) shorts or pulse signal falling edge input. The
voltage and current waveforms and measured values when the external event occurs can be recorded.
See:"11.1 Using the External Control Terminal" (p.149)
Manual events are detected when the MANU EVENT (manual event) key is pressed. The voltage and current waveforms and measured values when the external event occurs can be recorded.
See: For more information about how to record event waveforms: "Appendix 4 Recording TIMEPLOT Data and Event
Waveforms" (p.A14)
Appendix
Manual Events
A
14
Appendix 4 Recording TIMEPLOT Data and Event Waveforms
Appendix 4 Recording TIMEPLOT Data and Event
Waveforms
TIME PLOT screen (trends and harmonic trends)
SYSTEM_DF1 [RECORD] TIME PLOT Interval (setting period)
Approx. 200 ms aggregation (50 Hz: 10 cycles, 60 Hz: 12 cycles)
RMS value 1
RMS value 2
RMS value 3
RMS value N
MAX RMS value
AVG RMS value
MIN RMS value
Recording
Recording
Recording
Example:
when interval:1min,
N=300
MAX and MIN values only for harmonics and inter-harmonics
TIME PLOT screen (detailed trends)
SYSTEM_DF1 [RECORD] TIME PLOT Interval (setting period)
Approx. 200 ms aggregation (50 Hz: 10 cycles, 60 Hz: 12 cycles)
Voltage RMS value is calculated for one
waveform shifted over half a wave.
Recording
Example:
There are 24 calculated U (Urms1/2) values
in an approx. 200 ms aggregation at 60 Hz
(12 cycles).
Recording
Example:
when interval:1min,
N=7200
A
15
Appendix 4 Recording TIMEPLOT Data and Event Waveforms
Event Waveform Recording Method
Generating events using approx. 200 ms aggregation measured values
SYSTEM_DF1 [RECORD] TIME PLOT Interval (setting period)
Approx. 200 ms aggregation (50 Hz: 10 cycles, 60 Hz: 12 cycles)
RMS calculation
EVENT occur
RMS calculation
Event waveform recording period
50 Hz: 14 cycles
60 Hz: 16 cycles
RMS calculation
The result of adding the two waveforms
prior to and the two waveforms after the
approx. 200 ms aggregation is displayed
as the event waveform.
Generating events using one- or half-wave measured values
SYSTEM_DF1 [RECORD] TIME PLOT Interval (setting period)
Approx. 200 ms aggregation (50 Hz: 10 cycles, 60 Hz: 12 cycles)
Event waveform recording period
50 Hz: 14 cycles
60 Hz: 16 cycles
The result of adding the two waveforms
prior to and the two waveforms after the
approx. 200 ms aggregation is displayed
as the event waveform.
Appendix
A
16
Appendix 4 Recording TIMEPLOT Data and Event Waveforms
TIMEPLOT time synchronization and overlap
Instruments defined under IEC61000-4-30 Class A must generate measurement results within the stipulated accuracy range when measuring the same signal, even if different instruments are used to make the
measurement.
A series of 150/180 cycle time intervals is resynchronized every 10 minutes as shown in the figure to
align measurement times and measured values. Consequently, the approx. 200 ms aggregations (10 or
12 cycles) are also resynchronized every 10 minutes.
Figure. Synchronization Required by IEC61000-4-30 Class A
A new 150/180 cycle time interval starts every 10 minutes (for example, x+1), while measurement of the
existing 150/180 cycle time interval (for example, x) continues until it is complete. In this way, there is an
overlap between the two 150/180 cycle time intervals and between approx. 200 ms aggregations (10 or
12 cycles). The PW3198 synchronizes the start of the set TIMEPLOT interval every 10 minutes. For this
reason, approx. 200 ms aggregations (10 or 12 cycles) are also resynchronized every 10 minutes.
A new TIMEPLOT interval starts every 10 minutes, while measurement of the existing TIMEPLOT interval
continues until it is complete. In this way, there is an overlap between the two TIMEPLOT intervals.
To perform standard-compliant measurement, the TIMEPLOT interval must be set to 50 Hz/150 waves or
60 Hz/180 waves.
Figure. PW3198 Synchronization
Note: 10/12 cycles = 200 ms aggregation
A
17
Appendix 4 Recording TIMEPLOT Data and Event Waveforms
Method for verifying aggregation values required by IEC61000-4-30
3-second aggregated values
(=150/180cycle data)
Applies to average value of
Magnitude of the channel Urms values on the
Supply Voltage
[TIMEPLOT] - [TREND]
screen.
10-minute aggregated values
2-hour aggregated values
Applies to average value of
channel Urms values on the
[TIMEPLOT] - [TREND]
screen.
Applies to average value of
channel Urms values on the
[TIMEPLOT] - [TREND]
screen.
Voltage
harmonics
Applies to average values on
the [TIMEPLOT] [HarmTrend] screen.
Applies to average values on
the [TIMEPLOT] [HarmTrend] screen.
Applies to average values on
the [TIMEPLOT] [HarmTrend] screen.
Voltage
inter-harmonics
Applies to average values for
each channel's orders on the
[TIMEPLOT] - [Harm Trend] [INTERHARM] screen.
Applies to average values for
each channel's orders on the
[TIMEPLOT] - [Harm Trend] [INTERHARM] screen.
Applies to average values for
each channel's orders on the
[TIMEPLOT] - [Harm Trend] [INTERHARM] screen.
Supply Voltage
unbalance
Applies to average value of
unb0 and unb for Uunb on the
[TIMEPLOT] - [TREND]
screen.
Applies to average value of
unb0 and unb for Uunb on the
[TIMEPLOT] - [TREND]
screen.
Applies to average value of
unb0 and unb for Uunb on the
[TIMEPLOT] - [TREND]
screen.
Measurement
conditions
• The TIMEPLOT interval is
set to 150/180 cycles.
• During analysis, cursor
measurement is performed
after setting Tdiv to the minimum value.
• The order being checked for
harmonics and inter-harmonics is selected and displayed.
• Recorded items for interharmonics are set to [ALL
DATA].
• The TIMEPLOT interval is
set to 10 minutes.
• During analysis, cursor
measurement is performed
after setting Tdiv to the minimum value.
• The order being checked for
harmonics and inter-harmonics is selected and displayed.
• Recorded items for interharmonics are set to [ALL
DATA].
• The TIMEPLOT interval is
set to 2 hours.
• During analysis, cursor
measurement is performed
after setting Tdiv to the minimum value.
• The order being checked for
harmonics and inter-harmonics is selected and displayed.
• Recorded items for interharmonics are set to [ALL
DATA].
Time clock accuracy
IEC61000-4-30 Class A requires that regardless of the overall time interval, time clock accuracy must be
within ±20 ms for 50 Hz and within ±16.7 ms for 60 Hz. When accurate time synchronization using an
external signal is not possible, a tolerance of less than ±1 second over 24 hours is permitted, but regardless of the overall time interval, accuracy must be within ±20 ms for 50 Hz and ±16.7 ms for 60 Hz.
By synchronizing the PW3198 with the PW9005 GPS Box, the instrument time can be synchronized to
UTC at a high degree of accuracy. In the event that accurate time synchronization using an external signal, such as that provided by the GPS unit, is not possible, the instrument incorporates a clock capable of
operating at a real-time accuracy of within ±1 second per day (within the specified operating temperature
and humidity range).
Appendix
A
18
Appendix 5 Detailed Explanation of IEC Flicker and DV10 Flicker
Appendix 5 Detailed Explanation of IEC Flicker
and ΔV10 Flicker
To measure the IEC Flicker or ΔV10 Flicker
Flicker calculation and IEC flicker filter settings are configured on the SYSTEM-DF1
[MAIN]-F1 [MEASURE] screen.
See:"5.1 Changing Measurement Conditions" (p.55)
IEC Flicker Meter
The IEC flicker function is based on international standard IEC61000- 4-15, "Flickermeter - Functional
and design specifications".
Block 1
Input voltage adapter
Block 2
Square multiplier
Voltage waveform
A/D
conversion
Square
multiplier
AGC
Waveform
data
Block 4
Average
smoothing
Square
multiplier
1st order
Smooth
averaging
filter
Block 5
Online statistical analysis
Class
category
Instantaneous
flicker value
S(t)
Pst calculation
Plt calculation
Short interval
flicker
Pst
Long interval
flicker
Plt
Block 3
Weighing filter
Luminous
sensitivity
filter
A
19
Appendix 5 Detailed Explanation of IEC Flicker and DV10 Flicker
Weighting Filter
You can select a weighted filter for either a 230 V lamp system or a 120 V lamp
system.
Statistical
Processing
Statistics on flicker are compiled by applying the cumulative probability function
(CPF) to 1,024 logarithmic divisions of instantaneous flicker values S(t) in the
range from 0.0001 to 10000 P.U. to obtain cumulative probabilities P0.1, P1s,
P3s, P10s, and P50s.
Short Interval
Flicker Value
Pst
This indicates degree of perceptibility (severity) of flicker measured over a 10minute period.
Calculation:
0.0314P0.1+0.0525P1s+0.0657P3s+0.28P10s+0.08P50s
Pst =
P50s = (P30+P50+P80)/3
P10s = (P6+P8+P10+P13+P17)/5
P3s = (P2.2+P3+P4)/3
P1s = (P0.7+P1+P1.5)/3
P0.1 is not smoothed
Long Interval
Flicker Value
Plt
Indicates the degree of perceptibility (severity) of flicker determined from successive Pst measurements over a 2-hour period.
To calculate a moving average of Pst, the displayed value is updated every 10
minutes.
Calculation:
Plt =
3
3 Σ(Psti)
N
Appendix
A
20
Appendix 5 Detailed Explanation of IEC Flicker and DV10 Flicker
ΔV10 Flicker Meter
ΔV10 flicker
The ΔV10 flicker function is calculated using the "perceived flicker curve" calculation method, which is based on digital Fourier transformation.
Calculation:
ΔV10 =
∞
( an ⋅ ΔVn )
2
n=1
ΔVn
: RMS value [V] for voltage fluctuations in frequency fn.
an
: Luminosity coefficient for fn where 10 Hz is 1.0.
(0.05Hz to 30Hz)
Evaluation period: for 1 minute
ΔV10 flicker
function diagram
RMS
calculation
Voltage
waveform
A/D
conversion
Squar
e multiplier
1-wave
RMS value
RMS value
averaging
Storage
RMS 1-minute
average value
1-minute
voltage
fluctuation
data
ΔV10
calculation
Waveform
data
ΔV10
Luminosity
coefficient
V10 Perceived
flicker coefficient
Frequency [Hz]
100 V
conversion
ΔV10
A
21
Appendix 6 Making Effective Use of Channel 4
Appendix 6 Making Effective Use of Channel 4
While channel 4 is often used to measure the neutral line of 3-phase 4-wire connections, there are a variety of other uses since it is isolated from the instrument's other channels.
DC power supply measurement
This is an extremely broad range of applications that extends from monitoring DC power supply systems
to monitoring hardware internal power supplies. Since events can be detected using DC measured values, it is possible to monitor the AC power supply on channels 1 through 3 when DC power supply disturbances occur.
±24 V, ±15 V, ±5 V, etc.
Used for separate
systems
Example of DC power supply measurement
±24 V, ±15 V, ±5
V, etc.
Appendix
A
22
Appendix 6 Making Effective Use of Channel 4
Two-system, two-circuit measurement
Although it is necessary to measure a system synchronized to the reference channel in order to obtain
accurate measurements, channel 4 can be used to measure a different system than channels 1 through 3
(other than power elements).
Used for separate
systems
Example of 2-system measurement
A
23
Appendix 6 Making Effective Use of Channel 4
Example of 2-system measurement 2
Appendix
A
24
Appendix 7 Terminology
Appendix 7 Terminology
EN50160
A European power supply quality standard that defines limit values for supply voltage and
other characteristics. The 9624-50 PQA HiView Pro application can be used with data from
the PW3198 to perform standard-compliant evaluation and analysis.
IEC61000-4-7
An international standard governing measurement of harmonic current and harmonic voltage in power supply systems as well as harmonic current emitted by equipment. The standard specifies the performance of a standard instrument.
IEC61000-4-15
A standard that defines testing techniques for voltage fluctuation and flicker measurement
as well as associated measuring instrument requirements.
A standard governing testing involving power quality measurement in AC power supply
systems and associated measurement technologies. Target parameters are restricted to
phenomena that are propagated in power systems, specifically frequency, supply voltage
amplitude (RMS), flicker, supply voltage dips, swells, (momentary) interruptions, transient
overvoltages, supply voltage unbalance, harmonics, inter-harmonics, supply voltage carrier signals, and high-speed voltage variations.
The standard defines measurement methods for these parameters as well as the necessary instrument performance. It does not define specific thresholds.
Measurement classes
IEC61000-4-30
ITIC curve
The standard defines three classes (A, S, and B) for various instrument measuring methods and measurement performance levels:
Class
Applications
Class A
Used in applications where accurate measurement is required, for
example verification of standard compliance and dispute settlement.
In order to ensure accurate measurement, the standard includes
detailed stipulations concerning instrument time clock accuracy, RMS
value calculation methods, and TIMEPLOT data grouping.
Class S
Used in surveys and power supply quality evaluation.
Class B
Used in applications where a high level of accuracy is not required,
for example troubleshooting.
A graph created by the Information Technology Industry Council plotting voltage disturbance data for detected events using the event duration and worst value (as a percentage
of the nominal input voltage). The graph format makes it easy to quickly identify which
event data distribution should be analyzed. The 9624-50 PQA HiView Pro application can
be used to create ITIC curves using PW3198 data.
Shows the power loss caused by the harmonic current in transformers.
Also referred to as the "multiplication factor." The K factor (KF) is formulated as shown
below:
50
KF
k2 × I
k
=1
2
k
= ---------------------------------50
K factor
Ik
2
k=1
k: Order of harmonics
Ik: Ratio of the harmonic current to the fundamental wave current [%]
Higher-order harmonic currents have a greater influence on the K factor than lower-order
harmonic currents.
Purpose of measurement
To measure the K factor in a transformer when subjected to maximum load. If the measured K factor is larger than the multiplication factor of the transformer used, the transformer must be replaced with one with a larger K factor, or the load on the transformer
must be reduced. The replacement transformer should have a K factor one rank higher
than the measured K factor for the transformer being replaced.
A
25
Appendix 7 Terminology
LAN
LAN is the abbreviation of Local Area Network. The LAN was developed as a network for
transferring data through a PC within a local area, such as an office, factory, or school.
This device comes equipped with the LAN adapter Ethernet 10/100Base-T.Use a twistedpair cable to connect this device to the hub (central computer) of your LAN. The maximum
length of the cable connecting the terminal and the hub is 100 m. Communications using
TCP/IP as the LAN interface protocol are supported.
RS-232C
The RS-232C is a serial interface established by the EIA (Electronics Industries Association), and conforms to the specifications for DTE (data terminal equipment) and DCE (data
circuit terminating equipment) interface conditions.
Using the signal line part of the RS-232C specifications with this unit allows you to use an
external printer or GPS box.
SD memory card
A type of flash memory card.
TIME PLOT interval
The recording interval. This setting applies to TIMEPLOT and SD memory card recording.
USB-F
(USB function)
An interface for exchanging data with a host controller (typically a computer) connected
with a USB cable. For this reason, communication between functions is not possible.
Event
Power supply quality parameters are necessary in order to investigate and analyze power
supply issues. These parameters include disturbances such as transients, dips, swells,
interruptions, flicker, and frequency fluctuations. As a rule, the term “event" refers to the
state detected based on thresholds for which abnormal values and abnormal waveforms
for these parameters have been set. Events also include timer and repeat event settings,
which are unrelated to power supply quality parameters.
All frequencies that are not a whole-number multiple of the fundamental frequency. Interharmonics include intermediate frequencies and inter-order harmonics, and the term refers
to RMS values for the spectral components of electrical signals with frequencies between
two contiguous harmonic frequencies.
Inter-harmonics
(Inter-harmonics of the order 3.5 assume a drive of 90 Hz or similar rather than a frequency
synchronized to the fundamental wave of an inverter or other device. However, inter-harmonics do not generally occur in high-voltage circuits under present-day conditions. Most
inter-harmonics are currently thought to be caused by the circuit load.)
Functionality for generating events by detecting a signal input to the instrument's external
event input terminal and recording measured values and event waveforms at the time of
External event function detection. In this way, events are generated based on an alarm signal from a device other
than the PW3198. By inputting an operating signal from an external device, an operation
start or stop trigger can be applied in order to record waveforms with the PW3198.
The official time used worldwide. Although UTC is almost identical to Greenwich Mean
Coordinated universal Time (GMT), which is based on astronomical observations, UTC is determined by measuring 1 SI second using an atomic clock. Regular adjustments ensure that GMT and UTC diftime (UTC)
fer by no more than 1 second.
The crest factor expresses the size of the dynamic range of input on the measurement
device and can be defined with the following expression.
Crest factor = crest value (peak value)/RMS value
For example, when measuring a distorted wave with a small RMS and a large peak on a
measurement device with a small crest factor, because the peak of the distorted wave
exceeds the detection range of the input circuit, an RMS or harmonic measurement error
occurs.
[A]
Measurement is not possible
100
50 2
50
0
Out of crest factor
-50
Measurement is
not possible
-100
Appendix
A measurement device with a small crest factor
(When the crest factor is 2 for a 50 A range)
When you increase the measurement range, the peak does not exceed the input circuit’s
detection range, but because the resolution of the RMS decreases, measurement errors
may occur.
(Continues on next page)
A
26
Appendix 7 Terminology
200
[A]
50 2
50
0
Out of crest factor
16-bit resolution
-50
-200
Crest factors of the PW3198
(The crest factor of the current input area is 4.)
However, when a measurement that exceeds the peak is input, it appears outside the crest
factor and you are informed of data that contains measurement errors.
High-order
harmonic component
The noise component at and above several kHz. For the PW3198, the term refers to RMS values for the noise component at 2 kHz and above. By measuring the high-order harmonic component, it is possible to monitor harmonic noise at the 50th and higher order emitted by
switching power supplies, inverters, LED lighting, and other devices. Recently, increases in the
switching frequencies used by switching power supplies and inverters have resulted in the
problematic introduction of noise in excess of 10 kHz into power supply lines.
Nominal supply
voltage (Uc)
Typically, the system's rated voltage Un. When a voltage that differs from the rated voltage
is applied to the contact in accordance with an agreement between the electricity provider
and the customer, that voltage is used as the nominal supply voltage Uc. The nominal supply voltage is defined by IEC61000-4-30.
Nominal voltage (Uref)
The same voltage as the nominal supply voltage (Uc) defined by IEC61000-4-30 or the
rated voltage (Un). Nominal voltage (Uref) = nominal input voltage (Udin) × VT ratio
Nominal input voltage The value calculated from the nominal supply voltage using the transformer ratio. The
nominal input voltage is defined by IEC61000-4-30.
(Udin)
Harmonics
A phenomenon caused by distortions in the voltage and current waveforms that affect many
devices with power supplies using semiconductor control devices. In the analysis of non-sine
waves, the term refers to one RMS value among the components with harmonic frequencies.
The harmonic voltage phase angle and harmonic current phase angle are expressed in
terms of the synchronized source's fundamental component phase.
The difference between each order's harmonic component phase and the fundamental
component phase is expressed as an angle (°), and its sign indicates either a lagging
phase (negative) or leading phase (positive). The sign is the reverse of the power factor
sign. The harmonic voltage-current phase angle expresses the difference between each
order's harmonic voltage component phase angle and harmonic current component phase
angle for each channel as an angle (°).
When using the sum display, the sum of each order's harmonic power factor (calculated
from the sums of harmonic power and harmonic reactive power) is converted to an angle
(°). When the harmonic voltage-current phase angle is between -90° and +90°, that order's
harmonics are flowing toward the load (influx). When the harmonic voltage-current phase
angle is between +90° and +180° or between -90° and -180°, that order's harmonics are
flowing from the load (outflow).
Harmonics
phase angle and Phase
difference
90°
Voltage and current
phase difference
Outflow
±180°
LEAD
Inflow
Voltage and current
phase angles
LAG
-90°
Harmonic phase angle
0°
A
27
Appendix 7 Terminology
Harmonic content
percentage
The ratio of the K-order size to the size of the fundamental wave, expressed as a percentage using the following equation:
K-order wave / fundamental wave × 100 [%]
By observing this value, it is possible to ascertain the harmonic component content for individual orders. This metric provides a useful way to track the harmonic content percentage
when monitoring a specific order.
RMS value
The root mean square of instantaneous values for a quantity obtained over a particular time
interval or bandwidth.
Frequency cycle
(Freq wav or fwav)
The frequency of a single waveform. By measuring the frequency cycle, it is possible to
monitor frequency fluctuations on an interconnected system at a high degree of detail.
10-sec frequency
(Freq10s or f10s)
The frequency measured value as calculated according to IEC61000-4-30, consisting of a
10-second average of the frequency. It is recommended to measure this characteristic for
at least one week.
Interruption
A phenomenon in which the supply of power stops momentarily or for a short or long period
of time due to factors such as a circuit breaker tripping as a result of a power company
accident or power supply short-circuit.
Swell
A phenomenon in which the voltage rises momentarily due to a lightning strike or the
switching of a high-load power line.
The voltage used as the reference for judging voltage dip and swell thresholds. The slide
reference voltage is calculated from a 1st-order filter with a time constant of 1 minute relaSlide reference voltage tive to RMS values. Although the fixed nominal input voltage value is usually used as the
reference voltage, dips and swells can be detected when the voltage value is fluctuating
gradually by using the fluctuating voltage value as the reference.
Zero suppression
Functionality for treating values that are less than a certain threshold as zero.
Zero, positive,
and negative phases
The positive phase can be considered normal 3-phase power consumption, while the negative phase functions to operate a 3-phase motor backwards. The positive phase causes
the motor to operate in the forward direction, while the negative phase act as a break and
causes heat to be generated, exerting a negative impact on the motor. Like the negative
phase, the zero phase is unnecessary. With a 3-phase 4-wire connection, the zero phase
causes current to flow and heat to be generated. Normally, an increase in the negative
phase causes an increase of the same magnitude in the zero phase.
Sense
Measured values are continuously compared with the range defined by (the measured
value the last time the event occurred + the sense threshold) and (the measured value the
last time the event occurred - the sense threshold). When the value falls outside this range,
a sense event occurs, and the sense range is updated.
Sense event
Measurement
value + Sense
Event IN
Measurement value
High threshold
Sense event
Measurement
value - Sense
High hysteresis
Sense event
Event OUT
Measurement value
Low hysteresis
Low threshold
Event IN
Sense event
Appendix
Sense event
A
28
Appendix 7 Terminology
THD-F:
The ratio of the size of the total harmonic component to the size of the fundamental wave,
expressed as a percentage using the following equation:
(for the PW3198, calculated to the 50th order)
Total harmonic
distortion factor
This value can be monitored to assess waveform distortion for each item, providing a yardstick that indicates the extent to which the total harmonic component is distorting the fundamental waveform. As a general rule, the total distortion factor for a high-voltage system
should be 5% or less; it may be higher at the terminal point of the system.
THD-R:
The ratio of the size of the total harmonic component to the size of RMS values, expressed
as a percentage using the following equation:
(for the PW3198, calculated to the 50th order)
THD-F is typically used.
Measurement
frequency (fnom)
The nominal frequency of the system being measured. Select from 50 Hz/60 Hz/400 Hz.
(The measurement frequency is automatically set during the quick setup process.)
Timer event function
Functionality for generating events at a set time interval and recording the measured value
and event waveform at that time. This function allows you to capture instantaneous waveforms and other data regularly, even if no abnormalities have occurred. Use this functionality when you wish to record a waveform at a fixed time interval.
Multiple-phase system
treatment
Method for defining the start and end of events such as dips, swells, and interruptions in
multiple-phase systems, for example systems with 3 phases
Dip:
A dip begins when the voltage of at least one channel is less than or equal to the threshold
and ends when voltage readings for all measurement channels exceed (threshold + hysteresis voltage).
Swell:
A swell begins when the voltage of at least one channel exceeds the threshold and ends
when voltage readings for all measurement channels are less than or equal to (threshold +
hysteresis voltage).
Interruption:
An interruption begins when voltage readings for all channels are less than or equal to the
threshold and ends when the voltage of a user-specified channel is greater than or equal to
(threshold + hysteresis).
Dip
A short-lived voltage drop caused by the occurrence of a inrush current with a large load,
such as when a motor starts. When recording voltage and current trends at the power service inlet, you can determine whether you should look for the cause of the dip inside or outside the building. If the voltage drops while the building's current consumption rises, the
cause likely lies inside the building. If the voltage and current are both low, the cause is
likely to lie outside the building.
Text data
A file containing only data expressed using characters and character codes.
RMS voltage refreshed
The RMS value of one voltage waveform overlapped every half-cycle.
each half-cycle
RMS current refreshed
The RMS value of the current waveform every half-cycle.
each half-cycle
Inrush current
A large current that flows temporarily, for example when an electric device is turned on. A
inrush current can be equal to or greater than 10 times the current that flows when the
device is in the normal operating state. Inrush current measurement can be a useful diagnostic when setting circuit breaker capacity.
Transient overvoltage
An event caused by lightning strikes, circuit-breaker and relay contact obstructions and
tripping, and other phenomena. Transient overvoltages are often characterized by precipitous voltage variations and a high peak voltage.
Binary data
All data other than text (character) data. Use binary data when analyzing data with the
9624-50 PQA HiView Pro application.
Apparent power
The (vector) power obtained by combining active power and reactive power. As its name
suggests, apparent power expresses the “visible" power and comprises the product of the
voltage and current RMS values.
A
29
Appendix 7 Terminology
Unbalanced (symmetrical) 3-phase voltage (current)
Three-phase AC voltage (current) with equal voltage and current magnitude for each
phase and 120 phase separation.
Unbalanced (asymmetrical) 3-phase voltage (current)
Three-phase AC voltage (current) with equal voltage and current magnitude for each
phase and 120° phase separation.
Though all of the following descriptions refer to voltage, they apply to current as well.
Degree of unbalance in threephase alternating voltage
Normally described as the voltage unbalance factor, which is the ratio of negative-phase
voltage to positive-phase voltage
Voltage unbalance factor =
Negative-phase voltage
x 100 [%]
Positive-phase voltage
Zero-phase/positive-phase/negative-phase voltage
Unbalance factor
The concept of a zero-phase-sequence/positive-phase-sequence/negativephase- sequence component in a three-phase alternating circuit applies the method of
symmetrical coordinates (a method in which a circuit is treated so as to be divided into
symmetrical components of a zero phase, positive phase, and negative phase).
• Zero-phase-sequence component: Voltage that is equal in each phase. Described as
V0. (Subscript 0: Zero-phase-sequence component)
• Positive-phase-sequence component: Symmetrical three-phase voltage in which the value
for each phase is equal, and each of the phases is delayed by 120 degrees in the phase
sequence a->b->c. Described as V1.(Subscript 1: Positive-phase-sequence component)
• Negative-phase-sequence component: Symmetrical three-phase voltage in which the value
for each phase is equal, and each of the phases is delayed by 120 degrees in the phase
sequence a->c->b. Described as V2. (Subscript 2: Negative-phase-sequence component)
If Va, Vb, and Vc are given as the three-phase alternating voltage, the zero-phase voltage,
positive-phase voltage, and negative voltage are formulated as shown below.
Zero-phase voltage V0 =
Va+Vb+Vc
3
2
Positive-phase voltage V1 = Va+aVb+a Vc
3
Negative-phase voltage V2 =
Va+a2Vb+aVc
3
a is referred to as the “vector operator.” It is a vector with a magnitude of 1 and a phase angle of
120 degrees. Therefore, the phase angle is advanced by 120 degrees if multiplied by a, and by
240 degrees if multiplied by a2. If the three-phase alternating voltage is balanced, the zerophase voltage and negative-phase voltage are 0, and only positive phase voltage, which is
equal to the effective value of the three-phase alternating voltage, is described.
Unbalance factor of three-phase current
Used in applications such as the verification of power supplied to electrical equipment powered by a 3-phase induction motor.
The current unbalance factor is several times larger than the voltage unbalance factor. The less
a three-phase induction motor slips, the greater the difference between these two factors. Voltage unbalance causes such phenomena as current unbalance, an increase in temperature, an
increase in input, a decline in efficiency, and an increase in vibration and noise.
Uunb must not exceed 2%, and Iunb must be 10% or less. In a 3P4W system with an
unbalanced load, the Uunb0 and Inub0 components indicate the current that flows to the N
(neutral) line.
A marker used to distinguish unreliable measured values occurring due to disturbances
such as dips, swells, and interruptions. Flags are recorded as part of the TIMEPLOT data
status information. The concept is defined by the IEC61000-4-30 standard.
Flicker
A disturbance caused by a voltage drop resulting when equipment with a large load starts
up or when a large current flows under a temporary high-load state. For lighting loads,
flicker primarily manifests itself as blinking. Electric-discharge lamps such as fluorescent
and mercury-vapor lights are particularly prone to the effects of flicker.
When temporary dimming of lights due to voltage drops occurs frequently, it produces a flickering
effect (caused by repeated dimming) that produces an extremely unpleasant visual sensation.
Measurement methods can be broadly divided into IEC flicker and XXV10 flicker. In Japan,
the ΔV10 method is most frequently used.
Appendix
Flag
A
30
Appendix 7 Terminology
Manual event function
Functionality for generating events when the MANU EVENT key is pressed and recording
the measured value and event waveform at that time. In this way, events can be generated
as a snapshot of the system being measured. Use this functionality when you wish to
record a waveform but cannot find another event that defines the desired phenomenon or
when you wish to record data manually to avoid the generation of too many events.
Reactive power
Power that does not perform actual work, resulting in power consumption as it travels
between the load and the power supply. Reactive power is calculated by multiplying the
active power by the sine of the phase difference (sin θ). It arises from inductive loads
(deriving from inductance) and capacitive loads (deriving from capacitance), with reactive
power derived from inductive loads known as lag reactive power and reactive power
derived from capacitive loads known as lead reactive power.
Reactive power demand The average reactive power used during a set period of time (usually 30 minutes).
Active power
Power that is consumed doing work.
Active power demand
The average active power used during a set period of time (usually 30 minutes).
Power factor (PF/DPF)
Power factor is the ratio of effective power to apparent power. The larger the absolute
value of the power factor, the greater the proportion of effective power, which provides the
power that is consumed, and the greater the efficiency. The maximum absolute value is 1.
Conversely, the smaller the absolute value of the power factor, the greater the proportion of
reactive power, which is not consumed, and the lower the efficiency. The minimum absolute value is 0.
For this device, the sign of the power factor indicates whether the current phase is lagging
or leading the voltage. A positive value (no sign) indicates that the current phase is lagging
the voltage. Inductive loads (such as motors) are characterized by lagging phase. A negative value indicates that the current phase is leading the voltage. Capacitive loads (such as
capacitors) are characterized by leading phase.
The power factor (PF) is calculated using rms values that include harmonic components.
Larger harmonic current components cause the power factor to deteriorate. By contrast,
since the displacement power factor (DPF) calculates the ratio of effective power to apparent power from the fundamental voltage and fundamental current, no voltage or current
harmonic component is included. This is the same measurement method used by reactive
power meters installed at commercial-scale utility customers' facilities.
Displacement power factor, or DPF, is typically used by the electric power system, although
power factor, or PF, is sometimes used to measure equipment in order to evaluate efficiency.
When a lagging phase caused by a large inductive load such as a motor results in a low
displacement power factor, there are corrective measures that can be taken to improve the
power factor, for example by adding a phase advance capacitor to the power system. Displacement power factor (DPF) measurements can be taken under such circumstances to
verify the improvement made by the phase advance capacitor.
Continuous event
function
Functionality for automatically generating the set number of events in succession every
time a target event occurs. Events after the initial event are recorded as continuous events.
This functionality allows an instantaneous waveform of up to 1 s in duration to be recorded
after the event occurs. However, continuous events are not generated when an event
occurs while continuous events are occurring. Additionally, continuous event generation
stops when measurement is stopped. Use this function when you wish to observe a waveform at the instant an event occurs as well as subsequent changes in the instantaneous
waveform. For the PW3198, a waveform of up to 1 s in duration will be recorded.
Index
1
Index
Index
Numbers
10-sec frequency ............................................. A27
Event list notation ............................................. 122
Event waveform ............................................... 189
External event .................................................. A25
External Out ....................................................... 65
B
Battery pack ........................................................30
Beep ....................................................................64
Before connecting measurement cables ...............8
Boot key reset .....................................................73
C
Clamp sensor
Connecting ......................................................47
connecting .......................................................34
Input cable label ..............................................28
Settings ...........................................................39
ClampSensor
Settings ...........................................................56
Clock .............................................................38, 65
Color ...................................................................64
Connection check ...............................................48
Connection diagram ............................................40
Connection mode ................................................39
Continuous event ............................................. A30
Crest factor ...................................................... A25
CT .......................................................................34
CT Ratio ..............................................................56
F
Factory settings .................................................. 74
File types .......................................................... 136
Filter ................................................................... 57
Flag .................................................................. A29
Flag concept ..................................................... 189
Flicker ...................................................57, A5, A29
Fluctuation data ................................................ 189
FORMAT .......................................................... 138
Frequency .......................................................... 56
Frequency cycle ............................................... A27
Frequency fluctuations ....................................... A4
H
Harm Calc
Settings .......................................................... 57
Harmonic ............................................................ A5
Harmonic content percentage .......................... A27
Harmonics phase angle ................................... A26
High-order harmonic component ................A6, A26
High-order harmonic waveform ........................ 189
HOLD indicator ................................................... 20
HTTP server ..................................................... 162
D
Dedicated application program .........................155
Default Gateway ...............................................158
DELETE ............................................................142
Dip .................................................................... A28
Disp COPY Interval .............................................63
DPF .................................................................. A30
E
I Range ............................................................... 56
IEC61000-4-30 ................................................. A24
Initializing ........................................................... 73
Input cable labels ............................................... 28
Inrush Current .................................................... 51
Inrush current .............................................A6, A28
Inspection ..................................................... 6, 216
Inter-harmonics ..........................................A5, A25
Interruption .................................................A5, A27
IP address ........................................................ 159
ITIC curve ......................................................... A24
K
K factor ............................................................. A24
Index
EN50160 .................................................... 51, A24
ENKAKU ...........................................................153
Ethernet (LAN) connection ........................155, 161
Event ................................................................ A25
Event icon ...........................................................52
EVENT indicator .................................................21
Event list ...........................................................121
I
Index
2
Index
Key lock .............................................................. 16
Reverting the instrument to its factory settings .. 73
RS-232C ............................................................. 65
L
LAN .................................................................... 65
LAN cable ................................................. 160, 161
LAN interface ................................................... 157
Language ........................................................... 64
LCD Backlight .................................................... 65
List of event settings .......................................... 66
Lithium battery .................................................. 221
LOAD ............................................................... 145
M
MANU EVENT key ............................................. 71
Manual event .................................................... A30
Manual event settings ........................................ 71
Measurement categories ...................................... 5
N
Negative phase ................................................ A27
Noise ................................................................ 129
Nominal input voltage ....................................... A26
Number or order ................................................. 82
O
Operating state ................................................... 20
Options ................................................................. 3
P
PF ..................................................................... A30
PF Type .............................................................. 56
Phase difference .............................................. A26
Phase names ..................................................... 46
Positive phase .................................................. A27
Power factor ..................................................... A30
PT ....................................................................... 34
Q
Quick setup ........................................................ 50
R
Real-time clock ................................................. 166
Recording ........................................................... 51
Recording Items ................................................. 62
Recording times ......................................... 63, 141
Remaining storage time ................................... 141
Remote control ......................................... 157, 162
Repair ............................................................... 216
Repeat Record ................................................... 59
Replaceable parts and operating lifetimes ....... 216
S
SAVE ................................................................ 144
Save operation ................................................. 139
SD memory card .......................................... 20, 32
Format .......................................................... 138
Self-test .............................................................. 31
Sense ...............................................................A27
Slide reference voltage .....................................A27
Spiral tube .......................................................... 29
Standard Power Quality ..................................... 51
Start time and date ............................................. 58
Stop time and date ............................................. 58
Strap ................................................................... 28
Subnet mask .................................................... 159
Swell .................................................................A27
System reset ...................................................... 73
T
THD Type ........................................................... 57
TIME PLOT Interval ............................................ 63
Time Start ........................................................... 58
Timer event function .........................................A28
Timer event settings ........................................... 72
Total harmonic distortion factor ........................A28
Transient overvoltage .........................................A4
Transient waveform .......................................... 189
Transporting ..................................................... 216
Trend time series graphs .................................... 91
U
U Event ............................................................... 51
Udin .................................................................... 55
Unbalance ..........................................................A5
Unbalance factor ..............................................A29
URMS Type ........................................................ 56
USB connection ................................................ 155
USB interface ................................................... 156
V
Vector ................................................................. 48
VIEW ................................................................ 143
Voltage cord
Attaching ........................................................ 46
Voltage dip .........................................................A4
Voltage swell ......................................................A4
Voltage Waveform Comparison .......................A11
VT Ratio ............................................................. 56
VT(PT) ................................................................ 34
Index
3
Index
W
Warm-up .......................................................36, 37
When the memory is full .....................................63
WIRING
Settings ...........................................................55
Z
Zero adjustment ..................................................37
Zero phase ....................................................... A27
Index
Index
Index
4
Headquarters
81 Koizumi, Ueda, Nagano 386-1192, Japan
TEL +81-268-28-0562 FAX +81-268-28-0568
E-mail: [email protected] URL http://www.hioki.com/
(International Sales and Marketing Department)
HIOKI USA CORPORATION
6 Corporate Drive, Cranbury, NJ 08512, USA
TEL +1-609-409-9109 FAX +1-609-409-9108
E-mail: [email protected] URL http://www.hiokiusa.com
HIOKI (Shanghai) Sales & Trading Co., Ltd.
1608-1610, Shanghai Times Square Office
93 Huaihai Zhong Road
Shanghai, P.R.China POSTCODE: 200021
TEL +86-21-63910090 / 63910092 FAX +86-21-63910360
E-mail: [email protected] URL http://www.hioki.cn
Beijing Representative Office:
TEL +86-10-84418761 / 84418762 FAX +86-10-84418763
E-mail: [email protected]
Guangzhou Representative Office:
TEL +86-20-38392673 / 38392676 FAX +86-20-38392679
E-mail: [email protected]
HIOKI INDIA PRIVATE LIMITED
Khandela House, 24 Gulmohar Colony
Indore 452 018 (M.P.), India
TEL +91-731-4223901 / 4223902 FAX +91-731-4223903
E-mail: [email protected] URL http://www.hioki.in
HIOKI SINGAPORE PTE. LTD.
33 Ubi Avenue 3, #03-02 Vertex Singapore 408868
TEL +65-6634-7677 FAX +65-6634-7477
E-mail: [email protected]
1104
Edited and published by Hioki E.E. Corporation
Technical Support Section
• All reasonable care has been taken in the production of this manual,
but if you find any points which are unclear or in error, please contact
your supplier or the International Sales and Marketing Department at
Hioki headquarters.
• In the interests of product development, the contents of this manual are
subject to revision without prior notice.
• The content of this manual is protected by copyright. No reproduction,
duplication or modification of the content is permitted without the
authorization of Hioki E.E. Corporation.
Printed in Japan
Printed on recycled paper