1
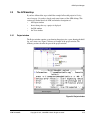
ARM Debuggers for Windows and UNIX
3.4
Breakpoints, watchpoints, and stepping
You use breakpoints and watchpoints stop program execution when a selected line of
code is about to be executed, or when a specified condition occurs. You can also execute
your program step by step. This section contains the following subsections:
•
Simple breakpoints
•
Simple watchpoints on page 3-29
•
Complex breakpoints on page 3-30
•
Complex watchpoints on page 3-32
•
Backtrace on page 3-33
•
Stepping through an image on page 3-34.
3.4.1
Simple breakpoints
A breakpoint is a point in the code where your program is halted by the ARM Debugger.
When you set a breakpoint it is marked in red in the left pane of the breakpoints window.
There are two types of breakpoint:
•
a simple breakpoint that stops at a particular point in your code
•
a complex breakpoint that:
— stops when the program has passed the specified point a number of times
— stops at the specified point only when an expression is true.
You can set a breakpoint at a point in the source, or in the disassembled code if it is
currently being displayed. To display the disassembled code, either:
•
select Toggle Interleaving from the Options menu to display interleaved source
and assembly language in the Execution window
•
select Disassembly... from the View menu to display the Disassembly window.
You can also set breakpoints on individual statements on a line, if that line contains
more than one statement.
You can set, edit, or delete breakpoints in the following windows:
•
Execution
•
Disassembly
•
Source File
•
Backtrace
•
Breakpoints
•
Function Names
•
Low Level Symbols
•
Class View (if C++ is installed).
3-26
Copyright © 1997, 1998 ARM Limited. All rights reserved.
ARM DUI 0040D