1
100
80
60
40
20
0
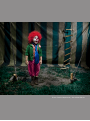
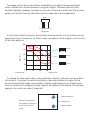
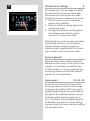
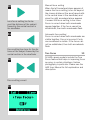
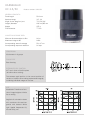
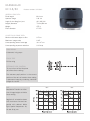
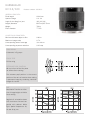
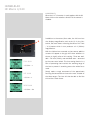
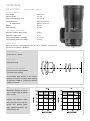
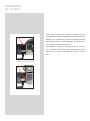
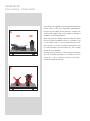
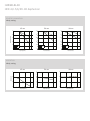
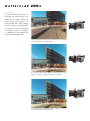
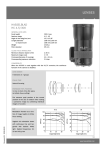
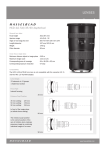
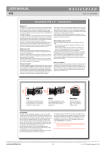
In this illustration an MTF chart is laid
over an image to help demonstrate the
relationship between curves and what they
represent in practice. In this case you should
expect exceptional sharpness in the center,
as indicated by the very high position of the
curves on the chart.
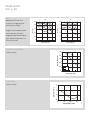
Towards the edge of the frame, and at
another aperture setting, the curves are
lower down on the chart, indicating a slight
decrease in sharpness compared to the center. Nevertheless, the sharpness remains
extremely good.
It should be emphasised, though, that this
difference is only noticeable under great
magnification and in most practical situations is very difficult to perceive.
0
0.2
0.4
0.6
0.8
1.0