1
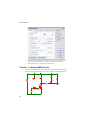
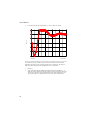
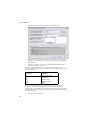
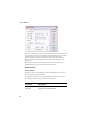
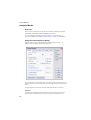
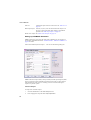
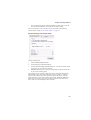
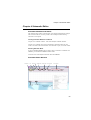
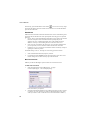
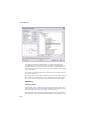
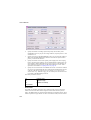
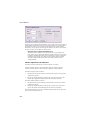
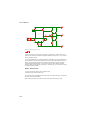
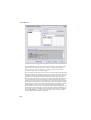
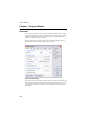
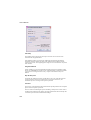
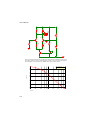
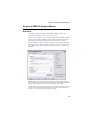
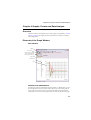
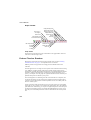
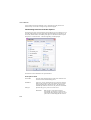
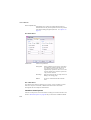
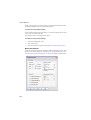
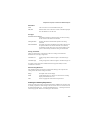
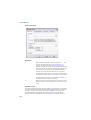
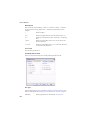
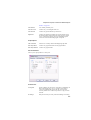
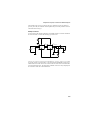
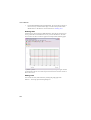
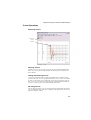
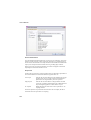
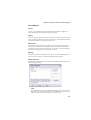
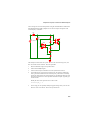
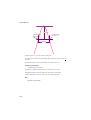
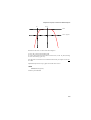
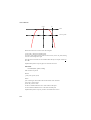
Chapter 9 Graphs, Probes and Data Analysis
Feature” on page 233
Use Selected
Use currently selected y-axis
Use New Y-axis
Create a new y-axis alongside main one
Use New Grid
Create a new grid stacked on top of main axis
Digital Axis
Create a new digital axis. Digital axes are placed at the top of
the window and are stacked. Each one may only take a single
curve. As their name suggests, they are intended for digital
traces but can be used for analog signals if required.
Graph Options
Add To Selected
Add curve to currently selected and displayed graph sheet
New Graph Sheet
Create a new graph sheet within current graph window
New Graph Window
Create a new graph window.
Axis Scales Sheet
Allows you to specify limits for x and y axes.
X-Axis/Y-Axis
Lin/Log/Auto
Specify whether you want X-Axis to be linear or logarithmic. If
Auto is selected, the axis (X or Y) will be set to log if the x
values are logarithmically spaced. For the Y-axis it is also
necessary that the curve values are positive for a log axis to be
selected.
No Change
Keep axes how they are. Only relevant if adding to an existing
227