1
4.2 Handling of Process Parameters
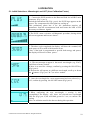
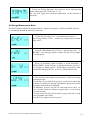
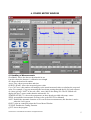
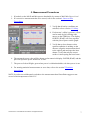
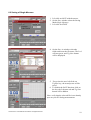
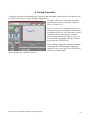
It is possible to set two threshold power level in order to monitor if the power remains within fixed
limits. This feature extends the PLUS applicability to rigorous power control and monitoring,
necessary in most application.
Process Parameters: when power measured is within the thresholds limits the rectangular Led is
green; when outside is red. The overtaken threshold is indicated by a red round Led.
MAX/Min Power Level: sets process thresholds. Insert the desired threshold value (Max. 13000) and
press Enter; if the Min Threshold< Max Threshold condition is satisfied, the value is displayed and
stored in the SetUp file.
4.3 Handling of Statistical Functions
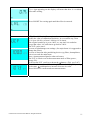
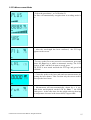
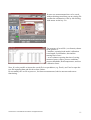
Pmax(W): Shows the max power value measured during the last acquisition interval
Pmin(W): Shows the min power value measured during the last acquisition interval
Pavg(W): Shows the average value of power measured during the last acquisition interval
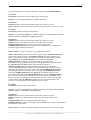
P max − P min
PTP(%): Shows the Peak-to-Peak stability based on the formula PTP =
⋅100
P max
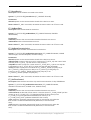
STD(W): Shows the measurement Standard Deviation based on the formula
n
STD =
∑ ( Pi − Pavg )
2
i =1
n −1
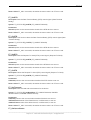
STD
⋅100
Pavg
Duration(s): Shows the duration of the acquisition interval in sec.
Elapsed Time(s): Shows the time elapsed after acquisition started.
START: Starts acquisition
STOP: Ends acquisition
SAVE: enables an automatic saving on file of done statistical measurements; the function is enabled
when the Led is green.
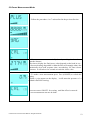
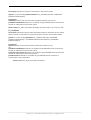
RMS(%): Shows the RMS stability based on the formula RMS =
4.4 Handling of Screen Plots
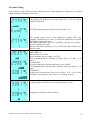
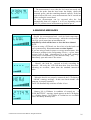
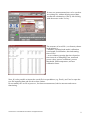
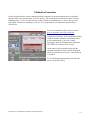
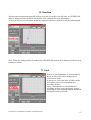
The screen plot displays measured power (blue lines) and preset values of thresholds (red lines).
Graph Power Max/Min (W): sets the Power axis on the power plot. Insert the desired full scale and
press Enter: measured values will be automatically scaled.
Graph Time: sets the Time axis on the power plot; available time scales are 60(sec), 2(min), 5(min),
30(min), 1(hour), 12(hours). Press Enter to confirm. If a lower time scale is selected, data on plot
are refreshed.
LaserPoint srl PLUSSoftUsb User Manual All Rights Reserved
6