1
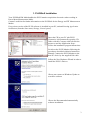
PLUSSoftUsb
Power Meter Mode
User Manual (Vers. 1.03)
Laserpoint srl - Via Burona, 51 - 20090 Vimodrone (Milano) - Italy
Phone +39 02 27 400 236 - Telefax +39 02 25 029 161
www.laserpoint.it
LaserPoint srl PLUSSoftUsb User Manual All Rights Reserved
1
Contents
CONTENTS
2
1. PLUSSOFT INSTALLATION
3
2. SWITCH-ON PROCEDURE
4
2.1 System Requirements
4
4
4
4
2.1.1 Software Requirements
2.1.2 RAM and Hard Disk Space Requirements
2.1.3 Hardware Requirements
2.2 Starting sequence
4
3. STARTING WINDOW
4
4. POWER METER WINDOW
5
4.1 Handling of Measurements
5
4.2 Handling of Process Parameters
6
4.3 Handling of Statistical Functions
6
4.4 Handling of Screen Plots
6
5. MEASUREMENT PROCEDURES
7
6. SAVE MEASUREMENT ON FILE PROCEDURE
8
6.1 Continuous Saving
8
6.2 Saving of Single Measure
10
7.STATISTICS PROCEDURE
12
8.SAVE STATISTICS ON FILE PROCEDURE
13
9. TUNING PROCEDURE
14
10. OVERFLOW
15
11. COOL
15
12. ERROR CONDITIONS
16
13. SAFETY
17
LaserPoint srl PLUSSoftUsb User Manual All Rights Reserved
2
1. PLUSSoft Installation
Your PLUSSoft PM Mode handles the PLUS monitor acquisition electronics when working in
Power Meter Measurement Mode.
Contact LaserPoint for further information on the PLUSSoft for the Energy and FIT Measurement
Modes.
If a previous version of the PLUS software is installed in your PC, uninstall it using Application
Installation (from the Start menu, Settings, Control panel).
Insert the CD in your PC (the PLUS
electronics is disconnected); open the CD
folder with My Computer and left click the
mouse to start the Application Setup .
Follow the installation program instructions.
Switch on the PLUS Monitor following the
procedures described within its Instruction
Manual. Connect the PLUS Monitor to the
host PC device by the supplied Usb cable.
Follow the New Hardware Wizard in order to
install the PLUS’s Drivers.
Choose not connect to Windows Update to
search for software
Choose the Recommended automatically
software installation.
LaserPoint srl PLUSSoftUsb User Manual All Rights Reserved
3
2. Switch-On Procedure
2.1 System Requirements
2.1.1 Software Requirements
Windows® 2000, Windows 98.
2.1.2 RAM and Hard Disk Space Requirements
64 MB of RAM (recommended), 32 MB of RAM (minimum)
600 kB of free disk space for installation folder.
2.1.3 Hardware Requirements
Intel Pentium® 133 or better, or compatible processor (hardware must be supported by Microsoft
for the operating system used)
800 x 600 VGA video display with 256 colors (1024 x 768 or higher recommended)
CD-ROM drive for initial installation only
Windows-supported display adapter
Mouse or other pointing device
Usb 2.0 port
2.2 Starting sequence
1) Switch on the PLUS Monitor following the procedures described within its Instruction
Manual.
2) Connect the PLUS Monitor to the host PC device by the supplied Usb cable.
3) From the same folder used to install the PLUSSoftUsb, run the Application
PLUSSoftUsb.exe.
3. STARTING WINDOW
Quit: to exit the program
Start: run the Power Meter window.
LaserPoint srl PLUSSoftUsb User Manual All Rights Reserved
4
4. POWER METER WINDOW
4.1 Handling of Measurements
HeadModel: shows the detector head model in use
Lambda: shows the detector’s calibration wavelength
SN: shows the head serial number
Actual Time: shows present date and time
POWER (W/mW): shows the measured power value
User Cal Factor: this number will multiply to the actual measured value to calculate the corrected
value. For example, if you are measuring the laser beam passing through the 99.9% back reflector
of a laser (giving 1/1000th of the real value), enter 1000 in the dialog box. The PLUSSoft will
display the laser’s power rather than the measured 0.1%.
TEMPERATURE (°C): shows the temperature on those heads provided with temp. sensor
ZERO: accomplishes an automatic Zeroing (refer to the PLUS User Manual)
SAVE: Enables the automatic function to save on file done measurements; this function is active
when the Led is green.
PRINT: print on connected printer the Power Meter Window
TUNING: Enables the Tuning Function
QUIT: leaves the program
LaserPoint srl PLUSSoftUsb User Manual All Rights Reserved
5
4.2 Handling of Process Parameters
It is possible to set two threshold power level in order to monitor if the power remains within fixed
limits. This feature extends the PLUS applicability to rigorous power control and monitoring,
necessary in most application.
Process Parameters: when power measured is within the thresholds limits the rectangular Led is
green; when outside is red. The overtaken threshold is indicated by a red round Led.
MAX/Min Power Level: sets process thresholds. Insert the desired threshold value (Max. 13000) and
press Enter; if the Min Threshold< Max Threshold condition is satisfied, the value is displayed and
stored in the SetUp file.
4.3 Handling of Statistical Functions
Pmax(W): Shows the max power value measured during the last acquisition interval
Pmin(W): Shows the min power value measured during the last acquisition interval
Pavg(W): Shows the average value of power measured during the last acquisition interval
P max − P min
PTP(%): Shows the Peak-to-Peak stability based on the formula PTP =
⋅100
P max
STD(W): Shows the measurement Standard Deviation based on the formula
n
STD =
∑ ( Pi − Pavg )
2
i =1
n −1
STD
⋅100
Pavg
Duration(s): Shows the duration of the acquisition interval in sec.
Elapsed Time(s): Shows the time elapsed after acquisition started.
START: Starts acquisition
STOP: Ends acquisition
SAVE: enables an automatic saving on file of done statistical measurements; the function is enabled
when the Led is green.
RMS(%): Shows the RMS stability based on the formula RMS =
4.4 Handling of Screen Plots
The screen plot displays measured power (blue lines) and preset values of thresholds (red lines).
Graph Power Max/Min (W): sets the Power axis on the power plot. Insert the desired full scale and
press Enter: measured values will be automatically scaled.
Graph Time: sets the Time axis on the power plot; available time scales are 60(sec), 2(min), 5(min),
30(min), 1(hour), 12(hours). Press Enter to confirm. If a lower time scale is selected, data on plot
are refreshed.
LaserPoint srl PLUSSoftUsb User Manual All Rights Reserved
6
5. Measurement Procedures
1. If needed, set the MAX and Min process thresholds, by means of MAX/Min Power Level.
2. If a successive measurement has to be stored, refer to the section 6. Save on File
Procedures
3. Verify that all safety conditions are
satisfied; refer to section 13. Safety
4. If a detector’s offset is present , a Zero
can be made by left clicking with
mouse on the ZERO key. The display
POWER (W/mW) will zero, together
with the plot of power on the graph.
5. Verify that no laser beam or other
spurious radiation is striking on the
detector; align the measurement head
to the optical path and open the laser
shutter. Verify that only the sensor
surface is intercepting the laser beam .
6. The measured power value will be shown on the numerical display POWER(W/mW) and the
plot will report the power behaviour vs time.
7. The process Leds will light: green when power is within thresholds, red when power is not.
8. For starting statistical measurements or save data, refer to the section 7.Statistics
procedures
NOTE: In order to avoid thermal overloads to the measurement head LaserPoint suggest to not
exceed a limit temperature of 80-82°C.
LaserPoint srl PLUSSoftUsb User Manual All Rights Reserved
7
6. Save Measurement on File Procedure
Whenever measurement data need to be saved on files, the SAVE function must be enabled first,
following the described procedure. The Led accompanying the SAVE key, when green, shows that
this function is active.
Data may be saved continuously or the actual value may be saved at any time under user selection,
as a single measurement.
6.1 Continuous Saving
1. Left click on SAVE with the mouse.
2. On the Save window select the Saving
Mode Continuous
3. Select the Sampling Time for the
saving function (1, 15, 60sec; 5, 30min;
1h)
4. Left click on START
5. Select the folder on the Save As
window and insert the file name. The
Led will turn green. At the end of each
Sampling Time the power value will
be automatically saved
6. To disable the SAVE function click on
the key; the Led turns red.
Note: verify that the selected file is not already
open on your PC during measurement.
LaserPoint srl PLUSSoftUsb User Manual All Rights Reserved
8
In case new measurements have to be saved on
an existing file, without deleting stored data,
confirm the substitution of file by left clicking
with the mouse on the Yes key.
The structure of saved file ( .txt format), shown
in the picture is:
- headline, reporting head model, calibration
wavelength, serial number, date and starting
time of save
- seven columns reporting the time elapsed at
time intervals of Sampling Time, measured
power values, process conditions, process
thresholds, Head temperature, and user
calibration factor.
Note: It is also possible to import the saved file in a spreadsheet (e.g. Excel); use Excel to open the
text file importing data and use tab as data limiter.
Do not modify the .txt file to preserve, for future measurements, both its structure and correct
functioning .
LaserPoint srl PLUSSoftUsb User Manual All Rights Reserved
9
6.2 Saving of Single Measure
1. Left click on SAVE with the mouse.
2. On the Save window select the Saving
Mode Single Measure
3. Left click on START
4. On the Save As window select the
folder and insert the file name. The Led
will turn green, and Trg Save button
will be displayed.
5. Every time the user left clicks on
TrgSave key, the actual power will be
saved
6. To disable the SAVE function, click on
the key; the Led turns red and Trg Save
button will be hidden.
Note: verify that the selected file is not already
open on your PC during measurement.
LaserPoint srl PLUSSoftUsb User Manual All Rights Reserved
10
In case new measurements have to be saved,
without deleting stored data, on an existing file
confirm the substitution of file by left clicking
with mouse on the key Yes.
The structure of saved file ( .txt format), shown
in the picture is:
- headline, reporting head model, calibration
wavelength, serial number, date and the
starting time of save
- seven columns reporting the time of saving,
measured power values, process conditions,
process thresholds, Head temperature, and user
calibration factor.
Note: It is also possible to import the saved file in a spreadsheet (e.g. Excel); use Excel to open the
text file importing data and use tab as data limiter.
Do not modify the .txt file to preserve, for future measurements, both its structure and correct
functioning .
LaserPoint srl PLUSSoftUsb User Manual All Rights Reserved
11
7.Statistics Procedure
Set the acquisition time interval during which the statistics of measurements must be calculated;
digit the time value (greater than 1) in Duration(s). For acquisition intervals lower than 1.000 sec
sampling time is 1 sec; for intervals lower than 10.000 sec sampling time is 10sec; for intervals
lower than 100.000 sec sampling is 100 sec. It is not possible to set acquisition periods above
100.000 sec.
To record statistical values refer to section
8.Save statistics on file procedure
Left click the mouse on Start to begin
statistical calculations. Select within the dialog
window whether statistical calculations have
to run continuously or just for a single
acquisition interval. All indicators within the
STATISTICS section will be zeroed.
At the end of each acquisition interval, the
calculated statistical values will be displayed
on the screen and saved on file, if this function
is enabled.
To end statistical measurements left click the
mouse on the STOP key .
LaserPoint srl PLUSSoftUsb User Manual All Rights Reserved
12
8.Save statistics on file procedure
Whenever statistical information have to be saved on file, the saving function must be enabled
following a procedure similar to the one described on section 6. Save Measurement on File
Procedure; the SAVE key is now within the STATISTICS section. The associated Led, when
green , shows that the function is enabled.
The structure of saved file ( .txt
format), as shown in the picture, is:
- headline, reporting head model,
calibration wavelength, serial number,
date and time of starting save
- eleven columns reporting the
calculated values of statistical
measurements, updated at each
acquisition time interval measurement,
sampling time and number of samples within each acquisition interval.
Note: It is also possible to import the saved file in a spreadsheet (e.g.Excel): use Excel to open the
text file importing data and use tab as data limiter.
Do not modify the .txt file to preserve, for future measurements, both its structure and correct
functioning
LaserPoint srl PLUSSoftUsb User Manual All Rights Reserved
13
9. Tuning Procedure
Visualizes variations of measured power and stores the maximum reached power; this function can
be used for laser source or laser machines adjustment.
TUNING: enables the Tuning function and
sets the actual power as reference value for
Power Variation (%).
Power Variation (%): the display shows as a
numerical value the percentage variation from
the initial power level. Two bars show positive
variations (green) and negative variations
(red); bars are limited to a range of ±25%: in
case of broader variations, zero the reference
by pressing the TUNING key.
Power Max(W): shows the reached maximum
value after the TUNING function has been
enabled. To zero press QUIT and TUNING to
enable the function again.
QUIT: disables the TUNING function.
LaserPoint srl PLUSSoftUsb User Manual All Rights Reserved
14
10. Overflow
All times the measurement head will undergo to power levels above its full scale, an OVERFLOW
alarm is displayed. Refer to the PLUS Monitor User’s Manual for more information.
As soon as the power level returns below the permitted full scale, acquisition will be enabled again.
Note: When the saving function is enabled, the OVERFLOW alarm will be displayed in the Process
Parameter column.
11. Cool
Whenever the temperature of detector head is
above its limit, this will be displayed as a
COOL alarm (red).
In this cases, switch the laser off and cool the
head taking care not to contaminate the
absorbing surface.
Note: occasional dirt or contamination of
absorbing surfaces may compromise system
performance both regarding damage thresholds
and measurement precision.
LaserPoint srl PLUSSoftUsb User Manual All Rights Reserved
15
12. ERROR CONDITIONS
Whenever an error condition in the Software is detected , a
window claiming the error is displayed.
The meaning of error windows and how to solve the related
problems are displayed in the following table.
In any case, by left clicking the mouse on OK the program will
be terminated.
Error Window
COMMUNICATION ERROR
Conditions
No communication between
PLUS and PC.
COMMUNICATION ERROR
Communication between PLUS Check the connection cable
and PC is interrupted during
between PLUS and PC;
operation.
Check the PLUS electrical
supply .
Communication between
Check connection between
measurement head and PLUS is measurement head and PLUS.
interrupted.
DETECTOR HEAD ERROR
LaserPoint srl PLUSSoftUsb User Manual All Rights Reserved
Solutions
Check the cable connecting
PLUS to PC;
Check connection between
PLUS and measurement head;
Check the PLUS electrical
supply.
16
13. Safety
WARNING!
The user of Power/Energy measurement instruments must be trained to the use of lasers and their
associated risks (ref. EN 60825). LaserPoint is in no way liable for any damage resulting from
misuse, careless or use above rated limits for the instrument.
IMPORTANT: Take all the required safety procedures to work with laser beams and wear suitable
protection glasses all the time!
Be extremely careful with radiation either back-reflected or back-scattered from detector surfaces,
housings, mounts and stainless steel post!
Measurement heads temperatures may reach 85°C.
LaserPoint srl PLUSSoftUsb User Manual All Rights Reserved
17