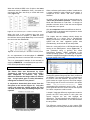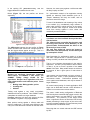
1
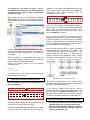
The Association of System
Performance Professionals
The Computer Measurement Group, commonly called CMG, is a not for profit, worldwide organization of data processing
professionals committed to the measurement and management of computer systems. CMG members are primarily concerned
with performance evaluation of existing systems to maximize performance (eg. response time, throughput, etc.) and with capacity
management where planned enhancements to existing systems or the design of new systems are evaluated to find the necessary
resources required to provide adequate performance at a reasonable cost.
This paper was originally published in the Proceedings of the Computer Measurement Group’s 2010 International Conference.
For more information on CMG please visit http://www.cmg.org
Copyright 2010 by The Computer Measurement Group, Inc. All Rights Reserved
Published by The Computer Measurement Group, Inc., a non-profit Illinois membership corporation. Permission to reprint in whole
or in any part may be granted for educational and scientific purposes upon written application to the Editor, CMG Headquarters,
151 Fries Mill Road, Suite 104, Turnersville, NJ 08012. Permission is hereby granted to CMG members to reproduce this
publication in whole or in part solely for internal distribution with the member’s organization provided the copyright notice above is
set forth in full text on the title page of each item reproduced. The ideas and concepts set forth in this publication are solely those
of the respective authors, and not of CMG, and CMG does not endorse, guarantee or otherwise certify any such ideas or concepts
in any application or usage. Printed in the United States of America.
Paper Number: 5002
PERFORMANCE ENGINEERING PARABLES
Chris B. Papineau
[email protected]
"Software Performance is like life": This paper will expose approximately
20 commonly misunderstood concepts and ubiquitous mistakes in
performance analysis of software systems. Two devices will be used to
communicate these concepts:
- Analogies and metaphors from the non-software world, including pop
culture, sports, and medicine. These will be used to make the nature of
the software problem apparent to as broad an audience as possible.
- Actual customer cases involving the Oracle JD Edwards EnterpriseOne
product. Batch and interactive applications will be featured, as well as C
and SQL.
Introduction
The most misunderstood area of software engineering
is undoubtedly that of performance engineering and
analysis.
Any discussion of software performance must begin
with an understanding of its most basic concepts.
Everything
reduces
to
First
Principles:
WHERE IS THE CODE OR SYSTEM SPENDING ITS
TIME?
This breaks down into two basic sub-principles
(Figure 1):
• What gets called too many times? A
function or API may be taking very little time
per call, but get called a very large amount of
times.
• What is taking too long? A function or API
may be called only once, but consume 90% of
the runtime.
One looks first for where the time is spent, not to
apply rules in a rote manner. Performance analysis is
non-linear thinking; it is NOT a “top ten list”, nor is it
a set of tools, anecdotes, or rules. The latter items are
consequences which follow from First Principles.
The performance analysis process is much like
pruning a large tree; one looks first to trim entire
branches, not small leaves. The first goal of that
analysis process is to find the big branches. See
Figure 2 below:
Figure 2. Performance Engineering is like pruning a tree
One should assume NOTHING a priori about where
the time is being spent, or how a given change will
impact a particular application or use case. Rather,
the process in question is profiled, and the resulting
data can reveal where the time is spent.
Figure 1. Software Performance First Principles
Tools are the opium of the software developer
Software Performance is a distinct discipline
•
•
An ear nose and throat doctor does not take a
two day class to learn how to do heart
transplants.
A plastic surgeon – though highly skilled –
cannot do arthroscopic knee surgery.
There are many different career paths within the field
of medicine, each requiring very different areas of
expertise, different specialized training, and separate
certifications by the appropriate boards.
While
everyone with the letters “M.D.” after their name
shares certain skills in common, the individual
specialized fields often have very little overlap, and
represent distinctly different professions in their own
right.
The first notion which is probably new to most people
is that performance engineering is truly an entire
discipline within the software world.
Most software professionals with any degree of
experience will agree on certain areas of expertise
which constitute distinct career paths.
Some
examples:
• Database Administrator
• Network Administrator
• UNIX system administrator
• C programming
• Java programming
In the opinion of the author, the role of “Performance
Engineer” belongs on this list, though it has no major
certifications of which the author is aware. It is NOT a
rote, “plug and chug” skill that one learns in a
weekend, in the manner one would learn how to use a
new C++ compiler. It is NOT like learning times
tables, which are memorized, and then used
perfunctorily.
Rather, software performance is a skill few people in
the profession – including some of the most skilled
developers and programmers – ever truly master.
The major difficulty software professionals have with
this concept is that they view performance as
something they learn from a “top ten list” or a
reference document which lists “tips and tricks”. They
tend to see performance as an afterthought, or
something that is an adjunct to functional knowledge.
But true mastery of software performance comes in
grasping that one First Principle, restated here:
WHERE IS THE CODE OR SYSTEM SPENDING ITS
TIME?
•
•
You don’t learn surgery by learning how to
use a bone saw and a scalpel.
Because you have read the user’s manual for
a circular saw and a nail gun does NOT mean
you can frame and build a house
Similarly, because one has been given a tutorial on a
Visual Quantify or tprof does NOT mean one can
properly analyze performance. Handing a tool to
developers is NOT tantamount to preparing them for
performance analysis.
One does not learn performance by learning tools.
Without firm grounding in concepts and First
Principles, the tools are dangerous. The tools will
provide answers, but answers mean nothing without
understanding the question. The answers will merely
give delusions of progress
Tools all do the same thing:
They give answers to meaningful, well-formed
questions concerning a well-defined problem
It is a very common misconception that performance
is simple an add-on task to a software project – a
technician’s job requiring only the output from a
profiling tool. The author commonly receives requests
for seminars on how to use tools, when they should
be asking for seminars on how to analyze
performance.
Data from profiling tools does NOT spit out a list of the
solutions. Oracle’s JD Edwards EnterpriseOne is an
Enterprise Resource Planning (ERP) package which
has a customized profiling tool called Performance
Workbench (PW), but it does NOT belch out a shrinkwrapped answer to performance issues.
Many
customers and implementation partners indeed
believe it will output such a concise list of solutions to
performance problems in an almost supernatural
manner. All too often, performance work is reduced
to churning out a report and reading the answers.
When properly used and when its data is properly
interpreted, PW is often a crucial tool which helps find
the answers to JD Edwards application performance
problems. Other software suites have similar facilities.
But the output data must be interpreted and
analyzed by skilled individuals, just as radiologists
must do with enigmatic MRI images. This is true of
ANY profiling tool. There is no shortcut to this.
In the book The Hitchhikers Guide to the Galaxy by
Douglas Adams, a supercomputer called Deep
Thought was created to compute the “Ultimate
Answer to the Universe”. After seven and a half
million years, it computed an answer of “42”.
However, Deep Thought was unable to produce the
Ultimate Question - so the answer was meaningless.
actual customer cases are listed below. All of these
are non-starters; none of these were actionable items
without much more specific definitions:
In other words: GARBAGE IN, GARBAGE OUT
•
“I reviewed your logs. Overall performance is
slow across the board.”
“If you don't know where you're going, chances
are you will end up somewhere else.”
- Yogi Berra
•
“Scheduled to go live in Nov 14. Performance
issues across the board seem to be
right now the major concern.”
One can’t find a solution if one is guessing at what the
problem truly is. One will simply end up with a
solution to a non-existent problem.
•
“From what I understand this is across the
board, all applications as compared to last
week.”
Problem Definition (“GoFaster=ON”)
Without a crisp, specific definition of the problem, one
will be guessing the solution.
The simple fact is that there are no “spells” or “chicken
bones” to resolve performance issues. They must be
analyzed and specified just like any other problem
In the experience of the author, there is a widespread
perception that merely stating “Performance is slow”
should be sufficient to define a problem, e.g. there
must be a “Unified field theory” of Performance.
For a functional bug, few people would accept the
definition: “This application is broken across the
board. Fix it.” One would immediately ask for specific
details: “What specifically is “broken”? In which
application and use case? What are the symptoms”
For performance issues, why would things be any
different???
Rigorously defining the problem comes before
everything else…including log collection, profiling
etc….
Without context, one does not know how to interpret
any data collected, or even if the data has accurately
and properly recorded the problem.
• Which application(s) and version(s) are
involved?
• What are the details of the use case?
• What specific operation(s) in the use case
exhibits the slowness?
All of this should be in end-user language. The end
users who are reporting the problem need to be
involved in the defining the problem. This is Systems
Analysis 101.
There should be no “weasel words” in the definition;
words and phrases which are inherently vague are
indicative of a specious problem definition. The
author’s pet peeve here is the infamous phrase:
“across the board”. Some typical non-definitions from
Following is a sample problem definition scenario
using the JD Edwards EnterpriseOne Sales Order
Entry interactive application:
To simply state “Sales Order Entry is slow” is NOT
a problem definition; it is far too vague to be
actionable.
Sales Order Entry is NOT a simple, monolithic piece
of code. It is a complex interactive application which
calls many large and intricate C Functions, as well as
proprietary JD Edwards Event Rules (ER) code. It
has many possible use case permutations and other
many moving parts:
• “Find” operations
• Detail Line Entry
• “OK” processing
• Form rendering
• Grid rendering
This is still NOT a problem definition:
“Sales Order entry is slow. It takes too long to
enter a detail line.”
A precise definition must include a GOAL or TARGET,
with business reasons. The customer needs to state
expectations and QUANTIFY the issue.
One must know how far the current measurements
are from the goal. Is it 25% or 500%?
Do expectations need to be managed or adjusted?
Is the effort as defined a “fool’s errand” from the start?
Now THIS is a problem definition:
“On the Sales Order Entry form on the JD
Edwards EnterpriseOne 8.11 SP1 html client, it
takes 7-10 seconds to validate each detail line,
which is unacceptable since orders typically have
20-30 lines, and a customer is waiting on the
phone all that time. We will lose business if this
keeps up.”
As is THIS:
“On the 8.12 html client Sales Order Entry form,
when saving the order and pressing “OK”, it takes
2-3 minutes for the screen to return. This is
unacceptable because users are entering dozens
of orders per day. This is a drop in productivity
we cannot live with.”
available. A multi-lane road DOES allow more of the
same cars to travel at the same time (Figure 5).
Analogously, more batch programs can run
concurrently on more CPUs
What would add value to the definition are screen
shots (Figure 3) with precise descriptions of exactly
which part of the application is deemed problematic by
users:
Figure 5. Multiple lanes allow more cars to travel
This is a very common misconception among IT
professionals. The purpose of multi-CPU machines is
not to make any single program run faster; it is to
allow more programs to run at the same time. They
provide scalability, not speed.
Large, multi-CPU machines are ubiquitous among
large software customers. The author has worked on
machines as large as 32 CPUs running JD Edwards
software. These machines are particularly well suited
to the JD Edwards EnterpriseOne architecture due to
the multi-process nature of its design.
Figure 3. Problem Definition – interactive application screen shot
Visual representations of the problem, when possible,
add clarity to exactly which part of the software to
investigate.
When the author is in a particularly jaunty frame of
mind, he will respond to a request to fix an “across the
board” problem in the following manner:
Enable the following setting in the JD Edwards
configuration file:
But to leverage multiple CPUs to scale JD Edwards
EnterpriseOne batch applications, for example, one
must configure the jobs to run concurrently. That
means breaking up the work of a single job into
multiple concurrent jobs (Figure 6), each of which
processes non-overlapping portions of the data.
[MAGIC]
GoFaster=ON
The vague nature of the question is matched by the
facetiousness of the answer.
Figure 6. Concurrency scales batch jobs
More CPUs does NOT equal more speed
You can’t make a car go faster by adding lanes to
the road (Figure 4).
JD Edwards EnterpriseOne has features which
streamline and automate the procedure of breaking up
the work into multiple parallel jobs.
In this manner, multiple CPUs CAN be used to
complete the work of a single batch application in less
time by scaling to multiple concurrent jobs. The
operating system takes care of the task of assigning
the work for each batch process to a dedicated CPU.
Performance analysis is a TOP DOWN exercise
Figure 4. One car is NOT faster on a multi-lane road
One cannot make a single threaded program faster by
running it on a machine with more CPUs
A SINGLE THREADED batch program will use ONE
and only ONE CPU, regardless of how many are
•
•
You don’t give CPR to a person without being
certain that they are not merely taking a nap
You don’t perform bypass surgery on a person
with chest pain without a thorough diagnosis,
course of medication, etc…
In the software world, solving a performance problem
does NOT start with generating complex profiles,
debug logs, or painstaking “bare metal” analysis of
code.
An operational profile comes first. This starts with a
problem definition – see the previous section of the
same name. The rest of the operational profile
includes all details of the use case, all the input
parameters, configuration details, number of
concurrent users, and specifications of the machines
used. Different types of software will have slightly
different twists on this, but the concept is the same:
create a detailed description of exactly how the
software is used. The thought process involved in
this first step can sometimes actually lead directly to
answers; insights into the use case and its potentially
suboptimal characteristics sometimes emerge form
this process.
Abstract, top-down system analysis level work is
ALWAYS the next step
“TOP DOWN” means starting with a BUSINESS
PROBLEM, not a problematic piece of code. The
analysis could well lead to complex code analysis if
that is the path the evidence follows, but it is NOT
where the process starts.
This involves challenging the problem statement itself.
Trust NOTHING on blind faith. FUNCTIONAL experts
who understand exactly how the application is used in
the business play a crucial role.
Only one thing is known for certain: that there is a
perceived performance problem with a software
system.
Many “performance” problems have their REAL cause
in the following areas not related to code:
• Configuration
• Runtime processing options
• Data Selection
• Batch Window critical path issues
• Business usage of the application in question
• Use of a far more complex application than is
really needed
• Use of an application not really needed at all
Benchmarks are for hardware, not software
•
You can’t predict or guarantee your salary just
by looking at published salary statistics from
your profession.
• What does the “average” lawyer, or
baseball coach make per year?
The answers to the above questions clearly have a
very large range of answers, so that any aggregated
“average” has little meaning. Some lawyers are
assistant prosecutors for small rural counties; others
are partners in the most prestigious firms. Some
baseball coaches manage professional teams; others
give their time to their son’s Little League squad.
Customers and implementation partners of the J.D.
Edwards EnterpriseOne ERP package often request
“published benchmarks” for specific applications.
The reality is that the JD Edwards EnterpriseOne ERP
package consists of hundreds of batch and interactive
applications, each with a vast multiplicity of use cases.
The product is supported on Microsoft Windows, four
different variations of UNIX, as well as IBM’s OS/400.
These operating system / use case permutations are
multiplied further by the different databases
supported, namely: Oracle, Microsoft SQL Server, and
IBM DB2. The JD Edwards support team at Oracle
simply does NOT maintain “benchmarks” for every
possible combination of all these factors.
“Published benchmarks” are NOT performance
tests. Every ERP installation is as different from every
other as two snowflakes.
The reality is that Oracle’s benchmarks are published
by the hardware vendors, not the software vendors.
Benchmarks are constructed to SELL HARDWARE;
they are not software analysis tools for specific
installations in any way shape or form.
The sort of throughput numbers claimed by the glossy
brochures which describe the benchmarks are usually
“happy path” scenarios. For example, Sales Order
Entry use cases may not contain complex pricing or
transportation functionality for each detail line,
features which are commonly used by customers.
It is similar to a weight lifter claiming he can bench
press three hundred pounds. While this claim may be
true, the three hundred pound figure only applies to a
certain set of very controlled conditions using certain
equipment. It does NOT mean the same person can
carry a three-hundred pound sofa up a flight of stairs.
“Benchmarks” should NEVER be used to predict,
much less guarantee, any specific level of
software performance for any specific customer,
period. At best, they can be viewed as “smoke tests”;
if very basic scenarios do not work, then the more
complex production use cases certainly will not.
There are no 100% guarantees of performance, aside
from thorough testing in the environment and
configuration in which it will be used.
Sample Size is critical
“The power of statistical analysis depends on
sample size: the larger the pile of data the analyst
has to work with, the more confidently he can draw
specific conclusions about it. A right handed hitter
who has gone two for ten against left handed
pitching cannot as reliably be predicted to hit .200
against lefties as a hitter who has gone 200 for
1000.”
- Michael Lewis, Moneyball
Software performance analysis has a great deal in
common with the American game of Baseball: both
rely heavily on statistics to predict future results.
Software performance analysis is at its heart a
statistical exercise, and all statistics are only as good
as the sample size of the data used.
A common miscalculation made by software
developers comes in attempts to extrapolate results
linearly from a very small dataset.
One can’t reliably profile a batch job’s behavior
against one million records by running it against one
record and extrapolating upwards. Software behavior
is inherently NON-LINEAR…despite human attempts
to impose linearity on things.
An example of this would be when a program contains
multiple distinct sections of code which process in
serial fashion (Figure 7). A one-hour sample at the
start of the run may never even capture the serious
problem.
Log sample period – does NOT
cover the problem time frame
Section
1
1 hour
Here is a classic example of the perils of under
sampling in software profiling:
A batch job which ran for over 50 hours was analyzed
using a truncated profile showing only 202 seconds of
the run. The data (taken from the aforementioned
Performance Workbench tool) showed that a single
SELECT statement took 76 seconds (Figure 9):
Figure 9. Long running SELECT in code profile
Based on this result, it was spuriously assumed that
one third of the UBE’s time was spent in this one
SELECT statement. This led to a rabbit hole of
pointless index creation and SQL tuning which lasted
for weeks.
However, a subsequent profile of a much longer run
showed that this SELECT was an utterly insignificant
contributor to the runtime. It happened to be the
query that returned the rows of data which the batch
job would process. In essence, it simply returned the
input data items for the rest of the job. It was a onetime contributor which occurred only at the beginning.
Overreliance on tools and their output data in a
manner which is oblivious to fundamental
performance analysis concepts leads to this sort of
error.
Another example is the CPU profile below of a JD
Edwards batch job (Figure 10). One can clearly see
that the behavior changes over time as different
sections of the code are processed.
Section 2
2 hours
Other factors may cause a precipitous drop in
throughput later in the process, such as memory
consumption reaching thresholds.
10 hours
Figure 7. Truncated sampling hazard: different sections of code
Even if there is only a single section of code which
does all the processing, specific data ranges later in
the process may trigger slower throughput (Figure 8).
Figure 10. Truncated sampling hazard: CPU profile showing
changing batch job behavior over time
Log sample period – does NOT
cover the problem time frame
Data range 1
Data Range
2
1 hour 2 hours
Data Range 3 –
something bad happens here
10 hours
One cannot reliably look at just one small time window
of the job and extrapolate – one must obtain a robust
profile to adequately analyze the job
Truncation is invalid, and does not give a valid
sampling of the application
Figure 8. Truncated sampling hazard: different data ranges
In short…
SAMPLE SIZE is what gives statistical analysis
validity.
the problem, so they offer their wares rather than pass
the problem along. Hence the need for full-time
Performance Engineers to manage and oversee
these sort of efforts.
"There are three types of lies - lies, damn lies, and
statistics."
- Mark Twain
IF THE TIME IS NOT BEING SPENT IN SPECIFIC
IDENTIFIABLE SELECT STATEMENTS
– THEN FORGET ADDING INDEXES
TRUNCATION ≠ SAMPLING !!!
Solutions in search of problems
Antibiotics will NOT cure – or even help – a viral
infection, even when the symptoms are the same
as the bacterial infection it was intended to treat.
In fact – they can be harmful in some cases
Similarly, adding a database index will not help a
performance problem unless the time is spent on a
slow query which has an index opportunity.
Indexes do NOT have mystical properties, improving
things just because they are there. Extraneous
indexes can be HARMFUL to the system:
• They consume disk space
• They add overhead to UPDATE, INSERT, and
DELETE operations, as all indexes need to be
updated when there are base table
modifications.
• An excessive number of indexes can cause a
database optimizer to make incorrect
decisions on how to plan a query.
Perhaps a given index MAY improve the execution
time of a given query, but if that query was only
consuming five seconds of an hour long process, very
little of value has been achieved. Perhaps the five
second query gets reduced to fifty milliseconds due to
the presence of the index, and thus a 99.999…%
reduction in processing time is attained for that one
query. For a science project, that is an excellent
result, but in the Enterprise Software world, what
matters is a business problem. In this case, a
reduction of five seconds from an hour long process is
in the statistical noise, and thus is imperceptible to the
end user. In short – no one cares, and the effort is a
failure to those who matter: the end users.
A DBA will often try to solve performance problems by
mechanically adding new indexes and getting rid of all
the full table scans …even if they have little to do with
the specific problem at hand.
This is due to the phenomenon which impacts all
professional disciplines: A person who knows how
to use a hammer will try to make every problem
into a nail.
As mentioned earlier, software
professionals are as highly specialized as physicians.
Everyone hopes their niche will have the answer to
This is a “BOTTOMS UP” sidetrack from the TOP
DOWN methodology mentioned earlier. It is an
attempt to fix a problem starting with the BACK END
instead of the FRONT END. TOP DOWN analysis
starts with the business problem and the problematic
time window, and follows the profile of that time
window backwards until a culprit is identified.
Use cases
You can’t find out who broke into a Safeway store
in Denver by looking at a security tape from a
Safeway store in Fargo. You need the tape from:
• The same Safeway store that was robbed
• The correct date
• The correct time of day
• The correct part of the store
If any ONE of these factors is incorrect, you will
NOT catch the thief
One can’t analyze a problematic batch program using
any old profiling log generated any old time against
any old dataset using any old set of runtime
parameters….simply because the same batch
program was used to generate the log.
One needs a profiling log generated by:
• The correct application and version
• The correct use case
• The correct configuration
• The correct platform and database
• The problematic performance issue must be
reproduced when the data is collected
This is NOT horseshoes or grenades; “almost” is
usually not good enough. Small details missed will
mean an entire code path is missed, and thus a
completely invalid test. There is no mystical property
of profiling logs or the output of any tool giving them
the power to solve problems.
Performance analysis tools create profiling data; that
data MUST be generated by a valid use case, or it will
not contain information about a problem’s source.
It’s like trying to test the effect of rocks on a car’s
windshield by using marshmallows. The size and
shape may be correct, and one could even spray paint
the marshmallows grey to simulate the rock’s colors.
However, the results will still not be a valid test of the
damage actual rocks can do.
Software Performance Analysis is about
application of First Principles
DO NOT DUPLICATE
You cannot pass a College level open-book
engineering exam by memorizing facts; you MUST
understand the concepts.
But - knowledge of key facts does make the
process more efficient to someone who is already
on top of concepts
You cannot send your twin brother to the doctor
to get your broken leg treated…even though he is
genetically almost identical to you.
One should NOT attempt to “duplicate” a performance
problem on a production system using a different
system with different data, different machines, and
different networks.
This is a BAD idea for most performance issues Complex performance issues should almost NEVER
be taken on with this strategy
A derived environment may or may not surface the
same performance bottlenecks that occur on the
customer’s live system. One cannot realistically
create:
• Number of occurrences of specific values in
data tables
• The relationship of the data:
o key distribution
o order density
o clustering around specific values
o index structure
“The interesting thing about performance changes is
the sheer number of influencing factors can cause
even savvy developers to make wrong choices.
Customer Data, indexes, user behavior, # rows in
tables, database optimization (stats), and machine
speed are all key factors (other than our code).”
- Oracle customer support manager
For large and complex installations, such as ERP
systems, it behooves the customer to have a test
system which mimics the live environment. This is
NOT a luxury.
Any customer who cannot afford such a test
system had better be able to afford downtime of
the live system if problems occur.
Or, the customer MUST be able to collect diagnostic
data in the live environment. Depending on the type
of problem, this can be feasible. In the JD Edwards
EnterpriseOne system, high-overhead profiling can be
enabled only for a single batch job, so that the impact
to rest of the system is minimal.
An absolute requirement for solving complex
production performance problems is real data from a
customer production environment done on their
premise with their use cases.
One does not execute performance analysis via “Top
Ten lists” or anecdotes.
A given action item read from a generic list of “tips
and tricks” may seem to fit a certain situation – but
may not be where the time is being spent.
Analogy: all the swimmers on the beaches of the
world cause ocean levels to rise. This concept is
proved by a person climbing in and out of bathtub
Therefore, ban swimming in the ocean, and worldwide
water levels will drop ….correct?
This is an example of faulty reasoning. The concept
might be technically true and sound from a theoretical
standpoint…but in practice the remedy is irrelevant.
This sort of mistake is the story of a Performance
Engineer’s life. The experience of the author after
more than a dozen years solving performance issues
is that the first attempt to determine the cause is
usually wrong.
Without First Principles, one is
reduced to thrashing and guessing to come up with
answers in this highly non-linear discipline.
The tools and “Top Ten” lists give structure and
efficiency to the wielding of expert knowledge. They
do NOT replace an engineer’s grasp of First
Principles: WHERE IS THE CODE / SYSTEM
SPENDING ITS TIME??
The only way to truly learn this process is in the
School of Hard Knocks and Experience. Repeatedly
working performance issues from First Principles
results in a better feel for performance analysis.
•
•
•
Tips are for waiters; analysis is for engineers
Technicians read from a list created by
engineers
Technicians become engineers when they
add new items to the list
Another salient point: Performance Engineers almost
never resolve issues of any complexity by themselves.
The author has rarely solved any issue as a oneperson team, other than the simplest puzzles with the
most obvious of low-having fruit.
Performance work nearly always requires the
involvement and buy-in of an array of Subject Matter
Experts. In the JD Edwards EnterpriseOne space, a
performance analyst must have at least some of the
following people involved to arrive at the solution of
complex performance problems:
A “tools developer” – this indicates a programmer
who works the low-level, C-based code in which the
back-end functionality is composed.
An “application developer” - this indicates a
programmer who uses the design tools created by the
tools developers to create end-user batch and
interactive applications.
A Database administrator - this person usually does
not have detailed knowledge of the application, but
can help answer questions when problems have been
isolated to the internals of a specific SELECT
statement, for example.
A business analyst – this person may not have
detailed technical knowledge of the software or the
database, but understands how the business is run.
This person can evaluate the real-world feasibility of
proposed solutions to the performance problem.
All CPUs wait at the same speed
You can’t get through gridlock traffic faster by
buying a faster car. So, that 180mph Maserati will
NOT get you to work any faster than a Yugo …
EVEN THOUGH IT WAS VERY EXPENSIVE
Many IT managers do not understand why their
software runs slowly when they have the fastest,
newest, most coveted hardware available. They have
large amounts of their company’s dollars invested in
these machines with the assurances that they will
solve all performance and scalability problems.
Despite this, a desktop PC will sometimes run a given
program more quickly than a server-class machine.
Reality is that slow response times and runtimes have
many possible causes – and many of these are NOT
a function of the size of the machine or the speed of
the CPU.
Contention issues provide the most common
example of this, such as multiple pieces of code
simultaneously accessing a semaphore or other
shared resource.
Row locking or Transaction Processing issues are
contention
issues
at
the
database
layer.
Simultaneous multiple access to a “Next Number”
table is one example of this.
Long-running SELECT statements are another
example. The SELECT could be in need of an
optimal index, refreshing of database statistics, or
may simply return a very large rowset.
All of the above issues have one thing in common –
they involve WAITING. The time spent waiting is NOT
a function of the CPU…because the code is question
is NOT actually running. CPU speed impacts only
running code, not waiting code. Code which spends
its time waiting is NOT CPU limited. Many IT
professionals do not fully appreciate this fact. A CPU
profile which is nearly flatlined indicates to them that
there cannot possible be a problem; after all, the CPU
is not breaking a sweat. But the reality is – it should
be.
The performance game is not played on paper…
You would not fly in an aircraft that has been
proven to fly only in simulations
One cannot execute performance analysis based on
static analysis of code. Performance engineering is
inherently a runtime activity. Talking managers and
developers down from this tree is one of the biggest
challenges to a performance engineer.
This is
because reading code is much cheaper than setting
up actual valid tests, running iterative tests, and
collecting data
ERP code in particular is very complex – millions of
lines are in play in the JD Edwards EnterpriseOne
product. It is simply not possible to extrapolate what a
given piece of code will do at runtime. The complexity
of enterprise software and the consequences of small
changes to the multiplicity of subtle “moving parts” are
impossible to grasp by manual methods.
Static Analysis of source code files is NOT
performance analysis. While certain classes of “low
hanging fruit” opportunities can be preemptively
spotted in this manner, there is simply no way of
accurately predicting where time will be spent
without running the code and capturing a runtime
profile. Merely reading the code WILL NOT WORK.
In this way, software is like a many-body physics
problem.
Describing the gravitational interaction
between two bodies is mathematically difficult,
between three bodies becomes exponentially more
complex, and more than three is almost impossible.
Also, changes that involve a large amount of code
may not be of major moment to performance, while
changes that are seemingly small and subtle may
have a profound impact on performance. This can
simply not be predicted without runtime analysis and
profiling
One actual example of the perils of static analysis:
A consultant was analyzing a partner’s customization
to a standard JD Edwards batch program which
resulted in greatly reduced throughput.
The consultant spent most of his time looking at the
“larger” code changes. But one seemingly innocuous
modification added a single field to one SELECT
statement, a change easily glossed over by a static
reading of the code.
BUT – it resulted in many more rows returned and a
much longer runtime:
“A slight modification was made, but apparently, it has
caused major timing differences. The original
SELECT was looking for [CTID, JOBS, DCT, KCO,
DOCO (order number)], but the new SELECT is
looking for [CTID, JOBS, DCT, KCO, DOC (invoice
number)]. There can be many, many orders for the
same invoice number in F42565 (Invoice table). I had
left this code alone in my first round of
remediation because there was only a slight
change.”
The customization resulting in the performance hit
was as indicated by the following pseudo code SQL:
Before the customization:
SELECT * FROM F42565
WHERE
(CTID=, JOBS=, DCT=, KCO=, DOCO=)
(DOCO = order #)
After the customization:
SELECT * FROM F42565
WHERE
(CTID=, JOBS=, DCT=, KCO=, DOC=)
(DOC = invoice #)
•
This minor change to one SELECT statement
caused many more rows to be returned (“after”
case), which in turn resulted in a much larger
number of iterations in a C-code while loop
•
This is because there can be a huge number of
orders for the same invoice
This is easy enough to understand once it has been
explained, but this sort of issue is seldom ever
identified solely by reading code
“Life can only be understood backwards, but it must
be lived forward”
- Soren Kierkegaard
While not by itself complete, note that reading code is
often an important part of the analysis process. It
gives context to runtime profiling data. The runtime
data can point back to problematic sections of the
code which would not otherwise be suspect.
Whole ≠ Sum of the parts
Light a match in a room full of two parts hydrogen
and one part oxygen:
BOOM!
Pour a bucket of two parts hydrogen and one part
oxygen on the resulting fire:
Poof….
When testing software, test ONE factor at a time
whenever possible. This is a fundamental Quality
Assurance concept which applies not only to
performance analysis, but to functional testing as well.
Software is wrought with complex interactions which
are neither intuitive nor obvious. Code changes are
NOT mutually exclusive. The impacts of two
changes CANNOT reliably be assumed to add in a
linear fashion. One modification can cancel out the
effects of another
An example of this:
On a recent JD Edwards EnterrpiseOne customer
project, the code of a problematic batch program was
tuned to eliminate extraneous processing. The batch
job had a shorter runtime following this code
modification; a before and after comparison of a single
job showed a 10% increase in throughput.
After this, the author determined that the next logical
step would be to run the batch job as multiple
concurrent jobs, leveraging the customer’s multiprocessor iSeries hardware.
This configuration
change, combined with the code modifcations, was
predicted to yield additional throughput gains beyond
the 10% achieved via code changes.
However, when 10 concurrent jobs were run after the
code fixes were applied, the throughput was about the
same as for a 10-job concurrent run before the code
fixes….so in a concurrent environment, the throughput
gains from the code changes seemingly vanished.
What was happening here?
It turns out that this batch program contained I/O to a
large Journal Entries database table. This table had
about thirty indexes, all of which had to be updated
when the table is updated. On the OS/400 platform,
that creates a type of a lock on the indexes called a
seize. The large number of seizes added more wait
time to the job.
When the individual UBEs in the 10-job run had more
extraneous code (i.e. before the fixes) – the table I/O
across the jobs were less likely to collide with each
other (Figure 11):
When a software performance problem is attributed to
a version upgrade or other change to the system, a
comparison of the “before” and “after” profiles is
essential.
An “after” profile by itself does not always shout out:
“Here’s the performance problem!” It often looks as
bland and featureless as a star field. It’s simply not
possible to discern which of the dots moved against
the fixed stars, so to speak.
Figure 11. Concurrent batch jobs – no DB I/O contention problem
When the code in the individual jobs was more
streamlined and more compact (i.e. after the fixes),
the collisions were actually more likely to occur across
the concurrent jobs (Figure 12):
Figure 12. Concurrent batch jobs – with DB I/O contention problem
So - an improvement in the throughput of a SINGLE
job actually introduced a new issue with concurrency.
Only the comparison makes the differences obvious
The data must be analyzed and interpreted to locate
the delta in the code profiles.
This implies that the software should always be
upgraded first in a robust Test or Development
staging environment, so that both the “old” production
system and the “new” upgraded system exist
simultaneously, and both can be run and profiled.
Below is a code profile from a JD Edwards batch job
running on the IBM System I server (Figure 14). It
was generated using a profiling tool called
Performance Explorer (“PEX”) embedded in the
OS/400 operating system. The batch job in question
exhibited a degraded throughput following an upgrade
to a new version of the code.
This is a quintessential example of the necessity of
applying CONCEPTS – not assembly-line style rules –
in the area of performance analysis!
Discovering Pluto
The Planet Pluto was discovered by Clyde
Tombaugh in 1930 using a clever device called a
blink comparator to discover very subtle
differences between two images taken on different
days. A single photo gave no useful information;
nothing that screamed “I’m a planet!!”
A comparison determined what moved from the
first photo to the second (Figure 13). Only then
could it the planet be spotted against the fixed
star field, and even then, painstaking analysis was
required.
Figure 14. Code profile – after performance fixes
Finding the problem using only this “after” profile was
not possible. The context provided by a comparison to
the “before“ case was essential. By itself, the “after”
profile looked as cryptic as one of the Pluto images.
There simply was not an API or function in this profile
called
“JDE_PerformanceProblem()”
which
encapsulated the problematic area of code. A code
profile generated from the earlier version was required
so a direct comparison could be made:
A simple C language difference engine was created to
process the PEX code profiles in their plain text
format, compare the two, and highlight the
differences. The user interface was created in C++ to
allow easy visual identification of the delta between
the two profiles.
The difference engine feature on this custom PEX
rendering tool more clearly showed that the time spent
Figure 13. Pluto discovery photographs
Credit: Lowell Observatory Archives
in the caching API jdeCacheInitX() was the
biggest difference between the two runs.
However, the same query against a million-row table
will likely employ an index.
Below (Figure 15): the two profiles are shown
separately
So - performance analysis of an application running
against an extremely small database (such as a
“sample” database) will likely be invalid, and not
relevant to actual live usage.
To boot: if the distribution and clustering of key values
is not realistic (e.g. unrealistically large volumes of
sales order records in which the item is the same),
then a different index might be chosen than would
result from running against a more robust and
realistically created database.
…but it isn’t everything
Figure 15. Code profile comparison
The differences between the two profiles in Figure
16 are calculated and sorted onto a single screen, so
that the biggest deltas appear at the top. This is a
sort of software profile “blink comparator”
A software error back on Earth destroyed the Mars
Climate Orbiter.
The software which controlled the thrusters used
the wrong units (Pounds versus Newtons), so the
ground station underestimated the effect of the
thrusters by a factor of 4.45
The craft thus drifted off course and entered a
much lower orbit than planned, and was destroyed
by atmospheric friction
Data Generation for performance testing is a large
and often overlooked task in software performance
testing. It is NOT just about raw “data expansion”
Figure 16. Code profile delta
Size Matters…
Recipes are non-linear instruments, especially
when baking. To DOUBLE a cake recipe, you
CANNOT reliably simply double all the
ingredients. Recipes have ingredients with nonlinear characteristics and inflection points. Some
examples:
• Baking soda, Baking powder, spices
• Cooking time
• Altitude
Testing code against a very small, non-realistic
database will lead to problems. One CANNOT simply
extrapolate the results to a larger database.
Database optimizers will plan and execute the SQL
DIFFERENTLY against a very large database.
Most queries running against a 100-row table will
result in a table scan. It is simply more efficient to test
every row in the table than to search for the best index
This is a very common misconception in the author’s
experience. It is NOT just a question of sheer volume
of data; it is just as much a question of the exact
nature of the data. Many subtle factors are critical to
the amount of time a given piece of code takes to
execute.
Just because one has blasted out large volumes of
data does NOT mean a valid performance testing
environment results. Performance problems may
occur against small databases, and may be absent in
larger databases
On recent internal testing of a batch application, ONE
single row in ONE table caused a 25% difference in
runtime in one environment versus another.
The cause: a table storing configuration of Business
Unit Security data contained ONE single record in the
slower environment, but was EMPTY in the “faster”
environment. The presence of this single record
drove a significant amount of Business Unit Security
related processing in deep layers of the tools code,
including repeated validation of Data Dictionary Items
and retrieval of User Defined codes.
Removing that one record reduced the UBE runtime
by 25%
performance problems … and to catch a thief,
one must examine the correct security camera
footage from the correct location and date.
Conclusions
Performance
is
an
often
overlooked
and
misunderstood genre in the world of software
engineering.
•
Complex customer environments should not
be “duplicated” to solve performance
problems … neither can an ill person send his or
her identical twin to the doctor for treatment.
•
Application of Performance First Principles is
a methodology to be mastered, not a set of
rules to be memorized … just as memorizing
rote facts does not prepare one for a math or
engineering exam.
•
Performance Engineering expertise is NOT
equal to knowledge of how to use profiling
tools….in the same way that knowledge of
hammers and saws does not equate to homebuilding expertise
All CPUs – even the fastest ones - wait at the
same speed … just as all automobiles – even the
fastest ones - will be stationary in a traffic jam.
•
Static review and reading of code is NOT
performance analysis … similarly, one would not
fly in an aircraft which has only been tested in
simulations.
Problem definition is the critical first step to
resolving performance problems….One MUST
know where one is going before one can get
there.
•
Additional CPUs provide more capacity and
scalability, not increased speed for individual
programs….just as more lanes on a road do not
increase a car’s speed, but permit more cars to
travel.
The whole is not the sum of the parts – the
impact of multiple code and configuration
changes often do not add serially…just as
Hydrogen and Oxygen do not retain their
respective properties when chemically combined.
•
Innovative methods of analysis are often
necessary to discover critical patterns in the
data….similar to the “blink comparator” which was
used to find the planet Pluto.
Performance Engineering is a TOP DOWN
exercise … one does not perform open-heart
surgery before attempting other less invasive
procedures.
•
Published benchmarks are marketing devices,
not technical data to prove software
performance levels … just as regional salary
statistics do not guarantee compensation levels
for any specific profession.
Database size matters in performance work;
extrapolation from small datasets lead to
spurious conclusions … just as baking recipes
are often sensitive to the amounts of the
ingredients in non-linear ways.
•
But size isn’t everything: small details can
dramatically impact the results and validity of
a test … this was the case when a single
conversion factor error caused the Mars observer
to crash.
The aim of this paper was to address the most critical
areas of confusion and misconception which often
scuttle performance tuning and analysis efforts.
Analogies and word pictures augmented customer
cases in an effort to illustrate these concepts to a
broad audience:
•
•
•
•
•
•
•
Performance Engineering is a distinct
discipline within Software Engineering …just
as Ophthalmology is a distinct medical discipline.
Sample size is critical in performance analysis
… just as in American Baseball, more at-bats
paint a more accurate picture of a player’s hitting
prowess.
•
“Solutions in search of problems” are guesses
based on symptoms … which seldom lead to
answers… in the same vein, antibiotics do not
cure viral infections, though the symptoms of viral
and bacterial ailments may be similar.
•
Use cases must
customer practices
accurately
in order
represent
to solve
It is hoped that these analogies can be helpful in the
comprehension of Software Performance concepts
both to developers, and to those with a less technical
grounding that supervise and manage the
development efforts.