1
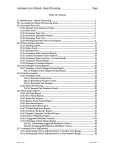
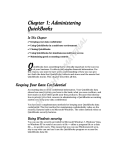
User Manual for cStock
Version 1.0
Oct 2012
Contents
I.
Overview of cStock .......................................................................................................................... 3
A.
Vision........................................................................................................................................... 4
B.
Objectives of cStock ..................................................................................................................... 4
Purpose of the User Manual .................................................................................................................... 4
Target Users ............................................................................................................................................ 4
Acronyms: ............................................................................................................................................... 3
Navigation tips ........................................................................................................................................ 5
Printing and exporting cStock data .......................................................................................................... 7
Logging on to cStock ................................................................................................................................ 9
Current National Picture ........................................................................................................................ 13
Reporting Rates ..................................................................................................................................... 14
Stock Status ........................................................................................................................................... 17
Consumption Profiles ............................................................................................................................ 21
Alert Summary ...................................................................................................................................... 24
Resupply Qty Required .......................................................................................................................... 25
Lead Times ............................................................................................................................................ 26
Order Fill Rate ....................................................................................................................................... 28
Emergency Orders ................................................................................................................................. 30
HSAs Report .......................................................................................................................................... 32
Health Facilities Report.......................................................................................................................... 36
User Profiles .......................................................................................................................................... 40
Help ...................................................................................................................................................... 41
2
Acronyms:
AMC
average monthly consumption
CCM
community case management
EO
emergency order
FP
Family Planning
GPS
global positioning system
HC
health center
HIV
Human immunodeficiency virus
HSA
health surveillance assistant
MOH
Ministry of Health
MOS
months of stock
OS
out of stock
SC4CCM
Supply Chains for Community Case Management
SMS
short message service
SO
stock out
SOH
stock on hand
3
I.
Overview of cStock
cStock is a RapidSMS based, open-source, automated logistics management information system
for reporting, calculating resupply, and managing and monitoring community-level essential
medicines that includes transmission of logistics information via mobile phone text messaging
(short message service, SMS) to a computer application that responds with information for
product resupply, displays product information on a web-based dashboard, and produces reports
that can be used to monitor availability of community health products and the overall
performance of the districts.
A.
Vision
cStock provides real-time, actionable HSA logistics data for managers and stakeholders to use to
coordinate, plan and identify solutions to better meet customer needs in a timely manner.
B.
Objectives of cStock
•
Improve resupply procedures and visibility into HSA stock levels
•
Empower supply chain managers at all levels of the supply chain with HSA logistics data
•
Improve coordination among stakeholders
•
Create and promote a culture of data driven decision making.
Purpose of the User Manual
This manual provides information on how to navigate within and use the web-based system. It
also provides information on how to access the cStock website, its dashboard and the reports
found on the website.
Target Users
Central level, district managers and partners involved in the provision of medicines at
community level are the primary users of the system. Using this system the target users can
access information on product availability at the community level. This access provides an
opportunity to use real data from the dispensing point to take decisions and resolve product
availability challenges.
4
Navigation tips
There are several key features in the systems that are used to navigate, filter and select the
information to be viewed.
The menu bars: The system has two menu bars that are visible throughout the site pages. The
upper menu bar provides information on some standard information. The lower menu bar has the
option for viewing various outputs of the system. Each of the tabs in the menus is explained
separately. The active tab at any time is in a transparent background shade. The example below
shows the menu bars with “Consumption Profiles” as the active tab. To select a different tab
simply click on it.
Site selector: The site selector is used to select the location of the data you would like displayed.
Depending on your level of access specific districts or facilities can be selected or you may select
the national level called “Malawi”. Below shows an example of how to select a district,
displayed here is “Lilongwe” district.
Date Selector: In most of the cStock pages information can be viewed for a period. The date
selector allows one to pick the Month and Year in the start and end date sections and click once
done to proceed. On pages where the date selector is available it can be found next to the site
selector. The default period is three months from current date.
5
Go Button: The Go button is used to confirm selection and proceed to view the output.
This appears after all the selection option on the pages.
Search Box: The search box provides a quick way to filter and find specific information in the
tables. You can view a specific selection by typing a facility name in the search box. The
corresponding table below will be filtered to provide information on the search that has been
typed in. This screenshot shows the filtering of information on facility names with “Ch” in their
names.
Product Selector: The product selector is a dropdown list that allows you to view information
for a specific product, from the list of options. After the selection is made the you need to click
on the Go! button to proceed to view the outputs.
Product Category Selector: This is dropdown list that allows you to choose a category of
products to view. There are currently four options ALL, CCM, HIV and FP. Once a category is
selected all products within the category are displayed.
6
Printing and exporting cStock data
Export button: Many of the tables can be exported to Excel by clicking on the CSV box found
in the upper right hand corner of the table. The CSV button located at the top-right corner of
tables allows you to export the table.
After clicking on the CSV box, cStock triggers Excel to launch and data from the table
automatically fills an Excel worksheet. The resulting file has a “.csv” extension.
IMPORTANT NOTE: when saving the file, you MUST save the file as an Excel file by
changing the extension to “.xls” or “xlsx”.
Once exported to excel the information can be used to conduct further analysis or included in
other documents.
7
Printing Data: The dashboard, and each set of reports under any tab, can be printed using the
print function of your internet browser. The print dialogue box allows you to print the report
directly to a printer.
8
Logging on to cStock
To log onto the system, launch/start an internet session using either Google Chrome or Mozilla
Firefox. The URL for the site is cstock.jsi.com . This will provide the login screen as shown
below
Each user of the system has a unique Username and Password. These credentials allow you to
logon to the system and view the site. Once you have entered the information, click on the login
button to proceed. If the information is not correct the login screen will display with error
message “Oops. Your username and password didn’t match. Please try again”.
If you have forgotten your password click on the “Reset it here” message under the login.
If the information provided in the login page is correct you will proceed to the default page for
the site which is the dashboard.
When you have finished using the website, always remember to logout from the system. To log
out use the option of the upper right-hand side of the page.
9
In one easy-to-view screen, the dashboard informs you of immediate supply chain problems
through alerts, indicates the reporting rate, status and completeness of reporting from all HSAs in
all registered districts or in a selected district, and shows the availability of stock in all districts
or in a selected district.
The display on the dashboard is always based on current information which means the
current calendar month.
On this page if you are a central level user “Malawi” will be the default view, however you may
use the site selected to view specific districts or facilities. If you are district level user the default
view will be your district. On the dashboard you may also view the information for all districts
by selecting “Malawi” on the “Site” drop down menu.
For help with how to select sites refer to the navigation tips.
Stock out Rates: This table shows the percentage of HSAs in a district / facility / HSA
depending on the site selected with at least one stock out of any product that they manage.
Current Alerts: This table shows the percentage of HSAs nationally or in a district or facility,
depending on the site selected, with low stocks that the health facility has not been able to
10
resolve. Immediate action from district or national level staff is required or a stock out is likely to
occur.
“With EOs that HCs cannot resupply” means that these HSAs reported stock levels of
one or more products below the emergency order point and the health center is unable to
resupply them with that products.
“Resupplied but remain below EO” means that these HSAs reported stock levels of one
or more products below the emergency order point, and the health center resupplied
them, but the quantity resupplied was insufficient to bring the stock level above the
emergency order point.
Reporting Rates: This graph provides information on timeliness and completeness of reporting
by HSAs by district / facility / individual HSA depending on the site selected. The bar graph
displays percentage of HSAs who have reported on time, late, or not reported; the green line
graph displays the percentage of HSAs who have completely reported on all the products with
which they are associated.
11
Current stock status by product: This bar graph shows percentage of HSAs nationally or for a
specific district or facility, depending on the site selected who are under stocked, adequately
stocked, over stocked or stocked out. It also shows the percentage of HSAs who are associated
with a product but have not reported during the most recent reporting period (“no data”).
12
Current National Picture
The side bar entitled Current National Picture that appears on the right side of all pages and
shows national level information. The information will always remain the same even when you
select different sites, dates or products.
This table shows only current information on the following:
1. Numbers Registered: This is the number of staff at district
level, health facility level and HSAs who are registered on
cStock
2. Reporting Rate: percentage of all HSAs registered in cStock
who have reported in the current month
3. National Stock Out Rate:
a. The product column lists all the products managed by
the HSAs by their product code.
b. The HSAs column indicates the number of HSAs who
are associated with that product across all districts
c. percentage SO (stock out) is the percentage of the HSAs
associated with that product that have a stock-out of that
product for this current month
13
Reporting Rates
The reports on this tab display the performance of HSAs in reporting to the cStock system. You
can choose to view the reports, depending on your level of access, for Malawi (all registered
districts) or a specific district or facility for a specific period of time. This page allows you to
view both current and historical data. The default view is the most recent complete three months.
For help with how to select sites or date periods refer to the navigation tips.
Average Reporting Rate by Month: The stacked bar graph shows percentage HSAs nationally
or for a specific district or facility, depending on the site selected, in the selected period of time,
who
reported their stock on hand through SMS to cStock on time, by the 2nd day of the month
(yellow bar)
reported late, after the 2nd day of the month (blue bar)
did not report in the last 30 days. (red bar)
The line graph shows completeness, percentage of HSAs who reported on all products they
manage for the selected time period. A table of the data that is used to generate the graph is
found below the graph.
14
Average Reporting Rate (Districts/Facilities): This report only appears if “Malawi” or a
specific district is selected. This table lists the reporting information that is displayed in the graph
above in a table format.
HSA reporting profile: This report only appears if a specific facility is selected. This table
provides a list of all HSAs in the selected facility and the individual reporting record based on
the following indicators:
Min Number Expected is the minimum number of reports expected over the selected time
period, for example if you select June-August, the minimum number of reports expected
is 3.
Non Reporting shows of the number of reports expected how many were not received
during the selected time period
On Time shows the number of reports received that were on time, by the 2nd day of the
month
Late shows the number of reports received that were late, after the 2nd day of the month
Complete shows the number of reports received that included data for all products that
the HSA is associated with in cStock
15
16
Stock Status
The Stock Status reports display the overall stock situation of Malawi, or for a specific district or
facility, by assessing if there is an overstock, under-stock, adequate stock or a stock out. You can
choose to view the reports, depending on your level of access, for Malawi (all registered
districts) or a specific district or facility. This page displays current data for most reports except
the final graph that has a date selected and historical data can be viewed here.
For help with how to select sites or date periods refer to the navigation tips.
Current Stock Status by Product (graph): This bar graph shows percentage of HSAs
nationally or for a specific district or facility, depending on the site selected who are under
stocked, adequately stocked, over stocked or stocked out. It also shows the percentage of HSAs
who are associated with a product but have not reported during the most recent reporting period
(“no data”). This is the same graph as displayed on the dashboard.
17
Current AMC, MOS and Stock Status by Product (table): This table shows the following
information aggregated for all HSAs in either Malawi, or a specific district or facility selected.
AMC (last 60 days): The average monthly consumption (AMC) for each product is
calculated using data from the last 60 days and is the calculated by aggregating the
consumption for all HSAs for the last 60 days and dividing by 2.
Total SOH (day of report): Total stock on hand (SOH) last reported is aggregated for all
HSAs by product, either nationally or in the district or facility selected
MOS (current period): Months of stock for the current period is calculated by taking the
total stock on hand divided by average monthly consumption for each product. MOS
indicates an estimation of how long a product will remain in stock if it is consumed
according to the past average monthly consumption.
Stock Status: Compares the months of stock to the maximum and EOP stock levels that
have been set for HSAs. Stock status is described as overstock, adequate stock, under or
stock out. Overstock means the MOS is above the max. Adequate means the MOS is between
18
EOP and max. Under means the MOS is between zero and EOP. Stock out means the stock
on hand is zero (0). The maximum months of stock that an HSA should have is 2 months, the
emergency order point (EOP) is one full course of treatment.
Current Stock Status across Districts / Facilities (table): This table displays information for
stock status for a selected product for all districts, or a specific district or facility selected. This
table will only display information for one product at a time, to select a product use the product
selector directly above the table.
% HSA Stock outs by Product Category (graph): This line graph shows the percentage of
HSAs stocked out for all products or a selected product category over the selected time period.
This graph has both product category selectors and time period selectors that apply to this graph.
19
For help with use selectors refer to the navigation tips.
Trend lines look best
if viewed over at
least a 6 months
HSA months of stock (MOS) by product (table): This table is only displayed when a specific
facility is selected as the site. This table shows the MOS by product for each individual HSA.
MOS is obtained as the total SOH divided by the average monthly consumption. Using the scroll
bar on the right you can scroll up and down to view a specific HSA or type the name of the HSA
in the search field.
20
Consumption Profiles
The data on this tab is useful for the purposes of quantification to estimate country, district and
facility requirements for HSA products using the consumption method. You can also view
historical information on months of stock (MOS) and average monthly consumption (AMC) to
determine how well stock levels have been maintained.
Calculated consumption in cStock is calculated:
Previous SOH + Receipts this period – Current SOH = Consumption
You can choose to view the reports, depending on your level of access, for Malawi (all registered
districts) or a specific district or facility for a specific period of time. This page allows you to
view both current and historical data through the product selected. The default view is the most
recent complete three months.
You can also view the consumption profile for an individual HSA by first selecting the facility,
and then selecting the HSA’s name from the drop down menu.
For help with how to select sites or date periods refer to the navigation tips.
National / District / Facility / HSA Consumption Profile (table): This table shows
consumption profiles for all products managed by the HSAs.
21
For each product this table provides information on:
Total Actual Consumption for selected period: Calculated by the system by summing the
calculated consumption for each HSA for the product for the period.
# (Number) stockout days for all HSAs: Obtained as an average of total number of days
stocked out for all HSAs in the selected period and location divided by the total number of
HSAs in that location.
Total consumption adjusted for stock outs: This is the total consumption expected if the
HSAs had the specific product in stock throughout the period under review.
Data coverage: This is a percentage calculated using the number of days in the period that
the data represents divided by the total number of days in the period.
Total consumption (adjusted for stockouts and data coverage): Represents the total
consumption expected if all HSAs had the selected product in stock throughout the period
under review and if data were available for all days in the period under review.
Average monthly consumption (AMC) for all HSAs: Provides an average of the quantity
of product dispensed by each HSA monthly. It is obtained by dividing the total consumption
adjusted for stock outs and data coverage by the total number of HSAs in all districts.
AMC and MOS by product (graph): The graph shows the trend line for average monthly
consumption (AMC) and months of stock (MOS) for the selected product in all districts/the
selected district/ facility/HSA. You must select the product you would like to view information
on at the top next the site and date selector.
Trend lines look best
if viewed over at
least a 6 months
22
Consumption patterns may vary over time, however in a properly managed logistics system, the
months of stock should only fluctuate between the EOP stock level and the maximum stock
level, in this case for HSAs between 2 months maximum stock level and an EOP of one
treatment. Larger fluctuations in MOS may indicate that too much or too little is being resupplied
to an HSA for the specific product.
Consumption
23
Alert Summary
This tab shows the Current Alert Summary table. The alerts found in this report are current for
the most recent report month. When viewing the Malawi view, alerts for all facilities in all
registered districts are shown. On selecting a specific district, only facilities found in that district
are included in the report.
The Current Alert Summary table shows by health facility the number of HSAs associated with
the facility and the percent of HSAs who report to that facility who have experienced one or
more of the following five supply chain performance problems.
•
% of HSAs stocked out
•
% of HSAs with EOs (emergency orders) that HCs (health centers) cannot resupply
•
% of HSAs resupplied but remain below EO
•
% HSAs registered but not added products they manage
•
% HSAs not reporting receipts
Using this report, you can determine which facilities are experiencing problems in resupplying
HSAs and can take appropriate action; which HSAs are registered in cStock, but whose
information is not available in cStock as they have not registered their products, or their
information is incomplete as they have not reported receipts.
24
Resupply Qty Required
This tab provides the Resupply Quantities Required report that can be viewed, depending on
your level of access for Malawi, a specific district or facility. Information in this report is based
on the most current stock reported by the HSAs. You may choose to view the resupply quantities
to fill regular orders or quantities needed to resupply emergency orders by selecting from the
“Order Type” drop down menu.
All products (aggregated quantity to ensure that the HC can resupply): This table provides
current information on aggregated quantities for products required for resupply to all HCs in all
districts, or all facilities in a selected district, to ensure that the HC can resupply the HSAs. This
table allows for comparison of aggregated quantities required for resupply for all products across
districts or facilities depending on the site selected. Use the scroll bar to see resupply quantities
required for different products. The last row provides the total quantity required for resupply of
each product for the all the districts registered in cStock.
25
Lead Times
The lead times report shows how long the entire resupply process takes. It displays the total lead
time and then breaks down the lead time into two components.
Order – Ready: time between the HSA sending an SOH report and the HSA supervisor
sending an order ready message
Ready – Received: time between HSA receiving order ready message and HSA sending a
product receipt message to cStock
Total Lead Time: the sum of the time between order - ready and ready - received
Average lead time (graph): this stacked graph provides information on the average number
of days between order - ready and ready - received. The height of the graph shows total lead
time for each month in the selected period for all HSAs in Malawi or the district or facility
selected. A table of the data that is used to generate the graph is found below the graph.
26
Average lead time by district / facility / HSA (table): this table shows the average number
of days between order - ready and ready - received. It can be used to compare timeliness of
the resupply process across districts, facilities or HSAs. One can scroll up or down the table
to see facility information or select a specific facility using the search function by typing in
the name of the facility.
27
Order Fill Rate
The Order Fill Rate (OFR) report allows you to see how well order requests are filled. You can
choose to view order fill rate for all products or for a category of products for national, district or
facility level. The product categories can be selected using the Product Category drop down
menu and are: All, CCM (community case management), FP (family planning) and HIV.
For help with how to select product categories, sites or date periods refer to the navigation tips.
Monthly average OFR by product (graph): Order fill rate (OFR) is calculated as the
percentage of the quantity requested that was received by the HSA. This graph shows the
average OFR for each product which indicates if on average HSAs were over or under supplied
for each product. For example if the average OFR is 1% then on average each HSA received 1%
of what they needed or requested and so was under-supplied. If the average OFR is 120% then
on average each HSA received 20% more than what they needed or requested. A table of the data
used to generate the graph is found below the graph in the Monthly average OFR by product
(table).
28
Trend lines look best
if viewed over at
least a 6 months
When viewing a specific district you will have an extra table:
OFR for selected time period by facility and product (table): This table shows OFR by
facility by product for the selected time period. To select a facility, type the name of the
facility in the search field. You can scroll up and down to see the facilities in the selected
district and right to left to see OFR for the various products.
29
Emergency Orders
The Emergency Orders tab has three reports that can be used to see the percentage of HSAs who
have reported reaching the emergency order point, by product and by month, or as a monthly
average during the selected period of time. If action to resupply is not taken promptly in response
to emergency orders, stock outs of those products are likely.
For help with how to select product categories, sites or date periods refer to the navigation tips.
Average % of HSAs with EO (graph): provides information on the average percentage of
HSAs that have an EO over the months in the selected period for each of the products listed.
% of HSAs with EO by month (table): provides information on the percentage of HSAs
with an EO by month by product for the selected time period. Use the scroll bar on the right
to view information on a specific product, or type the product name in the search field to see
information on emergency orders for a specific product.
% with EO by product (graph): provides information on the percentage of HSAs with an
EO by month for a selected product category over a select time period. The product
categories can be selected using the Product Category drop down menu and are: All, CCM,
FP and HIV.
30
Trend lines look best
if viewed over at
least a 6 months
31
HSAs Report
Using the HSAs tab report, you can choose to view information for a specific HSA in the system.
Information about all HSAs registered in cStock, sorted by facility (in alphabetical order), can be
viewed using the Malawi view, or by district or by facility using the “Site” drop down menu,
selecting a district or facility and clicking the Go! button.
The following information can be found in the report:
All HSAs:
Facility, name of the facility with which HSA is associated
Name of the HSA
ID, cStock identification number for the HSA
Responsible for these Commodities, products managed by the HSA that HSA associated
with his/her cStock identification
Has stockouts yes/no as to whether HSA has a stock out of one or more products based on
the last stock data reported
Has emergency orders yes/no as to whether HSA has reported an emergency order stock
level of one or more products based on the last stock data reported
Has products with adequate supply yes/no as to whether HSA is adequately stocked in all
products managed
Has overstocks yes/no as to whether HSA is overstocked in one or more products based on
the last stock data reported
Last Message Dates, date of last SMS message sent by HSA to cStock on which the
indicators above are based.
HSA
32
By clicking on a specific HSA, you will be able to view information about that HSA and his/her
performance through three reports.
HSA reporting summary: This table lists each month a report should have been received and
indicates with either “yes” or “no” if the report was received on time, was late, and whether or
not it was complete. If a report was never received for that month all columns will have “no” in
them.
Calculated consumption and stock levels:
This table includes the following
Product, the list of products associated with the HSA
Total daily consumption for each product, calculated by cStock based on reported stock
levels, receipts, and stockout messages, using the dates and quantities of these reports
Average monthly consumption, for each product, calculated using daily consumption and
extrapolating to a full 30 day month
Current SOH (stock on hand), for each product, from the HSA’s last SOH report to cStock
Months of stock on hand, for each product, calculated by dividing SOH by average monthly
consumption
Resupply Qty (quantity) Required, for each product, calculated by cStock to bring the SOH
up to 2 months of stock
33
Order response time: This table shows the status of each order generated by the HSA reporting
stock on hand for the products managed.
Product - the table is sorted alphabetically by product. Multiple occurrences of a specific
product show each time a SOH report was submitted that included that product.
Is emergency – A “no” indicates the report sent for that product was a routine SOH report
and a “yes” indicates the report sent was an EO as the product had reached the emergency
order point
Balance – stock balance for the reported product at the time of the report
Amt requested – the amount of the product cStock calculated was needed to bring the HSA
stock level up to the 2 month maximum stock quantity based on the balance reported
Amt received – the quantity of product the HSA reported receiving
Requested on – the date on which the SOH report was sent by SMS to cStock
Responded on – the date on which the health facility send an SMS to cStock indicating that
the order was ready for pick up
Received on – the date on which the HSA reported receiving the order
Status – the status can be requested, approved, received or cancelled. Requested means the
HSA has sent an SOH report and cStock has sent the request to the HC but the HC has not
yet responded. Approved means the health facility received the request and has approved the
order so it is ready for pick up by the HSA. Received means the HSA has received products
from the HC for this order. Cancelled means the HSA sent a request and then a second
request was sent for the same product without the HSA receiving any products so the first
request has been cancelled and replaced by the second request.
34
In addition the individual HSA page shows date and text of all SMS messages sent by that HSA,
and also includes identification information including the HSA’s name, code (ID), phone
number, the list of products that are associated with the HSA and the facility and district with
which the HSA is associated.
35
Health Facilities Report
On the Health Facilities tab you can select a specific health facility in a district and view
information on the performance of HSAs who are resupplied by the health facility and on the
performance of the health facility in resupplying its HSAs.
This tab includes the following reports:
Current stock status by product (table): This table indicates the stock status for all the HSAs
who are resupplied by this facility for each of the products listed. It provides information to the
HSA supervisor on the percentage of HSAs who are resupplied by the facility who are stocked
out, under-stocked, adequately stocked and overstocked by product. As this information is based
only on those HSAs who have reported, the table also indicates the percentage of HSAs who
have not reported in the period selected. This report can highlight which products HSAs are
having the most difficulty maintaining adequate stock quantities.
Reporting rates: This table shows the percentage of HSAs resupplied by the facility that have
reported on time, late (more than 2 days after the reporting month) and not reported during the
period selected; it also shows the names of the HSAs in each of these categories. For those HSAs
who have reported, the table also shows the percentage of HSAs resupplied by the facility who
have reported completely, on all products they manage, and the percentage of those who have
not reported on all products they manage (Incomplete reporting). The names of HSAs in each of
these categories are also included in the report. Ideally there should be 100% on time and
complete reporting.
36
Average lead times: This report indicates the timeliness of the resupply process for the HSAs
resupplied by the facility. It shows in number of days:
Order to order ready – This is the amount of time from when the HSA sends a stock on
hand message to cStock until the HSA Supervisor sends an order ready message to cStock. It
is an indicator of how quickly the health facility prepares the order and informs the HSA that
the order is ready.
Order ready to order received – This is the amount of time from when the HSA Supervisor
sends the order ready message to cStock until the HSA sends the order received message to
cStock. It is an indicator of how quickly the HSA comes to collect and acknowledged receipt
of the order after being informed it is ready.
Total lead time – is the sum of the two indicators above. Ideally this number should be 4
days or less.
Current AMC, MOS and stock status by product (table): This table indicates the stock status
of all HSAs resupplied by the health facility as a group by comparing their total average monthly
consumption of each product with the current stock on hand for each product, and indicates
whether the stock status is considered overstocked, adequate, or under stocked as compared to a
2 month maximum and 1 month minimum stock, or stocked out. If no data is available on
consumption, then stock status cannot be evaluated and the status category is No Data.
This information provides an indicator of how well the health facility is maintaining appropriate
stock levels amongst its HSAs as a whole, though individual variations cannot be seen in this
report. More specifically, the table includes:
37
Product – name of product for which the following information is provided
Average monthly consumption (AMC) (last 60 days) – This is the average monthly
consumption for this product by all HSAs who have reported and are resupplied by the
facility.
Total SOH (day of report) – This is the total stock on hand for the product for all HSAs
who have reported and who are resupplied by the facility.
MOS (current period) – This number represents the number of months that the total
supplies of each product in stock among all HSAs who have reported will last given current
AMC. It is calculated by dividing the stock on hand by the average monthly consumption.
Stock Status – This indicates if the stock levels of the aggregated HSA stocks of the product
are considered adequate, understocked, over stocked, or a stock out.
Filled Order Product Statistics (table) - This report shows how well the HC is able to fill the
individual HSA order requests for HSAs who have reported their stock on hand information and
need product. Ideally, all requests should be completely filled and no emergency orders received.
If emergency orders are received, all should be filled completely. The numbers indicate the
number of resupply requests made by product, the total requests filled and how well the health
facility was able to fill the request.
The report includes the following:
Product – name of product for which the following information is provided
Total requests received – this is the total number of requests for this product that come from
cStock after have reported their stock on hand to cStock and represent the number of
“orders” for the product that the health facility should fill to keep HSAs who are resupplied
by this facility stocked with the product.
Total requests filled – this is the number of requests, out of the total requests received, to
which the health facility responded by providing product or indicating that the health facility
was stocked out of the product
38
Filled order response – this indicates how the health facility responded to those requests
filled by indicating the number of requests filled in the following categories; information on
whether the request was partially, completely or over filled is based on comparing the
quantity or each request as calculated by cStock with the quantity received as reported by
each HSA:
o HC stocked out - the facility was unable to resupply any of the product to the HSA
and responded to cStock that it was stocked out
o Partially filled – indicates the number of requests where the quantity received by the
HSA is less than the quantity required
o Completely filled - indicates the number of requests where the quantity required
equals the quantity of the product received by the HSA.
o Over Filled - indicates the number of requests where the quantity received by the
HSA is more than the quantity required
# of emergency orders – of the total requests received for the product, this is the number of
those requests that were sent as emergency orders as indicated when the HSA reported stock
on hand
The Health Facility Report can be printed by clicking the print icon in the upper right corner of
the page; this will produce a report appropriate for sharing with the health facility.
39
User Profiles
The User Profiles tab provides information on users registered in cStock and their contacts.
The Malawi view shows:
Districts: A tab with all districts that are registered in cStock and information on:
le
o
o
o
o
o
o
District name
District Code
# (Number) of Facilities in that district registered in cStock
# (Number) of HSAs in that district registered in cStock
District IMCI coordinator Name
Contact of district IMCI coordinator
By clicking on a district or entering the name of a district in the search field a table appears
below and displays information on the list of facilities in that district.
Facilities under (District Name): A table with all facilities in that district registered in cStock
and information on:
o
o
o
o
o
o
Facility name
Facility Code
GPS Coordinate of the facility location
# (Number of) HSAs registered in cStock and associated with that facility
Name of HF In-charge at the facility
Contact of In-charge at the facility
To view information on a specific facility, move the scroll bar on the right of the facility table up
or down. If you click on the facility name, a table displays with the following information.
40
HSAs under (Facility Name): A table with all HSAs associated with that facility registered in
cStock and information on:
o
o
o
o
o
HSA Name
HSA ID
Contact Information, the phone number of the HSA
Supervisor Name
Supervisor contact
Help
By selecting the Help tab, you can find contact information for the cStock system administrators
and access to the User’s Manual. Should you have a problem with cStock, please refer to the
manual; if by using the manual you are unable to solve the problem please contact the system
administrator.
41