1
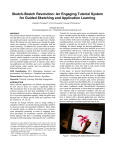
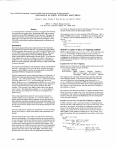
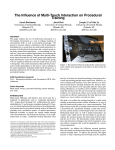
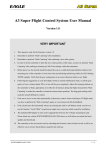
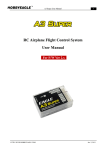
Proceedings of the ASME 2010 World Conference on Innovative Virtual Reality
WINVR2010
May 12-14, 2010, Ames, Iowa, USA
WINVR2010-3755
INTERFACES FOR 3D FLIGHT PATH VISUALIZATION
William E. Marsh
Stephen Gilbert
1
1
1
Levi Swartzentruber
James Oliver
Human Computer Interaction
Iowa State University
Ames, IA
ABSTRACT
Increased use of unmanned aerial vehicles on the
battlefield is driving a transition of human operators into
supervisory roles. In these roles, operators will have access to
mission data and they will be required to make rapid decisions
based on criteria, prior experience, and instincts. To facilitate
rapid decisions, an interface must provide information in a
format that operators can readily understand. A study was
performed to investigate an operator’s ability to rapidly
understand flight path data presented in either top-down 2D or
perspective 3D. Additionally, the study aimed to explore the
benefits of interactivity when observing the 3D scenarios. It
was found that participants in the 3D group with automatic
camera movement were not more accurate but were faster than
participants who saw a top-down 2D view or a 3D view with
manual camera control. This suggests that there may be
benefits to a 3D interface for displaying three-dimensional path
data. It also confirms that providing an interactive interface will
not necessarily lead to higher performance, as the user may not
use it efficiently.
INTRODUCTION
Military operations increasingly incorporate unmanned
systems. In Operation Enduring Freedom and Operation Iraqi
Freedom, almost 400,000 flight hours have been logged by
Unmanned Aerial Vehicles (UAVs) [1]. According to the
Department of Defense’s Unmanned Systems Roadmap 20072032 [2], these vehicles will be expected to perform a full range
of mission tasks by 2030. UAVs will need to become
increasingly autonomous to meet these performance
requirements. That will not eliminate the need for human
involvement, but will necessitate more efficient interaction as
the vehicle to human ratio increases. Operators will transition
into supervisory roles, monitoring and guiding the UAV
activities through computer interfaces.
One important area of supervisory control is the ability to
re-task a UAV when unexpected circumstances arise. For
1,2
Joseph Holub
1,2
2
Eliot Winer
1,2
1,2
Mechanical Engineering
Iowa State University
Ames, IA
example, a threat may be discovered along a vehicle’s current
path. In such a situation, an operator may wish to perform
reconnaissance on the threat, attack the threat, or avoid the
threat altogether. There are also more global considerations,
such as fuel use, that often must be factored into these
decisions. Path planning is a complicated task involving
visualization, optimization, prediction, and decision-making.
When a scenario is already in progress, quality decisions often
must be made within tight time-constraints. This study seeks to
investigate the ability of novice operators to rapidly interpret
three-dimensional (3D) path data using three different
interfaces and re-task a UAV, given four alternate path choices.
LITERATURE REVIEW
A UAV operator interprets available information, using
criteria, past experience, and intuition to choose the best course
of action. The available information might include a
visualization of the scenario along with other mission-specific
metrics provided by a control interface. Criteria used when
making a particular decision depend on mission objectives.
Complete autonomy is undesirable for a UAV-control system
because it would fail to properly incorporate intuition and past
experience of a human operator. Additionally, serious
accountability concerns could arise if certain decisions are
made without the aid (or at least confirmation) of a human.
Path Planning Algorithms
Path planning algorithms attempt to provide one or more
optimized paths to the operator. These algorithms use criteria to
specify the minimum characteristics of an acceptable path. For
example, paths can be generated to avoid collisions with the
ground to prevent the UAV from crashing, so any output
presented to the user will avoid the terrain [3]. Additionally
some criteria can be weighted, allowing an algorithm to
minimize fuel use while maximizing safety, for example. These
algorithms perform well given the very specific weighted
objectives that they are given. They can be very valuable to an
1
Copyright © 2010 by ASME
operator’s re-tasking decision because it would be much more
time-intensive for an operator to plot a new path completely
from scratch. No algorithm can always perfectly choose the
best path, so it is important to offer a display that clearly
illustrates potential alternatives for the operator and therefore
allows the operator to use past experience and intuition to select
a path.
Existing Path Planners
Yet, in many path planners, little attention is given to
information visualization. Most algorithms implement the best
path solution automatically, completely removing the operator
from the process. Some utilize simple two-dimensional (2D)
interfaces, completely ignoring height information [4] while
others use a fixed isometric view to present path altitude [5].
A path-planning algorithm was created as a component in
an immersive virtual battlefield [6]. The algorithm uses Particle
Swarm Optimization (PSO) to find several paths, each with
different weights for three objectives: minimizing the risk to the
UAV due to being close to enemy vehicles, minimizing the
amount of fuel needed due to increased path length, and
minimizing the deviations from pre-selected reconnaissance
points. Ground collision avoidance was also incorporated to
keep the UAV from crashing. Initial testing has indicated that
the algorithm has the potential to help inexperienced users
select a path of similar quality to one plotted manually by an
expert.
Information Display Techniques
Information display techniques can significantly influence
the operator’s ability to make high-quality decisions. The
operator will be biased largely toward interactive visual
information and less toward textual information in decisionmaking processes [7]. Path planning and re-routing has
traditionally been done using top-down 2D interfaces to display
3D path data, however there has been a shift in research
towards using more immersive, 3D displays.
With 3D displays, all of the information is integrated,
allowing for natural depth cues such as linear perspective or
foreshortening. The benefits provided by these cues have been
shown to be additive and independent [8]. However, all
dimensions are ambiguous in a 3D perspective display,
distorting object locations, distances, and angles. This makes a
3D display a poor choice for precise relative positioning tasks
[9].
Two-dimensional displays have been shown to be superior
for tasks requiring judgments of precise relative positions [9].
The primary problem with 2D displays is that line-of-sight
ambiguity still exists in the z-dimension. This means that
altitude must be displayed in another way, often as a digital
readout.
Previous research into the relative benefits of 2D and 3D
interfaces has not directly addressed flight path planning. On
one hand, it involves precise relative positioning which 3D
interfaces should be bad for. On the other hand, displaying 3D
path data from a top-down 2D viewpoint requires the use of
numerical altitude readouts.
There is also a question of interactivity. Is it sufficient to
display information in 3D and automatically pan around the
scene? Or is it more helpful to give the user manual control of
the 3D viewpoint. Past studies in related visualization domains
have revealed mixed results on the benefits of interactivity on
spatial understanding [10, 11, 12]. The results of one study [13]
indicate that it is not interactivity that is important, but what
specific views the user experiences. The implication is that just
because a user is given manual viewpoint control does not
mean that it will be used effectively.
EXPERIMENT DESIGN
This research was conducted to investigate the tradeoffs
when displaying 3D path data and the ability of inexperienced
users, with the aid of the path-planning tool, to make quality rerouting decisions using three different visualization methods.
The scenarios presented to the participants assumed that
unexpected circumstances had arisen, requiring the operator to
pick an alternate path from four given choices. Inexperienced
participants were ideal for this research because we were
primarily interested in a user’s ability to accurately understand
different representations of 3D path data. The use of past
experience and intuition could confound this. Users had to
assess the given scenarios and understand the shape of each
candidate path in order to successfully re-route the UAV. Four
path choices were constructed by hand for each scenario. These
paths were carefully designed so that their relative “goodness”
was controlled.
Hardware and Controls
All participants completed the path planning trials on a
3.2GHz Xeon machine with 2GB of RAM and an NVIDIA
Quadro FX 3450 graphics card running Red Hat Enterprise
Linux 5 attached to a 19-inch Dell LCD display. A Logitech
Wingman cordless gamepad was used for view rotation and
selection of paths. The controller and button layout can be seen
in Figure 1. Relevant controller buttons were labeled for the
study. The controls were arranged as follows:
• X, Y, A, B – Select corresponding path.
• Directional Pad – Confirm selection.
• C – Cancel selection.
• L1 – Pan left. (3DM group only)
• R1 – Pan right. (3DM group only)
2
Copyright © 2010 by ASME
Figure 1. This is a Logitech Wingman cordless
gamepad. The select path, confirm, and cancel
buttons were labeled for the study. The 3DM group
used the L1 and R1 buttons on the top to pan the
viewpoint left or right, respectively.
When a path was selected it became highlighted and, in the
2N case, the altitude numbers on the other choices were
removed. This allowed the user to reduce screen clutter and
focus primarily on the selected path. To select another path, a
participant could either cancel to see all paths highlighted again
or simply press another path selection button (X, Y, A, or B) to
directly choose another option.
EXPERIMENT METHODS
Forty-seven undergraduate students (15 females) were
recruited from the Iowa State University Psychology
department research participant pool and randomly assigned to
three groups according to visualization technique. The first
group saw the paths depicted in top-down 2D with waypoint
altitudes displayed numerically next to the paths (2N group).
For reference, the altitudes of the waypoints along the original
path and a scale were also provided. The second and third
groups both saw the scenario in perspective 3D. The difference
between these two groups was interactivity: the second group
saw the scene from a viewpoint that automatically moved
around the scenario at a fixed speed (3DA group) while the
third group had manual control over the viewpoint movement
(3DM group). Both 3D groups moved smoothly between the
same 20 predefined exocentric viewpoints using quaternion
interpolation. This experience was similar to moving along a
circular track with the camera pointed at the center of the
battlefield. The 3DA group was randomly split so that some
participants automatically rotated to the left (3DAL group)
while others automatically rotated to the right (3DAR group).
The 3DM group had the ability to move in either direction
using the gamepad controls, but was still restricted to the
circular “track.” Due to line-of-sight ambiguity, it was
necessary for the 3D groups to use multiple views to
successfully complete the tasks.
Participants were trained how to use the Logitech
Wingman gamepad to select and confirm a path choice and, in
the 3DM group, how to manually change the viewpoint. The
participants were also given a mission briefing, describing the
objective of the re-routing procedure. A summarized briefing
for each task was included at the bottom of the screen at all
times and the interface prompted the user with currently
available actions and the controller buttons associated with
them.
Each participant completed a pre-questionnaire before
performing the tasks. This questionnaire included questions
about demographics and video game experience. After each
task, participants completed a post-questionnaire regarding
perceived performance and confidence. After completing each
post-questionnaire, participants were also asked open-ended
questions in an unstructured interview to elicit further opinions.
Demographics and Video Game Experience
Participants came from multiple departments and majors
across campus. Before completing any trials, each user
completed a pre-questionnaire about demographics and video
game experience. Table 1 lists average results.
Table 1. Demographics and Experience
Age
19.87
1st person video game hours (weekly)
2.77
3rd person video game hours (weekly)
1.84
Task 1
The first task was intended to investigate participants’
ability to understand complex 3D path data and use it to make
relative distance judgments. Each participant completed two
blocks of five trials each. Participants were told that unexpected
threats were sometimes encountered and that in-flight rerouting was necessary. Each trial started with a UAV flying
along a pre-defined path. After a few seconds, the UAV
encountered an unexpected situation and a “new alert” dialog
box was displayed prompting the participant to press the ‘C’
button. Then a dialog box was displayed instructing the user to
press the ‘A’ button to examine the alert. When the participant
pressed the ‘A’ button, four alternate paths were displayed in
addition to the original path. The application logged a
timestamp at this point, to be used in the calculation of trial
completion times. The participant was instructed to choose the
alternate path that traveled closest on average to the original
path. It was explained that this optimal path was not necessarily
shorter and it did not necessarily minimize fuel use.
Participants were told specifically that goodness of a given path
was determined by measuring the distance between that path
and the original path at multiple points and averaging. Figures
3
Copyright © 2010 by ASME
2-5 show sample views experienced by participants during
Task 1.
Figure 4. This is one of 20 views that participants in
the 3D groups saw before selecting a path in Task 1.
Figure 2. This is the view that participants in the 2N
group saw before selecting a path in Task 1.
Figure 5. This is one of 20 views that participants in
the 3D groups saw after selecting a path and before
confirming the choice in Task 1.
Figure 3. This is the view that participants in the 2N
group saw after selecting a path and before
confirming the choice in Task 1.
Many subjective aspects influenced trial difficulty but one
easily controlled quantitative measure comes to mind: relative
distance between path choices. The paths in each trial were
carefully created in order to control relative goodness according
to this metric. Each block of trials contained five scenarios,
presented in order of percent different: 45%, 35%, 25%, 15%,
5%. For example, in the first trial of each block, the second best
path choice was 45% farther away from the original path than
the best choice and the third best choice was 90% farther than
the best choice. The block order was balanced between
participants so that not every participant experienced the same
ordering of scenarios but that the difficulty would progress
similarly between participants.
Immediately after completing all Task 1 trials, each
participant was asked to complete a laptop-based NASA-TLX
workload scale [14]. The NASA-TLX scale is a subjective test,
designed to assess participants’ perceived workload.
Task 2
The second task was created to further constrain the correct
path choices with additional 3D data. In these three trials,
participants encountered enemy threats. The first trial had one
threat, the second had two, and the third trial had three threats.
The range of each threat was depicted graphically using a dome
formed by red topographic lines. Participants were instructed
that, in addition to the closeness instructions from Task 1, a
vehicle absolutely must not enter a threat dome. So a correct
answer should be the alternate path that travels closest on
average to the original path after eliminating all paths that
travel inside the dome(s). In real life, a path-planning algorithm
could normally account for threats defined in this way, but
these instructions were contrived in order to investigate how
well participants could judge dome intersection to eliminate the
4
Copyright © 2010 by ASME
paths. There were two byproducts of these instructions. First, a
trial was made somewhat easier if the user could eliminate a
couple paths before judging distance. Second, a trial was made
somewhat more difficult because the remaining paths tended to
travel farther from the original path in order to avoid the
threats. Difficulty on these trials increased according to number
of threats (one, two, or three). Figures 6-9 show sample views
experienced by participants during Task 1.
Figure 8. This is one of 20 views that participants in
the 3D groups saw before selecting a path in Task 2.
Figure 6. This is the view that participants in the 2N
group saw before selecting a path in Task 2.
Figure 9. This is one of 20 views that participants in
the 3D groups saw after selecting a path and before
confirming the choice in Task 2.
The controls in Task 2 were exactly the same as described
in the Task 1 section.
Figure 7. This is the view that participants in the 2N
group saw after selecting a path and before
confirming the choice in Task 2.
EXPERIMENT RESULTS
A quantitative and qualitative analysis was conducted for
each task in the experiment. Path quality was measured
according to the instructions for each task and completion time
was also logged. For each scenario, the clock started when the
participant pressed the ‘A’ button to examine the alert. The
clock stopped when the user pressed the directional-pad to
confirm the choice. Subjective rankings and responses from the
two post-questionnaires were also analyzed. In addition,
participants were interviewed after each task to gain a more
subjective understanding of the types of problems that they
encountered and suggestions for how to improve the interface.
5
Copyright © 2010 by ASME
Task 1 Results
In the first task, the participants attempted to choose a path
that stayed close to the original path while avoiding the threat.
Due to experimental consistency issues, some data points had
to be removed. From the post-questionnaires and unstructured
interviews, it was discovered that four users did not follow the
directions on some tasks. These data points were removed.
Additionally, five users did not realize that the needed to hit the
confirm button on the first trial. In these instances, just the first
completion time data point was removed.
Since there were two block display orders that were
balanced between participants, there were two ways to analyze
the data: by presentation order or by actual scenario. Initially,
we analyzed all data by presentation order. In fact when we
went back and looked at the data by scenario, there was no
significance. Here when we refer to “trial 1,” for example, we
are referring to the first trial that a user saw- one of the two
45% scenarios.
The scenarios were all fairly difficult regardless of the
visualization method and the average participant chose the best
answer out of the four choices only 49% of the time. The other
selected paths were not necessarily bad; they just weren’t the
best answers. There was no significance of correctness by
experimental group on any trial.
An ANOVA analysis showed that visualization method
had a significant effect on average completion time (p=8.93*1010
). Further analysis using the t-test showed that the 2N group
was significantly slower on average (p=0.0001) and on every
individual trial than the 3DA group. Additionally, 3D
participants were significantly faster than 2N participants, on
average (p=0.022). However the 2N and 3DM means were very
close, so this significance was largely due to the much faster
performance of the 3DA group. A t-test showed that the 3DA
group was significantly faster than the 3DM group on all trials
except 3 (25% difficulty), 7 (35% difficulty), and 10 (5%
difficulty), and even trial 10 had marginal significance
(p=0.06). The 3DA group was also significantly faster on
average than the 3DM group (p=0.003).
Some self-reported survey results were also analyzed. The
3D groups were significantly more confident in their
correctness than the 2N group (p=0.035). Males were more
confident than females in their correctness (p=0.014) and speed
(p=0.029). The NASA-TLX results were not significant.
Participants in all groups were generally happy with the
interface but some themes emerged from their comments.
Several users in all groups reported that they had trouble
comparing altitude to distance in the X-Y axis. Users in both
3D groups reported a desire to see an additional top-down view
and users in the 3DA group mentioned that they would like
manual viewpoint control.
Some more t-tests were performed to check for confounds.
The 3DAL and 3DAR groups existed to make sure that
automatic panning direction didn’t influence the results in some
unforeseen way. The two groups were compared and there was,
in fact, a significant effect of rotation direction on confidence
on Task 1. Since there was no significant difference of panning
direction on any other measure, we believe that panning
direction had little impact on the tasks. However, this finding
does confirm that the minor details of how a scenario is
presented to a user may make a difference and should always
be controlled. There were also two display orders, such that the
presentation of the two blocks of five trials was balanced
between users. All of the analysis up to this point has been done
with the expectation that path separation matters more than
other path attributes, so we had to check for significance of
display order to ensure that other aspects didn’t confound the
results. Display order was not significant for most
measurements. The only two exceptions were trials 7 and 8.
Participants who saw display order A were significantly faster
on both trials than those who saw display order B. These results
were not entirely unexpected, but fortunately any significance
was confined only to those trials. We believe that the large
amount of data that was collected is not undermined by display
order.
Task 2 Results
Task 2 required more thought than Task 1 due to the
inclusion of threats. These threats affected the trial difficulty in
interesting ways.
There were several data points that had to be removed from
analysis due to consistency issues and self-reported problems.
Two participants had procedural problems while three users
indicated confusion regarding the instructions.
As in Task 1, these three trials were fairly difficult. Only
two participants chose the best answer for all three. However,
the tasks were doable and most people in each group got at
least one correct (better than chance) and a majority of
participants managed to avoid the threat dome in all three trials.
There was no significant effect of display technique on
correctness.
An ANOVA analysis showed a significant difference of
average task completion time between groups (p=1.02*10-11),
however a t-test showed only a marginally significant
difference between 2N and 3DA on trial 12 (p=0.056) and
between 3DA and 3DM on the average time (p=0.099).
Participants in the 3DM group felt significantly more
immersed than either the 2N group (p=0.035) or the 3DA group
(p=0.042). On this set of trials, male confidence in choice
correctness was not significantly different than that on the first
task. However, female confidence in path choices was
significantly higher than on the first task (p=0.028). This
increase closed the gap, and there was no significant difference
between the confidence of males and females in their choices.
Some participants reported that the addition of threats
made the trials harder while some found it easier. Users in the
2N group mentioned that the scenario was somewhat cluttered
and they had problems determining if a given path cleared the
top of a dome. Many participants in all groups expressed an
interest in making it easier to detect dome intersections, with
suggestions such as shaded domes or altering the path color.
One participant in the 3DA group mentioned that he had to wait
6
Copyright © 2010 by ASME
for the camera to rotate a couple times before being sure if a
given path entered a dome.
CONCLUSIONS
In Task 1, it was clear that the visualization method had an
effect on completion times. In particular, the 2N group was
significantly slower than the 3DA group. This result is not
surprising since it was assumed that the 2N group would need
to perform more mental computation than the 3D groups. It is
interesting to note that this extra computation time did not have
a significant effect on correctness. It was somewhat surprising
that the 3DA group tended to be significantly faster than the
3DM group. In fact the manual viewpoint control seems to have
eliminated any speed benefit that 3D had over 2D. It was
expected that participants in the 3DA group would find
themselves waiting for the viewpoint to get to useful positions
while the 3DM group would be able to go right to the vantage
points of interest. These alternate findings seem to support the
notion that perhaps the participants weren’t able to efficiently
use the manual control. On a related note, it is noteworthy that
the 3DM group rated themselves to feel significantly more
immersed than the other groups. This indicates that allowing
manual control may increase subjective immersion, even
though it may hinder performance. Overall, it seems that 3D
allows for faster path planning decisions without a cost in
correctness. The choice between manual and automatic
viewpoint control is less clear.
One of the more interesting findings was that the addition
of a threat closed the male-female confidence gap. The gap was
not surprising in Task 1, as previous literature has found that
males tend to have higher spatial abilities [15] and tend to be
more confident [16] than females. But it was surprising that the
addition of a threat caused female confidence to increase to the
point that it was not significantly different than that of males. It
could be that the nature of the tasks caused Task 2 to seem
easier to females than Task 1. Perhaps females felt great
confidence in their ability to detect intersection with threat
domes but they didn’t feel very confident in their distance
judgments.
FUTURE WORK
Future work should further investigate the tradeoffs
regarding manual viewpoint control in command and control
scenarios. In some circumstances it may be desirable to
sacrifice speed for immersion and in some cases it may not.
Additionally, it is likely that users may eventually become
experienced enough that they may be quicker at manual
viewpoint control than automatic. Future research should
investigate this possibility.
Some participants in the 3D groups in this study indicated
that they would like the ability to view the scenario from above.
For this reason, future research should examine the utility of a
hybrid interface in which the user could view the scenario from
a perspective 3D or top-down 2D viewpoint. Also, the current
experiments were visualized using simple perspective 3D.
Future work should investigate possible benefits of stereoscopic
3D for path visualization.
Finally, in this study, little was done to quantitatively
control the characteristics of path choices. This makes it hard to
make definite recommendations for a given mission. Future
research should seek connections between display technique,
manual vs. automatic viewpoint control, and specific features
of the paths and scenario in question.
ACKNOWLEDGMENTS
This research was funded by a grant from the Air Force
Research Laboratory. We would also like to thank our
colleagues at Wright-Patterson Air Force Base and Jon Kelly
for their valuable input.
REFERENCES
1. Barry, C.L., & Zimet, E. (2001, October). UCAVs
Technological, Policy, and Operational Challenges, Defense
Horizons, 3.
2. US Department of Defense (2007). Unmanned Systems
Roadmap 2007-2032. Retrieved May 21, 2009, from
http://auvac.org/research/publications/files/2007/unmanned_
systems_roadmap_2007-2032
3. Hasircioglu, I., Topcuoglu, H.R., & Ermis, M. (2008, July).
3-D Path Planning for the Navigation of Unmanned Aerial
Vehicles by using Evolutionary Algorithms, Proceedings of
the 10th Annual Conference on Genetic and Evolutionary
Computation, 1499-1506.
4. Shangming, W., Zefran, M., & DeCarlo, R.A. (2008, May).
Optimal Control of Robotic Systems with Logical
Constraints: Application to UAV Path Planning,
Proceedings of the IEEE International Conference on
Robotics and Automation, 176-181.
5. Soto, M., Nava, P.A., & Alvarado, L.E. (2007). Drone
Formation Control System Real-Time Path Planning, AIAA
Infotech and Aerospace Conference and Exhibit.
6. Swartzentruber, L., Foo, J.L., and Winer, E. (2008). ThreeDimensional Multi-objective UAV Path Planner using
Meta-Paths for Decision Making and Visualization,
Proceedings of 4th Annual AIAA Multidisciplinary Design
Optimization Specialist Conference.
7. Lurie, N.H., & Mason, C.H. (2007, January). Visual
Representation: Implications for Decision Making, Journal
of Marketing, 71, 160-177.
8. St. John, M., Smallman, H.S., Bank, T.E., & Cowen, M.B.
(2001). Tactical Routing Using Two-Dimensional and
Three-Dimensional Views of Terrain, Proceedings of the
Human Factors and Ergonomics Society 45th Annual
Meeting, 1409-1413.
9. St. John, M., Cowen, M.B., Smallman, H.S., & Oonk, H.M.
(2001). The Use of 2D and 3D Displays for Shape-
7
Copyright © 2010 by ASME
Understanding versus Relative-Position Tasks, Human
Factors, 43, 79-98.
10.Marchak, F.M. & Marchak, L.C. (1991). Interactive versus
passive dynamics and the exploratory analysis of
multivariate data, Behavior Research Methods, Instruments,
& Computers, 23(2), 296-300.
11.Marchak, F.M. & Zulager, D.D. (1992). The effectiveness
of dynamic graphics in revealing structure in multivariate
data, Behavior Research Methods, Instruments, &
Computers, 24(2), 253-257.
12.Péruch, P., Vercher, J., & Gauthier, G.M. (1995).
Acquisition of Spatial Knowledge Through Visual
Exploration of Simulated Environments, Ecological
Psychology, 7(1), 1-20.
13.Keehner, M., Hegarty, M., Cohen, C., Khooshabeh, P., &
Montello, D. R. (2008). Spatial Reasoning With External
Visualizations: What Matters Is What You See, Not
Whether You Interact, Cognitive Science, 32, 1099-1132.
14.Hart, S. G. & Staveland, L. E. (1988). Development of
NASA-TLX (Task Load Index): Results of Empirical and
Theoretical Research, Human Mental Workload, 239-250.
15.Ecuyer-Dab, I. & Robert, M. (2003). Have sex differences
in spatial ability evolved from male competition for mating
and female concern for survival?, Cognition, 91(3), 221257.
16.Bengtsson, C., Persson, M., & Willenhag, P. (2005). Gender
and overconfidence, Economics Letters, 86, 199-203.
8
Copyright © 2010 by ASME