1
7.21.3
Charts
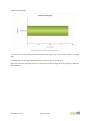
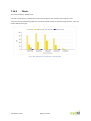
Peak Times Chart
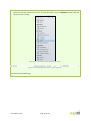
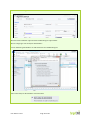
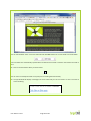
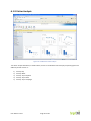
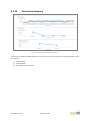
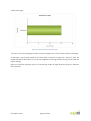
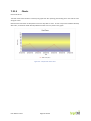
The Peak Times Chart shows a summary line graph with the reporting period along the X-axis and the hour
along the Y-axis.
Note that the chart does not drop back to zero for days with no visits. If such a day occurs between two days
with visits, a line will be drawn directly between the two non-zero points in the graph.
Figure 107 - Sample Peak Times Chart
User Manual v1.8.7
Page 135 of 149