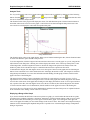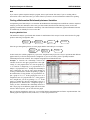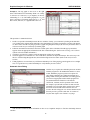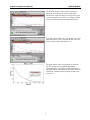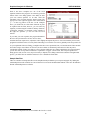
1
Athabasca University Physics 201 Home Lab Guide Author/Editor: Martin Connors The aim of the lab sessions is to provide familiarity with physical concepts treated in the course, with use of experimental apparatus and computers, and with interpretation and presentation of data. The labs are meant to go with the course material. Please do the labs as you do the units, referring to the student manual and study guide. You can then connect the theory and reality. The experiments will be done in a place of your choice. You will progress best if a computer, with attached printer, is available there for analysis of data gathered and for production of lab reports, which are expected to be submitted in printed form to your tutor. Materials to do the labs are borrowed from the Athabasca University Library. Please see the section ‘Practical Notes’ and borrow the materials needed. Lab 1, included in this Guide, may be started while you are waiting for your lab kit to come from the library. Your kit will contain the appropriate detailed lab manual. Evaluation: Lab reports will be submitted to your tutor for assessment as detailed in the course outline. The lab portion of the course counts for 20% of the total physics course mark and is mandatory (you must submit all labs and get a lab average of over 50% to pass). There are 6 labs in PHYS 201. If you are enrolled in PHYS 201 but did not take PHYS 200, you will find it useful to look through PHYS 200’s Lab 1, included in this manual, carefully, but you will not submit this lab. Due care should be taken due to moving objects, hot liquids, and other potentially hazardous situations and materials. The level of risk involved in doing these labs is comparable to that of day to day activities and care has been taken to avoid suggesting activities which produce hazards. It is your decision to proceed with any experiment and in making that decision you control your own situation and assume any risks involved. It is your responsibility to act in a responsible manner to avoid hazard to yourself or to fellow students or members of the public. Neither the author, Athabasca University, nor any equipment supplier can be held liable for consequences of any action undertaken in association with these laboratory exercises. If you cannot safely do these labs please withdraw from the course. Version 1.0, November 2001, based on Phys 200 Lab Guide Version 1.5 Index Practical Notes Chapter 1 Lab Reports and Error Calculations Chapter 2 Graphical Analysis for Windows Chapter 3 Lab 1: Graphical Analysis Techniques Acknowledgement: This home laboratory initiative has been supported by the Office of Learning Technologies of Human Resources Development Canada as well as by the Mission Critical Research Fund of Athabasca University. Robert Carmichael and Elaine Birkigt of Athabasca University have helped in developing these laboratory exercises. Some labs have been developed and modified from original materials from Texas Instruments Inc. We also are grateful to students who have made useful comments on the lab kits and procedures. This home lab course obviously is intended for your education. Nonetheless, we wish to learn from it also, with an eye to improving physics home labs and to running future lab workshops. Your feedback on the course material is welcome and is used to improve the Lab Guide. It is also important that you note problems encountered as part of your lab reports, and give us feedback on the labs as well as the overall course, on the course feedback form. Practical Notes Instant Gratification You should be able to do Lab 1 immediately, using everyday materials and the copy of the Graphical Analysis programme in your course package. You will have received a Windows version which we have tested with Microsoft Windows 3.1, 95, and 98 on a PC-compatible computer. If you have such a computer, you must Run setup.exe which will be on the floppy disk, likely referred to as ‘A:’ in your computer. The Run command may be found under the File heading of the Program Manager or File Manager in Windows 3.1, and is the second choice (above Shut Down) opening above the Start icon at the bottom of a Windows 95 or 98 screen. Installation (usually to the C: hard drive) will proceed automatically with only a few fairly obvious questions needing answered. We also have DOS and Macintosh versions of Graphical Analysis available. If you do not know how to install the Windows version, contact your tutor for help. If you need a different version, contact the Science Laboratory at Athabasca University. Apart from being able to supply the software, we do not support the non-Windows versions. Lab Kits You should, as the first thing you do in the course, request your lab packages from the library unless you have some overriding reason not to do so. You will be loaned the kit for a period of several months which the library will let you know. It will be mailed to you shortly after you request it and will contain a card for return postage (note that this is similar to the book borrowing procedure, which you are also encouraged to use). To reach the library call the toll-free number 1-800-788-9041. Please note that only those enrolled in an Athabasca University physics course may borrow lab kits. Your envious friends will have to enroll if they also want to play with a kit! In addition to your student number and a shipping address, you will have to clearly indicate to the library staff which course you are enrolled in. PHYS 201 has only one version of lab kit, but make sure that the staff know that this is the kit you require. Your kit will contain freshly charged alkaline renewable batteries. Do not attempt to recharge batteries: this can destroy the batteries and charger if incorrectly done. If you have problems with a calculator do not attempt to remove its batteries: this will cause all the program memory to be erased, making the calculator unusable for the labs. In case of problems you think are related to batteries please contact the Science Lab. Please refer to the calculator guide if you think it your calculator is not working properly. In particular check the section on adjusting screen contrast. Lab Guide, Lab Manual This Lab Guide describes general features applying to Athabasca University physics courses. Your lab kit will provide your particular course’s Laboratory Manual. Printing Graphs For printing up graphs, it is suggested that you use Graphical Analysis (GA) and the printer attached to your PC. This may be done directly from GA by highlighting the window you wish to print, and using the Print command in the File menu. If you are writing your lab report using a Windows-based word processor, you may copy windows from GA into the document. This is done by highlighting the window you wish to copy, and using Copy Window from the GA Edit menu, then using Paste from the word processor File menu (with the cursor clicked where the pasting is to be done). While including graphs produces a nicer-looking report, you will have to judge whether it is worth doing. In some cases a full-page graph, as given directly from GA, will be clearer and thus to be preferred in any case. Data and reports should be saved to floppy disk or other backup medium for security. Computers are available at Athabasca University Learning Centres. Please consult with the local staff to ensure that Graphical Analysis is installed on the computer you may wish to use there, and for assistance in use of the Graph-Link cable to connect your calculator to the computer. Do not forget to bring home all materials, including the Graph-Link cable, when you are leaving! Chapter 1 Lab Reports and Error Calculations Your reports will serve several purposes and you should bear these in mind in preparing them. They will give an organized framework for recording your procedures and results. They will allow you later to see what you did and put it in context when you read about the material throughout the course. Because reports are an effective way of communicating important information, their use is stressed in this course. There is little point in doing a wonderful experiment with great results if you cannot effectively communicate what you have found to others. Although some students may have encountered laboratory reports before and may feel that there is a standard format for them, this is not entirely true. A lab report basically has three purposes: to communicate your actions to communicate your observations to put forward an explanation. Communication of your actions includes identifying yourself, the details of when and where you did the actions, and the steps taken. Reference can be made to the lab guide/manual for brevity, with detail given only for what you did that was not well described there or that changed what was described there. If there is more than one part to the lab it is usually best to describe the actions and observations separately for each part. Communication of observations includes general descriptions of what was seen during the experiment as well as tables of data taken. It is usually best to include lists of original data if these are not too large, or to keep track of file names in which they are stored if they are in fact too large to print out. Other tables or graphs may show reduced data, that is to say, data which have been treated in some way (i.e. results of calculations using original data). Depending on the lab, it may be appropriate to place all explanations at the end or it may be better to put them at the end of each section. Usually questions asked in the lab manual should be discussed in the section on explanations as well. Errors in the observations may have a bearing on your conclusions and it is here that their role should be discussed. Read over your report before filing it and again before sending it in. You should be able to pretend that you had not done the experiment, and ask yourself whether you would in that case be able to understand what was done, based on the report. Your report may be neatly hand written, typed, or done on a word processor. Data and reports from your hard disk should be backed up on a floppy disk for security. Sample Lab Report: they do not need to be word-processed but this is a good format to follow. The report tells concisely what was done, shows results, and interprets them. Lab Report 0 Oscillation of a Slinky Spring by Martin Connors ID# 979797 Physics 210 Athabasca University Introduction The Slinky spring is a well-known child’s toy which seems to have a fairly small restoring force constant. It can oscillate at low frequency under its own weight. Here these oscillations are studied to see whether a hanging Slinky undergoes simple harmonic motion and how a real spring with mass fits into the equation predicting period of a mass on a spring. For SHM we expect that the motion about equilibrium would be represented by a sinusoidal curve y = A sin(ω t + p) . The value of p (inital phase) is not important but the value of ω is related to the period. In section 13-3 it is shown that ω is equivalent to 2π/T, where T is the period. Since for a massless spring with a mass being oscillated by it, T = 2π mk , ω should be mk . Here the mass is that of the spring itself, and since it is distributed along the spring, it should appear like a smaller mass concentrated at the end. So we expect to find ω = rmk , where r is less than 1. If we find that the motion of the Slink spring is well represented by a sine curve, we can determine ω, and if we know the spring constant k and the mass m, we can verify that r is less than 1. we might guess that r will be about one half or less. Method A miniature Slinky type spring was used. Its diameter was about 2 cm and its unstretched length about 2.5 cm. Its mass was determined by making a balance using a metal yard stick balanced on the dull edge of a saw blade. When the spring was 17 inches from the balance point, it could be balanced by 3 ‘looney coins’ 16.75 inches from the balance point. The mass of the ‘looney’ is 6.97 g (see Lab 1). This means the mass of the spring 16.75 was × 3 × 6.97 g, or 20.6 g. The spring was taped to the bottom of a table so that its 17 top was 76 cm above the floor. A piece of duct tape was attached to its bottom end to hold in coins and to act as a reflector. A metal ruler was placed vertically beside it with the zero point at the top. The bottom of the unstretched slinky (help compressed) was at the 185 mm mark, and when it was allowed to sag under its own weight, it was at the 438 mm mark. Canadian cent coins were added and Table 1 made up using their masses (see Lab 11). Table 1. Extension of slinky spring with one cent coins Cent coin added (date) mass (g) total weight (N) length (mm) none 1996 1984 1980 1977 1972 438 504 574 648 737 823 0 2.51 2.51 3.21 3.21 3.21 0 .0246 .0492 .0807 .1121 .1437 extension (mm) 0 66 136 210 299 385 In Table 1, the mass is the mass added, not counting the mass of the spring. The total weight is the total mass added so far in kg, multiplied by 9.81 m/s2. The length is the raw reading from the ruler, and the extension is the amount the spring bottom has gone down from the position with no added mass. The weight and extension (independent variable) data were put into Graphical Analysis and fit with a straight line. The first fit did not show enough significant figures for the slope, so a new column was created with the extension expressed in m, by dividing the original extension by 1000. The fit was repeated as shown in Figure 1, labelled “weight vs. extension”. The weight is the applied force so this is a plot of Hooke’s Law, F=-kx. The graph goes to within .1 mm of the origin and is a very good fit, so we conclude that the spring constant k is 0.3751 N/m. The CBL motion detector was placed on the floor under the spring and the BOUNCE program was run on the connected TI-83 calculator. The spring, with all coins removed, was pulled down and released and the resulting motion observed through the sensor. In the first attempt, the graph appeared chopped off near the top and this was likely due to the spring coming too near the sensor. I waited a few moments for the amplitude to die down and then repeated the measurement. This time there was no chopping off and a very sinusoidal curve resulted, as shown in Figure 2, labelled “Relative Height vs. Time”. The data were transferred to the Graphical Analysis program through the Graph-Link cable and were fit with a sinusoidal curve. Analysis The fit in Graphical Analysis with a sinusoidal function was excellent, passing very close to all of the data points. From this we may conclude that the spring underwent SHM in response to its own weight. The form above, y = A sin(ω t + p) , came out to be y = 0.0237 sin(6.353 t + 22.189) . The amplitude seemed about correct, as when the measurements were done there was total up-down motion of about 5 cm seen. In the fit, there was an offset of 0.0252 m needed since the zero point was not the equilibrium point. In fact, the data transferred to Graphical Analysis appeared to have already been adjusted not to be the total distance to the sensor. Checking the BOUNCE program listing, this appeared to be the case. The value of ω was determined to be 6.353 radian s-1. We expect that k ω = rm , so r = ωk2 m . From the values of k, ω, and m found above, we have r = 6.35302.3751 = 0.451. ( 0. 0206 ) Conclusion It has been verified that a Slinky spring oscillating under its own weight does do SHM. The massfrequency relationship has to be modified from that for an ideal massless spring. Since the mass is distributed along the length of the spring, it appears like a smaller mass. The correction factor was found to be .45, which is about what intuition suggested. Chapter 2 Graphical Analysis for Windows The following pages reproduce the Graphical Analysis for Windows document from www.vernier.com (Free Stuff section). Please study this document as Graphical Analysis is an important component of the lab course. Graphical Analysis is intuitive to use and provides for download of experiment data from the TI-83 calculators provided for PHYS 200. It is also useful with manual entry of data as done in PHYS 201 and PHYS 202. We do not officially support other versions of Graphical Analysis but some information about them is to be had on the Vernier website. We are licensed supply a Mac version. Please contact the Science Lab about this but be aware that no support is provided for this version. Your Graphical Analysis program is supplied to you under a license agreement between Athabasca University and Vernier Software & Technology (formerly Vernier Software). You may use this program for your course but may not copy it or distribute it. Please note that the Athabasca University installation methods differs from that described in this Vernier manual: see above, under Practical Notes for how to install from AU disks. Graphical Analysis for Windows® USER’S MANUAL General Description of the Program and Built-in Help Graphical Analysis for Windows is a user-friendly program that allows you to easily graph and analyze data. Data may be manually entered from the keyboard, pasted from the clipboard, or retrieved from a file saved on disk. You can even import data from Texas Instruments TI-73, TI-82, TI-83, TI-83 Plus, TI-85, TI-86, TI-89, TI-92 and TI-92 Plus graphing calculators and LabPro or Calculator-Based Laboratory (CBL, CBL 2) interfaces. Data can be displayed in spreadsheet form and as a graph. You have several options on the scaling and style of graphs. Powerful data analysis tools are provided, including curve fits, derivatives, tangent lines, integrals, smoothing, FFTs, and histograms. Graphical Analysis allows you to create new columns that are based on other data, much as you might do with a spreadsheet program. Since this is a Windows program, you can easily copy your data and graph to a word processing or spreadsheet program via the clipboard. Several sample files are included for your experimentation. The Graphical Analysis program has been designed with non-overlapping windows. We chose this approach because overlapping windows often cause confusion. As you create new windows, the screen will be subdivided among all the windows without overlapping. You can adjust the size of windows by dragging the horizontal and vertical dividers that separate them. You can set up the screen with up to ten windows open at one time. In previous versions of Graphical Analysis, the emphasis has been on teaching students to modify their data with mathematical operations. They would then create and analyze graphs looking for linear relationships. This approach is still supported in this program and explained in the “Graphing Modified Data” section of the User’s Guide. In addition, we have added curve fitting to this version. Students can easily fit a curve to data and quickly test various mathematical models. Curve fitting is discussed in the “Automatic Curve Fitting” section of the User’s Guide. Built-in Help This manual will give you an introduction to Graphical Analysis for Windows. Much more information about this program is included in the Built-in help. You can access the Built-in help in several ways: • To get a brief description of a part of the screen, move the mouse over that part and read the short message displayed in the help bar at the bottom of the Graphical Analysis window. • To obtain help information, simultaneously press the <shift> + <F1> keys. The cursor turns into a question mark. To get help on a button or a window, click on the object. To get help with a menu option while the cursor is a question mark, click the menu and hold the mouse button down, drag down to the option of interest and release the mouse. Help information will be displayed for each item you access. • To get help on a specific item or dialog box, press F1 while you are accessing the item. • A Table of Contents for the Help program is available from the Help menu. To use it, choose Help Contents from the Help menu. You will be provided with a list of four general help topics. These topics include Getting Started, How to (perform certain operations), Menus, and Windows. You also have access to the Search feature of the Help system. Click on the Search button found in the toolbar of the Help program. A dialog box will appear from which you can type in a key word. As you type in a word, the search list will automatically scroll through an alphabetical list of topics. The Graphical Analysis Program for Windows version is designed to operate on a PC computer running Windows version 3.1 or Windows 95/98/2000/2000ME/NT 4.0. An MS-DOS® version of this program has been available for several years. It includes most of the features of the Windows version. It is a menu-driven program and does not require a mouse. It works on any PC computer with 640K of memory. If your computer is not capable of running the Windows version, contact us about exchanging for the MS-DOS version. Macintosh® and Apple® II versions of Graphical Analysis are also available. Graphical Analysis for Windows USER’S MANUAL Fast Start (If you don’t read manuals) Many computer users do not believe in manuals. If you are one of them, we offer this information to get you started with Graphical Analysis. • • • • • • • • Double-click the Graphical Analysis icon. Click the OK button in the About box to continue. Enter data into the data table. Double-click on the graph to add features to the graph. Click on the numbers at the ends of the axes to change the scaling. Experiment with the Zoom buttons, the Analyze button, and the Tangent button. Click and drag through a section of the graph to use the Integrate and Linear Regression button. Choose New Window or Replace Window from the Window menu item to add new windows. Choose Arrange Windows from the Window menu to rearrange the window layout. • Try the various menus. Have fun experimenting. If you have questions, check the Built-in help. If all else fails, remember there is a manual. Using the Graphical Analysis Program Typical Screen Start up the program by double-clicking on the Graphical Analysis icon. Click the OK button in the About box to continue. You will be presented with a blank data table and graph. A typical Graphical Analysis screen is shown below. (The data and graph was taken from the STROBE.DAT file included with this program.) This screen includes three different windows with a menu and a toolbar at the top. Important features of the window have been identified on this figure. A Typical Graphical Analysis Screen 8 Graphical Analysis for Windows USER’S MANUAL As you work with the Graphical Analysis program, you can choose from five types of windows: • • • • • Data Table windows use a table to display data in the same way a spreadsheet does. Graph windows plot data on a scatter graph. Histogram windows plot the number of occurrences of the various data values. Fast Fourier Transform (FFT) Graph windows plot the frequency components of a column of data. Text windows display notes about the data or graphs. When the program starts, the screen will have a Data Table window on the left and a Graph window on the right. A small Text window will be displayed in the lower left. Only one window can be active at a time and it will have the same color or shading as the Graphical Analysis Title Bar. You can make a window active by simply clicking it with the mouse. Entering and Editing Data The first step in using Graphical Analysis is usually entering a table of data. Most data tables will have two “manually entered” columns. The blank data table to the right has been set up so that Time (X-axis) and Distance (Y-axis) can be manually entered into the first two columns. To enter the time and distance data, simply click a cell and start typing. When you have completed an entry, press the <tab> or <enter> key to move to the next available blank data cell in the table. For example, after entering data in the first row, press <tab> to move the cursor to the first cell in the next row. After each data pair has been entered, the corresponding data point will be graphed. As you make entries, the program will check to make sure that you have entered a valid number. If your entry is not valid, the cell will not be updated.1 The figure to the right shows a completed data table. Editing a cell is easy. Use the mouse or keyboard to select the cell you want to change. (To move horizontally with the keyboard, use the <tab> or <enter> keys. To move vertically within the data table, use the up or down arrow keys.) Once the cell is selected, edit the cell by either typing in a new value, or using the left and right arrow keys and the delete keys to change a limited number of digits in the entry. To accept the changes and automatically adjust the graph, press <enter>, <tab>, or either the up or down arrow. (The changes will also be accepted if you click another cell with the mouse.) If you are entering numbers in scientific notation, use the “E” or “e” key as in the examples below: To enter this number: 3.5 x 10⁴ -2.4 x 10³ 5.5 x 10⁻¹² Type this: 3.5 E 4 -2.4 e 3 5.5 E -12 Editing the Axis Labels, Units, and Graph Title When the program starts, the labels for the horizontal and vertical axes are simply X and Y, and no units are displayed. To change this, double-click the top cell of either column and enter the new label and unit in the pop-up menu that appears. Click the OK button to accept the changes. To change the title of the graph, click the title of the graph window and enter a new title in the pop-up box that appears. 1The range of numbers allowed to be entered is -1.7 x 10308 to 1.7 x 10308. 9 Graphical Analysis for Windows USER’S MANUAL Changing Display Features of a Graph To change a graph, move the mouse to the graph and click it once to make the graph the active window. Now try selecting different options from the Graph menu. Selecting a menu item toggles it on or off. If an item is preceded by a check mark, the item is on. Here is a list of the available options: • • • • • • Point Protectors (small squares, triangles, etc., that make the data points more visible) Error Bars (marks that can indicate the uncertainty in the data) Connecting Lines (straight-line segments from point to point) Bar Graph (bars extending from the bottom of the graph to the top for each data point) Background Grid (a pattern of background dots on the graph) Legend (small box matching point protectors, data columns, and data sets) Changing the Scale of a Graph In most circumstances, the axis scales of the graph are automatically adjusted by the program, but you may want to change them. To change the scale of a graph, move the mouse to the graph and click either axis label. A dialog box like the one to the right will appear. You have three different choices for the scaling of each axis. If you select Manual Scaling, you can enter the minimum and maximum values to be used on the axis. Enter the appropriate value in each box. If you choose Autoscale, the program will automatically calculate a scale for the graph, just fitting all the points on the graph. If you choose Autoscale at Zero, the program will automatically choose the axis scale, but it will always include zero on the axis.2 There is another way to quickly adjust the axis limits from the graph itself. You can change each limit by clicking on that limit, entering a new value in the small box that appears, and pressing <enter>. Zooming In on a Graph You can zoom in on any region of a graph to examine it more carefully. When you want to zoom in, click and drag the mouse over the region and click the Zoom on the toolbar or choose Zoom In from the Graph menu. The In button program will then adjust the scales of the graph so that only the region included in the rectangle is graphed. For example, a small section of the graph on this graph has been selected with the mouse. After selecting Zoom In, this region is expanded to yield the graph to the right. 2If the numbers to be graphed are all positive, the axis will start with zero. If the numbers to be graphed are all negative, the graph will end with zero. If both positive and negative numbers are to be graphed, the scale will be adjusted to include both positive and negative values. 10 Graphical Analysis for Windows USER’S MANUAL Analysis Tools Five very useful analysis tools can be found on the toolbar. Those tools are available by clicking any of the following , Tangent Line , Integrate buttons: Examine can also be found in the Analyze menu.) , Regression Line , or Curve Fit . (Note that these tools The Examine feature of the program will display the values of an individual data point. Click the Examine button on the toolbar and move the cursor across the graph. A vertical line will be drawn through the data point closest to the cursor and a box will display the values that correspond to that point. Using “Examine Data” The Examine option works on any graph window. When you are finished examining the data, click the Examine button or deselect the Examine option from the Analyze menu. To see the tangent line, click the Tangent Line button and move the mouse across the graph. As you do, a tangent line will be drawn at each data point. A floating box will also display the numeric value of the slope at that point. To turn off the tangent line, click the Tangent Line button or deselect the Tangent Line option in the Analyze menu. The number of points used to calculate the slope is controlled in the Preferences option in the File menu. To determine the integral, click and drag the mouse across the region of interest on the graph, then click the Integral button. The area under the curve will be shaded and a box will display the numeric results. (The integral is calculated using the trapezoid method.) To remove this information and the shading from the graph, click the small box in the upper-left corner of the floating box. The Regression Line button is used to calculate the best-fit line for a selected curve or region of a curve. To fit a regression line to a set of data, click and drag the mouse across the entire graph, then click the Regression Line button. A best-fit line will be drawn on the graph and a floating box will display the numeric results. To fit a regression line to only a portion of the data, click and drag the mouse across the area of interest, then click the Regression Line button. To remove this line and the curve fit information, click the small box in the upper-left corner of the floating box. You can use the Curve Fit button to fit various mathematical equations to the data. This process is explained in detail in the “Automatic Curve Fitting” section of the User’s Manual. Displaying a Range of the Graph If you need to determine the difference between two points on a graph, you could examine the data at the two points, record the point coordinates, and make a calculation. Alternatively, click the Examine button so that it is active. Hold the left mouse button down and drag it over the region of interest in the graph. A box will appear in the upper-left corner of the graph from which you can read the changes in the X and Y values. This feature can be helpful in analysis situations such as determining the amplitude and period of a periodic wave or determining the change in temperature during an experiment. 11 Graphical Analysis for Windows USER’S MANUAL Creating a New Column of Data One of the most useful features of Graphical Analysis is the ability to plot graphs of modified data. This is extremely helpful in looking for the relationship between variables. The section entitled “Graphing Modified Data” later in this User’s Manual has several examples showing the use of this concept. To create a new column, click the button for a calculated column or the button for a manually entered column. Alternatively, choose New Column from the Data menu and choose between a calculated column and a manually entered column. If you choose a manually entered column, enter the name and units for the new column and click OK. If you choose to add a calculated column, the pop-up screen to the left will appear. Enter the name and units for the new column and move to the New Columns Definition box. Define the new column in this box by either typing in a formula or by clicking the various buttons provided. If you choose to type in the formula, you must include the name of any column in double quotes. The easiest method is to use the mouse and click the various buttons in the dialog box. These buttons include a calculator keypad with standard mathematical functions, a button labeled “Columns” that provides a list of all existing columns that can be used, and a button labeled “Other Functions” that provides a list of various functions to apply to the columns—functions such as derivative, integral, smoothing, and absolute value. To demonstrate this process, consider the example where you have pressure and volume data from an experiment and it is stored in columns labeled “pressure” and “volume”. (A sample set of data can be found in the BOYLES.DAT file included with this program.) In addition to a graph of pressure vs. volume, you might want to graph pressure vs. the reciprocal of volume. Start by adding a new calculated column to obtain the above New Column dialog box. After entering “reciprocal volume” for the new column name and “reciprocal mL” for the new column unit, click the New Column Definition box. Next click the “1” key on the calculator followed by the “divide” key. Click the Columns button to pull down a list of columns. Choose the “volume” column. The column definition will now read: 1/“volume”. Click OK to save this new column. The new column will appear in the data table and will be available for graphing by clicking on any axis label. Modifying Data and Its Display To modify a column of data, double-click on the column heading of the data to be modified. This will bring up the Column Options dialog box from which you can change the label, units and definition of the column. The precision of the data can be specified by choosing either decimal places or significant figures and entering the number of digits that will be displayed in both the data table and graphs. In addition, the point protector symbol, the column color, and the size of the error bars can be chosen. When the definition button is clicked and the column is a calculated column, the Edit Column Definition dialog box will appear, allowing the definition of the column to be changed. The column will be updated after you redefine the column. Changing What Is Graphed on an Axis To change which columns are plotted on a graph, simply click on the axis label. A pop-up menu listing all the columns in the data table will be displayed. You can choose what you want graphed on the axis from this menu. Any number of columns can be plotted on the Y-axis, but only one column may be plotted on the X-axis. 12 Graphical Analysis for Windows USER’S MANUAL Creating a New Graph To create a new graph, select either of the last two options in the Window menu. Since all windows on the screen are non-overlapping windows, the New Windows option divides the area held by the currently selected window into two equal areas. The original window remains and a pop-up menu appears from which you select the style of the new window. To create a new graph, choose the Graph option. The New Window option adds the new graph by splitting the current region of the display vertically into non-overlapping windows. The New Window option splits the old window horizontally. The new graph will contain no data and blank axes. Click on each axis to select the variables to be graphed. Changes can be made to this new graph as they were with the first graph. The second graph can be used to display different columns of data or the same data with different scales and graph styles. Additional graph windows can be created, but the screen can only have ten windows open at one time. Multiple Data Sets As you have seen, Graphical Analysis data are stored in columns and rows but data can also be stored in additional data sets. The use of different sets of data is a good way to compare various experimental results when an experiment is being repeated under different conditions or for different experiment runs. For example, the figure to the right shows time and distance data for a ball rolling down a ramp in two different runs. The data set on the left was collected when the ramp was inclined at 2.5o while the ramp was inclined at 1o for the second data set. Each data set in a Data Table window contains the same set of columns and each can be graphed separately. When several data sets are combined on a graph, every set has a different shape point protector, a separate point-to-point line, and separate curve fit lines. Graphing the various data sets on the same graph provides a convenient way to compare results. To create a new data window, select New Data Set from the Data menu. The new table will appear in the data table. Numbers can be entered into these new data set columns as they were in the original data columns. You can control which data sets appear on a graph by clicking the Y-axis label and checking or unchecking the box for each data set. Any one Graphical Analysis file can have up to nine data sets. Each data set can have up to twenty columns and as many as 8000 rows of data. Renaming Data Sets You may want to rename the data sets you create so they have meaningful names, such as “Joe’s data” or “Run #2, with 5-gram mass.” The name of the data set appears in the title of the data set column and it can also appear in the legend on the graph if you activate the legend option. To rename a data set, double-click the data set name and enter a new name or modify the existing name that appears in the pop-up dialog box. Printing Graphs or Data To print a graph or data table, select the Print option in the File menu. A pop-up menu displays three options: Data Table, Selected Display, and Whole Screen. The Data Table option will print the entire data table, including rows not displayed in the window. This option may produce many pages of paper. The Selected Display option only prints the active window on the screen. It can be used to print graphs, data tables and other windows. If you select this option for a large data table, the entire data table may not appear. To print a graph, first select the graph by clicking it, then select the Selected Display option. To print the entire screen including all windows, select the Whole Screen option. If you have a Text window that contains more text than can fit in the window, a scroll bar will appear on the right hand side of the window. To print all the text, you will need to click the Text window and select Copy Text from the Edit menu. Paste the text in a word processor and print the text from the word processor. If you want to quickly print the active window, click the correct window is active before you start printing. 13 button on the toolbar. Make sure the Graphical Analysis for Windows USER’S MANUAL In printing with a network, it is useful to attach an identifying header. To do so, select the Printer Setup option from the File menu. A pop-up menu will appear. If you check the Name checkbox, you can enter your name and it will appear in the upper-left corner of the printout. If you check the Date checkbox, the date will appear in the upper-right corner of the printout. Transferring Graphs and Data to Other Applications In many cases, it can be useful to transfer graphs created in Graphical Analysis to another Windows program. For example, you may want to include the graphs in a report being written with a word processing program. To copy a graph, make sure the graph window is active and then choose Copy Window from the Edit menu. This places a bitmap of the graph in the Windows clipboard. If necessary, you can store the graph to a file. Later, you can paste the graph into another application. You may also want to transfer data from a Graphical Analysis data table into another application, such as a spreadsheet. The easiest way to make this transfer is to copy the data from the Graphical Analysis data table window to the Windows clipboard. You can then paste it into the other application. If necessary, you can store the data temporarily in a clipboard file. To copy a whole data table, make sure the data window is active, choose Select All from the Edit menu, then choose Copy Data Set from the Edit menu. If you want to get only part of a data table, drag the cursor across the data table until all the data you want is highlighted, then choose Copy from the Edit menu. Once the data has been copied to the clipboard, open the new file and paste in the data. Graphical Analysis can also create text files that can be opened by other applications. This procedure is explained in the section Saving Information. Transferring Data from Other Applications You may also want to transfer data from another application, such as a spreadsheet, into a Graphical Analysis data table. The easiest way to make this transfer is to copy the data from the other application to the Windows clipboard. You can then paste it into the Graphical Analysis Data Table. To copy a whole data table, make sure the data window is active, choose Select All from the Edit menu, then choose Copy Data Set from the Edit menu. If you want to copy only part of a data table, drag the cursor across the data table until all the data you want is highlighted, then choose Copy from the Edit menu. Once the data has been copied to the clipboard from another application, switch back to the Graphical Analysis program. Click on the first column of the Graphical Analysis Data Table and then select Paste Data from the Edit Menu or press CTRL+V. Saving Information After you have entered, edited, and graphed information, you may want to save it on the disk. Two save commands appear in the Graphical Analysis File menu: Save and Save As. To save your work back to the original data file, choose Save from the File menu. This saves the data and the graphs exactly as you have them set up. If the data have not been previously saved, you will be asked to enter a file name. When you use the Save As... command, it makes a new file containing the current data and graph. Save As always allows you to enter a file name and choose a location for the new file. Two file formats can be used when saving the data. These are data (*.DAT) and text (*.TXT). When you save a file as a *.DAT file, everything about that file including data, text, and graph setups is saved. This format is the default file format. Data and graphs are saved quickly in this format using the Save and Save As commands. To save a file in text format, choose the Save As command in the File menu. Next, pull down the Save As Type list found at the bottom of the dialog box and select the Text File (*.TXT) option. Files saved in text format can be opened by word processing and spreadsheet programs. Note, however, that only the data is saved in a text file. Data saved in either format can be opened by Graphical Analysis. 14 Graphical Analysis for Windows USER’S MANUAL Quit If you want to quit the Graphical Analysis program, choose Quit from the File menu. If you are working with an unsaved file or have entered new data, you will be asked if you want to save this information on disk before quitting. Finding a Mathematical Relationship between Variables An important goal of data analysis is to determine the mathematical relationship between different variables. Graphical Analysis provides two methods to achieve this goal. One method, described in the following section, involves the graphing of modified data to find linear relationships. The other method, described later, applies mathematical models to automatically or manually fit a curve to the data. Graphing Modified Data This method of analysis is performed with columns of modified data. This concept is based on the idea that if a graph produces data along a straight line, then whatever you graphed on the vertical axis = whatever you graphed on the horizontal axis x the slope of the line + the vertical axis intercept If the line goes through the point (0, 0) on the graph, then the relationship is even simpler: whatever you graphed on the vertical axis = whatever you graphed on the horizontal axis x the slope of the line In other words, the variables graphed are proportional. Graphical Analysis provides a way to experiment with different graphs and to try to find one that produces a straight line. If you are successful, you have probably found the relationship between the variables. The examples and graphs below illustrate this idea: Example 1: Consider the relationship between the variables X and Y in the upper graph shown to the right. Clearly, Y is not proportional to X or else the graph of Y vs. X would be a straight line. Is Y proportional to X2? Maybe Y is proportional to X3. Perhaps the relationship is more complicated. You can do some quick checking by creating a modified data column and plotting a graph of the modified data. To test whether Y is proportional to X2, plot a graph of Y vs. X2. If this graph turns out to be a straight line, then Y is proportional to X2. If this graph is not a straight line, you can try plotting Y vs. X3. If this graph is a straight line, then the relationship is that Y is proportional to X3. Whenever the “straight line graph” is found, you have determined the relationship between X and Y. By trying several different graphs with X-axis data raised to different powers, you can search for the graph that gives the best straight line. In this way, you can often find the relationship that best fits the experimental data. The bottom graph at the right shows that, in this case, Y is indeed proportional to X2. 15 Graphical Analysis for Windows USER’S MANUAL Example 2: The top graph on the screen to the right shows a different kind of relationship. What is it? Clearly Y decreases as X increases, so you might try an inverse relationship (Y = 1/X). The middle graph plots Y vs. 1/X but it is not linear. The bottom graph plots Y vs. X -2 and this is linear; therefore, Y is proportional to the 1/X 2. This procedure is summarized below: 1. 2. 3. 4. 5. Decide on a possible relationship between the two variables. Usually, you can do this by looking at the data table or by looking at the original graph. Other times, the relationship to test will be suggested by a teacher, lab manual, etc. Since it does not take very long to produce a graph using Graphical Analysis, do not worry about this choice. If it does not work out, you can always try another graph. Pull down the Data menu and choose the New Column option. Select Calculated from the pop-up menu that appears. Enter the appropriate information in the New Column dialog box. (Refer to the Creating a New Column of Data section for further information.) Click the Y-axis label of a graph to select the appropriate variable to be graphed. Check the graph to see how linear it is. If it seems linear, determine its slope and intercept. The easiest way to do this is to click and drag through the data, then click the Regression Line button. (Refer to the Analysis Tools section.) If that graph does not seem linear, try a different relationship. Even if the graph you made appears to be a straight line, it is a good idea to try other relationships to verify that they are not as linear.3 Automatic Curve Fitting Another way to explore the relationship between variables with this program is to fit mathematical models or curves to data. Within the program you have two options for curve fitting: automatic curve fitting and manual curve fitting. When selecting the automatic curve fitting option, you choose an appropriate model and the program will use standard statistical formulas to calculate the coefficients, constants, and/or exponents of the model. For example, open the DECAY.DAT file and select the Automatic Curve Fit option in the Analyze menu. Select the Linear model from the Stock Functions list. The screen to the left will appear. It is obvious that this model does not provide a good fit to this data. As a matter of fact, the mean square error of 2020 is very large. 3The Teacher's Guide has more information on how to use Graphical Analysis to find the relationship between variables. 16 Graphical Analysis for Windows USER’S MANUAL We should try another model. Click the Try New Fit button and select the Inverse model from the Stock Functions list. Again, the model does not provide a good fit. The mean square error, 6280, is even larger. Click the Try New Fit button and select the Exponential model. This choice has provided a very good fit with a very small mean square error, 0.453. If you click the OK - Keep Fit button, you will return to the main screen. The graph window will now look like the screen to the left. The raw data will be graphed along with the exponential model. A floating box will be displayed on the graph. This box will contain the model, the calculated coefficients, constants, and/or exponents, and the mean square error. 17 Graphical Analysis for Windows USER’S MANUAL Each of the above examples uses one of the stock equations built into the program. An extremely powerful feature of the curve fitting options is the ability to enter your own custom equation. To do that, select the Automatic Curve Fit option from the Analyze menu. The pop-up box to the right will appear with a field labeled “y = ” in the top portion of the box. In the examples above, you clicked on one of the Stock functions to paste an equation into the field; however, you can enter any equation you want using the variable X and any functions, coefficients, constants, or exponents. In the example to the right, the equation “y = A*x^2+1/x+B” has been entered. If you enter your own equation, the program determines the curve fit by trial and error. It tries various values, calculates the mean square error, adjusts the values slightly and repeats the process. You can watch the process as the program tries different values. You may find it interesting to see how the curve moves gradually to the best possible fit. As you experiment with curve fitting, you might select the reverse exponential, sine, or Gaussian model. These models do not have single, closed forms. In each case, the best solution is calculated by trial and error. This may take a considerable amount of time, especially on a slow computer. While the curve fitting calculations are being performed, you can also click on any of the coefficients or exponents to “suggest” a better value. This can speed up the curve fitting process and, in a few cases, may be necessary to help the curve fitting routine find a solution. Throughout this process, you will be able to watch the fitted curve as it is modified to fit the data. Sample Data Files There are a number of sample data files on the Graphical Analysis disk that you can open and graph. Try finding the relationship between the variables for some of them.4 You can use the modified data method or the curve fit method to find the relationship between variables. 4All these sample data files are described in the Teacher’s Guide. 18 Graphical Analysis for Windows USER’S MANUAL Other Operations The previous description of the manual has covered only the essential features of the program. This program has many other features. Here is a quick summary of other operations you might want to perform. For more information on any feature of the program, consult the Reference Section of this manual or the Help system built into the program. Operation: Create a new data set How to do it: Select the New Data Set option from the Data menu. Resize a window When two or more windows appear on the screen, it is possible to resize them. Move the mouse pointer over the space between the windows. It will turn into a double-headed arrow pointing in the directions that the window edge can be moved. Click and drag the edge of the windows until they are sized as you want them. Release the mouse. Swap windows It is very easy to swap two windows using the mouse. To do this, click and drag the title bar of one window into the other. The mouse pointer will change, notifying you of the swap. (Note: you can also Choose Arrange Windows from the Window menu.) Remove a window Select Close Window from the Window menu or double-click the Control box. Delete data pairs Select the rows and then choose Delete Data from the Edit menu. Delete a column or data set Click the title of the column or data set and choose Delete Column or Delete Data Set from the Edit menu. Sort the data Select the header of the column by which the data is to be sorted, then choose Sort Data from the Data menu. Insert data pairs into the table Enter the data at the bottom of the data table, then select the Sort Data option in the Data menu. Select the appropriate column to sort by. Generate numbers automatically for the data table Select a cell in the Data Table and then choose Fill Column from the Data menu to fill from that cell down. Change the way the numbers are rounded Select Column Options from the Data menu. Calculate statistics for a column of data Click the data table and select Data Table Options from the Window menu, then check the Show Statistics box in the popup menu that appears. Interpolate or extrapolate from the regression line or fitted curve of the data. Choose Interpolate from the Analyze menu. Copy the title bar and border with a window. Hold down the <Ctrl> key while selecting the Copy Window option from the Edit menu. Load Data from a TI-73, TI-82, TI-83, TI-83 Plus, TI- Connect the TI-GRAPH LINK cable. Choose Import from TI Calculator on the File menu. Link the data using the 85, TI-86, TI-89, TI-92, or TI-92 Plus graphing standard calculator keystrokes. calculator. 19 Chapter 3 PHYS 200 Laboratory Exercise 1 This is the first of 7 required laboratory exercises in the PHYS 200 course. It is not required for PHYS 201. However, you should review this material carefully if you are in PHYS 201 but did not do PHYS 200 at Athabasca University, paying less attention to any material on calculator-based methods. Lab 1 Graphical Analysis Techniques Introduction Many scientific studies involve finding out how one quantity is related to another. One way to explore relationships, and the one that will be used throughout this lab session, is to collect and analyze experimental data. The TI-83 calculator will be used along with the Calculator Based Ranger (CBR) or Calculator Based Lab (CBL) to gather data in PHYS 200 labs. The calculator or a PC-based program can be used to graph and analyse the data gathered. Here we will concentrate on lists in the TI-83 calculator and the use of the Graphical Analysis (GA) program. We will also explore the concepts of modelling and error analysis and have a bit of mathematical review. The actual experimental work is minimal and does not require use of the CBR or CBL unit. You should be able to do the timing work for this lab with a digital watch. Since there is a lot of mathematical review, this is a rather long lab but it is very helpful in making sure you understand the (non-calculus) mathematical techniques needed in the course. Please read the textbook sections of reference before proceeding. Reference Physics, D. C. Giancoli, Fifth Edition Section 2-8, Graphical Analysis of Linear Motion (pp. 38-40) Section 9-6, Elasticity; Stress and Strain (p. 253 only) Section 4-6, Weight (p. 87 only) Section 11-4, The Simple Pendulum (pp. 319-320) Appendix A-4, Algebra (pp. 1039-1042) Appendix B, Dimensional Analysis (pp. 1048-1050) TI-83 Graphing Calculator Guidebook (GCG) Chapter 12, pp. 12-1 to 12-13 Equipment From PHYS 200 Kit (borrowed from the AU Library; start the lab immediately, as these are used only at the end) TI-83 TI-GRAPH LINK CABLE You must supply computer running Graphical Analysis (disk included with course package) ruler large rubber band (5 to 10 cm unstretched length) about 30 washers or heavy coins (referred to as masses) container to hold masses on rubber band (large pill bottle or similar) 2m of string stopwatch or wristwatch with chronometer function duct tape (may be needed) graph paper Note: mass of a Canadian $1 coin: 6.97 g; of a Canadian $2 coin: 7.31 g Part A: Rubber Band Force Constant Method 1. Hang a rubber band from a support. Attach the container for masses, and possibly add masses, until it is slightly stretched. Measure and record the length of the band. 2. Add masses one by one to the rubber band, recording the length of the rubber band and the number of coins (related to mass) causing that stretch. 3. Use a notebook initially and then copy the values into Graphical Analysis. When you get the Lab Kit, you will enter the data into lists on the TI-83 calculator. To enter values into Graphical Analysis, start up the program and click the mouse cursor in the colums of Data Set 1 in the Data Table Window. Use the tab key to advance from cell to cell in sequence down the table. The sample table at left shows the data set with three X,Y pairs (i.e. data points) entered and the X value for row 4 being entered. As values are entered, the Graph Window is updated to show a graph of the data entered so far. The graph corresponding to the data above is shown at left. As in this example, enter your data as pairs giving the number of coins and elastic stretch. Of course, for your experiment, the Y value, or stretch, should increase with the number of coins. In the data shown here the Y value decreases as X, which might be an integer number, increases. Analysis 1. You will likely notice that the stretch goes up with the number of coins to make a graph which is almost a straight line. This indicates that the linear function y = mx + b will likely represent the data well. The parameter m is the slope of the line, and b is its y-intercept, its value when x=0. Perform a linear fit to the data (see Automatic Curve Fitting in the Graphical Analysis Manual of Chapter 2). Skip to the end if you do not have your lab kit yet. 2. Enter the data into TI-83 lists (see p. 12-2 of GCG). Ensure that your data is in lists L1 and L2 of the TI-83. (see p. 12-3 of GCG to see how to check this and how to make a scatter plot). 3. Make a scatter plot of mass versus length (length on the vertical (Y) axis, number of coins on the horizontal (X) axis). What, roughly, is the relationship of length to number of coins (mass) for the elastic band? 4. Perform a linear regression (LinReg (ax+b)) from the STAT CALC menu on the TI83. (See Chapter 3). Identify and record the regression equation as y=ax+b. Record r, the correlation coefficient (see p. 12-23 of GCG if this is not already displayed as a result). This number measures the “goodness of fit” of the equation with the data. Graph the regression line and scatter plot together as shown on p. 12-4 of the GCG. Sketch the plot as shown on the calculator screen. 5. Transfer your lists to columns in the Graphical Analysis program on a PC by using the link cable and the LINK SEND menu on the TI-83 (See Appendix 2). Ensure that the data transferred is the same as you had entered directly in the first step. Perform a linear fit to the data (see Automatic Curve Fitting in the Graphical Analysis Manual of Appendix 4). Compare the fit to that obtained with the TI-83. Transferring data to the PC is the best way to graph it. Make a graph and print it, showing the data and the fit. 6. Based on your regression, how many coins would it take to stretch the elastic band one meter? Do you think this would work? Clearly the more coins you use, the ‘heavier’ is the weight hanging from the elastic. This ‘heaviness’ is a force resulting from gravity pulling the coins downward. The more force is applied, the more the elastic band stretches. This is exactly what you would feel in trying to stretch the elastic band with your hands: you must pull harder, that is to say apply more force, to stretch the band more. 7. Use the coin masses (see Note under Equipment) provided to convert number of coins into a mass in kilograms (kg). If you have used washers you may estimate their mass. 8. Hold the masses. By feeling the masses pulling your hand down, determine the direction of force they exert on the end of the rubber band when hanging there. By pulling the rubber band downward, determine the direction of force it would exert on the hanging masses. The force, in units called Newtons, from gravity is mg (m times g) where m is the mass in kg and g is about 9.8 m/s2. Determine the force constant k of the rubber band if the force it exerts is F = −kx , with x the extension in meters. If the unit of force, the Newton, is equivalent to 1 kg·m/s2, what must be the basic units of k? What would be the most physically meaningful units to use for k? Perform steps 2 through 8 above later if you do not yet have your lab kit. Meanwhile read the Discussion and then move on to Part B. Discussion In this simple experiment, we have found that the stretch of a rubber band increases as more masses are added to it. Since gravity acts on these masses to produce a force, we conclude that the more force is applied to a rubber band, the more it will stretch. This seems to be in agreement with our intuition and experience in stretching rubber bands. Further, we have been able to show that the increase in stretch is proportional to the force applied and to represent the relation between stretch and force by a straight line. The straight line or linear fit is referred to as a mathematical model of the relation of force to stretch in the elastic band. In fact this relation is known as Hooke’s Law. In the next section we will perform a simple experiment in which the data does not follow a linear trend. We will examine the effects of errors, and how a better model may be chosen. A good model allows us to investigate the physics of whatever we are studying. There are two major types of error, random and systematic. These can both be due to measuring error. For example, in the exercise above you likely had trouble reading the ruler to better than 1 mm accuracy and this could have been out in one or the other direction. That is a random error. If, on the other hand, you were using a ruler marked in tenths of an inch and you thought it was in mm, that would give a systematic error of scale. Another type of systematic error can be modelling error, where an inappropriate model is used. These errors can all be inter-related. Let us examine them with an example. This plot shows artificial data generated by a statistical package (Statgraphics). An experiment has been simulated with a lot of random measurement error. This experiment simulates what you will actually do in the next section, that is, measure the period of a pendulum (time it takes to complete one swing) as its length changes. Plot of Period vs Length 10 Period 8 6 4 2 0 0 10 20 30 40 50 Length In a general way the measured quantity of period increases as the length was changed. There is quite a bit of scatter due to random error. Largely because of this, from this data set about the best we can do is to conclude that period increases with length, and the simplest way to model that is with a straight line fit. Here is the best fit line: Plot of Fitted Model 10 Period 8 6 4 2 0 0 10 20 30 40 50 Length Although it is clear that this straight line does not go ‘through’ all the data points it seems to do a fairly good job. There is not systematic trend obvious in the deviation of points about the best fit line. These deviations are called residuals. We have no reason to suspect any other model for this data than a straight line, although sophisticated statistical methods (which we do not use in this course) might help us with that. Review: Measure two points on the line in this graph and make sure you can find that the equation of the line is Period = 1.831 + 0.1335*Length. If you have done the suggested reading you will know that we do not expect the result in this experiment to be a straight line graph. You may also have some distaste for large errors: after all the scatter from the line is in some cases nearly 2 seconds: surely we can do better than that. So you may be motivated to reduce the errors (we show how to do that in the next section). Here we simulate a great (tenfold) reduction in the measuring error in time: Plot of Period vs Length 8 Period 6 4 2 0 0 10 20 30 40 50 Length With these much better measurements, you will notice that the results no longer look as if they are represented by a simple straight line. There is a definite curvature to them. Nevertheless, we can check how useful a model a straight line is by doing a fit, and here are the results: Plot of Fitted Model 8 Period 6 4 2 0 0 10 20 30 40 50 Length Comparing this to the fit on the previous page, we now notice a strong pattern to the residuals. The data points are systematically below the line for small values of length, then systematically higher than it, then again systematically lower. Such a pattern in the residuals tells us that our model can be improved. It is possible that this simple model could still be useful for making approximations, but a better one likely exists. Here are the results of using a quadratic equation (you should know this term: if not see the last section) instead of a straight line for the model: Plot of Fitted Model 8 Period 6 4 2 0 0 10 20 30 40 50 Length You see that the data is very well represented. The residuals appear to be fairly random, so the fit is excellent. In fact, statistically speaking, 99.7% of the variation in the period due to changes in length is explained by this fit. Does this make a good fit for comparison with theory? Surprisingly, the answer is no! A quadratic equation uses an extra term of the form x2 and with it can match the curve well. However, theory leads us to expect a square root, not a square, in this relation. Although a quadratic gives excellent agreement over the range shown, this quadratic is bending downward, and sooner or later its values will start to decrease with increase in length. So a quadratic cannot be our best physical model. This fit is excellent if we need to approximate values in the range on length 0 to 50, but that is all! It is not a physically based model. Since a square root is a power law with exponent ½, we should try a power law fit. Here it is: Plot of Fitted Model 8 Period 6 4 2 0 0 10 20 30 40 50 Length This also gives a great fit and no trend in residuals. The power needed is 0.5004, very close to the value expected for a square root. Let us now do a similar study, for real… Part B: Pendulum Experiment You can make a simple pendulum by suspending a small mass (a ‘weight’) from a string and swinging it back and forth. You will notice that how ‘fast’ it swings depends on the length of the string. We do not study the theory of pendulums in this course, but it turns out that unlike the case of stretching an elastic by a mass, the dependence of the period of oscillation on length of the string is not linear. Method 1. Attach a hanging mass to a string to make a pendulum. Support this from the ceiling. Pull the mass aside to about a 15° angle and release it. Use the chronometer function on a digital watch, or a stopwatch, to determine the time for ten complete back and forth oscillations. Record the string length and the time you deduce would be needed for one oscillation. This is called the period. Repeat at least ten times using varying string lengths to fill out the possible range of string lengths, from about .2 m to about 2 m or as high as your ceiling permits. It is important to get a large range of lengths and less important to get a large number of different lengths. Analysis 1. Enter your data of string length and period into Graphical Analysis and perform an analysis (linear fit) similar to that done in the previous section. Comment on this fit, including discussion of any patterns in residuals. Print your graph, showing the fit. 2. Use the automatic fitting routine to find a better function with which to fit. In your reading (equation 11-11a in the textbook on page 319) you will have noticed that the period should increase only as the square root of the length of the string. Note that a square root function is a power law with exponent ½. The power law is A*X^B, and B should be left to vary, with the expectation that it will settle on a value near 0.5. Pay close attention to the use of variables; the length of the string is the ‘most natural’ to put on the horizontal (X) axis - it is the independent variable. Compare your result to that of the textbook, commenting on whether the fit is better than that of a straight line and whether you think this formula does indeed represent your data. You do not need to analyze the value of the constant part involving 2π and the square root of g. Just pay attention to the basic shape and the power involved. 3. Perspective We have seen that physical quantities may be related to one another. Sometimes the relationship is especially simple (length of elastic band and suspended mass). Sometimes it is more complex and needs more sophisticated analysis to be understood (length of string and pendulum period). Plotting a graph can be useful in displaying these relationships whether complex or simple. We now have powerful tools available allowing us to go yet further and extract an equation from measured data, although we must pay attention to making sure that equation is a good model. The discussion of residuals is important. The residuals give an idea of the errors in the fit. These may be due to measurement error or to some deviation of the fitting function from what is really happening. Recall that a linear fit was attempted and then a power law was found to be better. The size of residuals is often useful in specifying overall error, while a trend in the residuals may indicate an unsuitable model. We have learned to use the TI-83 and PC as tools in analysis of physical variables and phenomena. In this lab we did the measuring ourselves. We entered results manually to the calculator or to the computer program Graphical Analysis. The TI-83 may be used with sensors to automate the measuring in later labs, placing data into the calculator. It may then be transferred to the computer, for use there, with the link cable. Part C: Combination of Errors You will notice that in the previous parts, there were errors known as residuals. In a good model these are scattered randomly and represent errors in measurement which in principle are random. In a poor model they may have some pattern to them and may show that systematic error is present. For the pendulum, changing to a power law fit removed much of the systematic error, so that we could tell that the new model was better than the linear model. Nevertheless, there were still random errors. If we measure two or more quantities in an experiment (as we have seen above, we usually measure at least two and then look for a relation between them), then we often need to know what is the error when these quantities are combined. There are of course many ways of combining quantities. In common formulas, we may need to add, subtract, multiply, or divide. As we have seen above, nonlinear relationships like square roots may also occur. It is very common to refer to the error in a quantity by writing the quantity with a ∆ (delta) in front of it. Thus if we call t the time, ∆t would be the error in the time. Addition If we measure two quantities and add them together, then the total error simply also adds up. For example, if we measure one time interval t1 and a second t2, then the total time interval we have measured is t = t1 + t2. If each has an error ∆t1 and ∆t2, then the total time is known only to an accuracy of ∆t = ∆t1 + ∆t2. Example: The time taken for a ball to roll down a ramp is measured with a stopwatch. It is estimated that there is a random error of 0.1 s in measuring this way. (There may also be a systematic error due to reaction time, which we are not considering). One trial of rolling results in a time of 4.7 s and a second trial results in 4.4 s. The total time taken is then 9.1 s with error 0.2 s. This is often written 9.1±0.2 s. Subtraction In subtracting two numbers the uncertainties add, just like in addition. Consider again two time intervals t1 and t2, with errors ∆t1 and ∆t2. We will take t1 as the larger value so that the difference t = t1 - t2 is positive. In the two possible extreme cases, the errors on these would be opposing. Those cases would be t = (t1 + ∆t1)-(t2 - ∆t2) = t1 – t2 + (∆t1 + ∆t2) and t = (t1 - ∆t1)-(t2 + ∆t2) = t1 – t2 – (∆t1 + ∆t2). Clearly the possible range of the result t is from t1 – t2 – ∆t to t1 – t2 + ∆t, so ∆t = ∆t1 + ∆t2. Example: In the above experiment on balls rolling, the difference in time between two trials is to be determined. With the data above we have the result (difference) t = 0.3 ± 0.2 seconds. Clearly the error in subtracting two poorly determined but similar large numbers is large in comparison to their difference. It is always best to avoid situations where differences of nearly similar values have to be taken. Multiplication It can be shown (easily if you know calculus) that for a product, the error depends on both the individual errors of the numbers being multiplied, and on the size of those numbers. If z=xy, with errors ∆x and ∆y, then the error ∆z = x∆y + y∆x. Example: The distance covered when moving at constant speed v for a period of time t is d = vt. A CBR distance ranger is used and reads v=1.66 m/s ± 0.02 m/s. A stopwatch is also used to time the motion as lasting 5.1 ± 0.1 s. Then the distance must be 8.466 m, and the error is ∆d = 5.1(0.02) + 1.66(0.1) = 0.268 m. Since this result is based on numbers having only one digit of real meaning, we should write it as 0.3 m. That further means that the extra decimal places in 8.466 do not have much meaning and we should write that result as 8.5 m. We conclude that the distance moved is 8.5 ± 0.3 m. Division The fairly complicated formula for division will be stated here, but not proven. If z = x/y, then ∆z = (x∆y + y∆x)/y2. Example: Consider the reverse of the multiplication example. If we were able to rather crudely measure a distance travelled as 8.5 ± 0.3 m, and the time taken as 5.1 ± 0.1 seconds, then we could test the accuracy of the CBR unit in measuring velocity. We would use v = d/t = 1.67 m/s, and ∆v = (d∆t + t∆d)/t2 = (8.5*0.1 + 5.1*0.3)/(5.12) = 0.091 m/s. We seem to have an inconsistency here since this is over four times the stated accuracy of the CBR unit, which led to the ∆d we used in doing the problem backwards. The reason for this is that we assume errors to add in the worst possible way. In this way we get an upper limit on the error of the result. Relative Error It is often useful to speak of the relative error ∆x/x to compare the size of error to the size of the value measured. Another advantage is that the relative error of a product or dividend is just the sum of the relative errors of what make them up. General Functions Generally, the theory of error says that the error due to a quantity combined into a result is the slope due to that quantity times its error. This makes sense. For example, if a result did not depend on an independent quantity at all, then any amount of error in that quantity would not affect the result. Not depending on a quantity results in a horizontal graph, i.e. zero slope. A steep graph means a great dependence on the independent quantity, so the response to errors in that quantity is larger. The result above can be stated as ∆y=(slope)∆x if y only depends on x. A whole family of error results arise from this since it turns out that (for powers other than 0), the slope of a power function y=xn is just nxn-1. For example, if the equation is y=x2, the error is just 2x∆x. Give the error formula if y=x5. Give the error formula for y = x . Hint: recall that a square root is the power one-half. Show that the relative error in x and y simply add to give the relative error in z in both the case z = xy and the case z = x/y. Discussion We have briefly examined error analysis. Knowledge of measurement errors and how they combine is important in understanding how much to trust experimental results. Part D: Quadratic Equations As described in Appendix B of your textbook, a quadratic equation is written in the form ax2 + bx + c = 0, where a, b, and c are constants. We will encounter quadratic equations frequently in the course, in large part because the equations about motion of bodies often have this form. Fortunately, the quadratic equation has a general form of solution, allowing us to find x as x= − b ± b 2 − 4ac − b = ± 2a 2a b 2 − 4ac . 2a Usually there are two possible solutions (often called roots), and we use a symbol ± to remind us of this fact. One solution corresponds to a + sign at the position of the ±, the other to a - sign there. Since this relatively straightforward form of solution exists when such an equation is written in the form above, it is useful to get in the habit of rearranging quadratic equations into that form whenever you work with them. You can then regard the constant a as being ‘whatever goes with the squared term’, the constant b as being ‘whatever goes with the linear term’, and the constant c as being ‘whatever is left’. As mentioned, mathematically there will be two possible solutions. Often one of these is not a possible answer to a problem because of something else we know about the problem. For example, if we know that motion started at time t=0, and the above solution gives two possible answers for a time, one of which is negative, then the negative root cannot be part of the answer to your problem. In some cases there will be no real answer, and the square root in the solution will be negative. In this course, if that happens, it will usually mean you should recheck your math! We will now use Graphical Analysis to explore quadratics and the quadratic formula. To do this, start Graphical Analysis on your computer. You will see (after turning off the hint) a blank Graph Window and a blank Data Table Window with headings “x” and “y”. Creation of independent variable column in a table Under File in the main menu area, select New. You will be asked about saving your old values and you should do this, giving a meaningful file name like “ex1partb”. Within the Data Table Window in GA, click on the title X to highlight it. Click on Data within the top menus, then on “Fill Column” to bring up a small selection box, with areas for “Start Value”, “End Value”, and “Increment”. By clicking in these areas and replacing the initial values, enter 0, 10, and 0.1, respectively, then click on the “OK” button. The “x” column in the Data Table Window will fill with numbers from 0.0 to 10.0 by 0.1. Since these represent time values, we shall rename this column as “t”. To do this, double click quickly in the title box where it now says “X”. A box entitled “Column Options” should appear, and in this you may replace the “X” beside “New Name” with a “t”. Click “Ok” at bottom left to effect this change. Creation of dependent variable column(s) Dependent variables have that name since they depend on another variable, often the time if we study the motion of objects. How they depend on time may be what we are trying to deduce from data. Here we will illustrate two types of motion: motion at constant velocity and uniformly accelerated motion. Motion at constant velocity results in curves which are straight lines on a graph of position versus time. Uniformly accelerated motion results in the slightly more complex curves known as parabolas. The equations of parabolas and the form we use for solving problems with them are known as quadratic equations as referred to above. We have seen above that quadratic equations have a relatively simple form of solution. Let us see what they look like graphically, and how the solution relates to them. We will later find that the general equation for the height y of an object, thrown upward at time t=0 with a speed v0 starting from a height y0, and with gravity pulling to cause a uniform acceleration of amount g, is, while in flight at later values of the time t, 1 y = y 0 + v 0t + gt 2 . 2 Since gravity actually pulls downward, its numerical value in the upward (i.e. positive height) direction is negative, and the value of g is -9.8 in SI units. If we assume that motion started at a time we will call zero from a roof at 10 m height, and that the object in question (a ball, let’s say) was shot upward at 30 m/s (about highway driving speed of 110 km/h), we would have all of the constants needed to specify y numerically as y(t), that is y for any value of time t, which could be substituted: y ( t ) = 10 + 30t + 1 ( −9.8) t 2 = 10 + 30t − 4.9 t 2 . 2 The term 30t reflects the effect of the initial upward velocity, and is absent if there was no initial upward velocity given, for example if the object were simply dropped. Graphical Analysis allows us to plot this curve for the times which we have in first data column. Method Quickly double-click in the “Y” title in the Data Table Window. Within the Column Options box which appears is a button labelled “Definition…”. Click on that and if necessary answer that you wish to make a calculated column, and an “Edit Column Definition...” box will appear. Click in the “Column Definition” space and enter 10+30*"t"-4.9*"t"^2, where the quotes must to be used since the t for time is considered to be a “name”. It would also be possible to use the Columns selector to pick out the t to put into the equation but in this case use of the quotes is simpler. Clicking on “OK” in this box will cause the function to be plotted and the Data Table to show the Y values. You will notice that the curve starts at t=0 and at the height Y=10. Then the curve rises rather than starting to go down. This makes a lot of sense since the object was initially thrown upward, and clearly started its motion by moving upward. However, with gravity tugging on it, it eventually could not continue to go up, and eventually started to come down. By time t=7, it had hit the ground, as shown by its height being zero. You would expect that it took a longer time to hit the ground than if the object it had merely been dropped and headed straight down. We know by experience that something dropped from 10 m height (a high roof) does not take 7 seconds to fall straight down, so the above explanation makes sense. We will now examine the meaning of the roots of a parabolic equation representing motion. Repeat what was done above to fill the “t” column, but this time with values from -1 to 10 (i.e. follow instructions above, but this time start at –1). Move the cursor into the Graph Window to near the point where the data curve has Y value 0. Press the mouse button and move, creating a small box which encloses the root. You can now go to the menu bar and click on the magnifying glass IN zoom button to enlarge this portion of the graph. Continue zooming in until you can estimate the root to 3 significant figures, then click on the AUTO button to the right of the zoom button, to restore your original view. You may need to click on the t axis label to manually put in a limit of -1. Repeat the procedure where the fit curve crosses 0 to the left of the origin. Analysis Use the quadratic formula to find the roots of the equation. Compare these to the roots found graphically and discuss the physical meaning of each root. Note that the first term in the quadratic formula is − 2ba and calculate this value. Since the other term has a ± sign, its value is either added or subtracted to − 2ba , which then must be a point of symmetry of the curve. Discuss any other notable aspects of this point. You may find the following menu buttons helpful in doing so. The X=? button will attach a small data readout box to the cursor while it is in the graph window. With this you may easily see data values as you sweep the cursor over the graph. Beside it is the slope display button. If you activate this one you will see the slope of the curve also. It is possible to activate either, both, or neither of these cursor functions. What do they show to be special at the time − 2ba ? Comment The “Getting Started” section in the GCG shows how to enter the quadratic formula and use the calculator to solve it, on pages 6 to 7. Please do not perform any of the operations on page 5 as these would remove the prestored programs from your calculator. You may find it useful to program in the quadratic formula as shown, although it is not actually all that hard to solve ‘manually’ in any case. If you do choose to use the calculator to solve quadratics, be very careful! You must always understand a solution, and a calculatorgenerated result will be no better than any other if there is some error in your analysis. Review the discussion above and focus on the physical meanings of parts of the formula. Always keep these physical aspects in mind when working towards a solution. On page 8 of the GCG a quadratic is solved which does not correspond to a physically real solution as we know them. You may ignore the discussion of complex numbers unless you are already familiar with the concept. Since these do not correspond to physical solutions at our level of discussion, if your calculations lead to complex numbers or square roots of negative values, take this to mean that you have made an error in a previous step. Report Refer to Chapter 1 for a summary of useful information for your lab report. At the appropriate time, send the report to your tutor for marking. Meanwhile you should find some of this discussion useful to your study of kinematics. You are also encouraged to try to compare real experiences with the graphical displays. Simply tossing a ball vertically up and carefully observing its motion can be very helpful. You may discuss the report with your tutor at any time, and may wish to send in this lab before the others, to make sure that you are ‘on the right track’. Be sure, in your report, to include answers to any questions which may have been asked throughout this exercise.