1
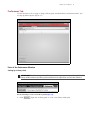
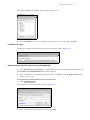
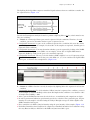
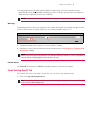
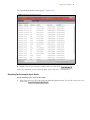
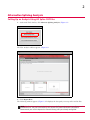
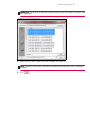
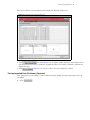
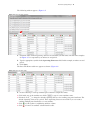
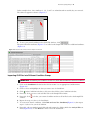
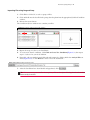
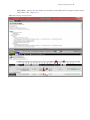
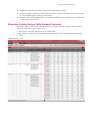
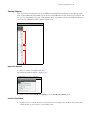
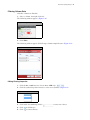
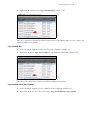
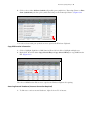
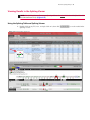
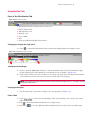
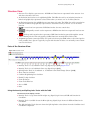
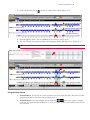
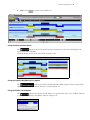
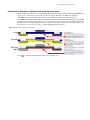
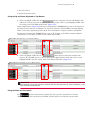
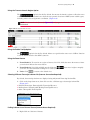
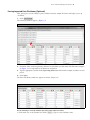
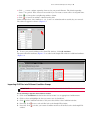
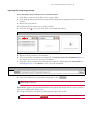
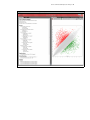
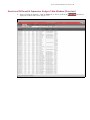
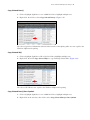
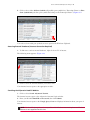
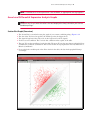
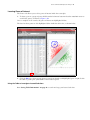
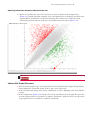
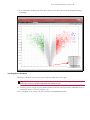
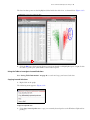
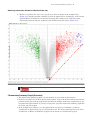
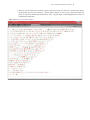
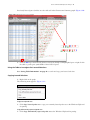
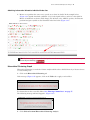
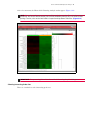
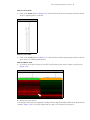
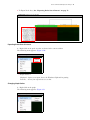
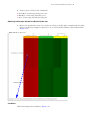
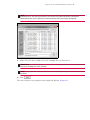
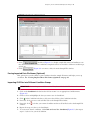
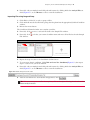
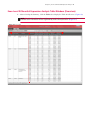
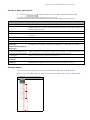
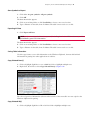
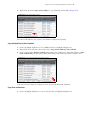
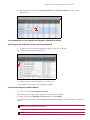
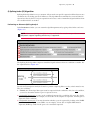
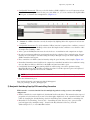
Alternative Splicing Analysis 43 Get Score button Isoform drop-down menu Using the Up and Down Regulated on Top Buttons 1. Click to highlight a PSR, then click button to bring the isoforms with high SI value PSR (red) to the top (based on the Splicing Index and p-value values of your highlighted PSR). Note the sorting order of the PSR and Isoforms. (Figure 2.44) In the example below, (Figure 2.44)the top 2 isoforms plus the TR10004184.hg (some or all of them) are the likely isoforms in Liver (Condition1), because these isoforms contain 2 PSRs with a high Splicing Index. It also shows significant p-values in the Liver (Condition1) compare to Muscle (Condition2). The bottom 2 isoforms plus TR10008792.hg (some or all of them) are the likely isoforms in Muscle (Condition2), because these isoforms do not contain these 2 PSRs. Figure 2.44 .Up-Regulated on Top Sort Order Example 2. Click to highlight a PSR, then click button button to bring the isoforms with negative SI value PSR (green) to the top (based on the Splicing Index and p-value value of your highlighted PSR). Note the sorting order of the PSR and Isoforms. (Figure 2.45) Figure 2.45 Down-Regulated on Top Sort Order Example IMPORTANT: If Other than "Affx Transcript Isoforms" IDs are used, the software will do 2level sorting. It first sorts Isoforms with IDs (for the selected source), then it performs a subsort within the sorted result. Using the Show Junction Option The option is unchecked by default. Check it to produce dotted lines to show the relationship of the detected Junctions and PSRs. Uncheck this box to hide these junction lines.