1
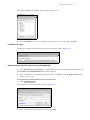
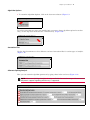
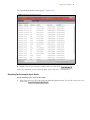
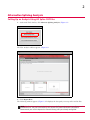
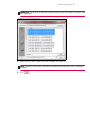
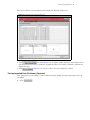
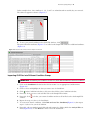
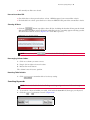
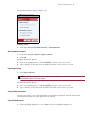
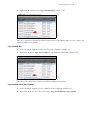
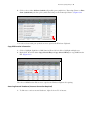
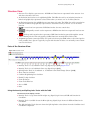
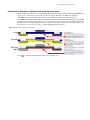
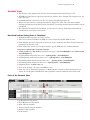
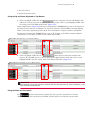
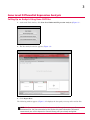
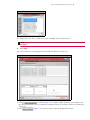
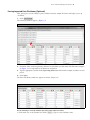
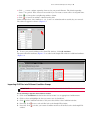
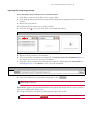
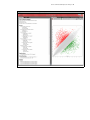
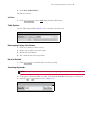
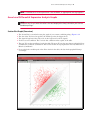
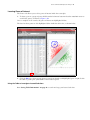
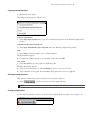
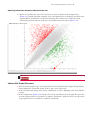
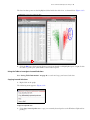
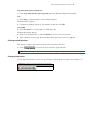
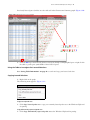
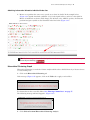
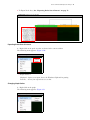
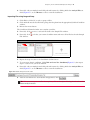
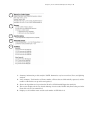
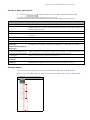
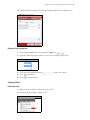
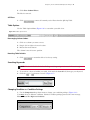
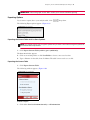
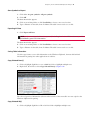
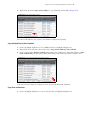
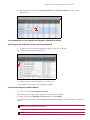
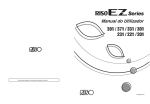
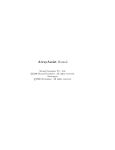
Gene Level Differential Expression Analysis
74
Print
1. Click Print to print the graph to a pre-configured printer.
The Print window appears.
2. Configure the printing options as you normally would, then click OK.
Save as PNG
1. Click Save PNG to save the graph as a .PNG image file
The Save As window appears.
2. Click on an existing folder or click New Folder to choose a new save location.
3. Type a filename for the graph, then click Save. The graph is now saved as a .png file.
Clearing Lassoed Selections
This option is enabled after genes have been lassoed.
1. Click
to clear lassoed genes from the graph and table.
TIP: You can also clear a lassoed selection by lassoing a white (blank) space within the graph.
Changing Graph Colors
Use the drop-down menus to select your up and down regulated probe set graph colors. (Figure 3.42
Figure 3.42 Graph Color Menus (Red and Green are default)