1
Network Administrator’s
Guide
ProCurve Manager
Software Release 2.2
www.procurve.com
© Copyright 2007 Hewlett-Packard Development Company, LP.
All Rights Reserved.
This document contains information which is protected by
copyright. Reproduction, adaptation, or translation without
prior permission is prohibited, except as allowed under the
copyright laws.
Publication Number
5990-8850
May, 2007
Edition 2.2-b
Disclaimer
The information contained in this document is subject to
change without notice.
HEWLETT-PACKARD COMPANY MAKES NO WARRANTY
OF ANY KIND WITH REGARD TO THIS MATERIAL,
INCLUDING, BUT NOT LIMITED TO, THE IMPLIED
WARRANTIES OF MERCHANTABILITY AND FITNESS
FOR A PARTICULAR PURPOSE. Hewlett-Packard shall not
be liable for errors contained herein or for incidental or
consequential damages in connection with the furnishing,
performance, or use of this material.
Hewlett-Packard assumes no responsibility for the use or
reliability of its software on equipment that is not furnished
by Hewlett-Packard.
Warranty
Trademark Credits
Microsoft, Windows, Windows 95, and Microsoft Windows
NT are registered trademarks of Microsoft Corporation.
Internet Explorer is a trademark of Microsoft Corporation.
Ethernet is a registered trademark of Xerox Corporation.
Netscape is a registered trademark of Netscape Corporation.
Hewlett-Packard Company
8000 Foothills Boulevard, m/s 5551
Roseville, California 95747-5551
http://www.procurve.com
See the Customer Support/Warranty booklet included with
the product.
A copy of the specific warranty terms applicable to your
Hewlett-Packard products and replacement parts can be
obtained from your HP Sales and Service Office or
authorized dealer.
Contents
1 About ProCurve Manager
Introduction . . . . . . . . . . . . . . . . . . . . . . . . . . . . . . . . . . . . . . . . . . . . . . . . . . 1-2
ProCurve Manager Features . . . . . . . . . . . . . . . . . . . . . . . . . . . . . . . . . . 1-3
ProCurve Manager Plus Features . . . . . . . . . . . . . . . . . . . . . . . . . . . . . . 1-4
Client/Server Architecture . . . . . . . . . . . . . . . . . . . . . . . . . . . . . . . . . . . . 1-6
PCM+ Optional Plug-in Modules . . . . . . . . . . . . . . . . . . . . . . . . . . . . . . . . 1-7
PCM and PCM+ Specifications . . . . . . . . . . . . . . . . . . . . . . . . . . . . . . . . . 1-8
Devices Supported . . . . . . . . . . . . . . . . . . . . . . . . . . . . . . . . . . . . . . . . . . 1-8
Operating Requirements . . . . . . . . . . . . . . . . . . . . . . . . . . . . . . . . . . . . . . 1-9
Learning to Use ProCurve Manager . . . . . . . . . . . . . . . . . . . . . . . . . . . 1-10
ProCurve Manager Support . . . . . . . . . . . . . . . . . . . . . . . . . . . . . . . . . . 1-10
2 Getting Started with ProCurve Manager
Adding PCM Remote Client Stations . . . . . . . . . . . . . . . . . . . . . . . . . . . 2-2
Configuring Client/Server Access Permissions . . . . . . . . . . . . . . . . . . . 2-2
Starting PCM Client . . . . . . . . . . . . . . . . . . . . . . . . . . . . . . . . . . . . . . . . . . . 2-5
ProCurve Manager Home . . . . . . . . . . . . . . . . . . . . . . . . . . . . . . . . . . . . . . 2-9
Network Management Home Window . . . . . . . . . . . . . . . . . . . . . . . . . 2-10
Using the Navigation Tree . . . . . . . . . . . . . . . . . . . . . . . . . . . . . . . . . . . 2-14
Viewing Device Information . . . . . . . . . . . . . . . . . . . . . . . . . . . . . . . . . . . 2-15
Reports and Floating Windows . . . . . . . . . . . . . . . . . . . . . . . . . . . . . . . 2-18
Network Maps . . . . . . . . . . . . . . . . . . . . . . . . . . . . . . . . . . . . . . . . . . . . . 2-18
Managing User Accounts . . . . . . . . . . . . . . . . . . . . . . . . . . . . . . . . . . . . . . 2-19
Changing Passwords . . . . . . . . . . . . . . . . . . . . . . . . . . . . . . . . . . . . . . . . 2-19
Adding User Accounts . . . . . . . . . . . . . . . . . . . . . . . . . . . . . . . . . . . . . . 2-19
Editing and Deleting User Accounts . . . . . . . . . . . . . . . . . . . . . . . . . . . 2-21
Using RADIUS Authentication . . . . . . . . . . . . . . . . . . . . . . . . . . . . . . . . 2-22
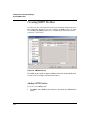
Creating SMTP Profiles . . . . . . . . . . . . . . . . . . . . . . . . . . . . . . . . . . . . . . . 2-24
Adding SMTP Profiles . . . . . . . . . . . . . . . . . . . . . . . . . . . . . . . . . . . . . . . 2-24
Modifying SMTP Profiles . . . . . . . . . . . . . . . . . . . . . . . . . . . . . . . . . . . . 2-25
Deleting SMTP Profiles . . . . . . . . . . . . . . . . . . . . . . . . . . . . . . . . . . . . . . 2-26
Configuring Automatic Updates for PCM . . . . . . . . . . . . . . . . . . . . . . 2-26
Using the Automatic Update Wizard . . . . . . . . . . . . . . . . . . . . . . . . . . . 2-28
Registering ProCurve Devices via PCM . . . . . . . . . . . . . . . . . . . . . . . . 2-31
Troubleshooting the PCM Application . . . . . . . . . . . . . . . . . . . . . . . . . 2-32
Using the PCM Server for Switch Web Help . . . . . . . . . . . . . . . . . . . . 2-35
iii
Contents
3 Discovering Devices
How Discovery Works . . . . . . . . . . . . . . . . . . . . . . . . . . . . . . . . . . . . . . . . . 3-2
Reviewing Discovery Data . . . . . . . . . . . . . . . . . . . . . . . . . . . . . . . . . . . . 3-5
Using Manual Discovery . . . . . . . . . . . . . . . . . . . . . . . . . . . . . . . . . . . . . . 3-6
Using Re-Discover Device . . . . . . . . . . . . . . . . . . . . . . . . . . . . . . . . . . . 3-12
Port Classification . . . . . . . . . . . . . . . . . . . . . . . . . . . . . . . . . . . . . . . . . . . 3-14
How Discovery Classifies Ports . . . . . . . . . . . . . . . . . . . . . . . . . . . . . . 3-15
Using the Find Node Feature . . . . . . . . . . . . . . . . . . . . . . . . . . . . . . . . . . 3-16
Using Node to Node Path Tracing . . . . . . . . . . . . . . . . . . . . . . . . . . . . . 3-18
Managing the Discovery Preferences . . . . . . . . . . . . . . . . . . . . . . . . . . 3-20
Global Discovery Preferences . . . . . . . . . . . . . . . . . . . . . . . . . . . . . . . . 3-20
Excluding or Deleting Devices from Discovery . . . . . . . . . . . . . . . . . 3-22
Scheduling Discovery Processes . . . . . . . . . . . . . . . . . . . . . . . . . . . . . . 3-27
Configuring Subnets for Discovery . . . . . . . . . . . . . . . . . . . . . . . . . . . . 3-31
Importing and Exporting Discovery Data . . . . . . . . . . . . . . . . . . . . . . 3-34
Importing and Exporting Subnets . . . . . . . . . . . . . . . . . . . . . . . . . . . . . 3-35
Subnets File Formats . . . . . . . . . . . . . . . . . . . . . . . . . . . . . . . . . . . . . . . 3-36
Importing and Exporting Device Files . . . . . . . . . . . . . . . . . . . . . . . . . 3-37
Device File Format . . . . . . . . . . . . . . . . . . . . . . . . . . . . . . . . . . . . . . . . . 3-37
Troubleshooting Discovery . . . . . . . . . . . . . . . . . . . . . . . . . . . . . . . . . . . 3-40
4 Using Network Maps
How Network Maps Work . . . . . . . . . . . . . . . . . . . . . . . . . . . . . . . . . . . . . . 4-2
Displaying Network Maps . . . . . . . . . . . . . . . . . . . . . . . . . . . . . . . . . . . . . . 4-3
Subnet and VLAN Maps . . . . . . . . . . . . . . . . . . . . . . . . . . . . . . . . . . . . . . 4-5
Map Layout Options . . . . . . . . . . . . . . . . . . . . . . . . . . . . . . . . . . . . . . . . . 4-6
Network Map Annotations . . . . . . . . . . . . . . . . . . . . . . . . . . . . . . . . . . . . 4-6
Network Map Legend . . . . . . . . . . . . . . . . . . . . . . . . . . . . . . . . . . . . . . . . 4-8
Using the Maps Toolbar Options . . . . . . . . . . . . . . . . . . . . . . . . . . . . . . 4-10
Viewing Network Device Information . . . . . . . . . . . . . . . . . . . . . . . . . 4-11
Using the Go To Map Feature . . . . . . . . . . . . . . . . . . . . . . . . . . . . . . . . 4-11
Using Background Images with Maps . . . . . . . . . . . . . . . . . . . . . . . . . 4-13
5 Using the Event Manager
Managing Events . . . . . . . . . . . . . . . . . . . . . . . . . . . . . . . . . . . . . . . . . . . . . . 5-2
Reviewing the Events Table . . . . . . . . . . . . . . . . . . . . . . . . . . . . . . . . . . . 5-3
Acknowledging Events . . . . . . . . . . . . . . . . . . . . . . . . . . . . . . . . . . . . . . . 5-6
Deleting Events . . . . . . . . . . . . . . . . . . . . . . . . . . . . . . . . . . . . . . . . . . . . . 5-6
Filtering the Events Display . . . . . . . . . . . . . . . . . . . . . . . . . . . . . . . . . . . 5-7
Viewing the Events Archive . . . . . . . . . . . . . . . . . . . . . . . . . . . . . . . . . . . 5-8
Setting Event Manager Preferences . . . . . . . . . . . . . . . . . . . . . . . . . . . 5-10
iv
Contents
Setting Event Archive Attributes . . . . . . . . . . . . . . . . . . . . . . . . . . . . . . 5-10
6 Managing Network Devices
Using Device Manager Tools . . . . . . . . . . . . . . . . . . . . . . . . . . . . . . . . . . . 6-2
Rules for Configuring Device Access with PCM . . . . . . . . . . . . . . . . . . 6-3
Configuring Trap Receivers . . . . . . . . . . . . . . . . . . . . . . . . . . . . . . . . . . . . 6-4
Adding Trap Receivers . . . . . . . . . . . . . . . . . . . . . . . . . . . . . . . . . . . . . . . 6-5
Modifying Trap Receivers . . . . . . . . . . . . . . . . . . . . . . . . . . . . . . . . . . . . 6-6
Deleting Trap Receivers . . . . . . . . . . . . . . . . . . . . . . . . . . . . . . . . . . . . . . 6-6
Configuring Authorized Managers . . . . . . . . . . . . . . . . . . . . . . . . . . . . . . 6-7
Adding Authorized Managers . . . . . . . . . . . . . . . . . . . . . . . . . . . . . . . . . . 6-8
Modifying Authorized Managers . . . . . . . . . . . . . . . . . . . . . . . . . . . . . . . 6-9
Deleting Authorized Managers . . . . . . . . . . . . . . . . . . . . . . . . . . . . . . . . 6-9
Configuring Friendly Port Names . . . . . . . . . . . . . . . . . . . . . . . . . . . . . 6-12
Configuring SNMP and CLI Access . . . . . . . . . . . . . . . . . . . . . . . . . . . . 6-13
Setting Communication Parameters in Devices . . . . . . . . . . . . . . . . . 6-14
Setting Communication Parameters in PCM . . . . . . . . . . . . . . . . . . . . 6-23
Modifying Community Names . . . . . . . . . . . . . . . . . . . . . . . . . . . . . . . . 6-33
Using Test Communication Parameters in PCM . . . . . . . . . . . . . . . . . 6-35
Troubleshooting Device Communication Problems . . . . . . . . . . . . . . 6-37
Using Global Device Access Preferences . . . . . . . . . . . . . . . . . . . . . . . 6-39
Setting Device Display Names . . . . . . . . . . . . . . . . . . . . . . . . . . . . . . . . 6-39
Setting CLI Preferences . . . . . . . . . . . . . . . . . . . . . . . . . . . . . . . . . . . . . 6-40
Setting SNMP Preferences . . . . . . . . . . . . . . . . . . . . . . . . . . . . . . . . . . . 6-42
Configuring SSH Keys . . . . . . . . . . . . . . . . . . . . . . . . . . . . . . . . . . . . . . . 6-44
Setting WebAgent Preferences . . . . . . . . . . . . . . . . . . . . . . . . . . . . . . . 6-45
Configuring RMON Alerts . . . . . . . . . . . . . . . . . . . . . . . . . . . . . . . . . . . . 6-47
Adding and Modifying RMON Alerts . . . . . . . . . . . . . . . . . . . . . . . . . . . 6-48
Deleting RMON Alerts . . . . . . . . . . . . . . . . . . . . . . . . . . . . . . . . . . . . . . 6-49
Other Device Management Tools . . . . . . . . . . . . . . . . . . . . . . . . . . . . . . 6-50
Device Logs . . . . . . . . . . . . . . . . . . . . . . . . . . . . . . . . . . . . . . . . . . . . . . . . . . 6-51
Using the Device Log . . . . . . . . . . . . . . . . . . . . . . . . . . . . . . . . . . . . . . . 6-51
Using Device Syslog . . . . . . . . . . . . . . . . . . . . . . . . . . . . . . . . . . . . . . . . 6-52
Using the Audit Log . . . . . . . . . . . . . . . . . . . . . . . . . . . . . . . . . . . . . . . . . 6-55
7 Device Access and Port Security Monitoring
Introduction . . . . . . . . . . . . . . . . . . . . . . . . . . . . . . . . . . . . . . . . . . . . . . . . . . 7-2
Device Access . . . . . . . . . . . . . . . . . . . . . . . . . . . . . . . . . . . . . . . . . . . . . . . . . 7-3
The Port List Tab . . . . . . . . . . . . . . . . . . . . . . . . . . . . . . . . . . . . . . . . . . . . . 7-5
The Port Status Tab . . . . . . . . . . . . . . . . . . . . . . . . . . . . . . . . . . . . . . . . . 7-5
Port Assignment Tab . . . . . . . . . . . . . . . . . . . . . . . . . . . . . . . . . . . . . . . . 7-11
v
Contents
The Port Access Tab . . . . . . . . . . . . . . . . . . . . . . . . . . . . . . . . . . . . . . . . 7-14
Using MAC Lockout . . . . . . . . . . . . . . . . . . . . . . . . . . . . . . . . . . . . . . . . 7-18
8 Monitoring Network Traffic
Introduction . . . . . . . . . . . . . . . . . . . . . . . . . . . . . . . . . . . . . . . . . . . . . . . . . . 8-2
How Traffic Monitoring Works . . . . . . . . . . . . . . . . . . . . . . . . . . . . . . . . 8-2
What’s new in 2.2 . . . . . . . . . . . . . . . . . . . . . . . . . . . . . . . . . . . . . . . . . . . . 8-3
Reviewing Traffic Data . . . . . . . . . . . . . . . . . . . . . . . . . . . . . . . . . . . . . . . . 8-4
Reading the Traffic Information Gauge . . . . . . . . . . . . . . . . . . . . . . . . . 8-4
Trend Graph Displays . . . . . . . . . . . . . . . . . . . . . . . . . . . . . . . . . . . . . . . . 8-5
Using the Traffic Tab . . . . . . . . . . . . . . . . . . . . . . . . . . . . . . . . . . . . . . . . 8-6
Reviewing Port Top Talkers . . . . . . . . . . . . . . . . . . . . . . . . . . . . . . . . . 8-11
Reviewing Per-Port Traffic Statistics . . . . . . . . . . . . . . . . . . . . . . . . . . 8-14
Configuring Traffic Monitor . . . . . . . . . . . . . . . . . . . . . . . . . . . . . . . . . . 8-18
Manual Configuration of Traffic Thresholds . . . . . . . . . . . . . . . . . . . . 8-19
Manual Configuration of Traffic Monitoring . . . . . . . . . . . . . . . . . . . . 8-21
Reviewing Traffic Monitor Events . . . . . . . . . . . . . . . . . . . . . . . . . . . . 8-24
Setting Traffic Monitor Preferences . . . . . . . . . . . . . . . . . . . . . . . . . . . 8-25
Troubleshooting Traffic Monitor . . . . . . . . . . . . . . . . . . . . . . . . . . . . . . 8-28
9 Managing Device Configurations
About Configuration Manager . . . . . . . . . . . . . . . . . . . . . . . . . . . . . . . . . 9-2
Performing Configuration Scans . . . . . . . . . . . . . . . . . . . . . . . . . . . . . . . 9-3
Manual Configuration Scanning . . . . . . . . . . . . . . . . . . . . . . . . . . . . . . . 9-3
Reviewing Device Configurations . . . . . . . . . . . . . . . . . . . . . . . . . . . . . . 9-8
Configurations Detail . . . . . . . . . . . . . . . . . . . . . . . . . . . . . . . . . . . . . . . . 9-9
Device Configuration History . . . . . . . . . . . . . . . . . . . . . . . . . . . . . . . . 9-10
Using Configuration Labels . . . . . . . . . . . . . . . . . . . . . . . . . . . . . . . . . . 9-11
Comparing Device Configurations . . . . . . . . . . . . . . . . . . . . . . . . . . . . . 9-12
Updating Device Configurations . . . . . . . . . . . . . . . . . . . . . . . . . . . . . . . 9-14
Using the Deploy Configuration Wizard . . . . . . . . . . . . . . . . . . . . . . . . 9-14
Using the CLI Wizard . . . . . . . . . . . . . . . . . . . . . . . . . . . . . . . . . . . . . . . . . 9-18
Using Configuration Templates . . . . . . . . . . . . . . . . . . . . . . . . . . . . . . . 9-24
Comparing Configuration Templates . . . . . . . . . . . . . . . . . . . . . . . . . . 9-25
Using IP Address Pools . . . . . . . . . . . . . . . . . . . . . . . . . . . . . . . . . . . . . 9-26
Using the Configuration Template Wizard . . . . . . . . . . . . . . . . . . . . . . 9-30
Applying Configuration Templates to Devices . . . . . . . . . . . . . . . . . . 9-35
Exporting Device Configurations . . . . . . . . . . . . . . . . . . . . . . . . . . . . . 9-41
Importing Device Configurations . . . . . . . . . . . . . . . . . . . . . . . . . . . . . . 9-43
Using the Software Licensing Feature . . . . . . . . . . . . . . . . . . . . . . . . . 9-47
Configuration Management Preferences . . . . . . . . . . . . . . . . . . . . . . . 9-53
vi
Contents
Setting Preferred Switch Software Versions . . . . . . . . . . . . . . . . . . . .
Network (Proxy) Settings . . . . . . . . . . . . . . . . . . . . . . . . . . . . . . . . . . .
Updating Switch Software . . . . . . . . . . . . . . . . . . . . . . . . . . . . . . . . . . . .
Scheduling Automatic Updates . . . . . . . . . . . . . . . . . . . . . . . . . . . . . . .
9-55
9-56
9-57
9-58
10 Working with Custom Groups
About Custom Groups . . . . . . . . . . . . . . . . . . . . . . . . . . . . . . . . . . . . . . . .
What’s new in PCM 2.2 . . . . . . . . . . . . . . . . . . . . . . . . . . . . . . . . . . . . . .
Rules of Custom Groups: . . . . . . . . . . . . . . . . . . . . . . . . . . . . . . . . . . . .
Creating Custom Groups . . . . . . . . . . . . . . . . . . . . . . . . . . . . . . . . . . . . .
Adding Devices to a Group . . . . . . . . . . . . . . . . . . . . . . . . . . . . . . . . . .
Modifying Groups . . . . . . . . . . . . . . . . . . . . . . . . . . . . . . . . . . . . . . . . . .
10-2
10-2
10-2
10-3
10-5
10-8
11 Using VLANs
About VLANs . . . . . . . . . . . . . . . . . . . . . . . . . . . . . . . . . . . . . . . . . . . . . . . . 11-2
Viewing VLAN Groups (Maps) . . . . . . . . . . . . . . . . . . . . . . . . . . . . . . . . . 11-3
Creating a VLAN . . . . . . . . . . . . . . . . . . . . . . . . . . . . . . . . . . . . . . . . . . . . . 11-6
Modifying VLANs . . . . . . . . . . . . . . . . . . . . . . . . . . . . . . . . . . . . . . . . . . . . . 11-9
Configuring Multiple IP Addresses for VLANs . . . . . . . . . . . . . . . . . . 11-9
Adding a Device to a VLAN . . . . . . . . . . . . . . . . . . . . . . . . . . . . . . . . . 11-10
Removing a Device from a VLAN . . . . . . . . . . . . . . . . . . . . . . . . . . . . 11-13
Making VLANs Static . . . . . . . . . . . . . . . . . . . . . . . . . . . . . . . . . . . . . . 11-14
Making a VLAN Primary . . . . . . . . . . . . . . . . . . . . . . . . . . . . . . . . . . . . 11-14
Deleting a VLAN . . . . . . . . . . . . . . . . . . . . . . . . . . . . . . . . . . . . . . . . . . 11-15
Modifying VLAN Support on a Device . . . . . . . . . . . . . . . . . . . . . . . . . 11-16
VLAN Support on Wireless Devices . . . . . . . . . . . . . . . . . . . . . . . . . . 11-17
Port Assignments on a Device . . . . . . . . . . . . . . . . . . . . . . . . . . . . . . . 11-21
Modifying Port Assignments . . . . . . . . . . . . . . . . . . . . . . . . . . . . . . . . 11-22
Modifying GVRP Port Properties . . . . . . . . . . . . . . . . . . . . . . . . . . . . 11-23
Using IGMP to Manage Multicast Traffic . . . . . . . . . . . . . . . . . . . . . 11-24
Enabling IGMP on VLANs . . . . . . . . . . . . . . . . . . . . . . . . . . . . . . . . . . 11-24
IGMP Settings for Routing Switches . . . . . . . . . . . . . . . . . . . . . . . . . . 11-28
12 Using Virus Throttle
Introduction . . . . . . . . . . . . . . . . . . . . . . . . . . . . . . . . . . . . . . . . . . . . . . . . .
General Operation of Virus Throttle . . . . . . . . . . . . . . . . . . . . . . . . . .
Filtering Options . . . . . . . . . . . . . . . . . . . . . . . . . . . . . . . . . . . . . . . . . . .
Sensitivity to Connection Rate Detection . . . . . . . . . . . . . . . . . . . . . .
Operating Notes . . . . . . . . . . . . . . . . . . . . . . . . . . . . . . . . . . . . . . . . . . . . . .
Terminology . . . . . . . . . . . . . . . . . . . . . . . . . . . . . . . . . . . . . . . . . . . . . . . . .
General Configuration Guidelines . . . . . . . . . . . . . . . . . . . . . . . . . . . . .
12-2
12-3
12-3
12-3
12-4
12-5
12-6
vii
Contents
For a network operating normally: . . . . . . . . . . . . . . . . . . . . . . . . . . . . 12-6
When the network appears to be under attack: . . . . . . . . . . . . . . . . . 12-7
VT Configuration in PCM . . . . . . . . . . . . . . . . . . . . . . . . . . . . . . . . . . . . . 12-8
VT Configuration for Blocked Hosts . . . . . . . . . . . . . . . . . . . . . . . . . . 12-11
Virus Throttle Log and Trap Messages . . . . . . . . . . . . . . . . . . . . . . . . 12-12
13 Using Policy Manager Features
How the Policy Manager Works . . . . . . . . . . . . . . . . . . . . . . . . . . . . . . . 13-2
Policy Configuration Overview . . . . . . . . . . . . . . . . . . . . . . . . . . . . . . . . 13-4
Configuring Policies . . . . . . . . . . . . . . . . . . . . . . . . . . . . . . . . . . . . . . . . . . 13-5
Enabling/Disabling Policies . . . . . . . . . . . . . . . . . . . . . . . . . . . . . . . . . 13-15
Manually Enforcing Policies . . . . . . . . . . . . . . . . . . . . . . . . . . . . . . . . 13-15
Policy History . . . . . . . . . . . . . . . . . . . . . . . . . . . . . . . . . . . . . . . . . . . . 13-16
Creating Times for Policies . . . . . . . . . . . . . . . . . . . . . . . . . . . . . . . . . 13-18
Custom Groups for Policies . . . . . . . . . . . . . . . . . . . . . . . . . . . . . . . . . . 13-21
Defining Alerts for Policies . . . . . . . . . . . . . . . . . . . . . . . . . . . . . . . . . . 13-21
Creating Event-based Alerts . . . . . . . . . . . . . . . . . . . . . . . . . . . . . . . . 13-21
Creating Schedule Driven Alerts . . . . . . . . . . . . . . . . . . . . . . . . . . . . . 13-26
Configuring Policy Actions . . . . . . . . . . . . . . . . . . . . . . . . . . . . . . . . . . . 13-30
Creating an Action . . . . . . . . . . . . . . . . . . . . . . . . . . . . . . . . . . . . . . . . . 13-30
Creating an Action: Multi-tab Configuration Process . . . . . . . . . . . . 13-33
Action Type Definitions . . . . . . . . . . . . . . . . . . . . . . . . . . . . . . . . . . . . . 13-40
Configuration Manager Action Types . . . . . . . . . . . . . . . . . . . . . . . . . 13-40
Device Manager Action Types . . . . . . . . . . . . . . . . . . . . . . . . . . . . . . . 13-41
Policy Manager Action Types . . . . . . . . . . . . . . . . . . . . . . . . . . . . . . . 13-43
Port Settings Action Types . . . . . . . . . . . . . . . . . . . . . . . . . . . . . . . . . . 13-44
Other Action Types . . . . . . . . . . . . . . . . . . . . . . . . . . . . . . . . . . . . . . . . 13-45
Setting Policy Management Preferences . . . . . . . . . . . . . . . . . . . . . . 13-47
14 Using the Network Consistency Analyzer
Introduction . . . . . . . . . . . . . . . . . . . . . . . . . . . . . . . . . . . . . . . . . . . . . . . . . 14-2
Creating a Network Analyzer Policy . . . . . . . . . . . . . . . . . . . . . . . . . . . 14-3
The Network Consistency Analysis Report . . . . . . . . . . . . . . . . . . . . . 14-9
15 Using Reports
Introduction . . . . . . . . . . . . . . . . . . . . . . . . . . . . . . . . . . . . . . . . . . . . . . . . . 15-2
Using the Reports Wizard . . . . . . . . . . . . . . . . . . . . . . . . . . . . . . . . . . . . 15-3
Setting the Report Heading (Report Preferences) . . . . . . . . . . . . . . . 15-6
Creating Report Policies . . . . . . . . . . . . . . . . . . . . . . . . . . . . . . . . . . . . . . 15-7
Configuring a Policy Action to Generate Reports . . . . . . . . . . . . . . . . 15-7
Definitions for Security Report Types . . . . . . . . . . . . . . . . . . . . . . . . 15-14
viii
Contents
16 Using the PCM+ Configurable Integration Platform
Introduction . . . . . . . . . . . . . . . . . . . . . . . . . . . . . . . . . . . . . . . . . . . . . . . . . 16-2
Supporting 3rd-Party Network Devices . . . . . . . . . . . . . . . . . . . . . . . . 16-4
Managing 3rd-Party Network Devices . . . . . . . . . . . . . . . . . . . . . . . . . 16-7
Adding User-defined Devices . . . . . . . . . . . . . . . . . . . . . . . . . . . . . . . . . 16-12
Creating a User-Defined Type . . . . . . . . . . . . . . . . . . . . . . . . . . . . . . . 16-12
Creating a User-defined Device Definition . . . . . . . . . . . . . . . . . . . . 16-14
Adding User-defined Actions . . . . . . . . . . . . . . . . . . . . . . . . . . . . . . . . . 16-16
Adding User-defined Triggers . . . . . . . . . . . . . . . . . . . . . . . . . . . . . . . . 16-18
Creating a User-Defined Trigger . . . . . . . . . . . . . . . . . . . . . . . . . . . . . 16-18
Decoding Third-Party Traps . . . . . . . . . . . . . . . . . . . . . . . . . . . . . . . . . . 16-26
Troubleshooting CIP . . . . . . . . . . . . . . . . . . . . . . . . . . . . . . . . . . . . . . . . 16-30
A Using ProCurve Manager for OV-NNM
Overview . . . . . . . . . . . . . . . . . . . . . . . . . . . . . . . . . . . . . . . . . . . . . . . . . . . . A-2
Additional References . . . . . . . . . . . . . . . . . . . . . . . . . . . . . . . . . . . . . . A-2
Starting PCMplus for OV-NNM . . . . . . . . . . . . . . . . . . . . . . . . . . . . . . . . A-3
Database User Management . . . . . . . . . . . . . . . . . . . . . . . . . . . . . . . . . A-5
Editing and Deleting Database User Accounts . . . . . . . . . . . . . . . . . . A-7
Working with PCM for OV-NNM . . . . . . . . . . . . . . . . . . . . . . . . . . . . . . . A-8
Device Discovery . . . . . . . . . . . . . . . . . . . . . . . . . . . . . . . . . . . . . . . . . . . A-8
Network Maps . . . . . . . . . . . . . . . . . . . . . . . . . . . . . . . . . . . . . . . . . . . . . A-9
Network Events and Alerts . . . . . . . . . . . . . . . . . . . . . . . . . . . . . . . . . . A-9
Network Device Management . . . . . . . . . . . . . . . . . . . . . . . . . . . . . . . . A-9
Network Traffic Monitor . . . . . . . . . . . . . . . . . . . . . . . . . . . . . . . . . . . A-10
Device Configuration Management . . . . . . . . . . . . . . . . . . . . . . . . . . . A-10
VLAN Management . . . . . . . . . . . . . . . . . . . . . . . . . . . . . . . . . . . . . . . . A-10
Configuration Policy Management . . . . . . . . . . . . . . . . . . . . . . . . . . . A-10
PCM-NNM Synchronization . . . . . . . . . . . . . . . . . . . . . . . . . . . . . . . . . . A-11
SNMP Data Synchronization . . . . . . . . . . . . . . . . . . . . . . . . . . . . . . . . A-11
Device List Synchronization . . . . . . . . . . . . . . . . . . . . . . . . . . . . . . . . A-11
Setting Synchronization Intervals . . . . . . . . . . . . . . . . . . . . . . . . . . . . A-12
B Using ProCurve Manager Mobility Module
Overview . . . . . . . . . . . . . . . . . . . . . . . . . . . . . . . . . . . . . . . . . . . . . . . . . . . . B-2
Mobility Manager Design . . . . . . . . . . . . . . . . . . . . . . . . . . . . . . . . . . . . B-3
Viewing Wireless Device Information . . . . . . . . . . . . . . . . . . . . . . . . . B-4
Monitoring Wireless Radios . . . . . . . . . . . . . . . . . . . . . . . . . . . . . . . . . . . B-6
Wireless Properties Tab . . . . . . . . . . . . . . . . . . . . . . . . . . . . . . . . . . . . B-10
Radio Ports Tab . . . . . . . . . . . . . . . . . . . . . . . . . . . . . . . . . . . . . . . . . . . B-11
Radio Management Functions . . . . . . . . . . . . . . . . . . . . . . . . . . . . . . . . B-13
ix
Contents
Viewing Neighbors . . . . . . . . . . . . . . . . . . . . . . . . . . . . . . . . . . . . . . . .
Viewing Unmanaged RF Neighbors . . . . . . . . . . . . . . . . . . . . . . . . . .
Viewing Station Links Information . . . . . . . . . . . . . . . . . . . . . . . . . . .
Monitoring and Configuring WLANs . . . . . . . . . . . . . . . . . . . . . . . . . .
Using the WLANs Tab . . . . . . . . . . . . . . . . . . . . . . . . . . . . . . . . . . . . . .
Setting Global Preferences for Mobility . . . . . . . . . . . . . . . . . . . . . .
B-20
B-23
B-24
B-27
B-27
B-39
C ProCurve Manager Events
PCM Trap Events . . . . . . . . . . . . . . . . . . . . . . . . . . . . . . . . . . . . . . . . . . . C-1
PCM Application Events . . . . . . . . . . . . . . . . . . . . . . . . . . . . . . . . . . . . . C-4
D Glossary
x
1
About ProCurve Manager
Chapter Contents
Introduction . . . . . . . . . . . . . . . . . . . . . 1-2
ProCurve Manager Features . . . . 1-3
ProCurve Manager Plus Features
1-4
Client/Server Architecture . . . . . . 1-6
PCM+ Optional Plug-in Modules . . . . 1-7
ProCurve PCM+ for HP OV-NNM
1-7
Mobility Manager . . . . . . . . . . . . . 1-7
Identity Driven Manager . . . . . . . 1-7
Mobility Manager . . . . . . . . . . . . . 1-7
PCM and PCM+ Specifications . . . . . . 1-8
Devices Supported . . . . . . . . . . . . . 1-8
Operating Requirements . . . . . . . 1-9
Learning to Use ProCurve Manager
1-10
ProCurve Manager Support . . . . . . . 1-10
1-1
About ProCurve Manager
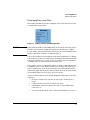
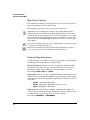
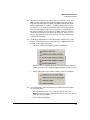
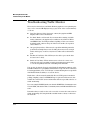
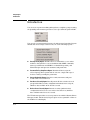
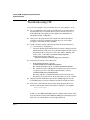
Introduction
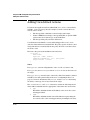
Introduction
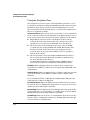
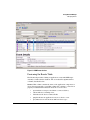
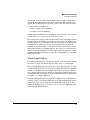
ProCurve Manager is a Windows-based network management solution for all
manageable ProCurve devices. It provides network: mapping and polling
capabilities, device auto-discovery and topology, tools for device configuration and management, monitoring network traffic, and alerts and troubleshooting information for ProCurve networks. PCM is included with all new
ProCurve managed network devices to provide manageability out of the box.
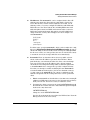
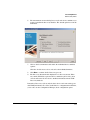
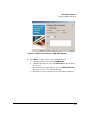
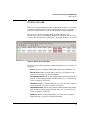
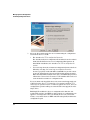
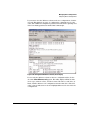
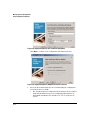
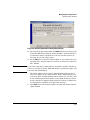
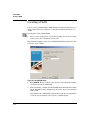
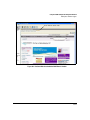
The graphical interface in ProCurve Manager Client provides at-a-glance
summaries of network activity, with drill-downs for more detailed device
information. It also provides a simplified interface for managing and configuring the network and devices, with access to device Web Agents and the
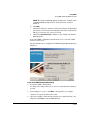
Command Line Interface (CLI).
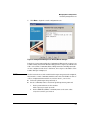
Figure 1-1. ProCurve Network Manager, Client Interface
1-2
About ProCurve Manager
Introduction
ProCurve Manager Features
ProCurve Manager (PCM) provides an effective solution for basic monitoring
and managing of network devices. PCM provides the core features of network
management systems: auto discovery, network mapping, device status monitoring, and network event management. It also provides easy access to configure devices via the web management page or telnet access. ProCurve
Manager (PCM) offers the basic functionality required by most IT organizations for network management, including
■
Discovery: Automatic discovery of ProCurve devices
■
Mapping: Physical, subnet and VLAN network topology views
■
Device management: Access to CLI and web interfaces
■
Status and troubleshooting: Summary status information on network
devices and end nodes
■
Events log: Application and device events display that can be filtered
and sorted.
Automatic device discovery: PCM is customized for fast discovery of all
ProCurve manageable network devices. You can also define specific IP subnets and VLANs on which to perform discovery.
Network Topology and Mapping: Automatically creates a map of discovered network devices. Maps are color-coded to reflect device status and can
be viewed at multiple levels (physical view, subnet view, or VLAN view). Link
status, and
Device management: Many device-focused tasks can be performed directly
by the software, or you can access web and command-line interfaces with the
click of a button to manage individual devices from inside the PCM Client.
Network status summary: Upon boot-up, a Network Status screen displays
high-level information on network devices, end nodes and events, all on one
screen. From here, you can drill down on any one of these areas to get specific
details.
Event monitoring and troubleshooting: An Events Summary displays
device and PCM application events and categorizes them by severity, making
it easier to track where bottlenecks and issues exist in the network. Event
details provides information on the problem, even down to the specific port.
1-3
About ProCurve Manager
Introduction
ProCurve Manager Plus Features
The ProCurve Manager Plus (PCM+) provides comprehensive monitoring and
management of ProCurve network devices and is also an extensible platform
that allows for the integration of other management tools. PCM+ provides for
on-demand or scheduled reporting about network inventory, security, and
performance. PCM policy and event based management capabilities allow
administrators to define policies which can automate notifications and
changes as desired. PCM+ configuration management logs all changes to
network devices, including who made the change and when. It includes
detailed traffic monitoring capabilities to identify network congestion issues
and identify dangerous network usage.
PCM+ provides network administrators a powerful toolset to effectively
configure, monitor, document and troubleshoot the network.
Network Traffic Analysis: The Traffic Manager helps you collect, measure,
and analyze data about enterprise network traffic. Traffic Manager allows you
to quickly identify issues, isolate problems, and optimize resource usage.
The Traffic Manager interface provides detailed information on traffic
throughout the network. Leveraging enhanced traffic analysis protocols such
as extended RMON (XRMON) and SFlow, you can define specific traffic
thresholds for monitoring overall traffic levels, ports with the highest traffic,
and the top users on a network port. For switches that support it, you can set
thresholds and monitor both ingress and egress traffic on ports.
VLAN Management: The VLAN Manager in PCM+ provides a single tool to
create, track, and manage VLANs on your network. The VLAN management
interface lets you create and assign VLANs across the entire network, without
having to access each network device individually. The VLAN Manager also
provides Wizards for creating VLANs, and modifying VLAN configuration,
significantly reducing the likelihood of error in working with VLANs.
Configuration Management: The Configuration Manager in PCM+ automatically tracks and logs configuration changes. Configurations can be compared over time or between two devices, with differences automatically
highlighted for you.
The Configuration Manager also provides the ability to create a Device configuration "Template" you can use to automatically configure new ProCurve
devices. A Policy can be created to automatically apply a Template to groups
of devices, thus simplifying configuration and management as your network
expands.
1-4
About ProCurve Manager
Introduction
Custom Group Management: The Custom Groups feature in PCM+ now
gives you the ability to create a hierarchy of folders, each of which can contain
devices or subfolders. You can create a Custom Group to match your network
"locations". In addition, Groups can be defined to a port granularity, meaning
that a single device may span multiple custom groups. Custom Groups become
nodes in the tree where other components can contribute functionality that
applies to other PCM device groups.
Automated Policy Management: With the Policy Manager you can create
proactive policies that can enable immediate network action without intervention.You can create a Policy to be launched when a specific event is
generated, or to take a pre-defined action at specific times. You can define the
time the policy will be in effect, what devices will be included in the policy,
and what actions will be taken when the policy is enacted.
Device Software Updates: The Software Version Update tool allows you to
automatically update devices and obtain new ProCurve device software
images from HP. You can also configure scheduled software version updates
across large groups of devices--when it is most convenient for your network.
Automatic Device Registration: You can set the PCM Registration and
Support preference (under Licensing and Support) to automatically register
ProCurve devices with My ProCurve.
SNMP V3 and SSH support: With PCM+ you can configure PCM to support
the use of SNMP V3 for device access and management, as well as the use of
SSH 1 or 2 for communications between PCM and individual ProCurve
devices.
Network Consistency Checking: With the Network Consistency:Network
Analyzer policy you can check for configuration consistency between device
connections in the network and generate a report to verify that the network
is configured correctly.
Configurable Integration Platform: You can use the CIP (Configurable
Integration Platform) to:
■
Create and manage "User-defined devices," that is other ProCurve or
non-ProCurve devices not found through auto-discovery.
■
Create user-defined "Actions" and "Triggers" to launch 3rd-party applications from within the PCM+ windows.
■
Receive and process traps, and log events for non-ProCurve network
devices
1-5
About ProCurve Manager
Introduction
Schedulable Reports: The Reports scheduler lets you create a policy to
schedule pre-defined PCM+ and IDM reports at regular intervals.
Import/Export Subnet and Device Files: The Import/Export tool lets you
import Device and Subnet data from a .CSV (comma delimited) file into PCM,
or export Device and Subnet data from PCM to a .CSV file, so you can use it
in other applications.
Client/Server Architecture
The ProCurve Manager software includes the PCM Server: A Windows host
containing the ProCurve Manager server application software which you
install on your primary network management device. The PCM Server is a
Java-based application that uses a data repository to store and retrieve collected network management information.
The Client component included with ProCurve Manager software is automatically installed on the PCM management server (host). The PCM Client can be
installed on other supported host (PCs) on the network, and used to access
PCM and PCM+ features. In addition, you can configure additional users for
a Client installation, with varying levels of access (Administrator, Operator,
User-view only), then alternate between logins.
You can install both the Server and the Client on multiple systems, providing
additional redundancy and user access for network management functions.
NOTE:
1-6
Once you install PCM or PCM+ Version 2.2, you can not revert to the previously
installed version. If you are uncertain if you want to upgrade to the 2.2 Version,
it is best to install it on a system that does not have any earlier versions of
PCM or PCM+ installed.
About ProCurve Manager
PCM+ Optional Plug-in Modules
PCM+ Optional Plug-in Modules
The following additional network management tools are bundled with the
PCM+ v2.2 CD. Each of these modules is available for a free 30 day trial;
thereafter, a separately purchased license key to is required enable the software features. Contact your HP representative or go to the ProCurve web site
(www.procurve.com) for purchasing details.
ProCurve PCM+ for HP OV-NNM
ProCurve Network Manager for OV-NT integrates with HP OpenView Network
Node Manager (version. 6.4, 6.41, 7.01 or 7.50) on Windows NT/2000 to provide
a robust solution for managing ProCurve network products in a multi-vendor
environment. ProCurve Network Management for OV-NNM is targeted for
medium sized enterprise networks (2K-5K nodes—up to 500 ProCurve
switches). It provides the PCM+ functionality from the NNM interface, including ProCurve device management, network traffic monitoring, scheduled
software updates, VLAN management, and policy management.
Mobility Manager
ProCurve Mobility Manager (MM) extends the PCM and PCM+ monitoring and
configuration tools for use with ProCurve Wireless Access Points (APs) and
Wireless Services Modules (WESM). The MM module can be used to monitor
all Radios within range of the managed ProCurve APs, define Trusted Radios,
and monitor and configure WLANs and SSIDs for Radios and Radio ports on
ProCurve managed wireless devices.
Identity Driven Manager
The Identity Driven Manager (IDM) module for ProCurve Manager Plus helps
automatically manages intelligent network access, applying security and performance settings to network infrastructure devices based on user, location
and time. It enables central definition of policies that are then enforced at the
edge by ProCurve devices. It increases network functionality and security, and
is built on an existing switch platform and RADIUS standards.
Network Immunity Manager
The ProCurve Network Immunity Manager (NIM) module works with PCM+
to gather, analyze, and interpret data from a security standpoint. Actions can
be taken based upon the Network Immunity data, using the PCM Plus device
management capabilities (Virus Throttle, ACLs, MAC Lockout) to mitigate or
resolve existing or potential security issues.
1-7
About ProCurve Manager
PCM and PCM+ Specifications
PCM and PCM+ Specifications
Devices Supported
PCM and PCM+ support network management functions on the following
ProCurve devices:
1-8
■
ProCurve Routers: 7000dl Series
■
ProCurve Routing Switches: 9408sl, 9315, 9308, 9304, 6308, 6304,
6208m-SX
■
ProCurve "Managed" Switches:
6400cl Series
6200yl Series
5400zl Series
5300xl Series (5304, 5308, 5348, 5372)
4200vl Series
4100gl Series (4104, 4108, 4124)
3500yl Series
3400cl Series
2900 Series
2810 and 2510 Series
2800 Series (2824, 2848)
2600 Series (2650, 2626, and 6108)
2500 Series (2512, 2524)
8000m, 4000m, 2424m, 2400m, 1600m
212M, 224M
■
ProCurve Wireless devices (AP 520wl, AP 420, WESM)
■
ProCurve 10/100 Hubs (12M, 24M)
About ProCurve Manager
PCM and PCM+ Specifications
Operating Requirements
For Small to Medium Networks (50 - 250 managed devices)*
Minimum Hardware System Configuration:
The following requirements assume use of a dedicated server for running
PCM/PCM+ as a standalone application:
• 2 GHz Intel Pentium IV or equivalent processor
• 1 GB RAM
• 10 GB free hard disk space
• 1 GB NIC
Recommended Hardware System Configuration:
The following requirements assume use of a dedicated server for running
PCM/PCM+, MM, NI, and IDM applications:
• 3 GHz Pentium IV or equivalent processor
• 2 GB RAM
• 40 GB free hard disk space
• 1 GB NIC
* Minimum is one 50-device starter license (J9057A). Maximum is one 50device starter license, and two 100-device incremental licenses (J9058A)
For Medium to Large Networks (250-2000 managed devices)*
Minimum Hardware System Configuration:
The following requirements assume use of a dedicated server for running
PCM/PCM+ as a standalone application:
• 3 GHz Pentium IV or equivalent processor
• 2 GB RAM
• 40 GB free hard disk space
• 1 GB NIC
Recommended Hardware System Configuration:
The following requirements assume use of a dedicated server for running
PCM/PCM+, MM, NI, and IDM applications:
• Intel Xeon or equivalent processor
• 4 GB RAM
• 80 GB free hard disk space
• 1 GB NIC
* Minimum is one 50-device starter license (J9057A) and two 100-device
incremental licenses (J9058A). Maximum is an Unlimited license (J9059A).
1-9
About ProCurve Manager
PCM and PCM+ Specifications
Supported Operating Systems:
• MS Windows 2003 Server
• MS Windows XP and XP Pro (Service Pack 1 or better)
• MS Windows 2000 (Server, Advanced Server, or Pro with Service Pack
4 or better)
NOTE:
The PCM Client interface is supported on MS Internet Explorer.
PCM and PCM+ 2.2, including the Client application, is not currently supported on Windows Vista operating system
Installing PCM+ on a server with full terminal services is not supported.
If the device views do not appear correctly in the PCM display, it may be that
you do not have the necessary JRE plug-in software. You need "J2SE Runtime
Environment 5.0 (JRE)" or newer installed on your system to display the
switch "live view" correctly. This software is available from Sun Microsystems
Web site (java.sun.com)
Learning to Use ProCurve Manager
The following information is available for learning about ProCurve Manager:
■
This Network Administrator’s Guide—helps you become familiar
with using the application tools for network management.
■
Online help information—provides information through Help buttons
in dialog boxes, and through a table of contents with hypertext links
to procedures and reference information.
■
ProCurve Manager, Getting Started Guide—provides details on
installing the application and licensing, and an overview of ProCurve
Manager functionality.
ProCurve Manager Support
Product support is available on the World Wide Web at www.procurve.com
Click on Technical Support. The information available at this site includes:
• Product Manuals
• Software updates
• Frequently asked questions (FAQs)
• Links to Additional Support information.
You can also call your HP Authorized Dealer or the nearest HP Sales and
Support Office.
1-10
2
Getting Started with ProCurve Manager
Chapter Contents
Chapter Adding PCM Remote Client Stations . . . . . . . 2-2
Configuring Client/Server Access Permissions . . . 2-2
Starting PCM Client . . . . . . . . . . . . . . . . . . . . . . . . . . . . 2-5
PCM+ License Registration . . . . . . . . . . . . . . . . . . . 2-6
ProCurve Manager Home . . . . . . . . . . . . . . . . . . . . . . . . 2-9
PCM Main Menu Functions . . . . . . . . . . . . . . . . . . 2-12
Global Toolbar Functions . . . . . . . . . . . . . . . . . . . . 2-12
Using the Right-Click Menu . . . . . . . . . . . . . . . . . 2-13
Using the Navigation Tree . . . . . . . . . . . . . . . . . . . 2-14
Viewing Device Information . . . . . . . . . . . . . . . . . . . . . 2-15
Reports and Floating Windows. . . . . . . . . . . . . . . . . . . 2-18
Network Maps . . . . . . . . . . . . . . . . . . . . . . . . . . . . . . . . 2-18
Managing User Accounts . . . . . . . . . . . . . . . . . . . . . . . 2-19
Changing Passwords. . . . . . . . . . . . . . . . . . . . . . . . 2-19
Adding User Accounts . . . . . . . . . . . . . . . . . . . . . . 2-19
Editing and Deleting User Accounts . . . . . . . . . . . 2-21
Using RADIUS Authentication . . . . . . . . . . . . . . . 2-22
Creating SMTP Profiles . . . . . . . . . . . . . . . . . . . . . . . . 2-24
Configuring Automatic Updates for PCM . . . . . . . . . . 2-26
Registering ProCurve Devices via PCM . . . . . . . . . . . 2-31
Troubleshooting the PCM Application . . . . . . . . . . . . . 2-32
Using the PCM Server for Switch Web Help . . . . . . . . 2-35
2-1
Getting Started with ProCurve Manager
Adding PCM Remote Client Stations
Adding PCM Remote Client Stations
When you install ProCurve Manager, both the server and client functions are
installed on the computer. You can also install the client function on any
number of other computers in your network that have network access to the
server computer.
Note
Before installing remote client stations, you must first configure the server to
allow access from each new client station. For more information, see “Configuring Client/Server Access Permissions” on the next page.
To install the client on another computer, simply start a web browser such as
Microsoft Internet Explorer on the computer. For the URL, type in the IP
address of the server computer followed by a colon and the port ID 8040. For
example, if the IP address of the server computer is 10.15.20.25, then you
would enter http://10.15.20.25:8040 on the web browser address line. The client
installation wizard will then guide you through the client installation.
Note
If you have multiple ProCurve Manager servers in the network, when you
install a remote client, you will prompted to select the server to which you
want the client to attach. This server will be used each time the client program
is launched. You can change the server that is being accessed by selecting the
“ProCurve Manager Server Discovery” option that was included when you
installed the client. From your computer’s Windows Start button, select
Programs, then ProCurve Manager, and then ProCurve Manager Server
Discovery.
Configuring Client/Server Access Permissions
The Situation: The ProCurve Manager server maintains a list of authorized
clients that are permitted to log into the server. By default, when the ProCurve
Manager server is installed, the only client allowed to log in is the client on
the same system as the server—that is, no remote clients are allowed.
The Solution: ProCurve Manager server has a configuration file that can easily
be configured to allow access to any set of actual or potential clients. There
are two ways that this file can be configured, depending on what you know
about the clients that need to connect.
2-2
Getting Started with ProCurve Manager
Adding PCM Remote Client Stations
■
IP addresses. The access.txt file can be configured with a list of IP
addresses specifying the clients that are authorized to log into the
server. The file may contain as many addresses as needed, one IP
address per line; or you may configure IP addresses with wildcards.
DNS names are also allowed in the file, including DNS names with
wildcards (this is useful for DHCP environments where a system’s
DNS name remains unchanged, although it’s actual IP address may
change from time to time). For example, below is an example of a
valid access.txt file:
15.255.124.84
15.29.37.*
10.*.*.*
*.rose.hp.com
system1.hp.com
To add an entry, open the access.txt file, which can be found in the config
directory (C:\Program Files\Hewlett-Packard\PNM\server\config). Be sure to
edit the file using a text-based editor such as Notepad or Wordpad. Edit
the file as necessary, one entry per line, then save it. It is NOT necessary
to restart the server; the changes will take effect immediately.
■
Passwords. There are situations where it is not possible to know
ahead of time what IP address a potential client will have. This is
particularly the case in situations where the client comes in through
some sort of VPN, where the IP address of the client is assigned
externally. To solve this problem it is possible to add client passwords
to the access.txt file that correspond to specially configured clients.
Note that even though you will be modifying the same access.txt file
as for the IP Address method (above), the two mechanisms can freely
co-exist—that is, the access.txt file can contain a combination of IP
addresses and passwords. To enable password access for a particular
client:
a.
Edit the access.txt file as described above, but instead of entering IP
addresses or DNS names, just enter a selected password (on a line by
itself). Save the file. It is not necessary to restart the server.
b.
You must also change an entry in the server\config\TyphoonServer.cfg
file. This file is a text file and can be edited with Notepad or Wordpad.
Look for the entry that reads
"AUTHENTICATION=10",
Change it to read "AUTHENTICATION=100"
Save the file and restart the server (listed as "HP ProCurve Network
Manager Server" in the services list).
2-3
Getting Started with ProCurve Manager
Adding PCM Remote Client Stations
c.
On the client (the client must already be installed), you must edit the
Riptide.cfg file. This file exists in the config directory of the client
(C:\Program Files\Hewlett-Packard\PNM\client). This file already has
several entries in it. You must add a line similar to the following:
PASSWORD=yourpassword
Do not change any of the other entries in the file, as they are necessary
for the correct operation of the client.
A sample Riptide.cfg file, once edited with the password “procurve”, would
look like this:
LEASE_LENGTH = 40000
TRACING_PROPERTY_KEY = CoreServices.Main
MANUFACTURER = Hewlett-Packard
SERVICE_NAME = Typhoon
COMPONENT_DB = config/Components.prp
TRACING_DBFILE = config/Loggers.prp
NETWORK_DELAY = 25000
VERBOSE = true
PASSWORD=procurve
d.
2-4
Once you have saved the Riptide.cfg file, start the client and enter
the address of the server in the “Direct address” field of the server
search dialog. The client should now connect successfully to the
server.
Getting Started with ProCurve Manager
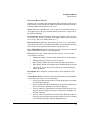
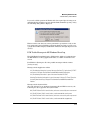
Starting PCM Client
Starting PCM Client
Once you have installed the PCM Server and Client, you are ready to start the
application. Select the ProCurve Manager option from the Windows Program
menu to launch the PCM Client.
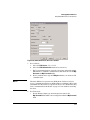
The PCM Client will start up and the Login dialog will be launched.
If you did not enter a Username or Password during install, type in the default
Username, Administrator, then Click Login to complete the login and startup.
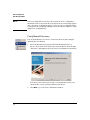
If you have installed the PCM Server on more than one system, the first time
you start up the PCM Client you will be prompted to select the primary server.
You will also see the "Search for Servers" dialog if the original primary server
is unreachable.
2-5
Getting Started with ProCurve Manager
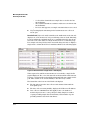
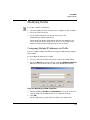
Starting PCM Client
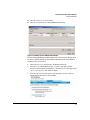
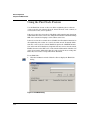
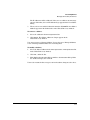
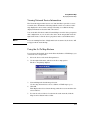
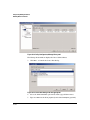
Figure 2-1. Search for servers
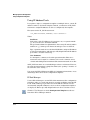
Select the server from the list on the right, then click Connect. The PCM Client
will launch the ProCurve Manager home window.
NOTE:
If you are unable to launch the PCM Client, check the IP Address in the
access.txt file in the config directory on the PCM Server. See “Troubleshooting the PCM Application” on page 2-32 for more information.
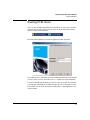
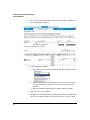
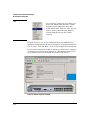
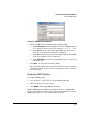
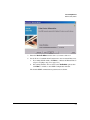
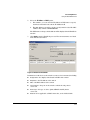
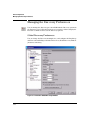
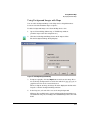
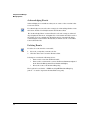
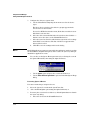
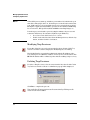
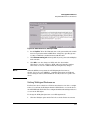
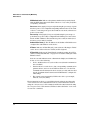
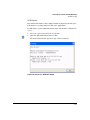
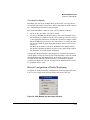
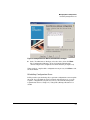
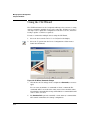
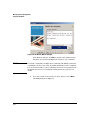
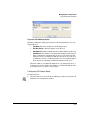
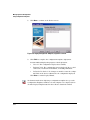
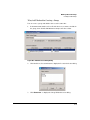
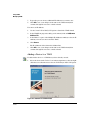
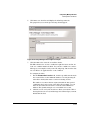
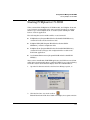
PCM+ License Registration
The ProCurve Manager installation CD includes a fully operable version of the
PCM application, and a 30 day trial version of the PCM+ application. Until you
have registered PCM and/or PCM+, an expiring license warning will be displayed each time you log in, similar to the following.
Figure 2-2. ProCurve Expiring License warning dialog
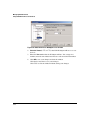
2-6
Getting Started with ProCurve Manager
Starting PCM Client
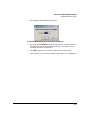
■
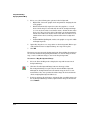
Click No, Continue to close the dialog.
■
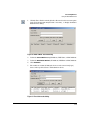
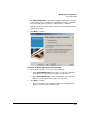
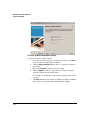
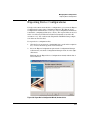
Click OK to launch the Licensing Administration dialog.
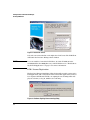
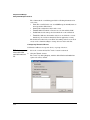
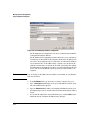
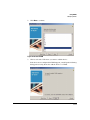
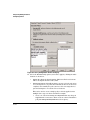
Figure 2-3. ProCurve License Administration dialog
The Licensing Administration dialog lists each of the ProCurve Management
Products currently installed, along with the Installation ID, Serial Number,
expiration date, and version.
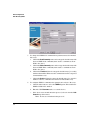
1.
Click Register to go to the ProCurve Registration Web site.
2.
If you have an existing My ProCurve account, log in with your My
ProCurve ID and password. Otherwise, click the REGISTER HERE button and
create a new user account and then sign in.
3.
Click the My Software tab and select the Management Software option to
display the Product Type selection links.
2-7
Getting Started with ProCurve Manager
Starting PCM Client
2-8
4.
Select the ProCurve Network Management Software link to display the
License Registration window.
5.
In the Registration window:
a.
Select the product to register from the Product Type pull-down menu..
b.
Enter the Registration ID, found on the back of the software CD case,
or on the registration card you received when you purchased the
software.
c.
Enter the Installation ID (from the Licensing window in PCM).
6.
Click the Generate License button.
7.
The window is refreshed and the registration information, including your
License key is displayed. The license key is also sent to you via e-mail.
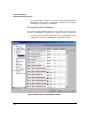
Getting Started with ProCurve Manager
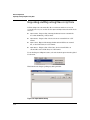
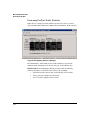
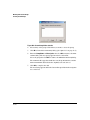
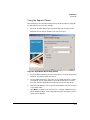
ProCurve Manager Home
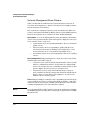
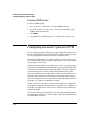
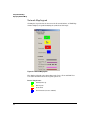
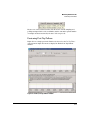
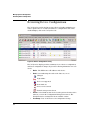
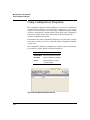
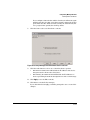
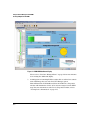
ProCurve Manager Home
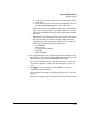
The Network Management Home display provides a quick view of your
network status in the Dashboard tab, along with a navigation tree and access
to menu and toolbar functions. You can resize the entire window, and/or resize
the panes (sub-windows) within the Network Management window frame.
Navigation Tree
PCM Menus
Tab Views
PCM Global Toolbar
PCM Window(s)
Figure 2-4. Home Page for ProCurve Manager
The basics of working within the PCM Client and the Network Management
Home window are described in the following sections. The function descriptions assume you are familiar with using the Windows graphical user interface.
2-9
Getting Started with ProCurve Manager
ProCurve Manager Home
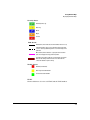
Network Management Home Window
When you first start the PCM Client, the Network Management Home node is
selected in the navigation tree, and the Dashboard tab view is displayed in the
Network Management Home window.
The Dashboard tab contains six separate panels, described below. Whenever
you have changed the PCM window display, just select Network Management
Home in the navigation tree to return to the home Dashboard display.
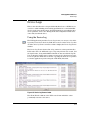
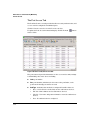
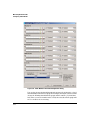
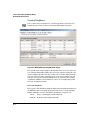
Device Status: A color-coded histogram (bar chart) that indicates the number
of devices by operational status. Click on this panel to display the Interconnect
Devices window, Devices List tab view.
•
Good means the device is responding normally to discovery and status
polling actions.
•
Warning means the device is responding to polling and discovery
actions, but needs attention. Warnings can be triggered by events
received from the device or by agents monitoring the device.
•
Unreachable means the device is not responding to discovery or polling
actions.
Device Configurations: This panel displays two charts. If you do not have PCM+
installed, this section will not appear.
•
Configuration History: A bar chart indicating the number of devices with
software configurations that have changed since the original PCM
device scan, and days since the configuration changed. Click on this
panel to display the Interconnect Devices, Configurations tab.
•
Preferred Switch Software: A pie chart indicating the percentage of
devices with the Preferred (current) switch software installed. Resting the pointer over the chart sections displays a "tool tip" for the
number of devices in that segment.
Events: This panel displays a summary of the outstanding (unacknowledged)
events (application or device events logged in PCM), including a count of the
number of critical, major, minor, warning, and information events. Clicking
on this panel displays the Events tab in the Home window.
NOTE:
2-10
If you are using PCM+ for HP OpenView Network Node Manager (OV-NNM)
the SNMP Traps panel is empty. All events (traps) are passed to the OV-NNM
Events browser.
Getting Started with ProCurve Manager
ProCurve Manager Home
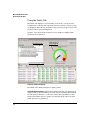
Top Traffic Overview: This panel uses a set of "LED" style indicators to provide
an overview of the current status of traffic on monitored ports. If you do not
have PCM+ installed, an "unavailable" message is displayed. The message "No
port selected" is displayed if you do not have any devices configured in the
Traffic Monitor. The color indicators used in the LEDs are:
•
Green: indicates traffic values are within normal range.
•
Yellow: indicates threshold values have exceeded the normal range,
but are not critical.
•
Red: indicates threshold values are in the critical range, and corrective action is needed.
Click any one of the Traffic segment items listed below the Summary line to
display bar charts for traffic Received (Rx) and Transmitted (Tx) on the selected
port.
A color-coded gauge indicates traffic measurements for the busiest segment
or port on the network, based on threshold settings. The color coding, green,
yellow, and red corresponds to the LED colors described above.
For additional information on using Traffic Monitoring, refer to Chapter
Chapter 8.
Inventory: This tab provides a count of the number of Network Devices, Endnodes, Managed Subnets, VLANs, and Groups currently ’discovered’ on the
network.
Discovery Status: This tab lists the status of the Device Discovery scans, running or idle.
If you are using the PCM+ for HP OpenView NNM module, end node information will not be available.
Click on the ProCurve Networking logo in the lower right of the home
Dashboard tab to launch a separate window, connected to the main ProCurve
Networking Web site. (If you are using a firewall, or have restricted external
access, this feature will not work)
PCM Status Bar
A Status bar at the bottom of the PCM window shows the status of the
Discovery process (on, off, or idle), and indicates the login account currently
in use. This status bar is visible at all times in the PCM client window frame.
2-11
Getting Started with ProCurve Manager
ProCurve Manager Home
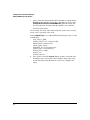
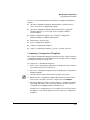
PCM Main Menu Functions
The application menus are available at all times
in the PCM main window frame. The functions
available in the menus will vary based on your
login account type, and whether you are using
PCM, PCM+, or other modules such as NI, PMM
and IDM. Disabled functions will be grayed out
in the menus. Use of these application menu
items are described later in this book under the
processes they support.
Global Toolbar Functions
The PCM global toolbar functions are available at all times in the PCM main
window.
A separate contextual (components) toolbar appears in many of the device
information and configuration tab displays. The toolbar functions vary based
on the context (tab) being displayed and the selected device type.
The functions available in the contextual toolbars also vary based on your
login account type, and whether you are using PCM or PCM+. Disabled
functions will be grayed out. The contextual toolbar options are described
under the processes they support. You can hover with the mouse to display
"tool tips" for each button (icon) in the toolbar.
Some toolbar icons have an arrow indicating there
is a list of additional related options you can use
Click the icon to display the tool menu options,
then select the option you want to use.
Configuration Manager Tools
Discovery Tools
VLAN Manager Tools
Device Access Tools
2-12
Getting Started with ProCurve Manager
ProCurve Manager Home
Using the Right-Click Menu
You can also access most of the "contextual" tools and commands provided
with PCM and PCM+ via the right-click menus. To use the right-click menu,
select an object (node) in the navigation tree on the left of the screen, then
right-click your mouse to display the menu. You can also access the right-click
menus when a device is selected in the Devices List and selected other Tab
views.
Items in the menu with an arrow ( ) indicates additional sub-menu items.
Click the arrow to display the sub-menu.
The options enabled in the right-click menu will vary based on the node you
have selected in the navigation tree, or item in the tab view, whether you are
using PCM or PCM+, and your login account type. Disabled functions will be
grayed out.
2-13
Getting Started with ProCurve Manager
ProCurve Manager Home
Using the Navigation Tree
The navigation tree in the left pane of the PCM window provides access to
network device information using a standard Windows file navigation system.
Information about groups of devices and each individual device or node
discovered on the network by PCM can be accessed from the navigation tree.
The tree is organized as follows:
Interconnect Devices: The top level of the tree provides access to information
about every device in the network. Clicking the node displays the Interconnect
Devices pane (and its associated tab views) in the right panel of the window.
■
Expanding the Interconnect Devices node displays the device Group
nodes (by ProCurve switch series) The device Group nodes can be
expanded to access tab views for individual device information.
■
The ProCurve Others node includes ProCurve devices that are SNMP
accessible, but do not support LLDP, CDP or FDP. This includes older
ProCurve network devices that are no longer supported, and/or
newer ProCurve devices for which PCM has not yet been updated
with the device drivers.
■
The ProCurve Wireless Services node displays individual wireless devices
discovered on the network. The features available are similar to those
for other (wired) ProCurve devices.
You must install the ProCurve Mobility Manager (PMM) module to
use the advanced wireless configuration and monitoring features.
End Nodes: This node displays the Devices List for devices found on the
network that are SNMP accessible, but do not support the bridge MIB, such
as HP printers.
Unknown Devices: This node displays the Devices List for other devices found
on the network that are not SNMP accessible, but have valid IP or IPX
addresses.
If you are using the PCM+ for HP OpenView NNM module, End Node and
Unknown Devices will not be displayed.
User-defined Devices: This node displays any User-defined devices found on
the network. Refer to “Adding User-defined Devices” on page 16-12 for more
details about user-defined devices in PCM+.
Network Map: This node displays the Network Map for the entire network. The
Network Map node can be expanded to access The Subnets and VLANs display
listings and maps for the managed subnets and VLANs.
Custom Groups: This node is used to access information about devices in any
Groups you have configured. See Chapter 10, “Working with Custom Groups”
for more details on creating Groups.
2-14
Getting Started with ProCurve Manager
Viewing Device Information
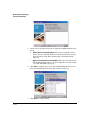
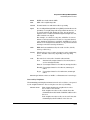
Viewing Device Information
There are several ways to view device information in ProCurve Manager.
■
Select Interconnect Devices in the navigation tree to display the Interconnect Devices window. Click the Devices List tab to the list of all
devices discovered on the network.
■
Click the Network Device Status panel in the Dashboard display to view
the Devices List in the Interconnect Devices window.
■
Select the Device Group (model) in the navigation tree to display the
Devices List for the Device Group. This will list all devices of that type
discovered on the network.
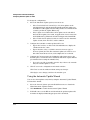
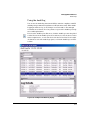
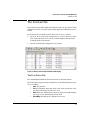
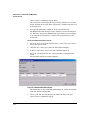
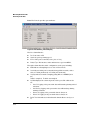
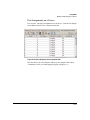
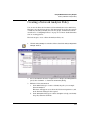
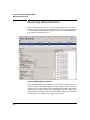
Figure 2-5. Example of the Devices List window
By default, the device lists are sorted on the first (left) column in descending
order (1-10, a-z). You can click the column heading to change the sort order
to ascending. You can also sort the data by any of the other columns contents
by clicking on the column heading. An arrow
indicates the sort column,
and the sort order.
Note:
If you are using PCM+, the Interconnect Devices window includes tabs for
Traffic, Policy Activity, Events, Configurations, and Device Access. If you are
using the Network Immunity module, a Security Activity tab is also available.
2-15
Getting Started with ProCurve Manager
Viewing Device Information
TIP:
You can remove colums you do not want to see
in the table. Simply right-click in the column
headers section to display the list of data
included in the table. Click any of the checked
items to deselect them. The table display is
refreshed and the selected data column
removed.
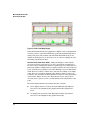
From the Devices List you can select individual devices and drill-down for
additional configuration details and to perform device management tasks. You
can use "Ctrl + click" and "Shift + click" to select multiple devices in the list.
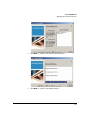
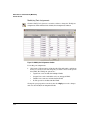
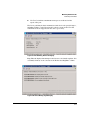
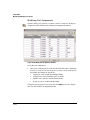
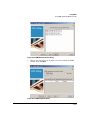
To review device Properties, double-click the device in the Devices List window,
or click the device node in the navigation tree. This displays the Interconnect
Device window, with the Dashboard tab view for the selected device.
Figure 2-6. Device Properties window
2-16
Getting Started with ProCurve Manager
Viewing Device Information
In addition to the general device properties, device name, IP Address, etc. the
bottom portion of the window provides a Static view of the switch. For the
models that provide WebAgent support, you can click on the switch image to
launch a separate window for the device’s WebAgent. .
Note:
If the device views do not appear in the display, it may be that you do not have
the necessary JRE plug-in software. You need "J2SE Runtime Environment 5.0
(JRE)" or newer installed on your system to display the switch "live view"
correctly. This software is available from Sun Microsystems Web site
(java.sun.com)
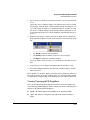
For the ProCurve devices that support it, you can display the Live view tab to
check current port status on the switch
Figure 2-7. Device Properties: Live view tab
Hovering over the port with the mouse will display text below the switch image
with the current port status and configuration. For example, as you mouseover port 8 the text might be:
Port 8 is enabled, connected, and configured to Auto
Click to select a port (or ports) in the Live view tab, then you can enable or
disable it. You can also click the link text (underlined) to launch a Telnet
session to the switch console to change port configuration.
2-17
Getting Started with ProCurve Manager
Viewing Device Information
Reports and Floating Windows
There are two icons that appear in the components toolbar of most PCM and
PCM+ windows.
If enabled, you can click the Report icon to display the PCM tab
contents in a separate report page layout window. You can print the
report, or save it to a file.
When enabled, you can click the "Floating Window" icon to copy the
current tab or window display to a separate floating window on your
desktop.
Network Maps
ProCurve Manager also provides a map feature you can use to view your
network topology.
■
To view a map of the entire network structure, select the Network
Map node in the navigation tree.
To view a subnet map, expand the Network Map node in the navigation tree
to display the Subnets and VLANs nodes.
■
Select the Subnets node to display the Subnets List view, then doubleclick on the subnet in the list.
■
Expand the Subnets node in the navigation tree to display the IP
address for each of the subnets in the managed network, then select
the IP address in the navigation tree.
For additional information on working with maps, see Chapter 4, “Using
Network Maps”.
2-18
Getting Started with ProCurve Manager
Managing User Accounts
Managing User Accounts
To manage login accounts for PCM, click the Manage Users icon in the PCM
toolbar, or select the Manage Users option from the File menu.
NOTE:
The Manage Users option is not available when using the PCM-NNM module.
Changing Passwords
Use the Change Password option in the PCM File menu to change the default
Administrator password or other login account passwords.
ProCurve Manager is configured with a default password for the Primary
Administrator account. If you did not modify the password during installation,
you should change this password after you first login.
The username requires at least two characters; the password at least three.
For both the username and password, the maximum number of characters is
30.
A user name must begin with a letter or an underscore. Passwords can begin
with any letter, underscore, or number. The password can contain lower and
upper case letters from A to Z, the underscore character ( _ ) and numbers
from 0 to 9. It cannot contain any spaces, or any other "special" characters
other than the underscore.
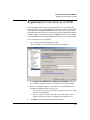
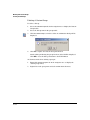
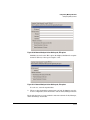
Adding User Accounts
The Manage Users function lets you add additional login accounts with access
permissions set by the profile under which the user is added. The four profiles
are:
■
Administrator: This profile has permissions to all features included in
ProCurve Manager, including adding and editing user accounts.
■
Operator: This profile has permission for all administrative functions
for configuring and monitoring devices, but does not have access to
the user account management functions.
■
Viewer: This profile has view-only access to all ProCurve Manager
functions except Manage Users. The user can access Device Manager,
Telnet, Connect to Web Agent, and Traffic from the right click menu,
but cannot connect to devices or make any configuration changes.
2-19
Getting Started with ProCurve Manager
Managing User Accounts
■
No Permissions: Same as Viewer functions, except no access to global
Preferences.
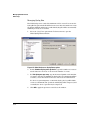
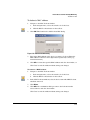
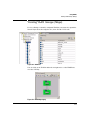
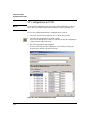
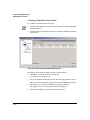
To add a new user:
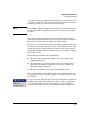
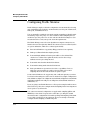
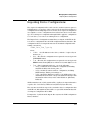
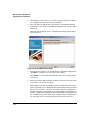
1.
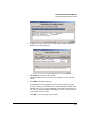
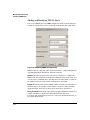
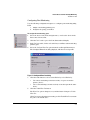
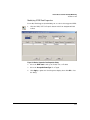
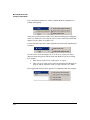
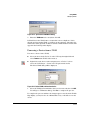
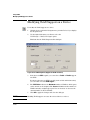
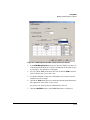
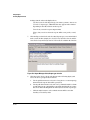
Click the Manage Users icon to launch the Manage Users window.
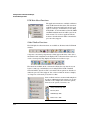
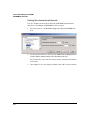
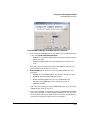
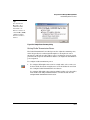
Figure 2-8. ProCurve Manage Users Wizard.
2.
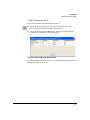
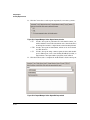
Click Add to Launch the Add User window.
Figure 2-9. Add User dialog
3.
2-20
Enter the Username and Password, then select the Profile for the account.
Getting Started with ProCurve Manager
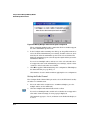
Managing User Accounts
Usernames must contain at least 2 characters, and cannot contain spaces.
Passwords should conform to standard Password requirements (i.e.,
contain a combination of numbers, upper and lower case characters, etc.)
4.
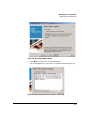
Select the Turn on Audit Logging option if you want device configuration
changes made by this user to be logged.
5.
Select the Allow to View Audit Log option if you want to permit the user to
view the audit log data. This lets the user launch the audit log browser.
6.
To authenticate this user's logins via a RADIUS server instead of PCM,
check the Use only RADIUS authentication checkbox. (The user will not be
allowed to login when RADIUS authentication is disabled.) See “Using
RADIUS Authentication” on page 2-22 for details.
Note:
If RADIUS authentication is configured to automatically add authenticated users to PCM and RADIUS authentication is disabled after a user is
added automatically, the user cannot login until this box is unchecked.
7.
To allow this user access to the PCM database from another application
such as HP OpenView Network Node Manager (OV-NNM), click the Grant
external DB access box.
The PCM database can be accessed directly using supported protocols.
(JDBC, ODBC, solsql, etc.)
8.
Click Ok. This will save the new user setup and close the Manage User
Wizard.
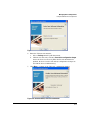
Editing and Deleting User Accounts
Only Administrators can add, edit or delete users from the ProCurve application. To edit a user account:
1.
Select the account in the Manage Users window to enable the Edit and
Delete option.
2.
Select the Edit option to open the Edit Users window. It contains the same
parameters as defined in the Add Users window.
3.
Edit the user account parameters as desired, then click Ok.
To delete a user account,
1.
Select the account in the Manage Users window to enable the Edit and
Delete options.
2.
Click Delete.
2-21
Getting Started with ProCurve Manager
Managing User Accounts
Using RADIUS Authentication
If you use RADIUS Authentication on your network, you can configure PCM
user accounts to use RADIUS as the primary user authentication method.
When RADIUS authentication is enabled in PCM, the user’s login credentials
are passed from PCM to the RADIUS server for authentication. Upon successful user-authentication by the RADIUS server, PCM assigns the user profile
and starts the PCM session for the user. If RADIUS does not authenticate the
user, the user is denied access to PCM.
To configure PCM to use RADIUS Authentication, first make sure that the PCM
server is configured as a client, capable of sending access request messages,
to the RADIUS server. Next, select the User Authentication option in Preferences
menu. This launches the Global: User Authentication window.
Figure 2-10. Global Preferences, User Authentication window
To enable RADIUS Authentication:
2-22
1.
Click to select Use Radius Authentication
2.
Configure the RADIUS server(s) by entering the IP Address of the Server,
the Secret Key used to communicate with the server, and Port number
(TCP/UDP) to connect to.
Getting Started with ProCurve Manager
Managing User Accounts
You can configure up to three RADIUS servers. PCM will try Server 1 first,
and if it is unavailable, it will try Server 2. If server 2 is unavailable, PCM
will try Server 3. If none of the configured RADIUS servers is available,
PCM will use its own (local) authentication (user name and password).
3.
Click the radio button to select the Authentication type, PAP or CHAP, that
will be used to pass the username and password in the access request
message.
4.
To automatically add RADIUS Authenticated users to PCM, click to select
the If authenticated users don’t exist in PCM, add as... option, then select the
PCM user profile (Viewer or Operator) to apply to automatically added users.
5.
Click to select the Use local authentication when no RADIUS servers available
option to allow PCM users access in the event the RADIUS servers are
down or the connection is lost.
6.
Click OK to complete the configuration and exit the window.
Click Cancel to exit the window without saving the configuration.
Click Apply to save the configuration and keep the window open.
2-23
Getting Started with ProCurve Manager
Creating SMTP Profiles
Creating SMTP Profiles
In order to use the e-mail option for Policy Action (Alerts) notifications or for
Misconfiguration Reports you need to configure an SMTP profile to be used
for e-mailing. The SMTP profiles are accessed from the Preferences menu.
{Preferences ->SMTP Profiles}
Figure 2-11. SMTP Profiles list
The SMTP Profiles window displays SMTP profiles that identify SMTP mail
servers used for sending e-mail alert notifications.
Adding SMTP Profiles
To create a new SMTP profile:
1.
2-24
Click New... in the SMTP Profiles window to launch the New SMTP Profile
dialog.
Getting Started with ProCurve Manager
Creating SMTP Profiles
Figure 2-12. SMTP Profile configuration
2.
3.
Enter the SMTP Profile information in the fields provided:
a.
In the Profile name field, enter a unique name for the SMTP profile: up
to 35 characters, but not the special characters \ / ) ( * ? | : < > or #.
b.
In the Server field, type the name of the SMTP server, from 1 to 35
characters. Note that this field will not be validated.
c.
In the Port field, type the port on the server that will be used for SMTP.
It can be any number between 1 and 65353.
d.
In the Reply address field, type the email address (up to 35 characters
with no spaces).
Click OK to save the profile and exit the dialog.
The system will verify that there is an entry in the Server (name) field, and
that the Port is valid. If either of these conditions is not met, you will get
an error message.
Modifying SMTP Profiles
To modify an SMTP profile:
1.
Go to Preferences -> SMTP Profiles to view the SMTP profiles list.
2.
Select the profile you want to change.
3.
Click Modify to launch the SMTP Profile dialog.
Edit the SMTP profile information as described above for "Adding SMTP
Profiles". The difference is that the data entry fields will display the current
SMTP settings, which you can override with new entries.
2-25
Getting Started with ProCurve Manager
Configuring Automatic Updates for PCM
Deleting SMTP Profiles
To delete an SMTP profile:
1.
Go to Preferences -> SMTP Profiles to view the SMTP profiles list.
2.
Select the profile you want to remove. You can use Ctrl+shift to select
multiple entries from the list.
3.
Click Delete.
4.
Click Yes in the confirmation pop-up to complete the delete process.
Configuring Automatic Updates for PCM
You can configure PCM to automatically check for application updates on the
ProCurve Web. PCM updates can include bug fixes, support for new ProCurve
devices, and support for new ProCurve device software releases.
The default configuration is set to "Notify if updates are available," with a recurrence schedule that checks for updates on the first day of each week and then
logs an update event in PCM.
During an automatic update, if any PCM services need to be stopped to apply
the updates, any PCM clients are notified with a "pop-up message" asking users
to disconnect from the PCM server. The Auto-update component waits for a
pre-defined time for the clients to shutdown then shuts down the PCM
services. It installs the downloaded updates, and then restarts PCM services.
An update_history.prp file is created on the server with the update status
information. The Auto-Update module reads this [prp] file when it starts up
and sends an application event to the PCM event log indicating the status of
the update, e.g., "update was applied successfully."
If none of the services need to be stopped for the updates to be applied, all
the updates are applied by the Auto Update component. Upon completion of
the updates, an application event is sent to the PCM event log indicating the
status of the update.
To review the Automatic Update History, select the Update History option in
Global Preferences [Preferences->Automatic Updates->Update History]. This launches
the Update History window.
2-26
Getting Started with ProCurve Manager
Configuring Automatic Updates for PCM
The Automatic Update History window displays a table containing the following PCM software update history details for the current version:
•
Date—The date the update was released
•
Update ID—The unique ID used to identify the update
•
Updated by—The PCM user account name if a user runs the auto
update wizard to install updates, OR
"--" if the updates were automatically applied by the PCM server
•
Update mode— Identifies how the update was applied:
– MANUAL - Update was applied by the user with the Automatic
Update Wizard.
– AUTOMATIC - Update was applied automatically by the system.
To configure the Automatic Update feature, select the Automatic Updates option
in Global Preferences [Preferences->Automatic Updates]. This launches the Global
Automatic Updates window.
Figure 2-13. Global Preferences: Automatic (PCM) Updates window
2-27
Getting Started with ProCurve Manager
Configuring Automatic Updates for PCM
To change the configuration:
1.
2.
3.
Select the Automatic Update option you want to use
•
Select Download and install automatically to check for updates at the
scheduled interval, and automatically install applicable updates on
the PCM server. The update function will generate an event in the PCM
events log, and in the Update History log.
•
Notify if updates are available will check for updates at the scheduled
interval. When updates are found, an application event is entered in
the PCM Events log. This is the default setting provided with PCM.
•
Select Disable automatic updates if you do not want to use the Automatic
Update feature, then click OK to exit the window.
Configure the Schedule for when updates will occur.
•
Type in the Start date, or click on the Calendar button to display the
calendar and select a date.
•
Type in the time of day, or click the arrows to increase (up) or
decrease (down) the time. For automatic updates, it is best to set a
time when network use is low, such as night time or weekends.
Configure the Recurrence pattern by clicking the radio button next to the
desired option, or click Check Now to launch the Automatic Update Wizard
(see instructions for using the wizard below)
•
4.
If you select weekly or monthly, enter the day of the week, or month
that you want the update to occur.
Click OK to save the configuration and exit the window.
Click Cancel to exit the window without saving any changes
Click Apply to save changes, and leave the window open.
Using the Automatic Update Wizard
You can check for updates at any time by using the Automatic Update Wizard.
To launch the wizard:
2-28
1.
Select the Automatic Updates option in Global Preferences to launch the
Global Automatic Updates window.
2.
Click Check now to launch the Automatic Update Wizard.
3.
PCM will connect to the HP site and download the product updates file.
A window is displayed indicating progress of the download.
Getting Started with ProCurve Manager
Configuring Automatic Updates for PCM
4.
If updates are found, a list of the available updates will be displayed,
similar to the following image.
5.
The Install option is selected by default.
Click the Install checkbox to deselect any updates you do not want to
install.
6.
Click Next to install the update(s).
If installing the selected updates requires a restart of PCM, a pop-up
message notifies you that PCM services will be shutdown and the client
will disconnect. If you are not running the client on the same machine as
the server, a warning is displayed informing you that you may not know
if the update was successful.
Click OK to close the pop-ups and continue.
2-29
Getting Started with ProCurve Manager
Configuring Automatic Updates for PCM
A separate program is launched by the server component that shuts down
the PCM services, installs the updates, and restarts the services. Progress
information is displayed as the updates are installed. A message displays
after the services are restarted, indicating the update results.
An update_history.prp file is created on the server with the update result
information. This file is read by the auto-update component at startup to
get the [PCM] Update history information.
If the update to be installed does not require a restart of the PCM services,
it is installed automatically with no warning messages. The wizard displays progress information for the update installation. When the process
is complete, PCM displays a status message indicating the success or
failure of the update process.
Once the update is installed, the update_history.prp file is updated with
an entry indicating the "update was applied successfully."
7.
2-30
If no updates are found, the wizard indicates there are no updates available. Click Cancel or Close to exit the wizard.
Getting Started with ProCurve Manager
Registering ProCurve Devices via PCM
Registering ProCurve Devices via PCM
The PCM application includes a feature that allows you to automatically
register ProCurve devices with HP support when they are discovered by PCM.
The Registration and Support window is used to select if you want to automatically register ProCurve devices that were detected as unregistered during
the Discovery process. Note that if you use HTTPS or Web Proxies, you must
set the SOCKS proxy in the Network Settings Preferences to use this feature.
To use automatic device registration:
1.
Go to the Registration and Support window.
[Tools->Preferences->Licensing and Support->Registration and Support]
2.
In the MyProCurve Member ID and MyProCurve password fields, type
the username and password you received when you registered PCM.
3.
Select the registration option to use with devices that PCM detects as
unregistered during the Discovery process:
4.
•
Use Automatically register my network devices at My ProCurve account to register devices automatically.
•
Use Do not register new devices if you do not want ProCurve devices
registered, and never want to be prompted to register devices.
Click OK to save the settings and close the window.
2-31
Getting Started with ProCurve Manager
Troubleshooting the PCM Application
Troubleshooting the PCM Application
PCM Services
If you are having trouble starting the PCM Client, or the application is not
responding to commands, check to see that the PCM services are running on
the PCM management server.
You may need to use the Windows Administrative tools option to restart one
or more of the following services:
2-32
•
HP ProCurve Datastore
•
HP ProCurve Network Manager Server
•
HP ProCurve Traffic Launch Service
Getting Started with ProCurve Manager
Troubleshooting the PCM Application
PCM Client Permissions
If you can start the PCM Client, but there is no data, you may need to set the
permissions for the client.
There are two files associated with ProCurve Manager client/server security.
■
The access.txt file is located on the ProCurve Manager management
server under the install directory (/Program Files/Hewlett-Packard/
PNM/server/config). This file contains a list of all IP addresses that
are authorized to connect to the management server.
There are situations where it is not possible to know ahead of time what
IP address a potential client will have. This is particularly the case in
situations where the client comes in through a VPN, where the IP address
of the client is assigned externally. To solve this problem it is possible to
add client passwords to the access.txt file that correspond to specially
configured clients. The file can contain a combination of IP addresses and
passwords.
For example, below is an example of a valid access.txt file:
15.255.124.84
15.29.37.*
10.*.*.*
*.rose.hp.com
system1.hp.com
■
The password in the access.txt file must match the password entered
in the riptide.cfg file located on the PCM client under the PCM install
directory (/Program Files/Hewlett-Packard/PNM/client).
To enable password access for a particular client:
1.
First you need to you must change an entry in the
server\config\TyphoonServer.cfg file.
This file is a text file and can be edited with Notepad or Wordpad. Look
for the entry that reads “AUTHENTICATION=10”, and change it to read
“AUTHENTICATION=100”. Save the file and restart the server (listed as “HP
ProCurve Network Manager Server” in the services list).
2.
Edit the access.txt file as described above, but instead of entering an IP
address, just enter the selected password (on a line by itself). Save the
file. It is not necessary to restart the server. For example, if we set the
password to "procurve":
procurve
*.rose.hp.com
system1.hp.com
2-33
Getting Started with ProCurve Manager
Troubleshooting the PCM Application
3.
On the client (the client must already be installed), you must edit the
riptide.cfg file. This file already has several entries in it. You must add a
line similar to the following:
PASSWORD = your password
Do not change any of the other entries in the file, as they are necessary
for the correct operation of the client.
A sample Riptide.cfg file, once edited with the password "procurve", would
look like this:
LEASE_LENGTH = 40000
TRACING_PROPERTY_KEY = CoreServices.Main
MANUFACTURER = Hewlett-Packard
SERVICE_NAME = Typhoon
COMPONENT_DB = config/Components.prp
TRACING_DBFILE = config/Loggers.prp
NETWORK_DELAY = 25000
VERBOSE = true
PASSWORD = procurve
Once you have saved the riptide.cfg file, start the PCM Client and enter (select)
the address of the PCM Server in the Direct address field of the "Search for
Servers" dialog. The client should now connect successfully to the server.
PCM and Firewalls
If a PCM remote client attempts to connect to a PCM server, and the PCM
server has a firewall turned on, it is possible that the PCM remote client will
come up with the message "no contexts defined" and a grey screen with no data.
The firewall on the PCM server prevents the PCM remote client from getting
the necessary connection and files from the PCM server.
You must disable the firewall on the PCM server, or configure the firewall to
allow the PCM remote client and the PCM server to connect.
2-34
Getting Started with ProCurve Manager
Troubleshooting the PCM Application
Using the PCM Server for Switch Web Help
For ProCurve devices that support the "Web Help" feature, you can use the
PCM server to host the switch help files for devices that do not have HTTP
access to the HP Support Web site.
1.
Go to the HP Support web site to get the Device Help files:
http://www.hp.com//rnd/device_help/
2.
Copy the Web help files to the PCM server, under:
C:\\program files\hewlett-packard\pnm\server\
webroot\rnd\device_help\help\hpwnd\webhelp
3.
Add an entry, or edit the existing entry in the Discovery portion of the
global properties (globalprops.prp) in PCM to redirect the switches to the
help files on the PCM server. For example:
Global {
TempDir=data/temp
...
Discovery{
...
...
DeviceHelpUrlRedirect=http://15.29.37.12:8040/rnd/
device_help
...
}
}
You will enter the IP address for your PCM server. 8040 is the standard
port number to use.
4.
NOTE:
Restart the Discovery process for the change to be applied. Refer to
“Troubleshooting Discovery” on page 3-40 for details.
Changing of Discovery's Global properties file will redirect the Device Help
URL for all devices.
If you just want to change the DeviceHelpUrl for a particular device, then go to
the Configuration tab on the Web UI for that device and select the "Support/Mgmt
URL" button. Edit the entry in the "Management Server URL" field for the device
to point to the PCM server; for example:
http://15.29.37.12:8040/rnd/device_help
2-35
Getting Started with ProCurve Manager
Troubleshooting the PCM Application
2-36
3
Discovering Devices
Chapter Contents
How Discovery Works. . . . . . . . . . . . . . . . . . . . . . . . . . . 3-2
Reviewing Discovery Data . . . . . . . . . . . . . . . . . . . . 3-5
Using Manual Discovery . . . . . . . . . . . . . . . . . . . . . 3-6
Using Re-Discover Device . . . . . . . . . . . . . . . . . . . 3-12
Port Classification . . . . . . . . . . . . . . . . . . . . . . . . . . . . 3-14
How Discovery Classifies Ports . . . . . . . . . . . . . . 3-15
Using the Find Node Feature . . . . . . . . . . . . . . . . . . . 3-16
Using Node to Node Path Tracing . . . . . . . . . . . . . 3-18
Managing the Discovery Preferences . . . . . . . . . . . . . 3-20
Global Discovery Preferences . . . . . . . . . . . . . . . . 3-20
Excluding or Deleting Devices from Discovery. . . 3-22
Re-Classifying Unknown Devices . . . . . . . . . . . . . 3-25
Scheduling Discovery Processes . . . . . . . . . . . . . . 3-27
Configuring Subnets for Discovery . . . . . . . . . . . . 3-31
Adding and Modifying Subnets . . . . . . . . . . . . . . . 3-32
Importing and Exporting Discovery Data . . . . . . . . . . 3-34
Importing and Exporting Subnets. . . . . . . . . . . . . 3-35
Subnets File Formats. . . . . . . . . . . . . . . . . . . . . . . 3-36
Importing and Exporting Device Files . . . . . . . . . 3-37
Device File Format . . . . . . . . . . . . . . . . . . . . . . . . . 3-37
Troubleshooting Discovery . . . . . . . . . . . . . . . . . . . . . . 3-40
3-1
Discovering Devices
How Discovery Works
How Discovery Works
Discovery is the process used by ProCurve Manager to automatically find all
the devices in the managed subnets and determine the devices' relationships
to each other (topology). The discovered devices are displayed in the Devices
List and Network Maps, and added to the device information database on the
PCM server. ProCurve Manager can discover any devices within the managed
network (subnet), that are SNMP accessible (with valid read community
names). Such devices include:
■
HP's ProCurve series of manageable switches and routers that
support LLDP (Link Layer Discovery Protocol 802.1AB), CDP (readonly), or FDP.
■
Other ProCurve devices that are SNMP accessible, but do not support
LLDP, CDP, or FDP.
■
Other HP network devices that are SNMP accessible and support the
bridge MIB.
■
Devices on the network (end nodes) that are SNMP accessible, but
do not support the bridge MIB, such as HP printers.
■
Other devices on the network with valid IP addresses.
Discovery is a resource-intensive process and may take some time. It uses a
multi-phase process, working from the "starting device" IP address, and using
the SNMP read community name specified during the installation process, to
find and map devices in the network.
■
Neighbor discovery is the fastest discovery process, where PCM looks
for all LLDP, CDP, and FDP enabled devices in the neighbor tables on
the device.
Link Layer Discovery Protocol (LLDP) and Cisco Discovery Protocol
(CDP) are layer 2 protocols implemented by various switches for the
purpose of informing their neighbors of their existence and connection,
and to learn about their own immediate neighbors. Once switches have
learned of the connections to their neighbors, they make that information
available to management applications that choose to interrogate the
switch appropriately. (FDP, similar to CDP, is available on the 9300 devices
with software version 7.6 or later.)
■
3-2
The second discover process is ARP discovery, which looks for other
active network devices in ARP cache on discovered switches and on
the devices found in the discovered switch neighbor table. For a more
Discovering Devices
How Discovery Works
complete discussion of ARP, refer to the Advanced Traffic Management
Guide or the Management and Configuration Guide for your ProCurve
switch.
■
Device Attributes discovery is another discovery process that uses
SNMP to collect information related to device port (like port status,
port speed, port security, port authType etc.) and VLANs configured
on each device found on the network. It also creates network, subnet
and VLAN topology
■
The Ping Sweep discovery process is used to locate all devices
connected to the network. This process takes the longest time to run
because it will ping all addresses in a subnet and is subject to timeout delays.
From the starting device, specified during installation, Discovery propagates
through each of the devices listed in the neighbors table and for each device
IP the ARP discovery look for active network devices. At the same time, the
Ping Sweep discovery process starts looking for active network devices in the
Managed subnet. The difference between PCM 2.1 and PCM 2.2 is that all
discovery processes can run simultaneously.
For each device found in the network using LLDP, ARP, and Ping sweep,
Discovery performs the following process:
NOTE:
■
Log an entry to the Device Log indicated the device has been created
(an entry added to the PCM database)
■
If AutoTrap is configured, add the management station as a trap
receiver on the device, and log an entry to the Device Log and Events
monitor table indicating either success or failure.
■
LLDP - Classify the device type for grouping in the navigation tree
listing on the PCM Dashboard.
■
Device Attributes - Retrieve and update the device’s properties, such
as ports, VLAN configurations, software versions, sysContact, sysLocation, etc.
When using the PCM for HP-OV NNM module, PCM reads the NNM device
database to get initial ProCurve device information, then the PCM discovery
process retrieves the network properties for ProCurve devices. ARP and Ping
Sweep discovery functions are provided via the NNM discovery process.
The Discovery process also registers the NNM server as a trap receiver for
each ProCurve device, and all device and PCM application events are logged
to the NNM Events database.
3-3
Discovering Devices
How Discovery Works
Initially, discovery works only for devices on the same subnet as the Discovery
starting device. Discovery polls the starting device for the subnet mask and
computes the subnet address from the IP address. Discovery then defines the
subnet as the default managed subnet. Once you have started PCM, you can
add subnets and devices on your network to the Discovery list.
Discovery uses the default SNMP read community name specified during the
install process to discover new devices on the network. Once a device is
discovered, you can change the SNMP read community name for that device
in PCM using the Communication Parameters wizards (see Chapter 6, “Managing Network Devices” for details .
When Discovery is first started, it launches the Status Polling component to
poll the discovered network devices for operational status at prescribed
intervals. The polling results are used to display device status in the Devices
List. The interval for running each Discovery component can be altered in the
Discovery Preferences settings. (See “Managing the Discovery Preferences”
on page 3-20 for details) Note that even if Discovery is stopped, status polling
continues to run and check the status of devices on the network.
You can review the current Discovery status in the Dashboard window. The
Global indicator refers to the entire discovery process. That is, if any segment
of discovery is running, Global status will be Running. Each of the segments is
listed separately, with a status of Idle or Running. If Discovery is stopped, the
Global status report is stopped.
Figure 3-1. Discovery Status panel of Dashboard window.
In addition, the Status bar in the bottom PCM window frame includes an
indicator for Discovery status, either on or off. This allows you to check the
Discovery process status at all times.
3-4
Discovering Devices
How Discovery Works
Reviewing Discovery Data
The Dashboard window provides a summary of the items discovered on the
network in the Inventory panel.
Figure 3-2. Inventory summary provided by Discovery
NOTE:
When using the PCM+ for OV-NNM module, the Inventory data refers only to
ProCurve network devices. End-nodes inventory will always be 0. This is
because PCM+ only gets information on ProCurve devices from NNM, thus is
unable to determine end-nodes or unknown devices.
You can also click the Interconnect Devices node in the navigation tree to display
a list of all devices discovered. The Subnets and VLANs nodes under the Network
node in the navigation tree can be used to view a list of discovered Subnets
or VLANs, and to access network topology map views.
If you change a device configuration, and do not want to wait until the next
scheduled scan to see the changes in PCM, you can right-click on the device
in the navigation tree, or the Devices List, then select the Re-Discover Device
option in the right-click menu. If you do not find a device in the Devices List,
use the Manual Discovery process to check for a device.
A device must be re-discovered to update PCM with changes due to any of the
following:
•
the device was disconnected, then reconnected to another port or
device
•
a "blade" has been removed or added to the device
•
configuration changes are made to the device, such as STP, trunk
connection, etc.
•
connections shown for the device in the Network Maps are incorrect.
3-5
Discovering Devices
How Discovery Works
Note:
Discovery and Re-discover do not collect and store device configuration
information. Discovery is used only to update the device’s network properties
and connections, as described on page 3-3. To get device configuration data,
you must use the Configuration Manager Scan, described in Chapter 8, "Managing Device Configurations."
Using Manual Discovery
You can manually discover a device on the network at any time using the
"Manual Discovery Wizard.
1.
Select the Manual Discovery option in the PCM global Tools menu, or
Select a device in the Devices List, then select Re-Discover from the rightclick menu. This displays the Device Discovery Wizard welcome dialog.
If the device entered does not belong to a managed subnet, Discovery
automatically creates a managed subnet for the device.
2.
3-6
Click Next to go to the Device Information window
Discovering Devices
How Discovery Works
3.
Enter the Device IP Address for the device you want to discover
4.
Set the Device Communication Parameters to use for manual discovery.
a.
If you using PCM Defaults, click Next to continue the Manual Discovery process (skip to step 12 on page 3-10)
b.
If not using defaults, click to deselect the Use Defaults option, then
click Next to continue to the SNMP Configuration window.
The default SNMP communication parameters are shown.
3-7
Discovering Devices
How Discovery Works
5.
6.
To change the SNMPv1/v2 communication parameters used for manual
discovery:
a.
Click in the Read Community name and overtype the default entry with
the new SNMP Read community name used to communicate from
PCM to the device.
a.
Click in the Write Community name and overtype the default entry with
the new SNMP Write community name used to communicate from
PCM to the device.
b.
Click in the TimeOut field and overtype the default entry (5 seconds)
with another number. This resets the communication time-out period
for manual discovery.
c.
Click in the Retries field and overtype the default entry (3) to reset the
number of device communication retries for manual discovery.
To configure SNMPv3 communication parameters for device discovery:
a.
Click the radio button to select the SNMPv3 option. This enables the
SNMPv3 fields in the window
b.
Enter the USM Username used to access the device.
c.
If the device uses an authentication protocol, select it from the Auth
Protocol drop-down menu:
None - Do not use an authentication protocol.
3-8
Discovering Devices
How Discovery Works
MD5 - Use the MD5 algorithm to produce a 128-bit fingerprint
(message digest) for authentication.
SHA - Use the SHA algorithm to produce a 160-bit message digest.
d.
For MD5 or SHA authorization protocols enter the password used for
authentication in the Auth Password field.
e.
If the device uses the DES Privacy Protocol, select it from the
Priv Protocol drop-down menu.
(DES uses a 56-bit key and block cipher method to break text into 64bit blocks and encrypt them.)
7.
f.
If you selected DES, enter the Private Password used to communicate
with the device.
g.
Click Next to continue to the CLI parameters configuration window.
To change the CLI mode:
a.
Click the radio button next to the mode you want PCM to use to
communicate with devices:
– Telnet for CLI communication.
Complete the Telnet Parameters section to define the telnet
parameters.
– SSH for CLI communication.
Complete the SSH Configuration pane to define the SSH version
and authentication method.
8.
Click the Timeout up or down arrow to set the number of seconds to wait
for a response from the device. Time-out can be 1-30 seconds, with a
default of 15 seconds.
9.
Click the Retries up or down arrow to set the number of times to try
connecting with the device. From 1-5 retries can be entered, with a default
of 3 retries.
10. To change telnet parameters:
a.
To configure the telnet manager login, type the new manager user
name in the Manager Username field and the associated password in the
Manager Password field.
b.
To configure a telnet operator login, type the new operator user name
in the Operator Username field and the associated password in the
Operator Password field.
11. To change SSH parameters:
a.
Click the radio button to select the SSH version used by PCM to
communicate with the device, either SSH1 or SSH2
3-9
Discovering Devices
How Discovery Works
b.
Click the radio button to select the Authentication method:
– Password, and then type the user credentials that SSH will use to
authorize communication with the device, OR
– Key, and then type the key in the SSH Key field.
You must define the SSH2 key before attempting to communicate
with devices using SSH key authentication. Key authentication is
used for SSH2 only. Key authentication for SSH1 is not supported.
c.
In the SSH Port field, type the default port number to be used for CLI
SSH communication.
d.
Click Next to continue to the Connection Status window
12. Once you enter the device information and click Next, PCM attempts to
verify the device information and establish a connection with the device.
Discovery progress displays in the Connection Status window.
If the IP address or SNMP community is not found, a failure message is
displayed. In this case, go back and re-enter the device information and
retry.
If the device IP which has already been discovered, a dialog box displays
with the message "Device already exists, do you want to delete and rediscover?" Click Yes to delete the device from the PCM database and rediscover. Click No to cancel the manual discovery and the "Finished"
screen will display.
13. Click Next to continue the manual discovery process and display the
Discovery Status window.
3-10
Discovering Devices
How Discovery Works
14. Click Next to go to the Discovery Finished window.
15. Click Finish or Close to exit the wizard.
16. Click Start Over to return to the start of the wizard and discover another
device.
3-11
Discovering Devices
How Discovery Works
Using Re-Discover Device
A device must be re-discovered to update PCM data with changes due to any
of the following:
•
the device was disconnected, then reconnected to another port or
device
•
a "blade" has been removed or added to the device
•
configuration changes are made to the device, such as STP, trunk
connection, etc.
•
connections shown for the device in the Network Maps are incorrect.
The Re-Discover Device feature (Discovery Wizard) can be used to re-discover
a device and update the device attributes stored in PCM. It works in a similar
way as the Manual Discovery Wizard.
To Re-discover a device:
1.
Select a device in the Devices List or navigation tree, then select Re-Discover
Device from the right-click menu.
This displays the Device Discovery Wizard welcome dialog.
2.
Click Next to go to the Device Information window
3.
The IP address for the device should appear in the Device IP Address field.
4.
Click Next to continue. PCM attempts to verify the device information and
establish a connection with the device. The progress displays in the
Connection Status window.
5.
If the device connection is successful, click Next to continue to the Select
Attributes to rediscover dialog.
If the device connection fails, return to the Device Information window.
3-12
a.
Click to deselect the Use Defaults option.
b.
Click Next to continue to the SNMP Configuration window and configure the device communication parameters. (Refer to step 5 and 6
on page 3-8)
c.
When you have set the communication parameters, click Next to
continue to the Connection Status window.
Discovering Devices
How Discovery Works
6.
The Select Attributes to refresh dialog lets you select the device attributes you
want to refresh in the discovery database. The default option is to refresh
All Attributes.
7.
Click to deselect All Attributes and enable the individual device attribute
options.
Click the check boxes to select or deselect the individual Attributes.
8.
Click Next to continue the Re-Discovery process.
9.
The Discovery Status window displays the re-discovery status. When
successful, PCM deletes previous device attributes (device info), then
collects and stores the new device attributes information in the PCM
Discovery database.
Remember, Discovery collects only the basic device and connectivity (port
and VLAN) information. To collect detailed device configuration information,
you need to use the Configuration Manager, Scan configuration option.
3-13
Discovering Devices
Port Classification
Port Classification
To support the Access Management and Security functions, the PCM discovery
process collects and provides Port Classification information for network
devices.
To review the Port Classification information for a device,
■
Select the device node in the navigation tree on the left, then use the
right-click menu and select the Port Classification option, or
■
Select a device in the Devices List tab, then use the right-click menu
and select Discovery->Port Classification.
The Port Classification dialog displays:
3-14
•
Port Name (port number) on the selected device that is connected to
another device on the network.
•
Port type, one of the following:
– Infrastructure Port, indicates connection to another switch in the
network. This is also referred to as inter-switch ports in other
areas of PCM+
– Edge Port, indicates connection to an end node device, such as a
printer, PC, or Server.
•
Remote IP, the IP address of the attached device (or device port)
•
Remote MAC, the MAC address of the attached device (or device port)
•
Remote Device Type, the network device type or end node that is
connected.
Discovering Devices
Port Classification
How Discovery Classifies Ports
To classify infrastructure ports the following methodology is used:
a.
For links discovered during the "neighbor" discovery, the ports associated with this link are classified as infrastructure ports.
b.
If the MAC address is discovered and it belongs to a switch, the port
is classified as an infrastructure port.
To classify edge ports the following methodology is used (for ports whose
operational status is up):
a.
For each port, check the entries in the address forwarding table on
the switch (bridge MIB).
b.
If the forwarding table for the switch port contains only one MAC
address, and if it is associated to a proCurve or managed switch, then
this port is assumed to be connected to an end-node and is classified
as an edge port.
c.
If the forwarding table for a port has more than one MAC address and
that port is not an infrastructure port, the port is ignored and has an
UNKNOWN status. (no entry appears in the Port Classification dialog).
d.
If a single MAC address is found in the device port forwarding table,
check the ARP table for information (IP, MAC). Use information found
in the ARP table to perform a SNMP query to determine if connection
is a host or ProCurve device. If the system responds to SNMP and
indicates it is a host, the port is classified as an edge port.
e.
If the attached device does not respond to SNMP, the device is pinged.
If the device is reachable, PCM classifies the port as an edge port.
3-15
Discovering Devices
Using the Find Node Feature
Using the Find Node Feature
Use the Find Node feature to discover all the neighboring devices that are
connected to the selected network node. A network node can be a switch, or
a host such as a PC, server or printer.
If the selected node is a host device, FindNode will return the switch and port
number that the host is connected to, using the information found in the bridge
MIB of the switches belonging to same subnet as the host.
If the selected node is a switch device, FindNode will return information for
all neighboring devices that are connected to that switch. To identify all the
switches connected to the switch, FindNode queries the CDP/FDP information on the switch. To identify any end points or hosts connected to the switch,
FindNode retrieves the ARP cache on the switch and determine whether each
of the devices in the ARP table is directly connected to the host or end-point.
Thus only active hosts or end-points will be identified.
To use Find Node:
1.
Click the Find Node icon in the Global toolbar to display the Find Node
dialog.
Figure 3-3. Find Node Dialog.
3-16
Discovering Devices
Using the Find Node Feature
2.
Select the IP Address or MAC option.
a.
For IP Address, you can enter the IP address or DNS name to specify
both host and switch nodes in the IP Address field
b.
The MAC address can only be used to specify switch nodes. The MAC
address entry format is xx:xx:xx:xx:xx:xx
The DNS name for the specified address will be displayed in the Find Node
window.
3.
Click Find to run the Find Node process. The Connected Devices are listed
in the Find Node window.
Figure 3-4. Result for a Host Node
Information for the devices the switch is connected to is returned, including:
■
Display Name—the display named used in PCM for the switch
■
Neighbor IP—the IP address of the switch
■
MAC—the MAC address of the switch
■
Connected Port—the port on the switch to which the end point is
connected
■
Device Type—the type of device (Switch/End Point/AP) that is
connected.
■
Node Port is not applicable to End Point nodes, so the field is blank.
3-17
Discovering Devices
Using the Find Node Feature
Figure 3-5. Find Node Result for a Switch Node
If you specified a Switch Node, information for all devices that are connected
to the specified switch is displayed in the Find Node window, including:
■
Display Name— the display named used in PCM for the connected
switch.
■
Neighbor IP—the IP address of the connected device.
■
MAC—the MAC address of the connected device.
■
Connected Port—The port on the neighboring switch to which the
specified switch is connected.
■
Device Type—The type of device (Switch/Host/AP).
■
Node Port—The port number on the specified switch or end point
where the neighboring device is connected.
Using Node to Node Path Tracing
To help determine the actual connections between devices on the network,
you can use the Trace Path function available in the global Tools menu. under
Diagnostic Tools. This feature works similarly to the Find Node feature, except
it traces the actual network route between two network device, or a network
device and end-point.
3-18
Discovering Devices
Using the Find Node Feature
1.
Click the Trace Path icon in the global toolbar or select the Trace Path option
in the Tools menu (Tools->Diagnostic tools->Trace Path), to display the Node to
Node Path Trace dialog.
Figure 3-6. Node to Node Trace Path dialog
2.
Define the Source Device using IP Address, DNS Name, or MAC Address.
3.
Define the Destination Device by IP Address, DNS Name or MAC Address.
4.
Click Find Path.
5.
The results are returned, listing the devices and connections (hops)
between the specified source and destination device.
Figure 3-7. Trace Path results dialog.
3-19
Discovering Devices
Managing the Discovery Preferences
Managing the Discovery Preferences
You can manage the discovery process in PCM with the Discovery options in
the Preferences tool. Click the Preferences icon in the toolbar to display the
Preferences window and access the Discovery options.
Global Discovery Preferences
You can change the Discovery starting device, and configure the Ping Sweep
and Device Status Polling scans in the Preferences, Global:Discovery window.
[Preferences->Discovery]
Figure 3-8. Preferences Global:Discovery Window
3-20
Discovering Devices
Managing the Discovery Preferences
When changing any of the discovery settings, click Apply to save the changes
without leaving the Global:Discovery window, or click OK to apply the changes
and close the window.
To Start or Stop Discovery:
The default preference for Discovery Status is Enable, indicating that all
discovery processes will run as scheduled.
To stop all Discovery processes, click the Disable radio button.
To restart Discovery processes, click the Enable radio button.
To change the Discovery Starting Device:
In the Seed device field, delete the existing entry and type in the IP address
of the starting device (core ProCurve device or default gateway) for the
discovery process. The starting point can be configured to be any SNMP
network device that is reachable from the management server; however,
discovery will work faster if a ProCurve device is used.
If the IP address entered is invalid or is not a legal IP address, PCM
Discovery will ignore the entry and continue to use the last valid Discovery
starting device. When you change the Discovery starting device, the
previously specified starting device will be treated as a remote Subnet.
Note:
When using the PCM for OV-NT NNM module, the starting device is the NNM
server and cannot be changed, so the Starting Device option is not shown in
the Discovery Settings window.
To change the Ping Sweep settings: Type in the desired parameters, or use
the button to increase or decrease the parameters.
•
For the Ping sweep retries, click the buttons to increase or decrease the
number of attempts by Discovery to complete the Ping sweep if the
Ping sweep times out before completion.
•
For the Ping sweep timeout, click the buttons to increase or decrease the
interval (in milliseconds) to wait for a response before the Ping sweep
times out.
To change the Device Status Polling settings: Type in the desired parameters, or use the button to increase or decrease the number.
•
For the Interval, click the buttons to increase or decrease the number
of minutes between Status polling scans.
3-21
Discovering Devices
Managing the Discovery Preferences
•
For the Retries, click the buttons to increase or decrease the number
of attempts to complete the Status Polling if the process times out
before completion.
•
For the Timeout, click the buttons to increase or decrease the interval
(in milliseconds) to wait for a response before the polling process
times out.
If the Automatically register as a trap receiver for new devices option is selected,
when discovery is run, the PCM management station is set as a trap receiver
for discovered devices.
Scan for User-Defined Devices: If you have added user-defined devices,
you can click the Rescan for user-defined devices button to launch a scan for user
defined devices (UDDs) and have any discovered UDDs added as nodes in the
navigation tree. For more information on User Defined Devices, refer to
“Adding User-defined Devices” on page 16-12.
Excluding or Deleting Devices from Discovery
The Exclude/Delete Device Wizard is used to exclude or remove a device from
discovery.
•
Excluding a device stops it from being discovered in all subsequent
discoveries and adds it to the Excluded Devices list.
•
Deleting a device removes it from the currently managed devices. The
device will reappear in PCM and be added to managed devices if
detected in subsequent discoveries.
To exclude a device from discovery
1.
Select the device in the Devices List, then right click and select the Exclude
device option from the right-click menu to launch the Exclude Devices
Wizard.
The Select Action window displays with the selected device IP address in
the Devices to Delete list and the Exclude option selected.
3-22
Discovering Devices
Managing the Discovery Preferences
2.
Click Next to continue to the Removal Status window.
3.
Click Next to continue to the Finish window.
3-23
Discovering Devices
Managing the Discovery Preferences
4.
Click Finish or Close to exit the wizard.
When you select the Delete Device option, the same wizard is launched, and the
Delete Device option is selected when the wizard opens. Otherwise, the delete
process is the same as the exclude process.
To include a device that was excluded from discovery:
1.
3-24
Go to Preferences->Discovery->Excluded Devices
Discovering Devices
Managing the Discovery Preferences
Figure 3-9. Preferences, Global:Discovery:Excluded Devices window
2.
Select the devices to be removed from the excluded devices list, and added
back to managed devices.
3.
Click Remove.
4.
When the selected devices are removed from the window, click Ok to close
the window.
5.
When the Restart Discovery prompt displays:
•
Click Yes to restart discovery immediately.
•
Click No to close the pop-up and wait until the next time discovery
runs, when the device will be discovered automatically.
You can use Manual Discovery to add devices back to managed devices and
subnets without running a complete discovery.
Re-Classifying Unknown Devices
In some instances Discovery will be unable to classify an ProCurve device,
generally due to a mismatch in the SNMP Management community name
settings. This Unknown Devices node contains a list of any devices discovered in
the network that are not SNMP accessible but have a valid IP or IPX address
Note:
This feature is not applicable for users of PCM for OV-NNM because there are
no "Unknown" devices.
3-25
Discovering Devices
Managing the Discovery Preferences
To reclassify an unknown device as an end node:
Note:
1.
Click the Unknown Devices node in the tree.
2.
3.
Select the device to be moved from the Unknown node to the End Node
group.
Click the Reclassify Device as End Node button.
4.
Click Yes to complete the process.
Once you reclassify a device as an end node, you cannot change the device
classification unless you manually delete and rediscover the device.
To manually reclassify an unknown device:
3-26
1.
Delete the device from Discovery, as explained in “Excluding or Deleting
Devices from Discovery” on page 3-22.
2.
Obtain the communication parameters for the device.
3.
Manually discover the device, as explained in “Using Re-Discover Device”
on page 3-12.
Discovering Devices
Managing the Discovery Preferences
Scheduling Discovery Processes
The Discovery process is set to run continuously. To stop any of the Discovery
process, select the Status option under Discovery preferences to display the
Global:Discovery:Status window. [Preferences->Discovery->Status]
Figure 3-10. Global:Discovery:Status Panel
The default setting is to automatically run discovery processes when the
management server starts. The Global:Discovery:Status window displays status for each of the discovery processes, and lets you start, stop, and schedule
discovery process intervals.
•
ARP Discovery indicates the schedule and status of the ARP discovery
•
Device Attributes indicates the schedule and status of the Device
process.
Attributes, Port Status, and VLAN discovery process.
•
Neighbor Discovery indicates the schedule and status of the LLDP/FDP/
CDP discovery process.
•
Ping Sweep indicates the schedule and status of the Ping Sweep discov-
ery process.
3-27
Discovering Devices
Managing the Discovery Preferences
To Stop a Discovery Process:
1.
Open the Global:Discovery:Status window
2.
Click on the process in the list to select it.
3.
Click the Stop button in the toolbar
The Status shown for the process changes to Stopped. Also the Start button
is enabled and the Stop button is disabled.
To Start a (stopped) Discovery Process:
1.
Open the Global:Discovery:Status window
2.
Click on the process in the list to select it.
3.
Click the Start button in the toolbar
The Status shown for the process changes to Running. Also the Stop button is
enabled and the Start button is disabled.
To Restart an Idle Discovery Process:
1.
Open the Global:Discovery:Status window
2.
Click on the process in the list to select it.
3.
Click the Restart button in the toolbar
The Status shown for the process changes from Idle to Running.
To Enable or Disable the Discovery Process Schedule:
1.
Open the Global:Discovery:Status window
2.
Click on the process in the list to select it.
3.
Click the Enable/Disable button in the toolbar
The Schedule state shown for the process changes from Enabled to Disabled, or
vice-versa.
3-28
Discovering Devices
Managing the Discovery Preferences
Discovery Intervals
The fundamental trade-off you should consider when configuring discovery
intervals is that less frequent discovery processes result in longer times (on
average) before changes in the network are reflected in PCM. So you should
start out by asking the following questions:
■
How stable is your network? That is, how frequently are devices being
added or removed, and how often are sections of the network being
re-wired with a different topology? If your network is highly fluid you
will want to configure discovery to run more frequently (being aware
that it will increase network traffic slightly). On the other hand, if the
network is very stable, you might choose to run less frequently, and
only at times when there is little other traffic on the network
competing for network resources.
■
How quickly do you want to see changes in the network reflected in
the PCM user interface? If you are willing to tolerate a delay between
when a new device is added to the network and when it shows up in
PCM, then you can use a longer discover interval.
In general, the less frequent the discovery intervals, the lower the demands
on the CPU of the management server and the less network traffic will be
generated for the purposes of discovery.
Changing the Discovery Schedules
PCM provides default schedules for the discovery processes. You can increase
or decrease the intervals between discovery scans to suit your needs.
1.
Open the Global:Discovery:Status window
2.
Click on the process in the list to select it.
3.
Click the Modify Schedule button in the toolbar. This displays the Modify
Schedule dialog.
3-29
Discovering Devices
Managing the Discovery Preferences
Figure 3-11. Modify (Discovery) Schedule dialog
4.
Edit the schedule parameters as needed:
a.
Type in a new Start date and time, or
i. Use the Calendar and/or the increase, decrease buttons to change
the date.
ii. Select (highlight) the hour or minute, then click the buttons to
increase or decrease the entry.
b.
To run the selected discovery process immediately, and bypass the
current schedule interval, click to select the Run ASAP option.
c.
Click the radio button to select the Recurrence Pattern. This sets the
frequency the discovery process will be run.
Use Never to turn off the selected Discovery process.
Use Onetime to set a single scan time for the selected Discovery
process. Once the scan is complete, the process will not run again
until you reschedule it.
Use the Hourly option to set recurring intervals of more than once daily.
When this option is selected you can also set the number of Hours and
Minutes between scan intervals, and Skip Weekends.
3-30
Discovering Devices
Managing the Discovery Preferences
Use the Daily option to set recurring intervals of more than once per
week. When this option is selected you can also set the number of Days
between scan intervals, and Skip Weekends.
Use the Weekly option to set a once per week scan interval, and set the
day(s) of the week for the scan to occur.
Use the Monthly option to set a once per month scan interval, and set
the Day of the month (or set Last day of the month) that the scan will be
started.
Configuring Subnets for Discovery
You can configure the subnets to be included in the Discovery process using
the Preferences Discovery: Subnets feature.
The Managed Subnets panel in the Global:Discovery window lists the subnets
that are included in the Discovery process. The Unmanaged Subnets panel lists
all other subnets found by the Discovery processes.
To add a subnet to the Managed Subnets list, select the Subnet address and
click >> to move it under Managed Subnets, then click OK or Apply.
The Inventory panel in the Dashboard window reflects the change in number
of subnets and devices.
3-31
Discovering Devices
Managing the Discovery Preferences
Adding and Modifying Subnets
To add a new subnet to the list of subnets in the Global:Discovery window,
click Add to launch the New Subnet dialog.
1.
Fill in the Subnet information:
a.
In the Name field, enter the "friendly" subnet name
b.
In the Address field, enter the IP Address of the subnet
c.
In the Mask field, enter the Subnet Mask number,
d.
In the Gateway field, enter the IP Address of the Gateway for the
subnet.
Figure 3-12. Add New Subnets dialog
2.
3-32
Select the Restrict to these IP Address Ranges option to restrict discovery on the Subnet to the selected IP addresses.
a.
Click New... to add IP address ranges to the available list.
b.
Type in the From (starting), and the To (ending) IP addresses to be
included in the IP Address range, then click OK.
Discovering Devices
Managing the Discovery Preferences
The IP addresses will be validated. If they are not valid an error message
appears. Otherwise, the new IP address range appears in the New Subnet
dialog.
3.
When you have entered the Subnet information click OK. The new Subnet
Address appears in the Subnets list on the Global:Discovery window.
To remove a Subnet:
1.
Select the address in the Unmanaged Subnets list
2.
Click Remove. The Subnet address no longer appears in the
Global:Discovery window.
You cannot remove a Managed Subnet. You need to move Managed Subnets
to the Unmanaged Subnets list before removing them.
To modify a Subnet,
1.
Select the Subnet address in the Unmanaged Subnets or Managed Subnets list
in the Global:Discovery window,
2.
Click Edit... under the list.
3.
This displays the Edit Subnet dialog, similar to the Add Subnet dialog. Make
the desired changes, then click OK.
You need to restart the discovery process for the subnet changes to take effect.
3-33
Discovering Devices
Importing and Exporting Discovery Data
Importing and Exporting Discovery Data
PCM is designed to automatically discover subnets and devices in your
network; however you can also use the Import and Export functions in the Tools
menu to:
■
Import subnets - Import a list of managed subnets from an external file
in comma delimited (*.CSV) format.
■
Import devices - Import a list of devices from an external file in *.CSV
format.
■
Export subnets - Export a list managed subnets from PCM to an external
file, on the PCM client, in *.CSV format.
■
Export devices - Export a list of ProCurve devices from PCM to an
external file on the PCM client, in *.CSV format.
To use the Import or Export feature, select the desired option from the global
Tools menu.
This launches the Import (or Export) dialog window.
Figure 3-13. Import Subnets dialog
3-34
Discovering Devices
Importing and Exporting Discovery Data
Importing and Exporting Subnets
The process for importing and exporting managed Subnets (files) is similar.
Note:
1.
Type in the File name, or use the Browse... function to select a file (location)
on your system.
2.
Click the Import (or Export) button.
3.
The Status portion of the window indicates the Import process success by
listing the Managed Subnet data in the transferred file.
Data for unmanaged subnets cannot be exported from PCM.
When PCM imports the file it first parses the import file to check for proper
syntax. In no syntax errors are found, PCM imports the data into the PCM
database.
3-35
Discovering Devices
Importing and Exporting Discovery Data
Subnets File Formats
For Managed Subnets the following format must be used in the import files,
and is also the format applied to exported files.
Name, Subnet IP address,subnet mask,default gateway,start address,end address,start
address,end address,...
Where:
Name (optional)= name for subnet
Subnet IP address (required)— is the network IP address for the subnet.
Subnet mask (required)— is the network mask for the subnet.
Default gateway (required)— is the default gateway IP address used for the
subnet.
Start address (optional)— start address for a restricted range 1
End address (optional)— end address for a restricted range 1
The Start address and End address fields will repeat for each range of IP
addresses specified for the subnet
The box below provides an example managedsubnets.csv file.
HP1Subnet,10.29.32.0,255.255.248.0,10.29.32.1
HP2Subnet,10.255.120.0,255.255.248.0,10.255.120.1,10.255.120.20,10.255.120.60
HP3Subnet,10.29.16.0,255.255.248.0,10.29.16.1,10.29.16.10,10.29.16.20,10.29.16.80,10.29.16.90
3-36
•
The HP1 Subnet is a subnet with no restricted ranges.
•
The HP2 Subnet is a subnet with one restricted range (10.255.120.20
to 10.255.120.60).
•
The HP3 Subnet is a subnet with two restricted ranges (10.29.16.10 to
10.29.16.20) and (10.29.16.80 to 10.29.16.90).
Discovering Devices
Importing and Exporting Discovery Data
Importing and Exporting Device Files
This feature allows you to import a list of devices from an external, *.CSV
(comma delimited format) file. It can be used to discover devices more quickly.
If Discovery is turned off, you can use the import feature to set the exact
devices that you want to manage with PCM. In addition to ProCurve devices,
the list of devices can include other third-party devices. You can also export
the list of devices, in a .CSV file, for use in other programs.
The process for importing and exporting Device files is similar.
1.
Type in the File name, or use the Browse... function to select a file (location)
on your system.
2.
Click the Import (or Export) button.
3.
The Status portion of the window indicates the Export process success
by listing the Device data in the transferred file.
When PCM imports a Device file it first parses the import file to check for
proper syntax. In no syntax errors are found, PCM imports the device data
into the devices database. Only devices that can be accessed with the specified
read community name, or the default community name specified in PCM
Preferences will be created in the database.
Device File Format
There are two formats used for device files: one for devices using SNMPv2,
and one for devices using SNMP v3. The two formats can co-exist in the same
file, or be maintained in separate files.
For SNMP V2 devices the following format must be used in the import files,
and is the format applied to exported files.
SNMPv2,IP address,read community name,write community name,telnet
password,telnet user
Where:
SNMPv2 (required): is used to indicate the device uses SNMPv2 protocol.
IP address (required): is the IP address of the device or the DNS name, for
example, nmdev01.rose.hp.com.
Read community name (optional): is the SNMP read community name config-
ured on the device. If the read community name is not specified, the
default read community name specified in the PCM Global Preferences
for Device Access will be used.
3-37
Discovering Devices
Importing and Exporting Discovery Data
Write community name (optional): is the SNMP write community name con-
figured on the device. If write community name is not specified, the
default write community name specified in the PCM Global Preferences
for Device Access will be used.
Telnet password (optional): is the telnet password configured on the device.
Some PCM components, such as Configuration Manager, need this information in order to execute CLI commands on the device. If the telnet
password is not specified, the default telnet password in PCM Global
Preferences for Device Access will be used.
Telnet user (optional): If the device is configured with a telnet user name,
then this information is required. If the telnet user name is not specified,
the default telnet user name in PCM Global Preferences for Device Access
will be used.
The box below provides an example devices.csv file for devices using
SNMPv2 protocol.
SNMPv2,10.29.38.10
SNMPv2,10.29.38.202,,,,
SNMPv2,device04.rose.hp.com,,,,
SNMPv2,10.255.123.254,public,,,
SNMPv2,10.255.123.38,public,public,testpw,
SNMPv2,10.255.123.39,public,private,testpw,testuser
For SNMP V3 devices the following format must be used in the import files,
and is the format applied to exported files.
SNMPv3, IP address,USM user name,authentication protocol,authentication
password,privacy protocol, privacy password,telnet password,telnet user
Where:
SNMPv3 (required): is used to indicate the device uses SNMPv3 protocol.
IP address (required): is the IP address of the device or the DNS name, for
example, nmdev01.rose.hp.com.
USM user name (optional): is the user name used to communicate with the
device. If the user name is not specified, the default user name specified
in the Global Preferences for Device Access will be used.
Authentication protocol (optional): is the authentication protocol used to
access the device. Allowed values include MD5, SHA, or NONE. If the
Authentication protocol is not specified, the default Authentication Protocol specified in the Global Preferences for Device Access will be used.
3-38
Discovering Devices
Importing and Exporting Discovery Data
Authentication password (optional): is the authentication password set on the
device. If an Authentication password is not specified, the default Authentication password in Global Preferences for Device Access will be used.
Privacy protocol (optional): is the privacy protocol used. Allowed values:
DES, NONE. If privacy protocol is not specified, the default Privacy
Protocol specified in the Global Preferences for Device Access will be
used.
Privacy password (optional): is the privacy password configured on the
device. If privacy password is not specified, the default Privacy password
in Global Preferences for Device Access will be used.
Telnet password (optional): is the telnet password configured on the device.
Some PCM's components such as Configuration Manager, need this information in order to execute CLI commands on the device. If the device is
configured with a telnet password, then this information is needed. If
telnet password is not specified, the default telnet password in Global
Preferences for Device Access will be used.
Telnet user (optional): is the telnet user configured on the device. Some
PCM's components such as Configuration Manager, need this information
in order to execute CLI commands on the device. If the device is configured with a telnet user name, then this information is needed. If telnet
user name is not specified, the default telnet user name in Global Preferences for Device Access will be used.
# (optional): is used for comment
The box below provides an example devices.csv file for devices using
SNMPv3 protocol.
SNMPv3,10.29.38.202,v3UserName
SNMPv3,10.29.38.10,v3UserName,MD5,authPasswd,DES,privatePasswd
For details on setting Device Access Preferences for SNMP, see “Using
Global Device Access Preferences” on page 6-39.
3-39
Discovering Devices
Troubleshooting Discovery
Troubleshooting Discovery
■
Discovery only works for Managed Subnets. If there are devices
which are not yet discovered and all discovery processes are "Idle"
(as shown in the Discovery Status panel in the Home dashboard), go
to Preferences->Discovery->Subnets to see if there are subnets you
want to discover listed in the Unmanaged Subnets list. If so, move the
Subnet to the Managed Subnets list. You should then re-start
discovery processes in the Preferences->Discovery->Status window.
■
Because Discovery uses SNMP, if a device is not SNMP enabled, or if
the SNMP community names are changed, Discovery may be unable
to properly classify and map the device.
■
If Discovery is not finding or classifying a known device on the
network, it may be due to temporary problems on the network or on
the device. Try using Manual Discovery, or the Re-Discover function.
■
If the CLI (Telnet and/or SSH) settings, or the SNMP settings for a
device are different than the PCM global Preferences for Device
Access settings, PCM may be having problems communicating with
the device. If you suspect this is occurring:
a.
Use the Test Communication Parameters option to compare CLI and SNMP
communication parameters stored on the device with those stored in
PCM.
b.
Use the Communication Parameters in PCM Wizard to override the Global
PCM settings and set the device access parameters for the specific
device. (Reference Chapter 6, “Managing Network Devices”)
c.
Use Manual Discovery, Device Re-discover, or stop and restart the
Discovery process to verify the problem is resolved. You may want to
reset the ping sweep interval before restarting Discovery to ensure
that all available device information is captured.
The following LLDP/CDP problems can result in Discovery and mapping
errors:
■
The switch does not appear in the Neighbors table of an adjacent
device, which may be due to any of the following:
•
3-40
Either the port connecting the switch to the adjacent device is not a
member of an untagged VLAN, or any untagged VLAN to which the
port belongs does not have an IP address.
Discovering Devices
Troubleshooting Discovery
•
If there is more than one physical path between the switch and the
other device and STP (Spanning Tree Protocol) is running on the
switch, then STP will block the redundant link(s). In this case, the
switch port on the remaining open link may not be a member of an
untagged VLAN, or any untagged VLANs to which the port belongs
may not have an IP address.
•
The adjacent device’s Neighbors table may be full. View the device’s
Neighbors table to determine whether it is full.
■
One or more neighbors appear intermittently or not at all in the
switch’s Neighbors table. This may be caused by more than 60 neighboring devices sending LLDP packets to the switch. Exceeding the
60-neighbor limit can occur, for example, where multiple neighbors
are connected to the switch through non-LLDP devices such as hubs.
■
The same switch or router appears on more than one port in the
Neighbors table. Where LLDP is running, a switch or router that is the
STP root transmits outbound packets over all links, including redundant links that STP may be blocking in non-root devices. In this case,
the non-root device shows an entry in its Neighbors table for every
port on which it receives a packet from the root device.
3-41
Discovering Devices
Troubleshooting Discovery
3-42
4
Using Network Maps
Chapter Contents
How Network Maps Work . . . . . . . . . . . . . . 4-2
Displaying Network Maps . . . . . . . . . . . . . 4-3
Subnet and VLAN Maps . . . . . . . . . . . . 4-5
Map Layout Options . . . . . . . . . . . . . . . 4-6
Network Map Annotations . . . . . . . . . . 4-6
Using the Maps Toolbar Options . . . . 4-10
Viewing Network Device Information 4-11
Using the Go To Map Feature . . . . . . 4-11
Using Background Images with Maps 4-13
4-1
Using Network Maps
How Network Maps Work
How Network Maps Work
When ProCurve Manager is started, the Discovery process finds the devices
on your network. The Mapping tool uses the information provided by Discovery Topology scan to create network topology maps. The Mapping tool will
automatically create a map of the entire network, and a separate map for any
Subnets or VLANs you have configured.
During the Neighbor (LLDP) discovery cycle, PCM will generate or update
network topology maps to reflect the physical layout of devices in the network, based on the connections found in the Neighbor tables on devices in
the network. Discovery also maps wireless devices such as the 420wl and
520wl Access Points, and the 700 series Access Control devices.
All forms of network topology mapping rely on LLDP, (Link layer discovery
protocol) or CDP with the exception of ProCurve wireless devices, which rely
on the Bridge MIB. Thus, discovery can only "map" LLDP enabled devices and
ProCurve wireless devices. All other devices will be shown as unmapped
devices in the Network Map display.
Note:
For mapping to work correctly, LLDP must be enabled for both transmit and
receive.
On the ProCurve 2500 Series devices, you must upgrade the switch software
to version F.05.60 to enable LLDP transmit and receive. Prior switch software
versions support only LLDP transmit, thus did not map correctly.
Subnet maps and VLAN maps are subsets of the Network Map, and are created
when the VLAN discovery cycle is completed.
To create the subnet map, Discovery extracts all the links (a connection
between two devices) for all devices in the Network Map. For each link it
determines if the connected devices belong to the subnet being mapped. If the
devices for the link belong to the subnet being mapped, they are added to the
Subnet map.
To create the VLAN map, for each link extracted from the Network Map,
Discovery will determine if the connected ports for the link belong to the VLAN
being mapped. If the ports for the link belong to the same VLAN ID, then
Discovery add the link to the VLAN map.
In addition to the Network Maps, you can use the "Find Node" feature to get
information about connections between network nodes. See “Using the Find
Node Feature” on page 3-16 for details.
4-2
Using Network Maps
Displaying Network Maps
Displaying Network Maps
Click on the Network Map node in the navigation tree to display the Network
Map.
Figure 4-1. Network Map display.
The Network Maps window provides an overview of the physical layout of
your managed network. It displays the connectivity and status of all devices
discovered in the network. Devices labels that appear in the map are based
on the "Device Display Name" selected in the Preferences for Device Access.
The example above shows devices using the IP address.
Devices that have been discovered, but that cannot be mapped (because they
are not LLDP, or CDP enabled) are displayed without connections to the rest
of the network.
To view the Network Map display in a separate window, click the "Show in
New Window" icon in the toolbar.
4-3
Using Network Maps
Displaying Network Maps
The default "Device View" information is Ping Status, that is the status of the
device (available, not available, etc.) when the last Ping Sweep discovery was
performed on the device.
A device label is shown next to each device in the map. These device labels
are based on the Device Display Name selected in the Preferences for Device
Access window. I
You can display additional link information by selecting the Link View options
in the left pane. Available annotations can vary based on the device and
ProCurve applications in use on your network.
1.
Navigate to the Network Map window by selecting the Network Map node
in the navigation tree.
2.
To display Link View information, which includes data on the links
between network switches, click the Link View drop-down arrow, select
Link Status, and then check any combination of the following checkboxes:
■
Duplex Info
Adds a label next to the link connector, indicating the
duplex mode configured at each end of the link:
Hdx/Hdx = Half duplex/Half duplex
Fdx/Hdx = Full duplex / Half duplex (and vice versa)
Fdx/Fdx = Full duplex / Full duplex
■
Link Speed
Adds a label indicating the connection speed for each
end of the link (e.g., 100/100Mbps or 1000/1000Mbps)
■
Port Name
Label appears next to the link connector, indicating the
port on the device at each end of the connection (e.g.,
6/49 or A1/F1) If the Friendly Port Name option is
selected in the Preferences for Device Access, the
friendly names for ports will display.
3.
The VLAN link view displays VLAN(s) connections, and optionally displays duplex information, link speed, and name of the port being used for
the connection. When selected, a label containing the selected information appears next to each device.
You can view up to three VLANs at once, with all links in a VLAN colorcoded the same. The link status of each VLAN is shown by color-coded
lines, as described in the Legend tab.
Selecting the VLAN link view for a network map and clicking the Select
VLAN button displays the Select VLAN window. This window lets you
select the VLAN for which links will be displayed, which is especially
helpful when identifying the network location of devices in the VLAN.
The VLAN link view is not available on a Subnet map or VLAN map.
4-4
Using Network Maps
Displaying Network Maps
4.
Select the Traffic Link View to display color-coded links identifying traffic
conditions. If separate Transmit and Receive statistics are available, the
Traffic Link View displays two dashed link lines representing the top
measurement going into and out of the device. Note that each measurement could be from different metrics.
The Traffic Link View annotation displays the status of each link and lets
you optionally display links that have threshold violations. The link status
of each device is shown by color-coded lines, as described in the Legend
tab. This lets you trace link utilization and traffic on all links, and gives a
broad view of network utilization so you can diagnose problem areas
when utilization exceeds the limits.
To display an annotation for ports with traffic threshold violations, check
the Show Violation Ports check box. This option displays the following
information when a critical or warning traffic threshold is exceeded:
<threshold><source device>:<source port>
<threshold>:<metric>
<dest device>:<dest port>
The threshold precedes the device/port where it was detected, so you can
navigate to the correct device and adjust the threshold if necessary.
Subnet and VLAN Maps
Maps are also available for managed Subnets and VLANs. All map types
contain the same toolbar buttons and layout options as the main Network Map.
To view the map for a specific Subnet or VLAN, expand the Network Map node
in the navigation tree, then expand the Subnets or VLANs node to display
individual Subnet addresses and VLAN IDs. Click the Subnet address or VLAN
ID to display the related map.
Definit i on:
Managed Subnet: A subnet within the Network Infrastructure that has been
added to the ProCurve Manager’s managed device list.
If you have installed PCM+, the VLANs map window also contains a Port
Properties tab, which you can use to review the VLAN’s port configurations.
For more information on configuring and managing VLANs, refer to Chapter
9, “Using VLANs”.
4-5
Using Network Maps
Displaying Network Maps
Map Layout Options
The default Network Map uses the "physical" map layout. That is, it reflects
the physical wiring or layout of the network.
The Mapping tool provides four other options for map layout:
Radial Tree Layout- Arranges the nodes in a tree radially, with branches
determined by device link. This is the PCM default map layout. The radial
mode places the nodes of the same level on a circle around the root node. For
large networks, the alternating radial mode is used, which places nodes of the
same level at two alternating lengths around the root node to conserve space
in the display.
Tree Layout - Arranges nodes at each level horizontally, connected vertically
to other levels, starting from the root.
Hierarchical - Arranges the nodes hierarchically in horizontal or vertical
levels, so that the majority of links point in the same direction.
Network Map Annotations
Default annotations are available for all the network map views. The default
PCM map annotations provide basic properties like:
Discovery Protocol: Click the check box to display the LLDP, CDP, FDP
information for the devices in the map. Labels appear next to the devices
indicating the LLDP, CDP, or FDP protocol in use and if it is on or off.
For example Lldp: On, Cdp: On, or Fdp:Off
Duplex info: Click the check box to display the Duplex information for the
links between network switches. If duplex mode is configured, a label appears
next to the link connector, indicating the duplex mode configured at each end
of the link:
•
Hdx/Hdx = Half duplex/Half duplex
•
Fdx/Hdx = Full duplex / Half duplex (and vice versa)
•
Fdx/Fdx = Full duplex / Full duplex
Link speed: Click the check box to display the link speed configured on
connected devices shown in the map. A label appears next to the link connector, indicating the connection speed for each end of the link.
For example 100/100Mbps, or 1000/1000Mbps.
4-6
Using Network Maps
Displaying Network Maps
Port name: Click the check box to display the port names used for the device
connections. A label appears nest to the link connector, indicating the port on
the device at either end of the connection. For example 6/49, or A1/F1. If the
Use Port Friendly Names option is selected in the Preferences for Device
Access, friendly names will display.
To turn off the annotation displays, click the check box a second time to deselect the option.
The available annotations can vary based on the ProCurve applications in use
on your network.
Operating Notes for annotation labels:
■
The port labels appear at the end of the link nearest to their corresponding ports.
■
A port can have only one label. If the user selects multiple checkboxes
in the "Annotations" panel on the left side of the map, the values get
appended to the displayed label instead of adding one more label.
■
To provide control of the map arrangement and labels, you can drag
the annotation labels and place them wherever you want. The labels
are connected to the their respective ports via a thin line so that you
do not lose track of which label belongs to which port.
4-7
Using Network Maps
Displaying Network Maps
Network Map Legend
Clicking the Legend tab at the bottom of the Network, Subnet, or VLAN Map
window displays a legend identifying the symbols used in maps.
Figure 4-2. Network Map legend
The displayed legend varies depending on the Device View and Link View
selected in the Annotations tab. Legend options are:
Device Ping Status:
Normal (device up)
Warning state
Unreachable
Unknown device (no status available)
4-8
Using Network Maps
Displaying Network Maps
Security State:
Normal (device up)
Warning
Minor
Major
Critical
Link Status:
Normal link, which indicates the link between devices is up
STP blocked link, which is any redundant physical path to
serve as a backup (blocked) path in case the existing active
path fails
Meshed link, which indicates a group of meshed switch
ports exchanging meshing protocol packets.
Trunked group, which indicates a trunked port connection.
Refer to the configuration manuals that came with the
switch for details on port trunking.
Traffic Status:
Normal (no violation)
Warning threshold violation
Critical threshold violation
VLAN:
Shows a different color for each VLAN and the VLAN number
4-9
Using Network Maps
Displaying Network Maps
Using the Maps Toolbar Options
In addition to map layout options, the Toolbar in the Maps windows includes
buttons for changing the map background, and map viewing functions. Each
tool (button) is described below in the order in which it appears in the toolbar,
reading from left to right.
Figure 4-3. Maps toolbar
Map Overview: Launches a separate sub-window on top of the main Network Maps window. The overview shows the entire topology related to the
network in the main window, with any selected devices or network region
highlighted. This is useful when you have zoomed in on a specific region of
the network in the main window, and want to refer to its location in the overall
network without losing the zoom focus.
Print Map: Lets you print a copy of the selected Network Map using the
standard Windows print functionality.
Find a node: Lets you locate the node (device) in the network map using the
IP address. Click the icon to display the Find a Node dialog. Enter the IP
address of a device, then click OK. If the device exists on the map it will be
selected. The Find function will also search through VLAN IP interfaces for a
device.
Panner: Click and drag with the hand to center the network map in a different
part of the window. This is useful for scrolling to view parts of the network
that do not fit in the window.
Pointer Select: Click the ’pointer’ button to select a device in the map. You
can click and drag a device using the pointer to position devices on a background image added to the map. When you move a device, the device will
retain the position you set. Note that as discovery adds new devices to the
map, distortions may occur in the device layout you created.
You can also click the pointer to return the cursor to normal operation after
using Panner or Zoom options.
Select Region to Zoom: Magnifies the selected region of the map.
Click this button and drag the crosshair to select the region of the map you
want to magnify.
Zoom In: Magnifies the entire map.
Zoom Out: Reduces the magnification of the map.
Fit to View: Adjusts the map to display the entire network in the window.
4-10
Using Network Maps
Displaying Network Maps
Viewing Network Device Information
The Network map provides ’mouse-over’ functionality to provide access to
network device information. Hovering with the cursor over a device in the
map displays the device name and type. Hovering over a link in the map
displays information about the link connections.
You can double-click devices in the Network Map to view the device properties
and configuration, or you can select the device in the map and then use the
right-click menu to view the device properties and access PCM functions.
NOTE:
If you are running ProCurve 4100gl switches in router mode, the device will
not appear in the network map.
Using the Go To Map Feature
If you want to find a single device in the Network, Subnet or VLAN maps, you
can use the Go to map feature.
1.
Select the device node in the Navigation tree.
2.
Use the right-click menu, and select the Go to map option.
The Go to map dialog displays.
3.
Network Map is the default map selection.
Use the drop down menu to select a Subnet or VLAN map to go to.
4.
Click OK.
This displays the selected network map, with the focus zoomed in to the
selected device.
5.
To view the selected device location in the entire network, click the
Map Overview button in the toolbar.
4-11
Using Network Maps
Displaying Network Maps
This launches the Map Overview sub-window on top of the Network Map
main window. The entire network is displayed, and the selected device is
highlighted in the network, as shown in the following example.
Figure 4-4. Example of Map Overview used with Go to map feature.
You can move the Map Overview window to any area on the screen, but
it remains linked to the Go to map, network map display. When you close
the main network map window, the Map Overview is closed automatically.
4-12
Using Network Maps
Displaying Network Maps
Using Background Images with Maps
You can add a background image to the Map views to help differentiate
between network and subnet maps at a glance.
To add a background image to the Network Map device view:
1.
Open a Network Map, Subnet map, or VLANS map window.
(click the map node in the navigation tree).
2.
Click the Set Background Image button in the maps toolbar.
The Set Background Image dialog displays.
Figure 4-5. Set Map Background dialog
3.
To import a graphic, click the Import button and locate the image file to
use as the map background. You can browse and select .jpg, .jpeg, .gif, or
.png files stored on local or network devices.
When you import an image, the image file name displays in the list in the
left pane of the Set Background Image window.
4.
In the left pane, select the file to use as the map background.
All image files available in the client\config\maps\background directory
are listed in the left pane, including some standard images that come with
PCM.
4-13
Using Network Maps
Displaying Network Maps
5.
Select one of the following size options for the background:
•
Original Size: Center the graphic in the map without changing the size
of the graphic
•
Auto Fit: Automatically expand or reduce the graphic to cover all
devices in the map. To automatically stretch the background image
to cover any devices discovered in the future, click the Resize when
devices are discovered check box. Otherwise, the background will
remain at the initial auto-fit size when newly discovered devices are
added and new devices will be positioned below the background
image.
•
Custom width x height: Expand or reduce the graphic to a specific width
and height in pixels.
6.
Optionally, drag devices to any position on the background. This is especially useful when the background image is a map or floor plan.
7.
Click OK.
The image now appears as the background of the Network Map. It remains as
the associated network map background until you clear the image from the
map, or select a different image to use for the map background.
To remove a Map Background Image:
1.
Select the Network Map node to display the map with its associated
background image.
2.
Click the Clear Background Image button in the map toolbar.
The background image is replaced by the default PCM background.
Although the background is removed from the map, the device icons
remain where they were positioned and the image file is retained in the
client\config\maps\background directory.
3.
4-14
To delete an image file and remove it from the list of available images in
the Set Background Image window, right-click the image in the list and
select Remove.
Using the Event Manager
5
Using the Event Manager
Chapter Contents
Managing Events . . . . . . . . . . . . . . . . . . . . . 5-2
Reviewing the Events Table . . . . . . . . . 5-3
Acknowledging Events. . . . . . . . . . . . . . 5-6
Deleting Events . . . . . . . . . . . . . . . . . . . 5-6
Filtering the Events Display . . . . . . . . . . . . 5-7
Viewing the Events Archive. . . . . . . . . . . . . 5-8
Setting Event Manager Preferences . . . . . 5-10
Setting Event Archive Attributes . . . . 5-10
Setting Ignored Event Preferences . . . 5-12
Setting Throttled Events Preferences. 5-15
Note:
The Events Browser is not available in the PCM for OV-NNM application. All
events will be captured in the NNM Events database.
5-1
Using the Event Manager
Managing Events
Managing Events
The Events panel in the Dashboard helps you to quickly identify the number
and severity of problems in the network, indicated by SNMP traps and
application events received. For more detailed information, use the Events tab
(browser) to view and manage application events and SNMP traps generated
by network devices. You can perform the following functions from the Events
tab view:
•
View Event Detail Log
•
Sort events
•
Filter events
•
Acknowledge events
•
Delete events
To display the Events tab view:
5-2
•
click the Events tab in the Network Manager Home or Interconnect
Devices window, or
•
click the Events summary panel in the Home Dashboard display.
Using the Event Manager
Managing Events
Figure 5-1. PCM Events tab view
Reviewing the Events Table
The Events tab provides a listing of application events and SNMP traps
currently contained in the database. The event detail is organized in five
columns, described below.
Source: This column contains the name of the application component or
device that generated the event. This column also contains a colored icon
(square) for additional information about the event or source:
•
green indicates a trap received from a connected device,
•
yellow indicates a warning event,
•
red indicates the device is unreachable.
•
purple indicates an application event, not a device event.
•
grey indicates an event from an unknown device type.
5-3
Using the Event Manager
Managing Events
Severity: The Severity column indicates the severity of each event, with
colored squares and text:
•
Informational [blue]- Routine events, such as service start and stop.
•
Warning [yellow] - Unexpected service behavior,
•
Minor [orange] - Minor switch error that may impact performance
•
Major [pink] -Switch error with potential to inhibit switch operations
•
Critical [red] - Severe switch error with the potential of halting all
switch operations
Status: The Status column identifies whether the event has been acknowledged. A check in the box indicates that the event has been acknowledged,
and an empty blue box indicates that the event is not yet acknowledged.
If the Events browser configuration is set to auto-delete acknowledged events,
the Status column will show only unacknowledged events. See “Setting Event
Manager Preferences” on page 5-10 for additional information.
Date: The Date column identifies the date and time when the event occurred.
The date is shown in the Day of Week-Month-Day-Time-Year format. Time is
shown in the 24-hour clock format hh:mm:ss followed by the time zone.
Description: The Description column provides a short description of the
event. The description is derived from a list of predefined event type descriptions included with the PCM application.
Sorting Events
You can click on any column heading to sort the table’s contents by that
column in descending order. Clicking the heading a second time will sort the
data in ascending order. A pointer appears in to the column heading to indicate
it is the sorting column. The down pointer indicates the sort is in descending
order, and an up pointer indicates the sort is in ascending order.
Pausing the Events Display
The events table entries continuously scroll to display the events just received.
You can Pause the display if needed to review event text. Simply click the
"Pause" button in the events toolbar;
The Pause will toggle to the "Resume" icon. Click the resume button to restart
the events display. The button will toggle back to the Pause icon.
5-4
Using the Event Manager
Managing Events
Reviewing Event Details
Clicking on an event in the table will display the Event Detail log for that event
in the bottom section of the Events window. The Event Detail log provides the
following additional information for an event:
Source: The Source identifies the event as a trap received from the switch or
as an application event (such as Traffic Manager) issued by a component of
the ProCurve Manager.
Received from: Lists the IP address and name (if available) of the device the
event was received from, or the name of the PCM component that generated
the event (e.g. Discovery, Traffic Monitor, etc.)
Date Received: Identifies the date and time when the event occurred. The
date is shown in the Day of Week-Month-Day-Time-Year format. Time is shown
in the 24-hour clock format hh:mm:ss followed by the time zone.
Date Acknowledged: Indicates whether or not the event has been acknowledged, and the date and time of acknowledgement.
Severity: The Severity column indicates the severity of each event, with
colored squares and text:
•
Informational [blue]- Routine events, such as service start and stop.
•
Warning [yellow]- Unexpected service behavior,
•
Minor [orange]- Minor switch error that may impact performance
•
Major [pink] - Switch error with potential to inhibit switch operations
•
Critical [red] - Severe switch error with the potential of halting all
switch operations
Description: The Description column provides a short description of the
event.
Action Taken: This line shows the action taken by the switch on "fault-finder"
events. The action can be one of the following:
•
Warning Issued - The switch has detected a problem and sent a warning
to the ProCurve Manager.
•
Warning Disabled - The switch disabled the port where the problem was
detected and sent a warning to the ProCurve Manager.
•
Warning Issued and Port Speed Reduced - The switch reduced the speed of
the port where the problem was detected and sent a warning to the
ProCurve Manager.
•
Warning Issued, Port Speed Reduced, and Port Disabled - The switch reduced
the speed of the port where the problem was detected, sent a warning
to the ProCurve Manager, and then disabled the port.
5-5
Using the Event Manager
Managing Events
Acknowledging Events
Acknowledging an event indicates that you are aware of the event but it has
not been resolved.
To acknowledge an event, select the event(s) to be acknowledged in the events
table then click the Acknowledge button in the Events toolbar.
The "Acknowledge Event" action will set the selected event(s) as acknowledged, update the data store, and update the event status in the table to reflect
the change. You can configure the Events browser to automatically delete
acknowledged events from the Events table, in which case the event will be
removed from the list.
Deleting Events
To delete an event from the events table,
1.
Select the events that you want to delete
2.
Click the Delete Event icon in the Events toolbar.
Deleting an event has the following effects:
•
Removes the event from the Events table.
•
Removes the event from the count on the Events Summary subpanel
in the Network Management Home-Dashboard display.
•
Moves the event to the Archived Traps Log.
The log file is located in the ~\PNM\server\logs\EVT-ArchivedTraps.log
(where ’~’ is used to represent the install directory path.)
5-6
Using the Event Manager
Filtering the Events Display
Filtering the Events Display
The events shown in the Events tab view can be filtered to show only specific
events based on the device that generated the event, severity, dates and times
of occurrence, or description.
Use the "Filters" section at the top of the Events tab to create the filter. You can
use any single parameter, or a combination of parameters.
■
To filter by Source, type in the Source type or name that you want to
include. Events from all other sources will be excluded.
■
To filter by Description, type in the description text you want to include.
Events that do not have the text in the description will be excluded.
■
To filter by date and time, use the From: and To: fields to enter the
starting date and time (From), and ending date and time (To), that you
want to include. Click to select the Enable date filter option. All events
that occur before or after the date and time set in the date filter will
be excluded from the event list.
You can type in a date and time, or use the calendar button to select the
date, then highlight the time and use the buttons to increase or decrease
hours and minutes.
■
To filter by event severity, use the sliding scale to select the events to
be included. As you move the slide from left to right, event types to
the left of the slider are excluded from the display.
■
Click the checkbox to select the Acknowledged events filter option.
Events that are not acknowledged will be excluded from the display.
To save a defined filter:
1.
Set the filter parameters.
2.
Click the Save filter... button.
3.
In the filter name pop-up, type in a name for the filter.
4.
The filter settings are saved under the filter name, which appears in the
’Saved filters’ drop-down menu.
5-7
Using the Event Manager
Filtering the Events Display
Once you save the filter definition, you can apply it at any time by selecting it
from the Saved Filter drop down list.
Note that event filters configured in PCM 2.1 are not migrated to PCM 2.2
Click on Clear filter settings link to restore the default event list display.
You can hide the Event Filters section by clicking the Hide Filters button in
the toolbar. This button works as a toggle, click it again to display the filters.
Viewing the Events Archive
The Archived Events window lists details for each event in the Archive Log,
which contains events that have been deleted. The events displayed can be
filtered by the date the event was generated and by any event filter created in
the Events window. The Archived Events window also lets you generate an
Archived Events Report that can be saved to disk or printed.
Archiving of SNMP and PCM events can be disabled on the Event Preferences
window. Therefore, the Archived Events window and report may not contain
any events or only SNMP or PCM events.
Click the Event Archive icon in the Events toolbar to display the Archived
Events window.
5-8
Using the Event Manager
Filtering the Events Display
The Archived Events window provides the following information for each
event:
Column
Description
Source
IP address of the device that caused the event
Severity
Severity level of the event: Informational, Warning, Minor, Major,
Critical (listed in order of severity from lowest to highest)
Date Received
Time and date the event was received
Type
Type of source that generated the event: SNMP trap, PCM event, or
Syslog event.
Was Throttled
Whether a throttle was applied to the event. Possible values are: true,
or false.
No. Occurrences Number of times the event occurred during the throttle period.
Throttle Period
Length of time the event was throttled
Description
Descriptive information contained in the event
You can select the date range for displayed events by clicking the Date dropdown arrow and selecting the desired date range from the drop-down list. A
new date range begins when PCM is restarted.
To further filter archived events, in the Filter field type the text of the filter
you want to use. The display will list only events containing the filter text in
any of the data fields.
To generate a report from the Event Archive:
To generate a report that can be printed or saved to disk, click Generate Report.
This will create and display a report with the data from the Archive Event view.
To display the next page, click the > button in the bottom left corner. Or, to
display the previous page, click the < button.
To print the report, click the print button and complete the standard Windows
print screen.
To save the report to an .htm or .html file, click the save (disk) button, and
complete the standard Windows save screen. Be sure to include the .htm or
.html file extension in the filename.
By default the saved file location is Program Files/Hewlett-Packard/PNM/client.
To close the window, click the Windows X button in the upper right corner.
5-9
Using the Event Manager
Setting Event Manager Preferences
Setting Event Manager Preferences
In addition to the event filters, you can use the Events option in the Preferences
menu to customize the Events tab display and event archiving attributes.
Figure 5-2. Global:Events Configuration Preferences window.
Setting Event Archive Attributes
5-10
1.
Open the Preferences window and select the Events option to display the
Global:Events (browser) configuration window.
2.
Use the up or down arrow in the Max number of events field to increase or
decrease the size of the events database that will be displayed. When the
maximum number of events is exceeded, the oldest event is deleted to
make room for the new event. The minimum number is 100, and the
maximum number is 10,000.
Using the Event Manager
Setting Event Manager Preferences
3.
To automatically remove acknowledged events from the Events table,
click the Automatically delete acknowledged events box.
4.
Click to select or deselect the Archive Events option.
5.
Click to select (check) or deselect (no check) the PCM events option.
The PCM event archives are stored under <install dir>/server/logs directory,
with filename prefixes of EVT-.
(The default installation directory is /Program Files/Hewlett-Packard/PNM)
6.
Use the Severity Percentages to set the events types you want to maintain in
the database. These percentages are based on the overall size set in the
Max number of events field, and must equal 100 percent. For example,
Figure 5-3. Setting Event Preferences: Severity Percentages
In the example in figure 5-3, if the Max number of events is set to 1000,
and that number is exceeded,
•
600 Informational events will be maintained. If there are more than
600, the oldest events will be archived to make space for new Warning
events.
•
100 Warning events will be maintained. If there are more than 100, the
oldest warning events will be archived to make space for new Warning
events.
•
100 Minor events will be maintained, and so on.
If you want to make sure you maintain all of the Critical and Major events,
you can set the total of the two types to 100 (say 60 and 40 respectively),
and set the other severity types to 0 percent. If the maximum of 1000 is
5-11
Using the Event Manager
Setting Event Manager Preferences
exceeded, the first event types to get archived will be Informational, then
Warning, then Minor, and so on as needed to maintain up to 600 Critical
and 400 Major events in the event display.
Setting Ignored Event Preferences
You can use the Ignored Events preferences to exclude specific event types
from the event display, for a specific device, group of devices, or all devices.
1.
Open the Preferences window and select the Events -> Ignored Events option
to display the Global:Events :Ignored Events configuration window.
Figure 5-4. Global Preferences: Ignored Events window
5-12
Using the Event Manager
Setting Event Manager Preferences
The columns in the event listing provide the following information for
each event:
•
Event: The event ID. In the case of an SNMP trap, the friendly name of
the trap and the OID is listed.
•
Severity: The assigned severity for the event
•
Ignored: Indicates which events are set to be ignored by PCM.
•
Ignore No.: Indicates the number of devices on which the event is
ignored. (0 if event is not ignored, N/A for application events)
The default sort order is by event ID in descending order. You can click
on any of the column headings to change the sort order of the list.
Configuring Ignored Events
To Ignore an Event on a specific device, or group of devices:
T I P : Device events
have an OID. PCM
application events do
not.
1.
Select the event in the list. The Ignore... button is activated.
2.
Click the Ignore... button.
The Ignore Traps dialog displays, with the Select Devices to ignore from
option selected by default.
5-13
Using the Event Manager
Setting Event Manager Preferences
3.
Configure the devices to ignore from:
a.
Use the Select Device Group drop-down menu to select the device
types.
The list of devices for the selected device groups appears in the
selection box on the left side.
If you select All Devices from the menu, all the discovered devices are
listed in the selection box.
NOTE:
b.
Select the devices from the list in the selection box, then click the >>
button to move the device to the Selected Devices box.
c.
Select the Ignore from all devices radio button to ignore the selected trap
from all discovered devices. The list of all devices appears in the
Selected Devices box.
d.
Click OK to save the settings and close the dialog.
The PCM application events are generated by the application, not devices; thus
the Select devices to ignore from option, and access to the Ignore Traps dialog is
disabled for application events.
You can also set the Ignore Events preferences by selecting the event in
the Ignored Events list, then using the right-click menu.
•
Use the Ignore option to Ignore the event from all devices.
•
Use the Select device to ignore from... option to launch the Ignore Traps
dialog.
Restoring Ignored Events
To restore monitoring of an ignored event:
1.
Select the "ignored" event from the Ignored Events list.
2.
Select the Do not ignore option using the right-click menu, or
3.
To restore the event for selected devices, click the Ignore button to launch
the Ignore Traps dialog.
a.
5-14
Select the devices in the Selected Devices box
Using the Event Manager
Setting Event Manager Preferences
b.
Click the << button to remove the device from the "Selected Devices"
(to ignore from) list.
You can also select the Do not ignore option in the Ignored Traps dialog to
restore monitoring of the event for all devices.
Setting Throttled Events Preferences
You can use the Throttled Events preferences to suppress specific event types
from the event display for a specified time period from one to sixty minutes.
You can configure Throttled Event traps for a specific device, group of devices,
or all devices.
1.
Open the Preferences window and select the Events -> Throttled Events option
to display the Global:Events :Throttled Events configuration window.
Figure 5-5. Global Preferences: Throttled Events window
5-15
Using the Event Manager
Setting Event Manager Preferences
The columns in the event listing provide the following information for
each event:
•
Event: The event ID. In the case of an SNMP trap, the friendly name of
the trap and the OID is listed.
•
Severity: The assigned severity for the event.
•
Throttled: Indicates which events are set to be throttled by PCM.
•
Period: Indicates the time period for which the event is throttled.
•
Throttle No.: Indicates the number of devices on which the event is
throttled. (0 if event is not throttled, N/A for application events).
The default sort order is by event ID in descending order. You can click
on any of the column headings to change the sort order of the list.
Configuring Throttled Events
To Throttle an Event on a specific device, or group of devices:
T I P : Device events
have an OID. PCM
application events do
not.
5-16
1.
Select the event in the list. The Throttle... button is activated.
2.
Click the Throttle... button.
The Throttle Traps dialog displays, with the Select Devices to throttle from
option selected by default.
Using the Event Manager
Setting Event Manager Preferences
3.
Configure the devices to throttle events from:
a.
Use the Select Device Group drop-down menu to select the device
types.
The list of devices for the selected device groups appears in the
selection box on the left side.
If you select All Devices from the menu, all the discovered devices are
listed in the selection box.
NOTE:
b.
Select the devices from the list in the selection box, then click the >>
button to move the device to the Selected Devices box.
c.
Select the Throttle from all devices radio button to throttle the selected
trap from all discovered devices. The list of all devices appears in the
Selected Devices box.
d.
The default Throttle Period is 5 minutes. Use the up or down buttons
to increase or decrease the event throttle period.
e.
Click OK to save the settings and close the dialog.
The PCM application events are generated by the application, not devices; thus
the Select devices to throttle from option, and access to the Throttle Traps dialog
is disabled for application events.
You can also set the Throttle Events preferences by selecting the event in
the Throttled Events list, then using the right-click menu.
•
Use the Throttle option to throttle the event from all devices.
•
Use the Select device to throttle from... option to launch the Throttle
Traps dialog.
Restoring Throttled Events
To restore monitoring of a throttled event:
1.
Select the "throttled" event from the Throttled Events list.
2.
Select the Do not throttle option using the right-click menu, or
5-17
Using the Event Manager
Setting Event Manager Preferences
3.
To restore the event for selected devices, click the Throttle button to launch
the Throttle Traps dialog.
a.
Select the devices in the Selected Devices box
b.
Click the << button to remove the device from the "Selected Devices"
(to throttle from) list.
You can also select the Do not throttle option in the Throttled Traps dialog
to restore monitoring of the event for all devices.
5-18
6
Managing Network Devices
Chapter Contents
Using Device Manager Tools . . . . . . . . . . . . . . . . . . . . . 6-2
Rules for Configuring Device Access with PCM . . 6-3
Configuring Trap Receivers . . . . . . . . . . . . . . . . . . . . . . 6-4
Adding Trap Receivers . . . . . . . . . . . . . . . . . . . . . . 6-5
Modifying Trap Receivers . . . . . . . . . . . . . . . . . . . . 6-6
Deleting Trap Receivers . . . . . . . . . . . . . . . . . . . . . 6-6
Configuring Authorized Managers . . . . . . . . . . . . . . . . 6-7
Adding Authorized Managers . . . . . . . . . . . . . . . . . 6-8
Modifying Authorized Managers . . . . . . . . . . . . . . 6-9
Deleting Authorized Managers. . . . . . . . . . . . . . . . 6-9
Configuring Friendly Port Names. . . . . . . . . . . . . . . . 6-12
Configuring SNMP and CLI Access . . . . . . . . . . . . . . 6-13
Setting Communication Parameters in Devices . 6-14
Setting Communication Parameters in PCM . . . 6-23
Using Test Communication Parameters in PCM
6-35
Troubleshooting Device Communication Problems 6-37
Using Global Device Access Preferences . . . . . . . . . . 6-39
Setting Device Display Names . . . . . . . . . . . . . . . 6-39
Setting SNMP Preferences . . . . . . . . . . . . . . . . . . 6-42
Configuring SSH Keys . . . . . . . . . . . . . . . . . . . . . 6-44
Setting WebAgent Preferences . . . . . . . . . . . . . . . 6-45
Configuring RMON Alerts. . . . . . . . . . . . . . . . . . . . . . 6-47
Adding and Modifying RMON Alerts . . . . . . . . . . 6-48
Adding and Modifying RMON Alerts . . . . . . . . . . 6-48
Other Device Management Tools . . . . . . . . . . . . . . . . 6-50
Device Logs. . . . . . . . . . . . . . . . . . . . . . . . . . . . . . . . . . 6-51
Using the Device Log. . . . . . . . . . . . . . . . . . . . . . . 6-51
Using Device Syslog . . . . . . . . . . . . . . . . . . . . . . . 6-52
Using the Audit Log . . . . . . . . . . . . . . . . . . . . . . . 6-55
6-1
Managing Network Devices
Using Device Manager Tools
Using Device Manager Tools
The Device Access tools in PCM provide the basic functions to configure
communication parameters for ProCurve network devices including:
- Configuring trap receivers on a device.
- Setting Authorized managers for a device.
- Ability to Telnet (using SSH) to a device to
use the CLI.
- Ability to connect to a Device’s Web Agent.
- Ability to set Communication Parameters
for SNMP, Telnet, and CLI.
- Ability to test the communication parameters for the device.
To access the Device Manager, select the device to be managed in the Devices
List or the Navigation Tree then click the Device Access button in the toolbar to
display the Device Access Tools menu; or, you can right click on the device
and select Device Access –>Device Manager from the menu.
Figure 6-1. Device Manager window, default display.
The Device Manager window uses a tabbed display for the device management
functions supported. The default display shows the System Information tab, with
the system name, contact, and location if available. The availability of the
remaining tabs (Trap Receivers, Authorized Manager, and Port Names) will vary based
on the network device type and configuration. For example, ProCurve 420
wireless devices show only the System Information and Trap Receivers tab.
6-2
Managing Network Devices
Using Device Manager Tools
Rules for Configuring Device Access with PCM
PCM uses the following default configuration for accessing ProCurve Network devices using the following settings:
•
CLI access via Telnet, using SSH1 with Password Authentication
enabled, and no Manager Username defined.
•
SNMPv1/v2, with a Community name of “public” for read and write
access. User is set to Procurve, and no authentication protocol is set.
•
SSH key: (1024 default)
•
WebAgent access using HTTP on port 80.
This will work for all ProCurve devices discovered by PCM if:
•
No IP Authorized Managers are configured on the devices.
(or SNMP Authorized Managers on ProCurve 4000 Series)
•
Devices have an SNMP community name of public, with Read and
Write access set to Unrestricted.
To improve security you can alter the PCM default settings in Global Preferences, or the Device access settings using the "Communication Parameters"
functions available in the PCM Device Manager menu, keeping in mind the
following rules:
■
When you change the Global Preferences for Device Access, it
changes the parameters PCM uses to communicate with devices. This
will work for all devices configured to use the "PCM default" in the
Communications Parameters in PCM wizard. If you are not using the PCM
defaults for a device, changes in Global Preferences for Device Access
will not be applied.
■
If you set SSH or SNMPv3 security, or other device access settings
using the Communications Parameters in Device feature, then the
default PCM Device Access parameters will no longer work. You will
need to use the Communications Parameters in PCM to match
settings you changed on the Device. (any change in a device’s SNMP,
CLI, or WebAgent access or security settings should be matched in
the PCM Communication Parameters for the device.)
■
When you use the Communications Parameters in PCM to set the
PCM device access, it overrides the Device Access settings in the
Global Preferences for the selected devices only.
■
When in doubt, use the Test Communications Parameters in PCM to
check if PCM is able to access the device.
6-3
Managing Network Devices
Configuring Trap Receivers
Configuring Trap Receivers
The PCM management station is automatically registered as the default trap
receiver for switches discovered on the network; however, you can change
this using Global Preferences. Refer to “Global Discovery Preferences” on
page 3-20 for details. Use Device Manager option in the Device Access menu
to configure additional trap receivers.
The Trap Receivers tab displays the list of IP Addresses (devices) that the
selected device will send traps to. You can also add, delete or modify the Trap
receivers configured for the device.
Figure 6-2. Device Manager: Trap Receivers tab.
The listing shows the IP Address of the trap receiver, and the Event filters in
place for event types to be forwarded to the trap receiver.
You can refresh the display to check for changes in the Trap Receivers
configuration by clicking the Retrieve button in the toolbar.
NOTE:
PCM will only accept traps with a community name set to public. PCM will
drop any trap that has a community name of anything other than public.
For PCM-NNM, the Network Node Management server is set as the default
trap receiver, instead of the PCM management server.
6-4
Managing Network Devices
Configuring Trap Receivers
Adding Trap Receivers
Use Device Manager option in the Device Access menu to configure additional
trap receivers for a selected device.
1.
Click the Add Trap Receiver icon in the toolbar to display the Add Trap
Receiver dialog.
2.
Enter the IP Address of the device to receive traps.
The IP address must be in the proper format. You cannot use 0.0.0.0,
255.255.255.255, the multicast address, loopback address, or subnet
broadcast address of the device.
3.
Use the Event Log Filter drop-down menu to select the type of events you
want to include in the Event Log:
NONE
Do not use the Event Log
NOT INFO
Include all events except information events
CRITICAL
Include critical events only
ALL
Include all events
DEBUG
Include debug events only
If you are using the PCM-NNM module, events are logged in NNM.
Not all devices support Event log filters (such as wireless). When setting
trap receivers for such a device, the Event log filter field is disabled.
4.
Click Ok. A check will be performed to ensure the IP address is valid.
•
If it is a valid IP address the Add dialog is closed and the Trap
Receivers list is updated with the new entry.
•
If the IP address is invalid you will get an "Invalid IP address" error,
and the Add dialog remains open so you can enter the IP address.
You will also get an error when trying to add a trap receiver in any of the
following cases:
•
If the IP is a duplicate of an trap receiver already set for the device.
•
If the maximum number of trap receivers for the device is exceeded.
•
If the SNMP credentials are incorrect. Check communication parameters for the device to verify.
•
If the device is unreachable, either the connection or device is down.
6-5
Managing Network Devices
Configuring Trap Receivers
NOTE:
When PCM (server) starts up, it binds to port number 162, which is the port
that all incoming traps arrive on. If another process is already bound to that
port, PCM cannot receive traps. Make sure no process is bound to port 162.
Examples of applications that bind to port 162 are the Windows SNMP Trap
Receiver Service, HP OpenView, MG-Soft MIB Browser Trap Ringer, etc.
If another process is bound to port 162, simply terminate the process and
restart the PCM server. To restart the PCM server (in Windows):
•
Go to Control Panel->Administrative Tools-> Services.
•
Double click on the ProCurve Network Manager Server, click the Stop
button, and then click the Start button.
Modifying Trap Receivers
To modify a Trap Receiver, select it from the list, then click the Modify Trap
Receiver icon in the toolbar to display the Modify Trap Receiver dialog.
The Modify Trap Receivers dialog is displayed with the IP Address of the
selected trap receiver. Edit the IP address or Event log filter as needed then click
OK. The IP address will be validated (as described for adding a trap receiver).
Deleting Trap Receivers
To delete a Trap Receiver, select the entry from the list, then click the Delete
Trap Receiver icon in the toolbar. A confirmation pop-up will be displayed.
Click Yes to complete the process.
You can delete all trap receivers at the same time by clicking on the
Delete All icon in the toolbar.
6-6
Managing Network Devices
Configuring Authorized Managers
Configuring Authorized Managers
For devices that support IP-based Authorized Managers, you can use the PCM
Device manager to configure Authorized Managers. The Authorized Managers
feature uses IP addresses and masks to determine which stations (PCs or
workstations) can access the switch through the network. This covers access
through the following means:
•
Telnet and other terminal emulation applications
•
The switch’s web browser interface
•
SNMP (with a correct community name)
Also, when configured in the switch, the Authorized Managers feature takes
precedence over local passwords, TACACS+, RADIUS, Port-Based Access
Control (802.1X), and Port Security. This means that the IP address of a
networked management device must be authorized before the switch will try
to authenticate the device using other access security features. Thus, with
authorized managers configured, the station attempting to access the switch
must be included in the switch’s Authorized Managers list, as well as having
the correct username and passwords.
Click the Authorized Managers tab in the Device Manager window to view a
list of Authorized Managers on a device.
Figure 6-3. Device Manager: Authorized Managers tab
The Authorized Managers list gives the IP address, IP Mask, and Access
permissions for the device’s authorized managers.
6-7
Managing Network Devices
Configuring Authorized Managers
Click the Retrieve button in the toolbar to refresh the display and check for
any changes to the device’s Authorized Managers settings.
Note:
If you add an Authorized Manager for a device without adding PCM as an
Authorized manager, or if you change the Management Community name on
a device using the CLI or WebAgent, you will not be able to manage the device
using PCM.
Adding Authorized Managers
To add an Authorized Manager, click the Add button in the Authorized Managers toolbar. This will display the Add Authorized Managers dialog. Up to ten
authorized managers can be added to the device.
Figure 6-4. Add Authorized Manager dialog.
When using the Authorized Managers feature, the PCM server must be configured as an Authorized Manager for the device. The process for adding other
authorized managers is similar to adding your PCM server, shown below.
6-8
1.
Enter the IP Address of the management station. (For PCM, the station
must have the PCM application installed).
2.
Enter the IP Mask address.
•
The default IP Mask is 255.255.255.255 and allows switch access only
to a station having an IP address that is identical to the Authorized
Manager IP parameter. (“255” in an octet of the mask means that only
the exact value in the corresponding octet of the Authorized Manager
IP parameter is allowed in the IP address of an authorized management station.)
•
You can alter the mask and the Authorized Manager IP parameter to
specify ranges of authorized IP addresses. For example, a mask of
255.255.255.0 and any value for the Authorized Manager IP parameter
allows a range of 0 through 255 in the 4th octet of the authorized IP
Managing Network Devices
Configuring Authorized Managers
address, which enables a block of up to 256 IP addresses for IP
management access. A mask of 255.255.255.252 uses the 4th octet of
a given Authorized Manager IP address to authorize four IP addresses
for management station access.
3.
4.
Select the Access level for the station.
•
Manager: Enables full access (read and write) to device configuration
functions.
•
Operator: Enables read only functionality to device configurations.
Click Ok to complete the process.
The IP address will be validated. You will get an error message if it is invalid.
Otherwise, the Authorized Managers list is updated with the new information.
Note
The access levels for SSH and SNMPv3 can be set using the Communication
Parameters in Device Feature from the Device Access Menu. You can also
add additional Community Names and edit the Management Community
settings using this feature.
Modifying Authorized Managers
To modify an Authorized Manager, click the Modify button on the Authorized
Managers toolbar. This will open the Modify Authorized Manager dialog,
which has the same inputs as the Add Authorized Managers dialog. Edit the
existing entries, then click Ok.
Deleting Authorized Managers
To delete an Authorized Manager, select the entry in the Authorized Managers
list, then click the Delete button in the Authorized Managers toolbar.
You can also use the Delete All button to delete all the authorized manager
entries, without first having to select the entries.
Setting SNMP Authorized Managers on 1600m, 4000m and
8000m Devices
Because the 1600m, 4000m, and 8000m Devices support both SNMP and IP
authorized manager, the process for setting authorized managers on these
device types using PCM is different than for other devices. In the Device
Manager window for 1600M, 4000M and 8000M devices, you will see:
6-9
Managing Network Devices
Configuring Authorized Managers
■
An Authorized Manager tab to use for setting SNMP authorized
managers. The SNMP Authorized Managers uses a station’s IP address
with the SNMP Community Name, to restrict access to the specified
management stations.
■
An IP Authorized Manager tab to use for setting IP authorized
managers. The IP Authorized Manager on these devices are used to
authorize which stations can:
•
Access the switch’s web browser interface
•
Telnet into the switch console interface
•
Perform TFTP transfers of configuration files and software updates
on the switch
Setting the IP Authorized Manager is the same as described under “Adding
Authorized Managers” on page 6-8.
To set the SNMP authorized manager:
1.
Select the Authorized Manager tab.
Figure 6-5. Authorized Manager tab for 1600M, 4000M, and 8000M devices
6-10
2.
Select the associated SNMP Community Name from the list in the left pane
of the window. The list will vary based on what is currently configured on
the device. Use the Communications Parameter in Device feature in the Device
Access menu to add SNMP Community names.
3.
Click the Add button to display the Add Authorized Manager dialogue.
4.
Enter the IP address of the PCM server to be added as an authorized
manager.
Managing Network Devices
Configuring Authorized Managers
The IP address must be in the proper format, it can not be 0.0.0.0,
255.255.255.255, or the multicast address, loopback address or subnet
broadcast address of the device.
Figure 6-6. Add Authroized Manager dialog
5.
Enter the IP Mask.
The mask allows a range of IP addresses to be recognized as authorized
managers. The default IP mask is 255.255.255.255, which allows switch
access only to a management station with an IP address identical to the
authorized manager IP address. To specify ranges of authorized IP
addresses, set the fourth octet to indicate the number of authorized
managers. For example, a mask of 255.255.255.252 will allow four IP
addresses for management station access.
6.
7.
Select the Access level for the management station.
•
Manager: Enables full access (read and write) to device configuration
functions.
•
Operator: Enables read only functionality to device configurations.
Click Ok to complete the process.
The IP address will be validated. You will get an error message if it is invalid.
Otherwise, the Authorized Managers list will be updated with the new information.
Note:
Deleting or changing the management community named "public" may prevent access by PCM to the device. If security for network management is a
concern, ProCurve recommends you change the Write access on the device
to "Restricted" using the Communication Parameters in Device feature from
the Device Access menu, rather than changing the management community
name.
6-11
Managing Network Devices
Configuring Friendly Port Names
Configuring Friendly Port Names
The Device Manager also provides a way to assign "friendly" port names to
assist in tracking port configurations throughout the network. When the Use
Friendly Port Names option in the Global Preferences for Device Access is
enabled (see page 6-39), the following areas of PCM will display the friendly
port name (if available) instead of the interface name:
•
The traffic configuration windows.
•
The "Port Assignment Table" tab for a device.
•
The "Port Properties" tab for a VLAN under "network map".
•
Ports shown in the "Find Node" and "Node to Node Path Trace" results.
•
Ports shown in the Modify VLAN wizard.
•
The tool tips for network links on the maps.
To assign friendly port names:
1.
Select the device in the Devices List or Navigation tree, then select the
Device Manager option in the toolbar, or using the right-click menu (Device
Access->Device Manager).
2.
Click the Port Names tab in the Device Manager window.
Figure 6-7. Device Manager: Port Names tab
6-12
Managing Network Devices
Configuring SNMP and CLI Access
3.
Click to select the port to which you want to apply a Friendly Name.
This will enable the Port Friendly Name field so you can type in the name.
4.
Type in the Friendly Name you want to use.
5.
Repeat the process for each port that you want to assign a friendly name.
6.
Click Apply to update the port names for the Device.
Click Reset to return the Port Name to the previous setting.
Click Close to exit the window without applying the new Port Names.
Configuring SNMP and CLI Access
PCM provides a default device access configuration designed to work with
ProCurve devices. The default SNMP community names are set when you
install PCM. To provide support for newer ProCurve devices in more complex
network configurations using SNMP-V3, and SSH for CLI access, you can also
set the PCM device access parameters for individual devices using the Device
Manager Menu.
■
Use the Communication Parameters in Device option to create and change
the Access settings for SNMP and CLI (Telnet and/or SSH) on individual devices. You can also use this option to set or change the
Management Community Name on a device. Changes made to the
device using this option will also update the Device Access settings
for that device in PCM.
■
Use the Communication Parameters in PCM option is to set access parameters that PCM uses to communicate with a device via SNMP, CLI, and
the Web Agent. You would use this wizard if the device access settings
on a device (community name or SNMP) are changed using Telnet or
the WebAgent (not using the PCM interface wizards). Parameters set
in this wizard can also be used to override the settings in the (Global)
Preferences for Device Access that PCM uses to communicate with new
discovered devices.
■
Use the Test Communication Parameters option to compare SNMP and CLI
communication parameters stored on the device with those stored in
PCM, and verify that PCM can communicate properly with the device.
6-13
Managing Network Devices
Configuring SNMP and CLI Access
Setting Communication Parameters in Devices
The Communication Parameters in Device Wizard is used to create and change
SNMP and CLI parameters in devices. These parameters are changed in the
selected device(s) and in PCM.
PCM can use SNMP (SNMPV2 or SNMPV3), telnet, or SSH to communicate
with devices. SNMPV2 uses the traditional community name and read and
write access permissions for communication. SNMPV3 provides a secure
communication that requires PCM to use a username (governed by its
assigned security level) to communicate with the device.
If you launch the wizard for multiple devices, the wizard does not display any
information. However, if you launch the wizard for a single device, the wizard
displays the SNMP and CLI configurations for the selected device.
Tip : You can also use the "Device Management: Communication Parameters"
Action in the Policy Manager to reconfigure SNMP and CLI settings on devices.
1.
Select the device(s) in the Devices List, then select the Communication
Parameters in Device option from the Device Manager menu to launch the
Wizard.
2.
Click Next in the Welcome window to display the "Configure the settings"
window.
Figure 6-8. Communication Parameters in Device: Settings selection
6-14
Managing Network Devices
Configuring SNMP and CLI Access
3.
Select one or both of the settings to be configured, then click Next.
The following instructions describe the process if both options are selected.
NOTE:
If you are using the PCM-NNM module, NNM listens for SNMP Community
Name "events" from PCM, and uses the event data to update its own database
to match the changes made in PCM.
If you change the SNMP community name for the device and update the NNM
database using NNM’s SNMP configuration window, the new configuration is
uploaded to the PCM device database at the next discovery or device scan.
When SNMP Settings are selected, the wizard displays the Configure SNMP
settings window next.
Figure 6-9. Communication Parameters in Device: SNMP Settings selection
4.
Click to select the SNMP versions you want to configure, then click Next.
An unselected SNMP version will be disabled on the device.
5.
If you selected SNMPV2, the V2 Credentials Configuration window
displays.
The V2 Credentials Configuration window is used to configure community
names for access to devices using SNMPV2. Each community can have
different read and write access permissions. The management community
name is used by PCM to communicate with the selected device. Up to five
6-15
Managing Network Devices
Configuring SNMP and CLI Access
community names can be configured on the switches. Only two community names can be configured on a wireless device; one for the read
community name and one for write community name.
Figure 6-10. Communication Parameters in Device: SNMP V2 credentials
When this window is launched by selecting a single device, the information for all SNMPV2 community names currently configured in the device
are displayed. However, community names configured in wireless, 9315,
9308, 9304, 6308, and 6304 devices are not displayed, even when a single
device is selected. You can add new community names for these devices,
but you cannot modify or delete existing community names for these
devices.
When you access this window by selecting more than one device, this
window does not display any information. You can add community names
for all the selected devices, but you cannot modify or delete community
names currently configured on individual devices.
6.
6-16
Click the Add Names button in the toolbar. This will display the Add
Community Names dialog.
Managing Network Devices
Configuring SNMP and CLI Access
Figure 6-11. Device Communication Parameters : SNMPv2 Community name
–
–
–
Note:
Type in the SNMP Community Name to be added, up to 16 characters.
The characters "<" and ">" cannot be used.
Click the Read Access drop-down arrow and select the level of
permissions for read access:
Manager level provides access to the entire MIB
Operator level provides access to a restricted portion of the MIB.
Click the Write Access drop-down arrow and select the level of
permissions for write access:
Unrestricted provides read and write access to the MIB.
Restricted provides read only access to the MIB.
Wireless devices (AP -420, -520, and 530) and 9100 switches have only two
community names. The read and write community, with Manager restricted
and Manager unrestricted.
–
–
Click to select the Use this as the management community? option. This
will set this community name as the management community on
the device.
Click OK to save the changes and return to the V2 Credentials
Configuration window.
The entry will be validated to ensure the community name format,
and that the limit for community names on the device has not been
exceeded. If the community name is invalid, you will get an error
message. Otherwise, the V2 Credentials Configuration dialog is
updated with the new entry.
Up to five community names for each device can be defined through
PCM.
A maximum of two community names can be configured on a wireless
device. One is used as the read community name, and another is used
as the write community name. The community name added as manager restricted is set as the read community, and the one added as
manager unrestricted is set as the write community on the device.
6-17
Managing Network Devices
Configuring SNMP and CLI Access
a.
Click Next in the V2 Credentials Configuration dialog to continue.
If you selected only SNMP settings, and the SNMP V2 option, the procedure
is finished at this point.
7.
If you selected SNMP V3, the SNMP V3 Credentials window displays.
Use this window to view and change SNMP V3 USM users configured on
the selected device.
SNMPV3 provides a secure communication that requires PCM to use a
username (governed by its assigned security level) to communicate with
the device.
Figure 6-12. Communication Parameters in Device: SNMP V3 credentials
If you selected more than one device before launching the wizard, the
credentials columns will be blank. You can add a USM users for all
selected devices, but you must select devices individually in order to
modify or delete USM user information.
USM users allow access to devices using SNMPV3. WHen configured, PCM
will use the management USM user to communicate with the selected
device. Up to five USM users for each device can be defined.
a.
6-18
Click the Add Names button in the toolbar. This will display the Add USM
User dialog.
Managing Network Devices
Configuring SNMP and CLI Access
Figure 6-13. Device Communication Parameters : SNMP V3 Add USM user
Enter the USM User information:
– In the Username field type the USM user name you want to create.
A USM user name must be unique and cannot contain the > or <
character.
– Select the desired Authentication Protocol from the drop-down
menu.
– In the Auth Password field, type the password you want to use for
authentication.
– Select the desired Protocol from the Priv Protocol drop-down
menu.
– In the Priv Password field, type the password you want to use.
– Click to select the Use this as the management USM User? option. This
will set the USM user as the management USM user.
– Click OK to save the changes and return to the V3 Credentials
Configuration window.
The entry will be validated to ensure the USM user name and password format. If the USM user name or password is invalid, you will
get an error message. Otherwise, the V3 Credentials Configuration
dialog is updated with the new USM User entry.
Note:
The username and password length requirements vary between device types.
If you do not match the requirements for the selected device the configuration
will fail.
b.
Click Next in the V3 Credentials Configuration dialog to continue.
If you selected only SNMP settings and the SNMP V3 option, the procedure
is finished at this point.
6-19
Managing Network Devices
Configuring SNMP and CLI Access
8.
If you selected CLI Settings in the Configure Settings window, the CLI
Settings Configuration window displays.
Select Telnet or SSH, then click Next to continue.
Figure 6-14. Device Communication Parameters: CLI mode selection
If an option is not selected, that option will be disabled on the switch.
Currently SSH configuration is not supported on 420 wireless devices,
9315, 9308, 9304, 6308, and 6304 switches.
6-20
Managing Network Devices
Configuring SNMP and CLI Access
9.
If you selected Telnet, the User Credential Configuration window displays.
Figure 6-15. Device Communication Parameters: Telnet User Credentials
a.
Select Leave the existing settings, then click Next to continue, or
b.
Select Enable Password Protection, then:
– To set up a manager login, type the new manager user name in
the Mgr Username field and the associated password in the
Mgr Password field.
– To set up an operator login, type the new operator user name in
the Opr Username field and the associated password in the
Opr Password field.
c.
Click Next to continue.
6-21
Managing Network Devices
Configuring SNMP and CLI Access
10. If you selected SSH in the CLI Settings Configuration, the SSH Configuration window displays.
Figure 6-16. Device Communication Parameters: SSH Configuration
11. Select the SSH version, and the Authentication type, then click Next
Note:
Key authentication for SSH1 is not supported.
If you selected Password Authentication, the User Credentials Configuration
window displays. This is the same window as used for setting Telnet User
Credentials. Follow the procedure described for Step 10 on page 6-21.
If you selected Key Authentication, after you click Next the Summary window
displays.
12. When you have finished setting the Communication Parameters, the
Results window displays, indicating if the communication parameter
settings for the Device are successfully configured. If not, you will see a
message in the Results panel indicating the configuration was not completed.
6-22
Managing Network Devices
Configuring SNMP and CLI Access
Setting Communication Parameters in PCM
The Communication Parameters in PCM Wizard is used to view and change
the CLI, SNMP, and WebAgent parameters used by PCM to communicate with
a device. Changes made in this window are stored in PCM, but not in the
selected device. Use the Communication Parameters in Device Wizard to
update CLI and SNMP parameters in PCM and the device.
If you launch the wizard by selecting multiple devices, the fields in the wizard
are empty. If you launch the wizard by selecting a single device, the wizard
displays values stored in PCM for the selected device.
To override the Global Preferences that PCM uses for Device Access via SNMP,
CLI, and WebAgent on selected devices:
1.
Select the device (or devices) in the Devices List or the Navigation Tree
then click the Device Access button in the toolbar to display the Device
Access Tools menu; or, you can right click on a device and select
Device Access –>Communication Parameters in PCM from the menu.
This launches the Communication Parameters in ProCurve Manager wizard.
Figure 6-17. Communication Parameters in PCM.
6-23
Managing Network Devices
Configuring SNMP and CLI Access
1.
Select any one, or combination of the checkboxes (defined below), then
click Next.
Select:
To do this:
SNMP Settings
Change the settings PCM uses for SNMP communication
CLI Settings
Change the settings PCM uses for telnet or SSH
communication
Web Agent Settings Change the settings PCM uses to launch the system’s
default web browser and target the device’s web agent
Instructions for setting configuration parameters follow, in the order they
would appear if all three options are selected.
2.
If you selected the SNMP settings, the Configure SNMP Timeout and Retries
window displays.
Figure 6-18. Communication Parameters in PCM: SNMP configuration
3.
Click Next to continue, and accept the PCM defaults, or
a.
Click the checkbox to de-select Use PCM Defaults,
b.
Set the Timeout and Retries intervals as needed.
Click the up or down button to increase or decrease the number of
seconds before a timing out the connection, and the number of times
to retry connecting when a Timeout occurs.
c.
6-24
Click Next to continue to the Configure SNMP Version window.
Managing Network Devices
Configuring SNMP and CLI Access
Figure 6-19. Communication Parameters in PCM: SNMP version
4.
Click Next to continue, and accept the PCM default (SNMPV2), or
a.
Click the checkbox to de-select Use PCM Defaults,
b.
Click to select the version (SNMP V2 or SNMP V3) you want PCM to use
with the selected device.
If the device does not support SNMP V3, the button is disabled.
If multiple devices are selected, and one of the selected devices
supports SNMP V3, the button is enabled; however, the SNMP V3
settings will only be applied to the device or devices that support it.
It will be ignored on devices that do not support SNMP V3, and SNMP
V1/V2 remains the version used for device access.
c.
5.
Click Next to continue to the Configure SNMP Credentials window.
For SNMP V2, the next window is the "Configure SNMP V2 Credentials"
6-25
Managing Network Devices
Configuring SNMP and CLI Access
Figure 6-20. Communication Parameters in PCM: SNMP V2 Credentials
6.
Note:
Click Next to continue, and accept the PCM defaults, or
a.
Click the checkbox to de-select Use PCM Defaults,
b.
Type in the SNMP Read Community name and Write Community name
that PCM will use with the device. This will override the Preferences
setting for the selected device.
PCM uses the default SNMP community name of "public" for both Read and
Write Community Names. These community names can be changed during
installation, or in the Global Preferences (Preferences–>Device Access–>SNMP).
If you change the SNMP Credentials used by PCM for device access, use the
Test Communication Parameters in PCM feature to verify PCM’s ability to
access the device.
7.
6-26
For SNMP V3, the next window is the "Configure SNMP V3 Credentials"
Managing Network Devices
Configuring SNMP and CLI Access
Figure 6-21. Communication Parameters in PCM: SNMP V3 Credentials
8.
Click Next to continue, and accept the PCM defaults, or
a.
Click the checkbox to de-select Use PCM Defaults,
b.
Type in the Username.
c.
Select the Authorization Protocol if used, and type in the Authorization
Password.
d.
Select the Privacy Protocol if used, and type in the Privacy Password.
e.
Click Next to continue.
If you are changing only the SNMP parameters, you would finish the
procedure at this point.
9.
I f you selected the CLI Settings, the Configure CLI Timeout and Retries
window displays.
6-27
Managing Network Devices
Configuring SNMP and CLI Access
Figure 6-22. Communication Parameters in PCM: CLI configuration
10. Click Next to continue, and accept the PCM defaults, or
a.
Click the checkbox to de-select Use PCM Defaults,
b.
Set the Timeout and Retries intervals as needed.
Click the up or down button to increase or decrease the number of
seconds before a timing out the connection, and the number of times
to retry connecting when a Timeout occurs.
c.
6-28
Click Next to continue to the Configure CLI Mode window.
Managing Network Devices
Configuring SNMP and CLI Access
Figure 6-23. Communication Parameters in PCM: CLI Mode selection
11. Click Next to continue, and accept the PCM default (Telnet), or
a.
Click the checkbox to de-select Use PCM Defaults,
b.
Click to select the CLI mode to use with the selected device.
c.
Click Next to continue
12. If you select Telnet, the Configure CLI User Credentials window displays.
6-29
Managing Network Devices
Configuring SNMP and CLI Access
Figure 6-24. Communication Parameters in PCM: CLI Credentials
13. Click Next to continue, and accept the PCM defaults, or
a.
Click the checkbox to de-select Use PCM Defaults, and enable the
Username and Password fields.
b.
In the Mgr UserName field, type the new manager user name.
c.
In the Mgr Password field, type the Manager password.
d.
In the Opr UserName field, type the new Operator user name. (optional
e.
In the Opr Password field, type the Operator password.
NOTE: The user and password entries are not required to continue; however
if left blank.
f.
Click Next to continue.
14. If you selected SSH, the Configure SSH Credentials window displays.
6-30
Managing Network Devices
Configuring SNMP and CLI Access
Figure 6-25. Communication Parameters in PCM: SSH Credentials
15. Click Next to continue, and accept the PCM defaults, or
a.
Click the checkbox to de-select Use PCM Defaults,
b.
Click the radio button to select the SSH version used by the device:
SSH1 or SSH2.
c.
For SSH 2, click the radio button to select the SSH Authentication
method to use: Key or Password authentication.
d.
For SSH1, Password is automatically selected and Key is disabled.
6-31
Managing Network Devices
Configuring SNMP and CLI Access
e.
For SSH 2 using Key authentication:
i. enter the Port number PCM will use to connect with the device.
ii. Enter the Key that PCM will use to authenticate with the device.
To get the public fingerprint key of the device, on the Device CLI
execute the command:
show crypto host-public-key fingerprint
Copy the version specific finger print.For SSH2 you would copy
only the second line.
"Paste" the device’s public-key finger print in the Key field in the
PCM wizard.
f.
If you selected SSH 1, or SSH 2 with Password authentication, click
Next to continue to the Configure CLI User Credentials window.
These entries are the same as described for step 13 on page 6-30.
g.
If you selected SSH2 with Key authentication, click Finish to save the
configuration and exit the wizard.
If you selected only CLI settings to configure, you would finish the procedure
at this point.
16. If you selected Web Agent settings, the Configure WebAgent Credentials
window displays.
6-32
Managing Network Devices
Configuring SNMP and CLI Access
Figure 6-26. Communication Parameters in PCM: Web Agent Credentials
17. Click Next to continue, and accept the PCM defaults, or
a.
Click the checkbox to de-select Use PCM Defaults,
b.
Click one of the radio buttons to select the WebAgent protocol to be
used (Http or Https) or to Disable WebAgent.
c.
Select the Port that PCM will use to communicate with the device.
d.
Click Finish to complete the procedure.
Modifying Community Names
The PCM Management Community Name is set at installation. If you do not
specify one, PCM will use a default Management Community name of "public,"
with full read and write privileges to the device. This is used by PCM for autodiscovery, traffic monitoring, SNMP trap generation and threshold setting. If
security for network management is a concern, it is recommended that you
change the write access for the "public" community to "restricted."
NOTE:
If you are using the PCM-NNM module, the default Community Names are
provided by NNM. You can still modify the Management Community names
using the procedure below. The data will be passed to NNM from the event
generated by PCM when you apply the change to the device.
6-33
Managing Network Devices
Configuring SNMP and CLI Access
To modify a Community Name for a Device,
1.
Select the device in the Devices List, then launch the
Device Access ->Communication Parameters in Device Wizard
2.
Select the SNMP Settings, then the SNMP version (SNMPV1/V2 or SNMPV3).
3.
In the Credentials Configuration window, select the Community name you
want to use as the Management Community, then click the Modify button
in the toolbar. This will display the Modify Community Names dialog,
similar to the Add Community Names dialog.
If the Community Name you want to use is not found, add the Community
Name and select it as the management community. When you click OK, a
validity check on the community name will be performed. If it is valid, the
Community Names list will be updated with the new entry.
4.
To set the name as the Management Community, select
Use this as the Management Community?, then click OK to save the change
and close the dialog.
5.
When you return to the Credentials Configuration window, the changes
will be reflected in the Community Names listing.
The name selected as the Management community appears at the top of
the list and the Manager checkbox is selected.
Deleting Community Names
To delete a Community Name:
6-34
1.
Select the device in the Devices List, then launch the
Device Access ->Communication Parameters in Device Wizard
2.
Select the SNMP Settings, then the SNMP version (SNMPV1/V2 or SNMPV3).
3.
In the Credentials Configuration window, select the community name you
want to delete, then click the Delete button in the toolbar. A confirmation
dialog will be displayed.
4.
Click Yes to complete the delete process. If you have selected the Management Community Name, you will get an error notice telling you are not
allowed to delete the Management Community Name.
Managing Network Devices
Configuring SNMP and CLI Access
To delete all the currently configured Community Names for the device, select
the Delete All icon in the toolbar.
Using Test Communication Parameters in PCM
The Test Communication Parameters in PCM window is used to compare
SNMP and CLI communication parameters stored on a device and those stored
in PCM for the device. If the values match, the test succeeds and PCM can
communicate with the device using the SNMP or CLI communication parameters defined in PCM.
The Test Communication Parameters window displays the following information for selected devices:
Column
Description
Device
Identifies the devices being tested by IP address and/or
DNS name
CLI Mode
Displays Telnet or SSH, depending on the mode used by
PCM to communicate with the device
CLI Manager
Displays Success if PCM was able to login to the device
through CLI as the manager, or displays Failure if PCM could
not login to the device through CLI as the manager.
CLI Operator
Displays Success if PCM was able to login to the device
through CLI as the operator, or displays Failure if PCM could
not login to the device through CLI as the operator.
SNMP
Version
Identifies SNMPV2 or SNMPV3, depending on the SNMP
version used by PCM to communicate with the device
SNMP Read
Community
If using SNMPV2, displays Success if PCM was able to read
data from the device or No Access if PCM was unable to
read data from the device
SNMP Write
Community
If using SNMPV2, displays Success if PCM was able to write
data in the device or No Access if PCM was unable to write
data in the device
SNMPV3
If using SNMPV3, displays Success if PCM was able to
communicate with the device or Unsuccessful if PCM was
unable to communicate with the device
Status
Current status of the test
6-35
Managing Network Devices
Configuring SNMP and CLI Access
Figure 6-27. Test Communication Parameters results window
To test communication parameters:
1.
Navigate to the Test Communication Parameters in PCM window.
2.
In the navigation tree, right-click the device or device group to test.
3.
Select Device Access from the drop-down list.
4.
Select Test Communication Parameters in PCM from the Device Access
drop-down list.
Alternately, you can:
1.
In a device-related window, select one or more devices to be tested.
2.
Click the Device Access button on the toolbar.
3.
Select Test Communication Parameters in PCM from the Device Access
drop-down list.
Check the results in the Test Communication Parameters window to
ensure that all communications were successful.
If the test failed, change the communication parameters in PCM. Refer to
“Troubleshooting Device Communication Problems” on page 6-37 for
additional information.
To abort testing at any time, click Halt, which stops the test process without
closing the window, or click Close, which exits the process and closes the
window.
4.
6-36
Click Close to exit the Test Communications Parameter wizard.
Managing Network Devices
Configuring SNMP and CLI Access
Troubleshooting Device Communication Problems
If PCM is unable to communicate with a ProCurve device on your network, it
may be caused by one or more of the following problems:
Note:
■
The default switch configuration is set to Menu instead of CLI. Use
the Setup command on the switch CLI to change the Login Default to
CLI.
■
The Primary SSH login is not set as the "Public Key" on the switch.
■
The Client Public Key is incorrectly copied into PCM.
■
The SSH version set in PCM is mismatched with the SSH version
supported on the switch.
■
The SSH key size for the key generated on PCM is mismatched with
the key size set on the switch.
■
Some of the switches support only a specific version of SSH. If you
generate a key on PCM, both SSH ver1 and ver2 keys are generated.
Be sure to copy the correct key to the switch.
When the SSH key is regenerated on PCM (using the Preferences for Device
Access->SSH Key), all device communications between PCM and devices
using the old key will fail until the new Key has been copied to the device.
Similarly, if the SSH key is regenerated on a device, communications with PCM
will fail until the key is copied to PCM.
You can use the following procedures to check SSH related configurations.
For SSH with Password Authentication:
1.
Select a switch that supports SSH
2.
Use the Test Communication Parameters wizard to check that the switch and
PCM are in sync with each other.
3.
Telnet to switch and run the following commands:
$ ip ssh key-size 1024
$ crypto key generate ssh rsa
$ ip ssh
4.
Use the Communication Parameters in PCM wizard for the device. Modify the
CLI options to configure the SSH (Password) settings to match the switch.
6-37
Managing Network Devices
Configuring SNMP and CLI Access
For SSH with Key Authentication:
1.
Go to "Preferences->Device Access->SSH Key"
2.
Set the key-size as 1024 and click Generate new key pair.
3.
Verify the SSH version installed on the switch.
4.
TFTP the version specific pub-key-file from the PNM/server/config directory:
Telnet to the device and execute the command:
copy tftp pub-key-file <ip address> procurveSSH2.pub
where ip address is the IP Address of the PCM server.
If you are using SSH1, then enter procurveSSH1.pub in the tftp command.
5.
Get the finger-print of the "host-public-key" from the switch:
$ show ip host-public-key fingerprint
Note: Copy only the line for the SSH key type needed (SSH1 or SSH2).
This is what you will "paste" into the Key field in the PCM wizard.
6.
Use the Communication Parameters in PCM wizard for the device. Modify the
CLI options to configure the SSH (Key Authentication) settings to match
the switch.
This should allow for launching the SSH terminal after Authentication.
6-38
Managing Network Devices
Using Global Device Access Preferences
Using Global Device Access Preferences
In addition to the Device Manager functions, PCM provides Global Preferences for device access, including SNMP and Telnet access information
preferences.
To change the Global Device Access settings, click the Preferences icon in the
PCM toolbar, then expand the Device Access node in the menu to display the
available options.
Setting Device Display Names
Use the Global:Device Access window to set the Device Display Name and Port
Name displays in PCM.
1.
Select Device Access in the Preferences menu.
Figure 6-28. Preferences, Global:Device Access window
2.
Click the check box to select Use Port Friendly Names to display configured
port names.
6-39
Managing Network Devices
Using Global Device Access Preferences
3.
To use a standard device name display, click the radio button next to the
desired Device Display Name type.
4.
To create a custom device name display, click the Custom format string radio
button, and then type the text or codes you want to use for the device
names in the Format String field, possible codes are:
•
%D - DNS name
•
%I - IP address
•
%S - SNMP hostname
For example, type: %S SNMP hostname
to display: Thunderbox SNMP hostname.
5.
Click OK to save the Display Name settings and close the window.
Setting CLI Preferences
The global CLI window is used to view and change the default communications parameters for Command Line Interface (CLI) access from PCM to
ProCurve devices. The default configuration uses Telnet, with the Username
and Password set to public. However, you can change the default during
installation, or at any time using the Global Preferences, Device Access
window.
If a new device has been discovered by PCM, but you are not getting configuration information, or VLAN information (if applicable) for the device, you
may need to set the Telnet username and password for the device in PCM. To
change the CLI device access settings for a communications with a specific
device, use the Communication Parameters in PCM Wizard.
To change the PCM global preferences for CLI mode:
6-40
1.
Click the CLI option under Device Access in the Preferences menu to display
the CLI Preferences window.
2.
Click the radio button next to the mode you want to use to communicate
with devices.
•
Use Telnet to enable CLI communication and disable SSH.
•
Use SSH for CLI communication and disable Telnet.
3.
Click the arrows to increase or decrease the Timeout parameter.
4.
Click the up or down arrows to increase or decrease the Retries parameter.
The maximum is 5 retries to connect to a device.
Managing Network Devices
Using Global Device Access Preferences
Figure 6-29. Global Preferences, CLI access window
5.
NOTE:
For SSH Mode:
a.
Select the SSH Version: SSH1, or SSH2
b.
Select the SSH Authentication method: Password or Key.
c.
For Password authentication, enter the User name and password that
SSH will use to authorize communication with the device in the Mgr
Username and Mgr Password fields.
d.
For Key authentication, type the SSH port number to be used for CLI
communication.
When the SSH key is regenerated on PCM (in the Preferences for Device
Access), communications between PCM and devices using the old key will
fail until the new Key has been copied to the device. See “Troubleshooting
Device Communication Problems” on page 6-37 for details on resolving
the issue.
6.
For Telnet mode:
•
For the Manager login, type the manager user name in the
Mgr Username field and the associated password in the Mgr Password
field.
6-41
Managing Network Devices
Using Global Device Access Preferences
•
7.
To set up an operator login, type the new operator user name in the
Opr Username field and the associated password in the Opr Password field.
Click OK to save your changes and exit the window.
Click Cancel to exit the window without saving your changes.
Setting SNMP Preferences
The global SNMP preferences are used by PCM to access new devices found
during discovery.
You can change ProCurve Manager's default SNMP community names (public)
during installation or in the Global SNMP preferences. The Global preferences
set the PCM parameters for accessing devices. they do not change individual
device configuration. To change the SNMP community names for communication between PCM and a specific device, use the Communication Parameters in PCM Wizard (see page 6-14).
Click the Preferences ->Device Access->SNMP option to open the SNMP Preferences
window (reference figure 6-30 on the next page)
To change global SNMP values:
1.
For Primary Discovery version, click the radio button next to the SNMP
version you want to use (SNMPV1/2 or SNMPV3).
Repeat the selection for the Secondary Discovery version.
This sets the SNMP version used to communicate with devices during
discovery. Initially, PCM uses the Primary SNMP version. If this attempt
fails, PCM uses the Secondary SNMP version. The following table
describes how PCM uses the SNMP version settings.
6-42
Version
Description
SNMPV2
Discovery uses only SNMPV2 to discover devices. Devices that do not
support SNMPV2 will not be discovered.
SNMPV3
Discovery uses only SNMPV3 to discover devices. Devices that do not
support SNMPV3 will not be discovered.
SNMPV2
and
SNMPV3
Discovery initially uses SNMPV3 to discover devices. If communications
fail, discovery attempts to communicate with the device with SNMPV2.
Use this option if your network contains SNMPV2 and SNMPV3 devices.
None
Secondary version is not configured on the device
Managing Network Devices
Using Global Device Access Preferences
Figure 6-30. Global Preferences, Device Access: SNMP window
2.
Click the up or down arrows to set the SNMP timeout parameter. The
maximum is 60 seconds.
3.
Click the up or down arrows to set the SNMP retries parameter. The
maximum is 5 retries.
4.
If you selected SNMPV2 for either the Primary or Secondary SNMP version,
in the Read Community field, type the default community name used to read
data to the device. The read community name can consist of 1-16 characters including special characters except >, <, and spaces.
Repeat the procedure to set the Write Community name.
5.
If you selected SNMPV3 for either the Primary or Secondary SNMP version:
a.
In the UserName field, type the USM user name used to communicate
with the device. A USM user name must be unique and cannot contain
the > or < character.
The following steps are optional.
b.
Select the desired Authentication Protocol from the drop-down menu.
c.
In the Authentication Password field, type the password you want to use
for authentication.
6-43
Managing Network Devices
Using Global Device Access Preferences
6.
d.
Select the desired Privacy Protocol from the drop-down menu.
e.
In the Privacy Password field, type the password you want to use.
Click OK to save your changes and exit the window.
Click Cancel to exit the window without saving your changes.
NOTE:
If you are using the PCM-NNM module, the default SNMP Community names
will be read from the NNM database initially, and at periodic intervals after
start up. If you change the default Community names in PCM, the information
will be updated in NNM at the next synchronization interval. However, changing the Default SNMP Community Name in PCM Global preferences will not
update the device. You need to update the device separately using the PCM
Device Manager, or other method.
The Global Preferences for SNMP Device Access are used to discover new
devices on the managed subnet(s). If a device does not appear in the navigation tree or Devices List, try using the Manual Discovery wizard to discover
the device. If Manual Discovery connects to the device, but cannot use SNMP
to communicate, then you can either:
■
Specify the current SNMP Read Community name for the device in
Manual Discovery, or
■
Use the device console to change the SNMP Read Community name
on the device to match the SNMP Read Community name in PCM’s
Global SNMP (Device Access) preferences.
Configuring SSH Keys
If you are using SSH for communication between PCM and ProCurve devices,
you can use SSH Key preferences to view and change SSH Key pairs used for
Public Key Authentication. By default, the SSH Key window shows already
generated Public keys for SSH.
To create a new SSH Public Key pair:
1.
6-44
Click the SSH Key option under Device Access in the Preferences menu.
Managing Network Devices
Using Global Device Access Preferences
Figure 6-31. Global Preferences, SSH Key window
Note:
2.
Set the Key Size: 768 or 1024. This is the size of the generated key the switch
uses for negotiations with an SSH Client. A larger key provides greater
security; a smaller key results in faster authentication.
3.
Click Generate new key pair and new public keys are generated and display
in the window.
4.
Click OK to save the changes to PCM, and close the window.
Click Apply to save the changes to PCM, without closing the window.
Click Cancel to close the window without saving the Key changes.
When the SSH key is regenerated on PCM (using the Preferences:
Global ->Device Access->SSH Key), communications between PCM and
devices using the old key will fail until the new Key has been copied to the
device.
Setting WebAgent Preferences
For ProCurve devices that have a Web browser interface for device configuration, you can launch a WebAgent from the PCM Client to access the device.
As with SNMP and CLI, PCM comes configured with default settings for device
access via the WebAgent.
To change the PCM global preferences for WebAgent mode:
1.
Click the WebAgent option under Device Access in the Preferences menu.
6-45
Managing Network Devices
Using Global Device Access Preferences
Figure 6-32. Global Preferences: WebAgent access window
6-46
2.
Select the Protocol, HTTP or HTTPS, that PCM WebAgent will use to access
devices.
3.
Enter the Port number that the WebAgent will use. You can type in a
number, or use the arrow buttons to increase or decrease the Port number.
4.
Click OK to save your changes and exit the window.
Click Apply at any time to save your changes.
Click Cancel to exit the window without saving your changes.
Managing Network Devices
Configuring RMON Alerts
Configuring RMON Alerts
The RMON Manager (Remote Monitoring) feature in PCM provides an interface you can use to configure RMON alert thresholds for monitoring "ethernet
statistics" on a device port or VLAN. When an RMON threshold is exceeded
on a monitored device an alert is sent to all trap receivers configured for the
device.
To review or configure the RMON alert thresholds set for a device, select the
device in the Devices List then click the Launch RMON Manager icon in the toolbar.
The RMON Manager window displays with a list of currently configured alert
thresholds for the selected device.
Figure 6-33. RMON Manager main window.
(Refer to RFC 2819 for details on implementation of RMON and use of RMON
Statistics in the MIB)
6-47
Managing Network Devices
Configuring RMON Alerts
Adding and Modifying RMON Alerts
To set a new RMON alert, click Add to display the RMON Thresholds dialog. To
modify an existing alert, select it on the list of thresholds, then click Modify.
Figure 6-34. Add/Modify RMON Thresholds dialog
RMON alerts are composed of five elements: interface, counter, rising threshold, falling threshold, and interval, defined as follows:
Interface: Specifies the port on the target device on which to configure the
RMON alert. Select from the available ports using the drop down menu. You
can also select a VLAN interface from the list to measure traffic to and from
the VLAN on any port on the switch configured for that VLAN.
Counter: This defines the specific RMON variable to monitor. A trap is sent to
all listed trap receivers if the counter variable crosses the rising or falling
threshold values. Select the Counter type from the drop down menu.
Rising Threshold: This numeric value defines the upper limit for the monitored
variable. Should the variable exceed this limit a trap will be sent.
Use the up and down buttons to increase or decrease the threshold value, or
type in the desired value.
6-48
Managing Network Devices
Configuring RMON Alerts
Falling Threshold: This value defines the lower limit for the monitored variable.
Should the variable drop below this value a trap will be sent.
Use the up and down buttons to increase or decrease the threshold value, or
type in the desired value.
Interval: This value specifies the variable sample rate in seconds.
Use the up and down buttons to increase or decrease the threshold value.
Click OK to complete the add or modify process and close the dialog. The
RMON Manager alert threshold listing will be updated with the new settings.
The RMON Manager has a built in mechanism to prevent multiple events from
being generated should the sampled value oscillate around one of the threshold values. Thus, in order for a rising threshold event to occur the sampled
variable must first go below the falling threshold value. Conversely, before a
falling threshold event can occur, the sampled variable must first exceed the
rising threshold value.
For example, if the sampled variable exceeds the rising threshold value, a
Rising threshold alert will occur. If the sampled value drops back below the
rising threshold and then rises above the rising threshold, an alert will not
occur. In order for another Rising alert to occur, a Falling threshold alert must
first occur.
Sample Rising Alert message in the PCM events (SNMP Traps) tab display:
%2 is above threshold %5; value = %4. (Sample type = %3; alarm index = %1)
Where:
%2 = the counter being monitored
%5 = the threshold level the user set
%4 = the value of the counter when the trap was generated
%3 = the sample type used (absolute or delta, represented as numeric
values defined in the MIB)
%1 = the alarm
Deleting RMON Alerts
To delete an RMON Alerts from the device, select the alert in the list in the
RMON Manager window, then click Delete. The alert is removed from the list in
the RMON Manager window.
6-49
Managing Network Devices
Other Device Management Tools
Other Device Management Tools
In addition to the functions provided by the PCM Device Manager, you can
also access the Web Agent for the switch, or launch a telnet session to the
Menu Interface for the switch from within the PCM display.
To access the Web Agent for a device, select the device in the Devices List or in
the navigation tree, then open the "right click" menu and select the Connect to
Web Agent option. This will launch the Web Agent browser, with the Status tab
displayed.
To Telnet to a device, select the device in the Devices List or in the navigation
tree, then open the "right click" menu and select the Telnet option. This will
open a Telnet session to the device and launch the Main Menu Interface.
You can also select devices in the Devices List, then select the CLI icon from
the Device Configuration options menu in the toolbar to launch the CLI wizard.
See “Using the CLI Wizard” on page 9-18 for more information.
For details on using the Web Agent, Menu Interface, and CLI, refer to the
Configuration Management manuals that came with the switch device.
6-50
Managing Network Devices
Device Logs
Device Logs
This section describes the tools provided with this release of PCM that you
can use to assist in finding and resolving problems that occur in individual
devices on the network. For more detailed information on troubleshooting
device problems, refer to the "Management and Configuration Guide" that
came with your switch device.
Using the Device Log
The PCM application provides a Device Log viewer you can use to check the
log entries created for a device by PCM. Select a device in the Devices List, then
click the Device Log Viewer icon in the toolbar to display the Device Log Viewer
window.
The Device Log Viewer shows a list of log entries for actions performed by
PCM on the device. It will list the type of log entry, when it was created, and
the log file name, along with additional details on data stored in the log file.
You can drag the window pane separator to increase the detail section of the
Device Log Viewer window. You can also copy and paste the device log entries
to another application (such as notepad or MS Word) if desired.
Figure 6-35. Device Log Viewer window
The Client IP is the address of the PCM console from which the action
(command) was sent to the device.
6-51
Managing Network Devices
Device Logs
Using Device Syslog
Syslog is a logging tool that allows a "client" switch to send event notification
messages to a networked device operating with the Syslog Server software.
To enable the Device Syslog function in PCM, you need to set the PCM server
as the Syslog server. You can use the CLI functionality in PCM to do this,
entering the command:
config logging <syslog-ip-addr>
where syslog-ip-addr is the IP address of the PCM server. For additional
information refer to the section on "Syslog Operation" in the "Management and
Configuration Guide" for your switch.
To review the Device Syslog in PCM, double-click on the device node in the
tree or Devices List to display the Device Properties window, then click the
Device Syslog tab.
Figure 6-36. Device Syslog window.
The information in the Device syslog is similar to data found in the Events tab.
Severity: The Severity column shows the severity of each event, one of:
6-52
•
Informational - Routine events
•
Warning - Unexpected service behavior
•
Minor - Minor switch error that may impact performance
Managing Network Devices
Device Logs
•
Major - Major switch error with potential of inhibiting some switch
operations
•
Critical - Severe switch error with the potential of halting all switch
operations
Status: The Status column identifies whether the event has been acknowledged. A green asterisk indicates that the event has been acknowledged, and
a red asterisk indicates that the event is new and has not been acknowledged.
Date: The Date column identifies the date and time when the event occurred.
The date is shown in the Day of Week-Month-Day-Time-Year format. Time is
shown in the 24-hour clock format hh:mm:ss followed by the time zone.
Description: The Description column provides a short description of the
event. The description is derived from a list of predefined event type descriptions included with the PCM application.
Filtering Syslog Events
Use the Filter field at the bottom of Device Syslog window to enter text to
search for within the event "Description". Just type in the word(s) you are
searching for, then click Apply Filter. The listing will be resorted so that all events
in which the filter text is found are at the top of the list.
Acknowledging Syslog Events
Acknowledging an event indicates that you are aware of the event but it has
not been resolved.
To acknowledge an event, select the event(s) to be acknowledged in the list
then click the Acknowledge button below the list.
The "Acknowledge Event" action will set the selected event(s) as acknowledged, update the Syslog file, and update the event status in the list to reflect
the change.
Deleting Syslog Events
To delete an event select the events that you want to delete, the click the Delete
Event icon below the events list.
Deleting a Syslog event will remove the event from the Syslog file and the
Device Syslog display.
6-53
Managing Network Devices
Device Logs
Managing Syslog Size
The PCM Syslog server can hold a maximum of 1500 events. You can use the
Syslog Events option in the Global Preferences to reduce the number of events
the Syslog will hold, and the rate at which the Syslog file will be automatically
trimmed (cleared) of excess files.
1.
Select the Syslog Events option in the Preferences menu to open the
Global:Syslog Events window.
Figure 6-37. Global Preferences: Syslog Events options
2.
For the Number of Syslog events per device: type in the number of events or
use the buttons to increase or decrease the number of events.
3.
For Trim Syslog messages every: type in the interval (number of hours) that
you want to wait before trimming the Syslog file to the maximum number
of entries, or use the buttons to increase or decrease the trim interval.
If a device is generating many events in the Syslog, the log will hold the
events over maximum, but operations with Syslog will be impacted, and
eventually the device operation may be impacted.
4.
6-54
Click OK to apply the preferences and close the window.
Managing Network Devices
Device Logs
Using the Audit Log
You can use the Audit Log functions in PCM to assist in compliance with IT
auditing and governmental regulations for IT systems security. When Audit
Logging is enabled, a log of any changes or actions made to the managed
network devices is made. You can generate a report of the Audit Logs to help
meet audit requirements.
To review the Audit Log for all devices, click the Audit Log icon in the global
toolbar. To review the Audit Log for selected devices, select the device nodes
in the navigation tree, or select the devices in the Devices list. Use the rightclick menu to select the Audit Logs option, or click the Audit Log icon in the
toolbar.
Figure 6-38. Example of the Audit Log display
6-55
Managing Network Devices
Device Logs
The PCM+ 2.2 Audit Logging feature allows you to configure PCM to log all
changes made via PCM to network devices by any PCM user. During normal
run-time operation, each time that a user that is enabled for audit logging
performs a configuration change to a device, PCM places a record in the audit
log file. Each record contains the following information:
•
the user that made the change,
•
the client IP where the change was made,
•
the IP address of the device,
•
the port that was affected (if any),
•
the PCM module that was used,
•
the date and time of the change,
•
the context/operation performed (for example, "Port Friendly Name
changed"), and
•
the actual data used in the operation (e.g. the new friendly port name,
the device configuration file, etc.).
The audit log can later be examined and filtered in a manner similar to the
existing event browser functionality.
The PCM administrator can configure the Audit Log options for each user,
using the Turn on audit logging and Allow to view audit logs options, as described for
“Adding User Accounts” on page 2-19.
Audit Logging Preferences
You can override the Audit Logging settings for users, and restrict access using
the Audit Logging Preferences window. Go to Preferences, Audit Logging
Figure 6-39. Global Preferences: Audit Logging window
6-56
Managing Network Devices
Device Logs
The Global Preferences window for Audit Logging contains three parameters.
■
Turn on Audit Logging - allows the Administrator to quickly enable or
disable all audit logging. If you are experiencing performance problems or working to diagnose abnormal behavior in PCM, you may
need to turn off functionality that could be contributing to abnormal
behavior. This parameter lets you turn audit logging on or off without
affecting the audit logging configuration for individual user accounts.
■
Force Audit Logging for all users - allows the Administrator to force
audit logging regardless of who the user is. If the Administrator is
finding that some unknown person is changing device configurations
without permission or perhaps a common configuration action is
causing an unwanted side affect, this allows all device configuration
changes to be temporarily monitored without having to manually
modify the audit logging configuration for each user. When the issue
has been isolated, the Administrator can then uncheck the option to
resume the normal audit logging functions.
Note that if a device configuration change is due to an automated action
(arrival of a security event, for example), it will always be logged regardless of the user who setup the original policy. That is, as long as audit
logging is turned on.
■
Audit Log only viewable by Administrator - allows the Administrator to
enhance security of the audit logging feature. This option, when
enabled, allows only the Administrator to view the audit log files
without having to modify the audit logging configuration for each
ProCurve Manager user.
6-57
Managing Network Devices
Device Logs
(This page intentionally left blank)
6-58
Device Access and Port Security Monitoring
7
Device Access and Port Security Monitoring
Chapter Contents
Introduction . . . . . . . . . . . . . . . . . . . . . . . . . . . . . . . . . . 7-2
Device Access . . . . . . . . . . . . . . . . . . . . . . . . . . . . . . . . . 7-3
The Port List Tab . . . . . . . . . . . . . . . . . . . . . . . . . . . . . . 7-5
The Port Status Tab . . . . . . . . . . . . . . . . . . . . . . . . . . . 7-5
Using Port Monitoring . . . . . . . . . . . . . . . . . . . . . . 7-6
Port Assignment Tab . . . . . . . . . . . . . . . . . . . . . . . . . . 7-11
Modifying Port Assignments . . . . . . . . . . . . . . . . 7-12
Modifying GVRP Port Properties . . . . . . . . . . . . . 7-13
The Port Access Tab . . . . . . . . . . . . . . . . . . . . . . . . . . 7-14
User Sessions Details . . . . . . . . . . . . . . . . . . . . . . 7-16
ACL Details . . . . . . . . . . . . . . . . . . . . . . . . . . . . . . 7-17
Using MAC Lockout . . . . . . . . . . . . . . . . . . . . . . . . . . 7-18
7-1
Device Access and Port Security Monitoring
Introduction
Introduction
The Device Access and Port List tabs in PCM Plus let you monitor device
access and port settings for managed network devices, including port-based
access and security configuration.
There are several different levels of access and security referred to in this
chapter.
Device Access: This refers to the general access to a switch. The PCM+
Device Access tab lets you easily verify if Console, Telnet or SSH Access
security is configured on a switch. You can configure device access and
authentication methods using the PCM Device Manager options (“Configuring
SNMP and CLI Access” on page 6-13) or the switch CLI, as described in the
Access and Security Guide for your switch.
Port Access: Refers to the use of Port-based access control. For the
ProCurve switches that support port-based access control, you can use the
Switch CLI to configure individual ports for authentication of clients trying to
access the network across that port.
Port Security: Refers to the configuration of MAC Addresses allowed to
access the network through a given port on the switch. Includes configuring
the number of authorized MAC addresses allowed on the port, as well as how
the port acquires authorized addresses. When a connect attempt is received
from an unauthorized MAC address, an SNMP trap is sent.
The level of access and security configured on the device generally reflects its
operation within the network. Devices being used to route network traffic
between switches, subnets, and VLANs need to provide higher throughput.
These infrastructure devices may use only minimal Device Access controls,
as there is less risk of unauthorized traffic across infrastructure ports. Devices
at the network edge, those that clients can connect to directly to access the
network, are more likely to use Port-based access and security configuration
to reduce unauthorized access to the network.
The Port List Tab provides a high level view of the status of port configuration,
Port (VLAN) Assignments, and Port Access and Security settings applied to
individual ports on a switch. You can use the Port List tab features to monitor
the Port access and security settings, and more efficiently manage client
access to the network.
7-2
Device Access and Port Security Monitoring
Device Access
Device Access
The Device Access tab display provides a summary view of the access control
settings for individual devices, along with an indicator of the percentage of
ports on the device that have Port Access and Port Security configured.
The Device Access tab is available from the Interconnect Devices
(Dashboard), or Device Group display. Simply select the Interconnect Devices
or device Group Node in the navigation tree, then click the Device Access tab.
Figure 7-1. Device Access tab display
The Device Access tab provides the following information for each device in
the group:
Device: The device identifier within PCM. (DNS name, IP Address, etc.)
Console Access: Either Locked meaning console access requires a login
password, or Unlocked, no password required.
Console Authentication: Indicates the primary Authentication method used
with the console login password. Possible values are: Local, RADIUS (Chap
Radius or EapRadius), and TACACS.
Telnet Access: Either Locked meaning Telnet access to the device requires
a login password, or Unlocked, no password required.
Telnet Authentication: Indicates the primary Authentication method used
with the Telnet login password. Possible values are: Local, RADIUS (Chap
Radius or EapRadius), and TACACS.
SSH Access: Either Locked meaning SSH access to the device requires a
login password, or Unlocked, no password required.
7-3
Device Access and Port Security Monitoring
Device Access
SSH Authentication: Indicates the primary Authentication method used
with the SSH login password. Possible values are: Local, Radius (ChapRadius
or EapRadius), and TACACS.
Port-access: A bar graph [0-100 percent] indicating the percentage of ports
that have port-access configuration requiring authentication of the client
or device connecting to the port. Green indicates secured, red means no
port-access security.
Port-security: A bar graph [0-100 percent] indicating the percentage of
ports that have port security configuration that limits port connections
based on MAC addresses. Green indicates port security is enabled, red
means no port security is enabled.
Authentication Server(s): The IP address of the Radius or TACACS server
configured for authorization on the device.
VT Status: Indicates if Virus Throttle (connection rate filtering) is Enabled
on the device. Other values are Disabled, and Not Supported.
VT Sensitivity: Indicates the Virus Throttle sensitivity setting when VT is
enabled. “Using Virus Throttle” on page 12-1 for details on using the Virus
Throttle feature.
If the Access and Authentication columns in the display are blank it may
be due to one of the following:
•
Device attributes have not yet been discovered, thus the information
is not available.
•
Passwords are set on the device, but corresponding communication
parameters have not been set in PCM for that device. Use the Test
Communication Parameters in device feature to verify, and if needed
use the Communication Parameters in PCM Wizard to configure the
CLI settings.
•
The feature is not supported by PCM for the device (for example,
wireless, 7000, 8100, 9400).
The information for device access fields is based on data derived from the
"show authentication" CLI command. The Port Access information is derived
using the "show port-access" CLI command, and Port Security is derived using
the "show port security" CLI command. VT data is derived from the "show connection-rate-filter" command.
7-4
Device Access and Port Security Monitoring
The Port List Tab
The Port List Tab
The Port List tab provides additional details related to the port status, VLAN
assignments, and access and security settings applied to individual ports on a
switch.
The Port List tab is available from the Interconnect Device window.
1.
Select the Device node in the navigation tree, or select the Device in the
Devices list. The Interconnect Device window displays with the Dashboard (Properties) tab default.
2.
Click the Port List tab to display the tab contents.
Figure 7-2. Device Port List tab, Port Status table display
The Port Status Tab
The default display within the Port List tab is the Port Status sub-tab.
The Port Status tab provides basic information on the individual ports on the
device including:
•
Index: port number
•
Port: port identifier, which may be the same as the port Index, or the
port name if friendly port names are used.
•
Status: Indicates current status of the port, either Green indicating the
port is up; or grey, indicating the port is down.
•
Speed Mbps: the link speed configured on the port
7-5
Device Access and Port Security Monitoring
The Port List Tab
•
Virus Filter Action: indicates if Virus Throttle™ is in use on the port.
See Chapter 12, “Using Virus Throttle” for more information.
•
Monitoring: indicates if Port is configured (or Not Configured) to
monitor (mirror) another port. Lists the monitored port and device IP
if actively monitoring. See “Using Port Monitoring” on page 7-6 for
details.
•
Monitor By: indicates if the port is being monitored, gives the port
name and device IP of the port set to monitor (mirror)
See “Using Port Monitoring” on page 7-6 for details.
You can click the column headings to change the sort order in the table.
There are no right-click menu functions on the individual ports listed in the
table; however, you can configure Port Mirroring (Monitor ports and Mirror
ports) using the Port Monitoring tool menu. See “Using Port Monitoring”
below for details.
Using Port Monitoring
Many of the ProCurve switches support the use of port monitoring (mirroring).
You can designate monitoring of inbound and outbound traffic on:
■
Ports and static trunks: Allows monitoring of individual ports, groups
of contiguous ports, and static port trunks.
■
Meshed ports: Allows traffic monitoring on all ports configured for
meshing on the switch.
■
Static VLANs: Allows traffic monitoring on one static VLAN (5300xl
switches and 4200vl switches only).
The switch monitors network activity by copying all traffic inbound and
outbound on the specified interfaces to the designated monitoring port, to
which a network analyzer can be attached.
Note
VLANs, a switch mesh, and port trunks cannot be used as a monitoring port.
The switch can monitor static LACP trunks, but not dynamic LACP trunks.
It is possible, when monitoring multiple interfaces in networks with high
traffic levels, to copy more traffic to a monitor port than the link can support.
In this case, some packets may not be copied to the monitor port.
If you use "remote mirroring" (with Network Immunity Manager), ProCurve
recommends using jumbo frames on 1/10 GB ports. Otherwise, data may be
lost if switches between the monitored port and remote mirror do not support
jumbo frames.
7-6
Device Access and Port Security Monitoring
The Port List Tab
Configuring Port Monitoring
Use the following configuration sequence to configure port monitoring using
PCM:
a.
Assign a monitoring (mirror) port.
b.
Designate the port(s) to monitor.
To assign the monitoring port:
1.
Select the device node in the navigation tree, or select the device in the
Interconnect Devices list.
2.
Click the Port List tab to get to the Port Status sub-tab display.
3.
In the Port Status table, click to select the Port you will use as the monitoring
(mirror) port.
4.
Select the Configure Mirror Port option from the toolbar pull-down menu.
The Configure Mirror Port dialog displays, with the selected port ID.
Figure 7-3. Configure Mirror Port dialog
5.
6.
Click the radio button to select Remote Monitoring or Local Monitoring.
•
Use remote monitoring to monitor activity of a port on another
(remote) device.
•
Use local monitoring to monitor activity of another port in the same
device.
Click the Enable Mirror Port button.
The Mirror Port: option changes to true, and the button changes to Disable
Mirror Port.
Click Close to save the mirror port setting, or click Disable Mirror Port to return
the port to the default state.
7-7
Device Access and Port Security Monitoring
The Port List Tab
In the Port Status table, the Monitoring column for the configured port is now
blank.
To designate the ports to be monitored:
1.
Select the device node in the navigation tree, or select the device in the
Interconnect Devices list.
2.
Click the Port List tab to get to the Port Status sub-tab display.
3.
In the Port Status table, click to select the Port you want to monitor. You
can use shift+click, or ctrl+click to select multiple ports.
4.
Select the Monitor Port option from the toolbar pull-down menu.
The Select Mirror Port dialog displays, with a listing of the ports and devices
configured as mirror (monitoring) ports.
Figure 7-4. Select Mirror Port display
5.
Click on the port you want to use for monitoring, then click OK.
The Select Mirror Port dialog exits, and the mirror port information
appears in the Monitored By column for the port being monitored.
7-8
Device Access and Port Security Monitoring
The Port List Tab
To Review Mirror-Port Status:
1.
Select the device node in the navigation tree, or select the device in the
Interconnect Devices list.
2.
Click the Port List tab to get to the Port Status sub-tab display.
3.
In the Port Status table, click to select the "Monitoring" Port.
4.
Select the View Mirror Port Status option from the toolbar pull-down menu.
The View Mirror Port Status window displays.
Figure 7-5. Mirror Port Status display
The display lists the mirror port information along with the list of ports
(with Device address) that are being monitored by this port.
To disable Port Mirroring:
1.
Select the device node in the navigation tree, or select the device in the
Interconnect Devices list.
2.
Click the Port List tab to get to the Port Status sub-tab display.
3.
In the Port Status table, click to select the "Monitoring" Port.
4.
Select the View Mirror-Port Status option from the toolbar pull-down menu.
5.
You can turn-off monitoring of one or more ports by selecting the ports in
the Monitoring Ports list, then click Stop Monitoring.
7-9
Device Access and Port Security Monitoring
The Port List Tab
Click Yes in the confirmation pop-up dialog.
The port is removed from the Monitoring Ports list, and when you Close the
dialog, the mirror port entry in the "Monitored By" column for the affected
port is removed.
6.
To stop port monitoring completely, click on Disable Mirror Port.
The Mirror Port status changes to false, and when you Close the dialog the
the "Monitoring" entry for the disabled mirror port is removed, as are mirror
port entries in the "Monitored By" column for the ports that were being
monitored.
To Review Monitored Port Status:
1.
Select the device node in the navigation tree, or select the device in the
Interconnect Devices list.
2.
Click the Port List tab to get to the Port Status sub-tab display.
3.
In the Port Status table, click to select the "Monitored By" Port.
4.
Select the View Monitored-Port Status option from the toolbar pull-down
menu.
The View Monitored-Port Status dialog displays.
Figure 7-6. Monitored Port Status display
The information on the monitoring (mirroring) port, and the monitoring
start and end times is provided.
5.
7-10
Select a port and click Stop Monitoring to end monitoring of the port.
Click Yes in the confirmation pop-up.
Device Access and Port Security Monitoring
The Port List Tab
The monitoring information is cleared from the View Monitored Port
Status dialog. When you click Ok, the dialog closes, and the entry in the
"Monitored By" column for the port is blank.
Port Assignment Tab
To review the current port assignments for the Device, click the Port Assignments tab in the Port List window.
Figure 7-7. Port List Tab: Port Assignments table
The table lists each of the VLANs to which a port is assigned and current
configuration of the port VLAN support (tagged, untagged, etc.)
7-11
Device Access and Port Security Monitoring
The Port List Tab
Modifying Port Assignments
Click the Modify Port Assignments icon in the toolbar to change the VLAN port
assignments. This will launch the Modify Port Assignments window.
Figure 7-8. Modify Port Assignments window
To modify port assignments:
1.
Click on the VLAN properties cell in the table. This will enable a pull-down
menu you can use to select the Property you want to have for the port in
that VLAN. The VLAN port options are:
•
Tagged: Port can be included in multiple VLANs.
•
Untagged: Port can be included in only one untagged VLAN.
•
Forbidden: Port cannot be included in this VLAN.
•
No: The port is not included in this VLAN.
Change the port properties as needed, then click Apply to save the changes
and close the Modify Port Assignment Table.
7-12
Device Access and Port Security Monitoring
The Port List Tab
Modifying GVRP Port Properties
To modify VLAN support by individual port on a device that supports GVRP:
1.
Click the Modify GVRP Port Properties button in the Port Assignment Table
toolbar.
Figure 7-9. Device Properties: Port Properties dialog.
2.
Select the GVRP status for the port: Blocked, Learn, or Disabled.
3.
Select the Acceptable Frame Type: All or Tagged.
4.
Click Apply to update the Port Properties display, then click OK to close
the dialog.
7-13
Device Access and Port Security Monitoring
The Port List Tab
The Port Access Tab
The Port List: Port Access tab provides details on security, authentication, and
access controls configured on individual ports.
Click the Port Access tab to view the Port Access data.
To update the Port Access information display, click the Refresh
in the toolbar.
button
Figure 7-10. Port List Tab, Port Access table
The port status tab provides information on the access and security settings
for individual ports on the device including:
7-14
■
Index: port number
■
Port: port identifier, which may be the same as the port Index, or the
port name if friendly port names are used.
■
Auth Type - Authentication method, if configured. Possible values are:
•
802.1x - 802.1x Port Access Security used to authenticate devices.
•
MAC Auth - MAC address used to authenticate devices.
•
Web Auth - User name and password must be entered to authenticate
devices.
•
None - No authentication is configured.
Device Access and Port Security Monitoring
The Port List Tab
Auth Type displays multiple authentications per port on devices that
support that feature.
■
■
Learn-Mode - refers to the Learn-Mode setting used on secured ports;
that is, how the port acquires authorized addresses. Possible values
are:
•
Continuous: Port learns addresses from inbound traffic from any connected device. This is the default setting.
•
Limited-Continuous: A fixed limit (1 - 32) to the number of learned
addresses allowed per port.
•
Static: A fixed limit on the number of MAC addresses authorized for
the port, with some or all of the authorized addresses specified. (If
only some of the authorized addresses are specified, the port learns
the remaining authorized addresses from the traffic it receives from
connected devices.)
•
Configured: All MAC addresses authorized for the port are specified.
The port is not allowed to learn addresses from inbound traffic.
•
Port Access: Allows only the MAC address of a device authenticated
through the switch’s 802.1X Port-Based access control.
•
Unknown: The Learn-mode cannot be determined or is not set.
Auth Status - Indicator showing the current authentication status of
the port: Possible values are:
secured port, open and authenticated
secured port, authenticating
secured port, closed and no logged in user
secured port, failed authentication, closed
unsecured port, status unknown
■
Users - The number of current (authenticated) user logins on the port.
■
QoS - The QoS (Quality of Service) level assigned for traffic across the
port (if QoS control is supported). Values range from 1-7, where:
6, 7 indicates high priority (get first priority)
4, 5 indicates medium priority (get second priority)
0, 3 indicates normal priority (get third priority)
7-15
Device Access and Port Security Monitoring
The Port List Tab
1, 2 indicates low priority (gets last priority)
An asterisk (*) indicates IDM override of switch QoS.
■
BW Limit %- The Bandwidth (Rate) limit configured on the port, if any.
Values are given in percentage from 1 - 100%. An asterisk (*) indicates
IDM override of switch bandwidth limits.
■
ACL -Indicates if any RADIUS ACLs are applied to the port. Possible
values are "Yes" or "No".
Parameters displayed in the Port Access tab are derived from the following
CLI commands:
• show port-access [authenticator], [mac-based], [web-based]
• show port-security
• show rate-limit
• show qos port-priority
User Sessions Details
To drill down to review additional details on the current user sessions on a
port,
1.
Select the "open" port in the Port Access table.
2.
Click the User Sessions button in the toolbar.
The User Session window appears on top of the Port List tab.
7-16
Device Access and Port Security Monitoring
The Port List Tab
ACL Details
The ACL Details window can be displayed when an ACL is used for the port.
It identifies access rules and packet hits of the applied ACL.
To drill down to review additional details on the current ACLs configured on
a port,
1.
Select the "open" port in the Port Access table.
2.
Click the ACL details button in the toolbar.
The ACL Details window appears on top of the Port List tab.
Figure 7-11. Port Access, ACL Details display
7-17
Device Access and Port Security Monitoring
The Port List Tab
Using MAC Lockout
You can use the MAC Lockout feature is select ProCurve switches to block
traffic from a specific MAC address on that switch. When used, all traffic to
or from the specified MAC address is dropped.
To view MAC Lockouts:
1.
Navigate to the MAC Lockout window.
a.
In the navigation tree, select the switch to be locked out.
b.
Click the MAC Lockout button on the toolbar.
Figure 7-12. MAC Lockouts window
■
Select the View by devices radio button to view all discovered switches
that support MAC Lockout regardless of their current MAC lockout
configuration.
■
Select the View only devices with lockout MAC radio button to view all
discovered devices that currently have MAC lockout configured and
list them by their IP address.
■
Select the View by lockout MACS radio button to view all discovered
devices that currently have MAC lockout configured and list them by
their MAC address.
The Mac Lockouts list includes when a MAC lockout was initiated, and when
it is scheduled to end (roll back).
7-18
Device Access and Port Security Monitoring
The Port List Tab
To lockout a MAC address:
1.
2.
Navigate to the MAC Lockout window.
a.
In the navigation tree, select the switch to be locked out.
b.
Click the MAC Lockout button on the toolbar.
Click Add. This launches the Add Lockout MAC dialog.
Figure 7-13. Add Lockout MAC dialog.
3.
Type in the MAC address of the device you want to lock out. Enter the
MAC address as six sets of two-digit values separated by colons (e.g.,
xx:xx:xx:xx:xx:xx).
4.
Click OK to lockout the specified MAC address and close the window, or
Click Cancel to exit the window without saving your changes.
To remove a MAC lockout:
1.
Navigate to the MAC Lockout window.
a.
In the navigation tree, select the switch to be locked out.
b.
Click the MAC Lockout button on the toolbar.
2.
In the MAC Lockouts window, select the device from which MAC lockout
should be removed.
3.
Click Delete.
4.
Click OK in the confirmation dialog to remove the lockout from the
selected device and close the window.
Click Cancel to exit the window without saving your changes.
7-19
Device Access and Port Security Monitoring
The Port List Tab
(This page intentionally left blank)
7-20
8
Monitoring Network Traffic
Chapter Contents
Introduction . . . . . . . . . . . . . . . . . . . . . . . . . . . . . . . . . 8-2
How Traffic Monitoring Works . . . . . . . . . . . . . . . 8-2
What’s new in 2.2 . . . . . . . . . . . . . . . . . . . . . . . . . . 8-3
Reviewing Traffic Data . . . . . . . . . . . . . . . . . . . . . . . . 8-4
Reading the Traffic Information Gauge . . . . . . . . 8-4
Trend Graph Displays . . . . . . . . . . . . . . . . . . . . . . 8-5
Using the Traffic Tab . . . . . . . . . . . . . . . . . . . . . . . 8-6
Reviewing Port Top Talkers . . . . . . . . . . . . . . . . 8-11
Reviewing Per-Port Traffic Statistics . . . . . . . . . 8-14
Configuring Traffic Monitor . . . . . . . . . . . . . . . . . . . 8-18
Manual Configuration of Traffic Thresholds . . . 8-19
Manual Configuration of Traffic Monitoring . . . 8-21
Reviewing Traffic Monitor Events . . . . . . . . . . . . . . 8-24
Setting Traffic Monitor Preferences . . . . . . . . . . . . . 8-25
Troubleshooting Traffic Monitor . . . . . . . . . . . . . . . . 8-28
8-1
Monitoring Network Traffic
Introduction
Introduction
The Traffic Manager in ProCurve Manager Plus (PCM+) provides a traffic
monitoring facility that delivers minute-by-minute views of the volume and
even the content of traffic at specified points within your ProCurve network.
Traffic monitoring is set to run automatically, with the capability for simultaneously performing statistics polling and sFlow (or XRMON in older devices)
sampling. Traffic Manager uses sampling and statistics polling to monitor five
key metrics that summarize network activity on the port: utilization and persecond rates for total frames, broadcast frames, multicast frames, and errors.
The Top Traffic Overview panel in the PCM+ Dashboard, or the Traffic tab in the
Interconnect Devices page, displays the current, worst measurement in the
entire network for each measured metric group.
How Traffic Monitoring Works
The statistics polling used by Traffic Manager consists of retrieving standard
counters at a fixed, repeated interval (1 minute); the difference in counter
values and period between retrievals is used to calculate a rate for each of the
Traffic monitor metrics. For most ports these counters are extracted from the
Interfaces Group of MIB II (RFC 2233), though for some older devices other
MIBs are used. Polling statistics from a port allows PCM+ to report the volume
of traffic on the port, but does not provide any information as to the content
of the traffic seen on the port.
The traffic sampling collection utilizes a standard called sFlow (RFC 3176) in
newer ProCurve devices; in older devices, HP Extended RMON (XRMON), is
employed. Both mechanisms function in essentially the same manner: frame
headers are sampled randomly from each port on which traffic sampling is
enabled, then bundled together with snapshots of the corresponding port
counters and sent to PCM+. The traffic "samples" are used to reconstruct the
volume of traffic on the monitored port (using differences measured over time
much like statistics polling) and the actual traffic content via statistical
estimation.
Traffic Manager employs a default configuration for automatically selecting
and configuring ports on which to monitor traffic, based on port classification,
link speed, and utilization rates. You can manually override the automatic
statistics sampling to disable traffic monitoring on specific ports, or to have
statistics and/or sampling always enabled on specific ports. You can also tune
the threshold settings for each measured metric to suit your specific network
requirements.
8-2
Monitoring Network Traffic
Introduction
What’s new in 2.2
•
In the default PCM installation, Traffic monitoring is automatically
managed, rather than requiring configuration by the user before data
is acquired.
•
In prior versions, Traffic displays showed all traffic merged together,
now you can view inbound and outbound traffic separately. You can
also set separate threshold levels for received (rx) and transmitted
(tx) traffic on a port.
•
Traffic information is integrated to PCM at all levels, from the Home
dashboard, to device group, to individual devices, you can see the
traffic overview and easily drill down to get details
•
Traffic Map, now you can view traffic links in the network map
display.
•
Traffic Manager windows are completely redesigned to provide better
data readout with information for traffic on individual ports, and to
provide easier access to sampling and threshold configuration.
•
Traffic polling and statistical sampling algorithms have been
improved to provide greater accuracy while consuming less system
resources, and reducing impact on overall network traffic flow.
•
Traffic status and values adjust much more rapidly and robustly to
topological changes such as port up/down or speed changes.
•
The window of time that data is retained for a port has been expanded
from one hour to 12 hours.
•
The ability to log data to a .csv file, either based on threshold crossings
or on demand, is new. Logging based on threshold crossings can be
used to capture detailed data about a condition that happens when
the user is away.
•
You can now "pause" the traffic screens so that if you are inspecting
some interesting data it does not disappear because it scrolled out of
the window of time that included in the current display.
•
The amount of data attributed to each top talker can now be displayed
in a tooltip on the Top Talkers screen.
8-3
Monitoring Network Traffic
Reviewing Traffic Data
Reviewing Traffic Data
When traffic monitoring is enabled, the Top Traffic Overview panel on the PCM
Home Dashboard displays data for egress or transmitted (Tx) traffic, and
ingress or received (Rx) traffic, for the five metric groups that the data
collector monitors:
•
Utilization, in bytes per second, given as a percentage of total available.
•
Frames per second,
•
Broadcasts per second,
•
Multicasts per second, and
•
Errors per second
Figure 8-1. Traffic Overview Panel on "Home" Dashboard
Reading the Traffic Information Gauge
The traffic gauge displays the network traffic information on the worst port
for the current minute. The pointer moves around the gauge to indicate the
amount of traffic. The colors on the gauge indicate:
8-4
■
green: value for the attribute is within the normal range
■
yellow: value has exceeded the normal range, but is not critical
■
red: value is in the critical range. Corrective action may be needed.
■
blue inner band: The “high water mark”, shows you the highest value
for the time period the gauge is displayed. This indicator can help you
determine if there are any transient or intermittent problems for the
port, even though the current minute indicator shows normal activity.
Monitoring Network Traffic
Reviewing Traffic Data
The amount of green, yellow and red displayed in the gauge corresponds to
the threshold settings for the selected port and metric. For example, if the
current Threshold settings for Utilization% on the selected port are as follows,
green: OK, 0-50% utilization
yellow: warning, 51-75% utilization
red: critical, 76-100% utilization
then the gauge for Utilization% would display a green area up to 50%, a yellow
area from 51% to 75%, and a red area from 76% to 100%.
The text below the gauge provides information about the total number of ports
discovered (P:#), the number of ports that are active (A:#), the number that
sampling data has been retained for in the last interval reported (Smp:#), and
the number that statistics data has been retained for in the last interval
reported (Sta:#). The statistics count (Sta:#) will always have a port count #
that is higher than that of sampling (Smp:#). You can hover over the legend to
display a tooltip that displays how many ports traffic is attempting to collect
sampling and statistics data from (as opposed to the number it succeeded with
in the last interval).
Trend Graph Displays
For additional details on the worst traffic segment, click the port listed under
the metric to change the display from the traffic gauge to a trend graph.
The trend graph displays the measured values for the metric group over a span
of 12 hours (720 intervals). As new points are added, the bars in the graph shift
left. The x-axis displays the timestamps of the range of data in the window.
For ports that support separate Rx (received or ingress) and Tx (transmit or
egress) traffic data, two graphs are displayed. When only Rx-Tx combined data
is available, one graph is displayed.
Horizontal threshold indicators (graph lines) display for the warning threshold value (yellow), critical threshold value (red) and maximum [high water
mark] value (blue). The warning and critical threshold indicators are not
editable from this panel. You can mouse-over on each bar to display its value,
timestamp and threshold values.
8-5
Monitoring Network Traffic
Reviewing Traffic Data
Using the Traffic Tab
The Traffic tab display is context sensitive to the device you select in the
navigation tree. Only the devices/ports in the selected device or device group
are displayed. When the top -level Interconnect Devices group is selected all
monitored device ports are displayed.
Click the Traffic tab in the Interconnect Devices window to display traffic
details for selected devices.
top overview panel
Traffic gauge and
mini-trend panel
overview panel, multi-metric
Figure 8-2. Traffic Tab display
The Traffic tab is divided into three separate panels.
Top Traffic Overview Panel: Displays the worst measures for each metric group,
and the number of ports that have reached critical or warning thresholds in
the last interval. Click the + to show the worst ports (top talkers) for that
metric. The number of device ports for each metric group can be set in the
traffic preferences (default is 3).
8-6
Monitoring Network Traffic
Reviewing Traffic Data
Each row contains a leading LED (icon) indicator that shows one of the
following states:
•
Disabled (gray), used during initialization to signify that the Traffic
Monitor server has not received any data yet.
•
Normal (green), metric is within the normal range.
•
Warning (yellow), metric has exceeded normal range, but is not critical.
•
Critical (red), a threshold violation for the metric has occurred.
The metric group row LED takes its state from the worst case in the metric
group (or is disabled). The LEDs display the network traffic information for
the latest update (or current minute). The color of the LED (green, yellow or
red) corresponds to the threshold settings for that port. Using the default
thresholds for utilization, the LED colors can be interpreted as follows:
green: OK, 0-74% utilization
yellow: warning, 75 - 89% utilization
red: critical, 90% or greater utilization
Note:
Some ports will be missing LEDs in certain columns; specifically wireless
radios and WAN ports. This happens when a port does not support the
counters than can be used for that metric. The remaining metrics - those that
LEDs appear for - will function correctly for such ports.
Some ports have only one LED in each column rather than two LEDs. When
counters are available to support ingress/egress traffic breakout, two LEDs
are used. But for XRMON ports, only merged counters are available and thus
a merged LED must be shown.
Traffic Gauge and Mini-Trend Panel: When you first open the Traffic tab, the
Traffic Gauge displays, with the pointer set for the worst port in the current
minute. When a heading row is selected, for example Utilization (0 Critical, 1
Warning), the worst metric in that group is selected. Note that the Critical and
Warning notation indicates the number of ports for which the threshold was
exceeded in the last interval.
Click a port under the Metric in the Top Traffic Overview panel to display the
Mini-Trend panel (bar graph) for that port. The trend graph displays the
measured values for the selected metric and port over a span of 12 hours (720
intervals). As new points are added, the bars in the graph shift left. The x-axis
displays the timestamps of the range of data in the window. For ports that
support separate Rx (received or ingress) and Tx (transmit or egress) traffic
data, two graphs are displayed. When only Rx-Tx combined data is available,
one graph is displayed.
8-7
Monitoring Network Traffic
Reviewing Traffic Data
Figure 8-3. Traffic Trend Graph display
Horizontal threshold indicators (graph lines) display for the warning threshold value (yellow), critical threshold value (red) and maximum [high water
mark] value (blue). The warning and critical threshold indicators are not
editable from this panel. You can mouse-over on each bar to display its value,
timestamp and threshold values.
Overview Panel (multi-metric mode): This panel displays a table with the
device/ports for the selected device or device group in the navigation tree.
Because of the potentially large number of ports in a given network there is a
limit to the number of displayed device/ports loaded into the table, indicated
by the "Total Rows: 100 (Limit: 1000)" label. This limit can be modified in the
traffic Preferences. Each column can be sorted in descending or ascending
order. The sort is actually performed in the database and the result set is
returned to the client up to the limited number of rows. To reduce the number
of lines in the display, de-select the "Show Inactive Ports" option. When
checked, inactive ports on a device are listed in the table along with the active
ports.
The following information is provided in the table columns:
8-8
■
Device: displays the device name in the form "DNS Name (IP Address)"
and can be sorted alphabetically (alpha-numerically if numbers are
used)
■
Port: displays the port in the form "Friendly Port Name (Port Name)"
and can be sorted alphabetically (alpha-numerically)
Monitoring Network Traffic
Reviewing Traffic Data
■
Metric group type: displays the name of the selected metric group, and
LED s (icons) as described in the Top Traffic Overview section above.
If separate Rx and Tx data is available, two LEDs are displayed. If only
Rx-Tx combined data is available, one LED is displayed. The metric
groups can be sorted based on the threshold violations. The default
is to sort from highest (critical) to lowest (normal or disabled), thus
all critical violations are sorted before warning violations, warning
violations are sorted before normal ports and so on. In the case of
separate Rx and Tx data, the worst of the two measures will be used
to determine sort order.
■
Cfg (Monitor): displays two icons indicating the current traffic configuration on the port. The icons correspond to the configuration options
available in the right-click menus.
•
Automatic or Manual Sampling (enabled or disabled)
Note that only one sampling method can be used at a time. When you
enable automatic mode, manual sampling is disabled, and vice versa.
•
■
Data Logging (Auto-critical, Auto-warning, enabled or disabled)
Status: displays the current status for the port. The status value will be
one of the following:
•
Green port indicator for active ports, grey for inactive ports.
Note: If the Show Inactive Ports option is not selected, only active (green)
ports appear in the display.
•
A bar chart Stats indicator:
8-9
Monitoring Network Traffic
Reviewing Traffic Data
–
–
–
■
A colored bar chart indicates sample data received in the last
interval/minute
Gray outline bars indicate statistics only data received in the last
interval/minute
If no bar chart appears, no sample or statistics data was received
Msg/Time: displays the timestamp for the last time stats were collected
for the port
Overview Panel (single-metric mode): is similar to the multi-metric mode but only
displays one of the metrics for each port allowing for more detail. Switching
between multi-mode and single-mode is accomplished from the drop-down
menu above the table. There is a single-metric mode for each metric group.
For example selecting Utilization in the menu will change the table to display a
single metric column titled Utilization with data similar to the following figure:
Figure 8-4. Overview Panel "Single-metric" mode display
When separate Rx and Tx measurements are not available, a single Rx-Tx
graph is displayed. The color of the bar reflects the threshold violation status.
Separate color bars indicate threshold settings and "high water mark" for the
port. This column can be sorted similarly to the Metric Group column.
The Status Bar at the bottom of the Traffic tab displays:
8-10
■
The last update from the data collector and estimated time until the
next update (left).
■
The data collector status (middle), displays the PCM server IP address.
■
Data collector administration data (right): Ports = the number of
monitored ports, Active= active ports (have link), Sampled = number
of ports providing sample data in last minute, Stats: number of ports
providing statistics data in the last minute.
Monitoring Network Traffic
Reviewing Traffic Data
:
Mouse-over of the status bar traffic data shows the current sampling and
polling attempts relative to the total limits, and the currently reported number
of samples and stats retained by the data collector process.
Reviewing Port Top Talkers
Right-click on a single port in the Traffic tab, then select the Port Top Talkers...
option from the right-click menu to display the Traffic-Port Top Talkers
window.
Figure 8-5. Traffic, Port Top Talkers window
8-11
Monitoring Network Traffic
Reviewing Traffic Data
The Port Top Talkers window helps answer the question, “Who is causing the
problem (who are the top talkers) on a given port?” by displaying a graph
identifying the top nodes causing the network activity on the port for the
selected minute. If the port is not connected to devices that are (XRMON or
sFlow) sampling-capable, the only data displayed is “Others”. Note that with
sampled (sFlow) data, PCM+ is able to determine the traffic content and
volume. With just polling statistics, PCM+ can only determine traffic volume.
Top Talker View Options
The Top Talker View has two menu selections. The options of each are
described in the following table. You can display a graph of the Top Talkers for
each of the measured metrics, for received (Rx) and transmitted (Tx) traffic,
by selecting the options for the metric and the attribute to display:
Table 9-1.
Functions of the Top Talker Menus
Menu Item
Function
Metric
Displays a new graph for each metric:
• Utilization%
• Frames/sec
• Broadcasts/sec
• Multicasts/sec
Top Talkers
Selects the traffic type displayed for the selected metric:
• Connections
• Destinations
• Sources
• Protocols
Top Talker data is given for Rx (received) and Tx (transmitted) traffic.
■
If Rx and Tx data are combined, as is the case when XRMON data has
been collected within the displayed window, then, only one instance
of the legend and Top Talker bar graph will display.
■
The Broadcast/sec and Multicasts/sec metrics only display with the
Connections option.
The Top Talker data consists of a legend showing the Top Talkers for the
selected interval and a bar chart displaying the data from the current and
previous intervals. The legend displays each entry's percentage contribution
of the total counts for the interval displayed in the graph. The total counts are
displayed under the percentages. When you hover over the bar corresponding
to the legend entry in the stacked bar chart of a minute, the contribution from
8-12
Monitoring Network Traffic
Reviewing Traffic Data
a top talker legend entry displays the timestamp of the minute being hovered
on, and the contribution of the legend entry and total of the metric value for
the minute hovered over are shown below the timestamp.
Note:
The Top Talker graphs are designed to show data at one minute intervals for
the last 12 hours. The data display starts on the left and moves to the right
over time.
The yellow and the red horizontal lines on the background of the graph
represent the warning and critical values, respectively, for the selected port.
These lines only appear when the graph scale is high enough.
The selection of a bar inside either Rx or Tx graph is synchronized so that a
selection in one will automatically select the corresponding bar in the other
(for the same interval). The scroll bar at the bottom of the region is tied to
both graphs and will scroll the x-axis. The scroll bar at the right of the graphs
will scroll the Y axis.
The information provided by the legend includes:
■
The source address, destination address, or both depending on the
attribute being viewed.
■
The network protocol or service being used for the communication
path. That is, the highest network protocol decoded by PCM for the
applicable attribute is displayed.
■
The direction of data flow (the source and destination nodes)
There are a maximum of 5 Top Talker entries for Rx and Tx measures. You
can visually trace the data across the graph to see trends in activity over the
past 12 hours.
You can also use the right click menu on the graph. This menu is available in
the mini-trend graph as well and allows the user to change to “Fixed max
scale”, default is “Auto Scale” as well as unzoom. You can click-drag a
rectangle in the charts to zoom in. You can right-click drag to pan the data.
8-13
Monitoring Network Traffic
Reviewing Traffic Data
Reviewing Per-Port Traffic Statistics
Right-click on a single port in the Traffic tab, then select the Port summary...
option from the right-click menu to display the Port Summary - Traffic window.
Figure 9-6. Port Summary, Statistics tab display
The Port Summary - Traffic window uses a tabbed display to provide the
summary traffic information for the selected port, as described below:
Statistics Tab: The default display, this tab provides a table that lists the
summary details for each traffic metric for the port, including:
8-14
•
Measured Value: The current value (at last update) for the metric.
•
Warning Threshold configured for the metric.
•
Critical Threshold configured for the metric.
Monitoring Network Traffic
Reviewing Traffic Data
Threshold Violations: Click the tab to display a table with data on threshold
violations for each metric on the selected port for both ingress and egress
traffic.
Figure 9-7. Port Summary, Threshold Violations tab display
•
Warning Violation indicates when the port is in violation of the warning
threshold value. This means the port’s metric value has crossed the
warning threshold and has not stayed below the warning threshold
for 5 minutes. In the example above the port has been in warning
violation for 24m32s (24 minutes, 32 seconds).
•
Critical Violation indicates when the port is in violation of the critical
threshold value.
8-15
Monitoring Network Traffic
Reviewing Traffic Data
Port: The Port tab provides port attributes
Figure 9-8. Port Summary, Port tab display
The left column lists the:
■
Port - Port name or ID.
■
Speed - the port’s operating speed
■
Active - If the port is currently active (true or false),
■
IfIndex, IfType - The interface index and interface type from MIB-2.
The right column lists the traffic configuration on the port, including:
8-16
■
Mode indicates if sampling is set to Auto or Manual mode.
■
Stats indicates if this port is currently being polled for traffic, with a
value of Enabled (monitored) or Disabled (not monitored)
■
Sampling indicates if traffic sampling (using sFlow or XRMON) is in
use,
Enabled = sampled, Disabled= not sampled.
■
Log Mode displays the current log mode for the port. The valid modes
are:
• Auto-Crit: logging of the port traffic data will start/stop during critical
violations
• Auto-Warning: logging of the port traffic data will start/stop during
warning violations
• Manual-On: logging of the port traffic data is always on
• Manual-Off: logging of the port traffic data is always off
■
Default Thresholds indicates if default traffic thresholds are used, yes or
no.
Monitoring Network Traffic
Reviewing Traffic Data
■
Max Errors/Sec indicates maximum errors per second based on line
speed of the port.
The Device tab lists the basic information for the device the port belongs to,
including IP Address, Product Name (model or device group) and if sFlow and
XRMON functions are supported on the device (yes or no).
Figure 9-9. Port Summary, Device tab display
Log: This tab displays timestamps for the latest received traffic updates. It is
essentially a history of the contents of the Traffic tab's Msg/Time column.
Figure 9-10. Port Summary, Log tab display
8-17
Monitoring Network Traffic
Configuring Traffic Monitor
Configuring Traffic Monitor
Traffic Manager employs a default configuration for automatically selecting
and configuring ports on which to monitor traffic, based on port classification,
link speed, and utilization rates.
You can manually override the automatic statistics sampling to disable traffic
monitoring on specific ports, or to have statistics and/or sampling always
enabled on specific ports. You can also tune the threshold settings for each
measured metric to suit your specific network requirements.
The Traffic Manager auto-selection algorithm encompasses many factors,
listed below in order of priority. Almost all of these factors are relatively static
except for utilization, which is re-evaluated periodically.
■
Inter-switch links have top priority. Edge ports have lower priority.
■
Link speed. Faster links have higher priority.
■
Ports with high utilization. Busier ports will be selected first. This
criteria is re-evaluated at regular intervals, based on the average
utilization for the preceding interval.
■
Ports with critical traffic threshold violations.
■
Ports with warning traffic threshold violations.
■
Static prioritization of ports based on device capabilities. Devices
with more greater traffic processing capacity will be selected for
sampling when all other criteria between ports is equal.
So inter-switch links are the top priority, and conflicts in priority at various
levels are broken using successive tiers of criteria. For example: 10Gbps interswitch links would precede 1Gbps inter-switch links; 1Gbps inter-switch links
with higher utilization would precede 1Gbps inter-switch links with lower
utilizations, etc.
If you are going to use Traffic Monitor to collect packet samples and have more
than 500 device ports, then configure manual sampling for the most important
device ports on your network.
Note
8-18
You cannot use manual configuration to apply traffic sampling (sFlow and
XRMON) to more than 500 ports at the same time (vs. using the default
automatic traffic configuration for statistics polling and sampling). If the limit
is exceeded you will get an error message when you attempt to manually
configure traffic sampling on additional ports.
Monitoring Network Traffic
Configuring Traffic Monitor
Manual Configuration of Traffic Thresholds
To configure the traffic thresholds for Warning and Critical:
1.
Select the device or group where you want to configure Traffic monitoring, then open the Traffic tab display.
2.
Click to select the ports on the devices that you want to configure
thresholds for traffic monitoring. Use shift-click or Ctrl+click to select
multiple ports.
3.
Select the Configure Thresholds option from the traffic right-click menu to
display the Traffic- Threshold Configuration dialog. (see figure 9-11 on the
next page.)
Thresholds can be set for each metric on Rx or Tx. If the port only supports
combined Rx and Tx data, only one bar will be shown. The threshold
parameters can be set as follows:
NOTE:
4.
Click the check box to enable/disable logging of the Warning threshold
events. A check mark indicates events will be sent to the Events browser.
5.
Enter the Warning threshold value (any number from 0%-100%, and less
than the critical threshold setting).
6.
Click the check box to enable/disable logging of the Critical threshold
events. A check mark indicates events will be sent to the Events browser.
7.
Enter the Critical threshold value (any number from 0%-100%, and greater
than the warning threshold setting).
The threshold percentage is valid for the utilization only where it is measured
in percent. The other metrics are based on the maximum frames per second
for the speed. However, you can specify the maximum errors per second (see
“Changing Line Speeds” on page 8-21).
8.
Repeat the process to set threshold values for each metric measured by
Traffic Monitor. When you are done, click on the OK button to save the
changes and close the Threshold Configuration dialog.
8-19
Monitoring Network Traffic
Configuring Traffic Monitor
Figure 9-11. Traffic Monitor: Thresholds Configuration dialog
You can also change the threshold settings by moving (click+drag) the colored
threshold indicators in the bar graph. For example, moving the yellow bar will
change the Warning threshold in the graph, and the numeric (%) field. Similarly, when you enter a number in the % field, the related bar in the graph will
move to indicate the new setting.
8-20
Monitoring Network Traffic
Configuring Traffic Monitor
Changing Line Speeds
In multiple port selections, multiple lines speeds for the selected ports are
shown in the table in the bottom of the dialog, along with the relative metric/
Sec, and Max Errors allowed for that line speed.
The relative Max Error counts for a port can be modified as follows:
1.
Select the line speed that you want to change.
2.
Use the Set Max Errors pull-down menu to select the maximum errors.
The number is set as indicated for the selected line speed, and converted
to the appropriate number for all other line speeds. For example, if Max
Errors for 1Gb line speed is set to 100, and you have a second port with a
line speed of 10Gb, the Max errors will automatically be scaled to 1000,
and so on.
The Max errors number controls the maximum value displayed in the
thresholds configuration sliders, as well as on the traffic Gauges and in
the Errors/Sec view in the Traffic tab display.
Changing the threshold ranges to better represent your network's normal
activity will be a relative decision. It is recommended that you use the default
threshold values first and adjust them to fit the traffic patterns on your
network. By fine tuning the threshold levels, you can find the optimum
operating conditions for each port on your network, which makes it easier to
see problems as they occur.
Manual Configuration of Traffic Monitoring
To display the traffic monitoring configuration tools menu, right click on the
row of a selected port in the Overview metrics table in the Traffic tab:
Figure 9-12. Traffic Manager tools menu (right-click menu)
8-21
Monitoring Network Traffic
Configuring Traffic Monitor
Select the Manual sub-menu to enable or disable Manual configuration of
polling and sampling.
Click on an option to turn it on. The icon for that monitoring option will appear
in the Cfg column of the selected port on the Overview table in the Traffic Tab
display. (refer to figure 8-2 or figure 8-4)
Use the Automatic options to enable or disable automatic traffic sampling and
statistics.
Note that only one monitoring mode can be in use on a port. Selecting a
different monitoring option will automatically disable the previous setting.
For example:
a.
If the Manually enable statistics mode is in use on a port,
b.
when you select Enable automatic mode, the manual mode is disabled on
the port, and the automatic mode icon appears in the Cfg column.
The Logging sub-menu provides options for configuring traffic data logging.
8-22
Monitoring Network Traffic
Configuring Traffic Monitor
The following table describes the available traffic configuration functions:
Traffic Menu Option
What it does...
Manual:
Manually disable sampling
and statistics
Turns off all traffic monitoring on the selected ports.
Manual:
Manually enable sampling
and statistics
Turns on traffic sampling and statistics for the selected
ports. Traffic monitoring is in effect until disabled, or
switched to automatic mode.
Manual:
Manually enable statistics
Turns on traffic statistics monitoring for the selected ports.
Statistics monitoring is in effect until disabled, or switched
to automatic mode.
Automatic:
Enable automatic mode
Turns on automatic traffic monitoring. Traffic manager will
do statistics polling and/or sFlow (XRMON) sampling as
indicated by traffic levels on the selected ports.
Automatic:
Turn on automatic traffic statistics monitoring for the
Enable automatic statistics- selected port. No sFlow or XRMON sampling will be
only mode
performed.
Logging:
Enable automatic critical
data logging
Automatically logs data if port traffic violates a critical
threshold setting (logs only critical threshold violations).
Logging:
Enable automatic warning
data logging
Automatically logs the data for the port if the port is in
violation of the warning threshold.
Logging:
Enable data logging
Set data logging on the selected port to Manual On mode,
which logs all Traffic Monitor data for the selected port(s).
Logging:
Disable data logging
Set data logging on the selected port to Manual off mode,
which turns off all traffic monitor data logging on the
selected port(s).
Configure Thresholds...
Launches the Traffic: Threshold Configuration window for
the selected port(s). See “Manual Configuration of Traffic
Thresholds” on page 8-19 for details.
Port Top Talkers...
Launches the Traffic: Port Top Talkers window, with data for
the selected port(s). See “Reviewing Port Top Talkers” on
page 8-11 for details.
Port summary...
Launches the Traffic-Port Summary window for the selected
port. (If more than one port is selected, only the last port
selected is displayed). See “Reviewing Per-Port Traffic
Statistics” on page 8-14 for details.
Device
Launches the PCM device right-click menu, for access to
Configuration Manager, Device Manager, etc.
The data log files include essentially everything that is in the Top Talkers
legend for each minute that you have logging enabled on a port The log files
are located in: <PCM install>\server\data\traffic\logs\TrafficDataLog.csv
8-23
Monitoring Network Traffic
Configuring Traffic Monitor
Reviewing Traffic Monitor Events
Traffic Monitor "alarms" can be reviewed in the Event browser. In the Events
browser, "Critical threshold" alarms have an event severity of Major, and
Warning threshold alarms have an event severity of Warning. The threshold
violation event will indicate which port generated the threshold alarm.
Figure 9-13. Example of Traffic Monitor events
Only one threshold violation event will be sent and the port is put in a
“violation” state. This can be monitored by the “Port Summary” Threshold
Violation tabs, as shown in the figure below. The port must remain below
both thresholds (warning and critical) for 5 minutes for the port to be removed
from the violation state.
8-24
Monitoring Network Traffic
Setting Traffic Monitor Preferences
Setting Traffic Monitor Preferences
You can enable automatic configuration of the Traffic Monitor features and
configure the Traffic "view settings" using the Preferences, Traffic options.
The Discovered Ports options use network topography information from the
discovery process to automatically configure the Traffic Monitor to track interswitch communications.
To enable the automatic Traffic configuration on discovered ports:
1.
Select Tools->Preferences->Traffic to display the Global:Traffic preferences window.
Figure 9-14. Preferences, Global:Traffic window
8-25
Monitoring Network Traffic
Setting Traffic Monitor Preferences
2.
3.
4.
5.
Click the check box to enable Traffic Monitoring options.
•
Enable will start traffic monitoring for all devices in the network.
•
Disable will stop all traffic monitoring, regardless of any other traffic
configuration settings.
Select the desired Default Port Monitoring Mode option by clicking the radio
button.
•
Automatic sampling and statistics polling: Will configure automatic traffic monitoring with sampling and statistics on any newly discovered
port. You can override this mode for selected ports in the Traffic tab.
•
Automatic statistics polling only: Will configure automatic traffic monitoring with statistics polling only on any newly discovered port. You
can override this mode for selected ports in the Traffic tab.
•
Disabled: Traffic monitoring will not be configured for any newly
discovered port, unless set manually in the Traffic tab display.
Select the desired Data Log Mode option from the pull-down menu.
•
On critical violations: newly discovered ports are configured to automatically log data if the port has violated the critical threshold.
•
On warning violations: newly discovered ports are configured to automatically log data if the port has violated the warning threshold.
•
Disabled: newly discovered ports are configured to not allow data
logging.
Select the desired Default Threshold Settings option by clicking the radio
button.
•
Event On: Newly discovered ports will send threshold violation (Warning or Critical) events to the event browser and the PCM automation
can act on the event.
•
Event Off: Threshold violation events will not be sent for violations on
newly discovered ports. However, all the “color” changes for the
threshold violation will still occur in the Traffic UI.
Note that this value can be overridden in the Threshold Configuration
dialog (Warning/Critical check boxes)
Note:
8-26
Changes made to the preferences for Default Port Monitoring Mode, Data
Log Mode, and Default Threshold settings apply only to newly discovered
switches and ports. It does not apply to traffic monitoring on existing devices
or ports on the network.
Monitoring Network Traffic
Setting Traffic Monitor Preferences
The View Settings options customize the row table limits in the Traffic tab
displays. Set the row limits using the increase or decrease buttons.
6.
Row table limit: Sets the maximum number of rows that will be loading
into the Overview table in the bottom panel of the Traffic tab. The range is
100 - 10,000 (step: 10, default: 1000)
7.
Max rows for Worst metric: Max rows that will be displayed for each metric
in the Top Traffic Overview table at the top of the Traffic tab. The range is 0 10 (step: 1, default: 3)
8.
Click Ok to save Traffic Preference changes and exit the window.
Click Apply to save changes without exiting the window.
Click Cancel to exit the window without saving the Traffic Preferences
configuration changes.
8-27
Monitoring Network Traffic
Troubleshooting Traffic Monitor
Troubleshooting Traffic Monitor
There may be times when your Traffic Monitor graphs are not registering any
data, or one or more LED displays may go gray. Some of the reasons this may
occur are:
■
Data Not Current—If the data is not current, the graphs and LED
displays will not have information.
■
Too Little Traffic on Network—If your network is carrying very little
traffic at this time, the graphs may not indicate any traffic for sFlow
and XRMON data. You will get statistical polling on devices no matter
how little traffic exists on the port. If there is no traffic, the reported
values will be "0".
■
One port (Port) is Gray—There may be a problem with this particular
port. The data sampler may not be working, there may not be enough
traffic on that port, or a device may have been disconnected from that
port.
■
Machine is Very Busy—The CPU may not be able to process the data
because it is too busy.
■
Switch is Very Busy—When an interconnect device becomes overloaded, it may stop responding to traffic monitoring requests in order
to execute its primary function of handling network traffic.
You can also look in the Log tab on the Traffic-Port Summary window, or the
PCM Event Browser to get additional information on specific devices that may
be having problems, or for "Traffic Manager" events indicating there is a problem
with Traffic Monitor’s ability to access the device.
Traffic data collection uses dynamically allocated UDP ports for statistics
polling, sampling control, and XRMON trap reception. For this reason, firewalls between the PCM+ server and monitored devices precludes the use of
traffic monitoring.
If you are using PCM-NNM, make sure that the SNMP Write Community name
is set in NNM, and that the Write Community names in PCM and NNM are the
same.
Remember that you only need to select one side of a network connection for
traffic monitoring. Selecting both sides results in unnecessary overhead on
the network.
8-28
Monitoring Network Traffic
Troubleshooting Traffic Monitor
If you select all the ports in the Traffic table lower panel (by selecting a row
and using Ctrl+A) and there are more than the limited number of ports (>1000)
the following dialog will be displayed:
This is to make sure that you want to perform the operation not only on the
1000 ports in the view but ALL the ports in the database. If the you select yes,
a progress bar will be displayed and Traffic will iterate through all ports on all
devices.
PCM Traffic Messages in MS Windows Event Log
The PCM Traffic Launching Service (TLS) has the ability to log directly into
the MS Windows event log application folder, accessible via the MS event
viewer.
For TLS the following are all of the possible messages with the format
[severity;message].
Messages in the Application folder:
Info;The following information is part of the event: ProCurve TLS.ServiceStart() "START"
cmd sent to C:\Program Files\Hewlett-Packard\PNM\server\bin\Trafficd.exe.
Info;The following information is part of the event: Received: RESTART.
Warning;The following information is part of the event: ProCurve TLS.Timer1Timer.ServiceStart() Auto Restarting C:\Program Files\Hewlett-Packard\PNM\server\bin\Trafficd.exe.
Messages in the System folder:
(Because all services are monitored automatically and TLS is a service, the
following are also logged into the system folder.
Info;The HP ProCurve Traffic Launch Service, service was successfully sent a start control.
Info;The HP ProCurve Traffic Launch Service, service entered the running state.
Info;The HP ProCurve Traffic Launch Service, service was successfully sent a stop control.
Info;The HP ProCurve Traffic Launch Service, service entered the stopped state.
8-29
Monitoring Network Traffic
Troubleshooting Traffic Monitor
Also Trafficd.exe will log a Trafficd error message into the MS Windows event
log Application folder if no ports are detected in the port list during startup.
Server Connection Lost
When you add, modify or delete a traffic device configuration, the "Awaiting
connection" message is displayed in the lower left corner of the Traffic
Monitor tab. Configuration changes can take up to five minutes, during which
time the traffic monitor gauges will not show any traffic data.
If the message remains longer than five minutes and a connection is not
established with the server, try the following:
•
Check the Event browser window for Traffic errors.
•
Use the Microsoft Task Manager to check that the Trafficd.exe and
TLS.exe are still running on the PCM Server.
•
Restart the PCM Client.
•
Restart the PCM Server Service
(under Administrative Tools->Services)
If Trafficd.exe is not running and/or TLS.exe is not running, use the Windows
Service Control Manager to restart the HP ProCurve Traffic Launch Service
(which is TLS.exe). The TLS.exe is controlled by the Windows Service Control
Manager and TLS.exe in turn controls Trafficd.exe, which performs the actual
traffic data collection.
8-30
9
Managing Device Configurations
Chapter Contents
About Configuration Manager . . . . . . . . . . . . . . . 9-2
Reviewing Device Configurations . . . . . . . . . . . . 9-8
Configurations Detail . . . . . . . . . . . . . . . . . . . 9-9
Device Configuration History. . . . . . . . . . . . 9-10
Using Configuration Labels . . . . . . . . . . . . . 9-11
Comparing Device Configurations. . . . . . . . . . . 9-12
Updating Device Configurations . . . . . . . . . . . . 9-14
Using the Deploy Configuration Wizard . . . 9-14
Performing Configuration Scans . . . . . . . . . . . . . 9-3
Manual Configuration Scanning . . . . . . . . . . 9-3
Scheduling Configuration Scans . . . . . . . . . . 9-7
Using the CLI Wizard . . . . . . . . . . . . . . . . . . . . 9-18
Using Configuration Templates . . . . . . . . . . . . . 9-24
Comparing Configuration Templates. . . . . . 9-25
Comparing Configuration Templates. . . . . . 9-25
Using the Configuration Template Wizard . 9-30
Using the Deploy Template Wizard . . . . . . . 9-35
Exporting Device Configurations . . . . . . . . . . . 9-41
Importing Device Configurations . . . . . . . . . . . 9-43
Using the Software Licensing Feature . . . . . . . 9-47
Configuration Management Preferences. . . . . . 9-53
Setting Preferred Switch Software Versions 9-55
Network (Proxy) Settings . . . . . . . . . . . . . . . 9-56
Updating Switch Software . . . . . . . . . . . . . . . . . 9-57
Scheduling Automatic Updates . . . . . . . . . . 9-58
Reviewing Software Update Status . . . . . . . 9-62
9-1
Managing Device Configurations
About Configuration Manager
About Configuration Manager
The Configuration Manager module in PCM+ allows you to scan ProCurve
Switches in your network and store records of the switch configurations (SW,
HW, and Switch Software [OS] configurations) in a database. This information
can then be used to:
■
Identify when a device configuration has been changed.
■
Roll back or forward configurations on a device or devices.
■
Send CLI command(s) to one or many devices.
The Configuration Manager scan process can be done on demand or as a
scheduled process. This helps you manage device configurations in your
network by providing notification whenever any configuration (software or
hardware) changes on a ProCurve device in the network.
As a quick summary, the Configuration Manager component provides the
following features:
■
Automatic device configuration scans (manually or on set intervals)
■
Viewing of device configurations
■
Viewing configuration history for a device
■
Comparison of any two device configurations
■
Ability to restore or deploy a specific configuration to a device
■
Ability to create a Configuration Template for a given device type, and
then use the Configuration Template to automatically configure new
devices as they are attached to the network infrastructure.
■
License or unlicense optional premium switch software.
What’s new in this release
New features included with PCM 2.2 include the Import/Export device configuration function, and implementation of Secure Copy (SCP) protocol for
transferring switch device configuration files between PCM and devices.
Trivial File Transfer Protocol (TFTP) is the default method used by PCM in
past releases for transferring switch configurations between the switch and
PCM. With PCM 2.2, implementation of SCP (Secure Copy) provides a secure
alternative to TFTP for transferring sensitive switch configuration files to and
from the switch. SCP is an implementation of the BSD rcp (Berkeley UNIX
remote copy) command tunneled through an SSH connection. SCP works with
both SSH v1 and SSH v2.
9-2
Managing Device Configurations
Performing Configuration Scans
Performing Configuration Scans
A configuration scan must be performed on your ProCurve devices before any
configuration information is available in the PCM+ display. A default policy is
provided that automatically scans devices on the network to collect device
status and configuration information once each day. You can also perform a
manual scan at any time.
Manual Configuration Scanning
To manually scan a device or group of devices:
1.
Select the device or devices in the Devices List display,
2.
Select the Scan option from the Device Configuration toolbar menu.
Alternately, you can right-click on the device in either the navigation tree,
or the network map, then select the Config Manager ->Scan option from the
right-click menu. Either action will launch the Scan Wizard.
Figure 9-1. Configuration Manager: Scan Wizard, Comment dialogue.
You can enter a Comment that will be stored in the database along with the
configuration record, or just click Next to continue with the scan process.
9-3
Managing Device Configurations
Performing Configuration Scans
3.
Select the file transfer method to use for transferring the configuration
text from the device to PCM:
•
The default is Use TFTP for configuration file transfer.
The default method for configuration file transfer is based on what is
defined in Global Preferences for Configuration Management. At
initial PCM+ installation, the default is "Use TFTP for configuration file
transfer".
•
You can change the mode of transfer for this particular run of the Scan
Wizard by selecting "Use Secure Copy for configuration file transfer".
Secure Copy (SCP) works with SSH v1 and SSH v2 to provide a more
secure file transfer method between PCM and the managed switch.
Make sure that SSH is enabled on the device and SSH is the preferred
CLI mode in "Communication Parameters in PCM" wizard if SCP is selected
as the method for transfer of configuration file.
If you are unsure whether all the devices in your network support the use
of SCP, select the Allow TFTP if Secure Copy is not supported, and Allow TFTP if
Secure Copy Fails options. If Allow TFTP failover options are not set, the scan
configuration operation will report errors if SCP is not supported on the
target device.
Enabling SCP modifies the device's configuration the first time it is
scanned. The option to use TFTP as a failover mode of configuration scan
applies to one single run of the scan wizard. However, if you use this
feature, every switch between TFTP and SCP subsequently modifies the
configuration again.
9-4
Managing Device Configurations
Performing Configuration Scans
4.
Click Next to begin the actual configuration scan.
Figure 9-2. Configuration Manager: Scan Wizard, Monitor dialogue.
If the device is not supported by the Configuration Manager, the scan process
returns a failure notice in the Monitor dialogue. The scan process will also fail
if the correct Write Community Name, SSH parameters and CLI passwords
are not configured on the device. Otherwise, the scan proceeds and the "View
results" dialogue is displayed.
NOTE:
On 9300 series devices, if the switch has the super-user password configured,
there must be a write community with the same value. For PCM to be able to
collect configuration information on your 9300 device, you need to:
■
Delete the global super-user password, or
■
Set the community name to match the global super-user password.
a.
Set the password from a telnet session:
enable super-user-password <password>
b.
Set the SNMP Read/Write community name to the same value:
snmp-server community <password> rw
9-5
Managing Device Configurations
Performing Configuration Scans
If you selected multiple devices to scan, you can click the Halt! button to stop
the scan process after it starts. The scan will complete on the device currently
being scanned, then the process is stopped. In the case of a single device being
scanned, once the scan is started, clicking Halt! will have no real effect.
Figure 9-3. Configuration Scan Wizard, View results dialogue.
■
NOTE:
To view differences found between scanned configurations, select the
View differences option, then click Next. The View differences dialogue
is displayed.
If this is the first time the device has been scanned, the "View differences"
options will not work, since the system is unable to detect changes until more
than one configuration has been scanned.
■
To edit the changed configuration, select the device in the "View results
of scan" listing, select the Edit and redeploy option, then click Next. The
Deploy Wizard: Edit dialogue is displayed (see figure 9-11).
Refer to the instructions for using the Deploy Wizard to update configurations, starting on page 9-14.
If there are no changes detected, the scan results box is empty.
9-6
Managing Device Configurations
Performing Configuration Scans
Figure 9-4. Configuration Scan Wizard, View differences dialogue
■
In the "View differences" dialogue, select the device, then click View...
The "Configuration Difference Viewer" is launched showing the
current and previous configuration scan information (see figure 9-9)
When you have completed the configuration scan process, click Close to exit
the Scan Wizard.
Scheduling Configuration Scans
PCM+ provides a pre-defined policy to perform configuration scans at regular
intervals. You can adjust the policy schedule and target devices, or create
separate configuration scan policies to meet your network management
requirements. Refer to Chapter 13, “Using Policy Manager Features” for
details.
9-7
Managing Device Configurations
Reviewing Device Configurations
Reviewing Device Configurations
The Configurations panel in the Interconnect Devices Dashboard display provides a quick review of overall network device configurations. For a more
detailed display, click on the Configurations tab.
Figure 9-5. Device Configurations listing
The Configurations display provides a summary view of devices configuration,
and latest configuration changes. It gives the following information for each
device:
•
Device - The DNS name or IP address of the device
•
Result - Icons indicating the result of the last scan, one of:
Changed
Login failure
Device not supported
Scan timed out
Device never scanned
Network error prevented scan
9-8
•
Version - A check indicates the device has the preferred version of the
software, as set in the Configuration Manager Preferences. The
default Preference setting is the latest available version.
•
Last Change - Date of the most recent configuration change.
Managing Device Configurations
Reviewing Device Configurations
•
SWConfig - Yellow triangle indicates the software configuration
changed on the date shown in the Last Change column.
•
HW - Yellow triangle indicates the hardware configuration changed
on the date shown in the Last Change column.
•
SW/ROM Ver - Yellow triangle indicates the ProCurve Switch Software
and/or Boot ROM changed on the date shown in the Last Change
column
•
Last Scan - Most recent date that a device scan was attempted.
You can sort the list on any of the columns. For example, click the SW column
and/or Last Change column heading. This will re-sort the list with devices that
have software changes at the top.
Configurations Detail
To view detailed configuration information for a device, double-click on the
device in the Configurations tab, or select a device in the navigation tree. This
displays the Properties tab in the Configuration panel, as described under
“Viewing Device Information” on page 2-15. Click the Configuration tab to view
the device configuration detail.
Figure 9-6. Device Configuration detail
9-9
Managing Device Configurations
Reviewing Device Configurations
If the configuration for the device has changed, you can use the Display by
option to review the configuration details from previous scans, either by Date
of the scan, or by configuration Label (if used).
Configurations are collected for the ProCurve Wireless access points (420wl,
520wl), but the format is binary proprietary (machine readable only). You can
still label and re-deploy wireless configurations as needed.
Device Configuration History
Click the Configuration History tab to view a history of configuration changes for
the device.
Figure 9-7. Device Configuration History display
The Configuration History window displays a list of all past configurations*
stored for the device. This information can be used to determine when and
how configurations have changed.
•
The Sw Cfg, Hw Cfg, and SW/ROM Ver columns are marked with a yellow
triangle to indicate if the given configuration had changed when that
configuration scan was stored.
•
The Labels field lists any labels applied to a given configuration.
•
The Comments field lists comments entered on the scan event.
•
The remaining Sw Cfg Date, Hw Cfg Date and SW/ROM Ver Date columns
are provided to help sort the configuration data by the date changes
occurred. You can filter out the display of Sw, Hw, or Sw/ROM events
by unchecking the "Show" events at the top of the list.
* The number of stored configurations and how long they are saved is
controlled by the Configuration Management preferences.
9-10
Managing Device Configurations
Reviewing Device Configurations
Using Configuration Labels
You can apply labels to a device configuration to help identify known good
configurations or other special configurations in the Configurations and Configuration History displays.
To apply a configuration label, select the device configuration in the Configurations or Configuration History display, then click the Label icon in the toolbar. The
Apply a Label to device configurations dialogue will be displayed.
Figure 9-8. Apply Label to Device Configuration dialogue
Note that when accessed from the Configuration History, the device name
panel is not shown. Also, if multiple devices are selected in the Configurations
listing, each of the devices will be listed in the dialogue.
Enter a Label for the device (software) configuration, then click OK. The device
configuration record will be updated with the new Label.
If you are not sure if the label is unique--that it has not been used before for
the selected device, check (click) the Automatically move label option. This
moves the label to the selected configuration, from a configuration on which
it was previously used.
You can apply multiple labels to any given configuration, but each label must
be unique. Once a label is applied, the label cannot be edited or removed from
that configuration.
9-11
Managing Device Configurations
Comparing Device Configurations
Comparing Device Configurations
The Configuration Manager allows you to compare configurations between
devices, or two separate configurations on the same device.
To compare device configurations between two separate devices, in the Devices
List or the Configurations tab, select two devices in the list, then click the Compare
icon in the toolbar. In the confirmation pop-up dialogue, click Compare to
continue with the comparison.
Figure 9-9. Configurations Difference Viewer, default display
The default display is Side-by-side, that is with one device configuration in the
right side and the other on the left. Differences in the software configuration
are highlighted with different colored text.
9-12
Managing Device Configurations
Comparing Device Configurations
If you want to view the differences between the two configurations, click the
Inline tab. This displays one pane of configuration commands on top of the
other, with additional configuration parameters marked with a plus sign and
deleted or missing parameters marked with a minus sign.
Figure 9-10. Configuration Difference Viewer, Inline display
To view only the differences between the two configuration files, click to
check the Show differences only option. The inline display will list the first
device type, software release, and device name. Then the second device is
listed, with the differences in configuration from the first device listed. No
other colors or indicators are used to highlight differences between the two
configurations.
9-13
Managing Device Configurations
Updating Device Configurations
Updating Device Configurations
After reviewing your network device configurations, you can use the Deploy
Wizard to edit the software configuration and deploy it to a device (commit
to flash). The Deploy Wizard will perform a total replacement of the software
configuration on the target device and then reboot the device and capture the
new configuration information. Deployment is useful when you capture a
known good configuration and want to restore that configuration in its
entirety, or apply the configuration to other devices.
Tip : Use the Device Manager for simple tasks like changing the host name, community names, and authorized managers. Use the CLI Wizard, Telnet, or Web
Agent for more complex configuration changes.
Using the Deploy Configuration Wizard
To deploy a known good configuration to a device,
1.
Go to the Configuration History window for the device and select the configuration to be deployed, then click the Deploy Configuration icon in the toolbar
to launch the Wizard.
Figure 9-11. Deploy Wizard, Edit Configuration dialogue
9-14
Managing Device Configurations
Updating Device Configurations
NOTE:
For most ProCurve devices the CLI commands for the configuration display
in readable text form. For the 8000, 4000, 2400, and 1600 series devices, the
configuration is shown and edited in record format.
If you have selected a known good configuration, no edits should be
needed. However, you can click in the configuration display and edit the
configuration. PCM+ does no parsing or interpretation of text entered in
the Deploy Wizard. For details on using device configuration (CLI) commands, see the Management and Configuration Guide for the device.
Click Next to continue.
Figure 9-12. Deploy Wizard, file transfer settings dialog
2.
Select the file transfer method to use for transferring the configuration
text from the device to PCM:
•
The default is Use TFTP for configuration file transfer.
The default method for configuration file transfer is based on what is
defined in Global Preferences for Configuration Management. At
initial PCM+ installation, the default is "Use TFTP for configuration file
transfer".
•
You can change the mode of transfer for this particular run of the Scan
Wizard by selecting "Use Secure Copy for configuration file transfer".
Secure Copy (SCP) works with SSH v1 and SSH v2 to provide a more
secure file transfer method between PCM and the managed switch.
9-15
Managing Device Configurations
Updating Device Configurations
•
If you are unsure whether all the devices in your network support the
use of SCP, select the Allow TFTP if Secure Copy is not supported, and Allow
TFTP if Secure Copy Fails options. If Allow TFTP failover options are not set,
the scan configuration operation will report errors if SCP is not
supported on the target device.
Enabling SCP modifies the device's configuration the first time it is
scanned. The option to use TFTP as a failover mode of configuration
scan applies to one single run of the scan wizard. However, if you use
this feature, every switch between TFTP and SCP subsequently modifies the configuration again.
Click Next to continue.
Figure 9-13. Deploy WIzard, Schedule deployment dialogue.
3.
Click to select the deployment schedule option:
•
Select Deploy now if you need to deploy the configuration immediately
to correct a problem in the device. The configuration will deploy as
soon as you click the Next button.
•
Select Deploy later to deploy the configuration at the date and time
that you specify in the Start date fields.
If you selected the Deploy later option, click Finish to save the configuration
deployment schedule and exit the wizard.
9-16
Managing Device Configurations
Updating Device Configurations
4.
If you selected the Deploy now option, when you click Next the deployment
status displays:
•
Successful - The configuration deployed successfully.
•
Deployment Failed - The configuration was not deployed due to a bad
connection, nonexistent or invalid file, or invalid permissions.
Tip: Make sure that SSH is enabled on the device and SSH is the
preferred CLI mode using the "Communication Parameters in PCM" wizard
if SCP is selected as the method for transfer of configuration files.
•
Configuration files identical - No changes are made because the configuration file on the device is identical to the configuration deployed.
Click Close to exit the Deploy Wizard.
Tip : To apply a known good software configuration from one network device to
another, you can copy the software configuration text from the Configuration
detail display, then paste the copied text in the "Deploy Wizard: Edit" dialog.
9-17
Managing Device Configurations
Using the CLI Wizard
Using the CLI Wizard
The CLI Wizard feature in the Configuration Manager lets you issue a configuration command to multiple devices at the same time. In this way you use a
"batch process" to update the configuration on all devices at once, instead of
having to update each device separately.
To issue a command to multiple devices using the CLI Wizard,
1.
Select the devices in the Devices List or Configurations list display.
2.
Select the CLI option from the Device Configuration toolbar menu to
launch the CLI wizard.
Figure 9-14. CLI Wizard, Commands dialogue
3.
Click in the text box and type in the configuration Commands you want to
apply.
You can enter any mixture of commands or "show" commands. The
commands will be executed in the order entered. Care should be taken
when issuing commands that change an IP address or commands that will
cause a device to reboot.
4.
9-18
The Commit to flash option is essentially a "write memory" command that
will commit commands to the startup configuration.
Managing Device Configurations
Using the CLI Wizard
The Capture configuration... option tells Configuration Manager to automatically scan the device to capture the configuration after the commands
are issued. This option also issues a "write memory" command.
Click the check box to deselect these options. A check mark indicates the
options are enabled.
5.
Click Next to continue.:
Figure 9-15. CLI Wizard, Select when to execute dialogue
6.
7.
Select when you want to execute the CLI commands:
•
Select Send commands now if you want to execute the commands
immediately to repair a problem or improve performance.
•
Select Send commands later to send commands at a time when the
impact to network performance will not be a problem.
Click Next to continue.
a.
If you selected the Send commands now option, the CLI Wizard will
display a monitor of the command status.
9-19
Managing Device Configurations
Using the CLI Wizard
Figure 9-16. CLI Wizard, Monitor dialogue
In the Monitor dialogue, click Halt to stop the CLI command action.
Otherwise, the monitor will display the results of each command.
NOTE:
If you issue commands to multiple devices using the CLI Wizard, it issues the
commands to five devices at a time, in parallel, until all devices are configured.
You can alter the number of devices with the Performance Tuning parameters in
the Global Preferences for Configuration Management. See page 9-53 for
details.
b.
9-20
If you selected the Send commands later option, when you click Next a
scheduling dialogue is displayed.
Managing Device Configurations
Using the CLI Wizard
Figure 9-17. CLI Wizard, Schedule setup dialogue
8.
Type in a Policy Name under which the CLI commands will be stored.
Enter the Start date and time, and the recurrence pattern if you want to
repeat the commands at scheduled intervals.
9.
Never
No further action is required (Policy definition is saved,
but will not be enforced).
One time
No further action is required (the currently scheduled
time is used with no recurrences).
Hourly
Type the number of hours and minutes to wait between
executing commands. If you do not want the commands
executed on Saturdays and Sundays, check the Skip
weekend checkbox.
Daily
Type the number of days to wait between enforcements.
If you do not want the commands enforced on Saturdays and Sundays, check the Skip weekend checkbox.
Click Next to continue.
9-21
Managing Device Configurations
Using the CLI Wizard
Figure 9-18. CLI Wizard, Output Options dialogue
10. Select the Session Output options:
a.
If you do not want to capture the output for the session, click Next to
close the "Specify Output Options" window.
b.
Click the Capture output to a file checkbox to capture the output for
the session.
c.
Type in the Filename in which to store the output.
d.
Click the Append checkbox to append the next session output to
previous output if the file already exists.
To overwrite an existing file, ensure that the Append checkbox is not
checked.
e.
9-22
Click Next. The Show Selected devices dialogue is displayed, with the
list of devices to which the CLI commands will be applied.
Managing Device Configurations
Using the CLI Wizard
Figure 9-19. CLI Wizard, Show Selected Devices dialogue
11. Click Finish to exit the CLI Wizard, or Start Over to return to the Commands
dialogue and issue additional commands.
9-23
Managing Device Configurations
Using Configuration Templates
Using Configuration Templates
The Configuration Templates window displays an overview of configuration
templates. These templates can be deployed to a single device, or to a group
of devices of the same type. You can also apply configuration templates using
a Policy to automatically configure all devices that use the same configuration
syntax. For example 1600m, 2400, 2424, 4000m and 8000m models use a
common configuration file syntax.
For information on using Configuration Templates to automatically configure
newly discovered devices, refer to “Using the Deploy Configuration Wizard”
on page 9-14.
The Configuration Templates tab displays the templates associated with the
selected device Group, with the following information:
Column
Description
Template Name
Name assigned to the template
Description
Brief description of the template
Policies
Number of policies currently
using the template
Figure 9-20. Configuration Templates tab view
9-24
Managing Device Configurations
Using Configuration Templates
You can access the following functions from the Configuration Templates
window.
■
Open the Configuration Template Wizard (with no default values) to
create a new device configuration template.
■
Open the Configuration Template Wizard with values copied from
another template so you can easily create a template similar to
another template
■
Modify configuration templates. See "Using the Configuration
Template Wizard" for additional information.
■
Manage IP Pools (See below)
■
Delete configuration templates.
■
Compare configuration templates
■
Deploy a configuration template to a device or group of devices.
Comparing Configuration Templates
The Compare Configuration Templates function is used to compare software
configuration templates. It works similarly to the Compare Device Configurations function described on page 9-12.
To compare two configurations templates:
1.
Select a device group in the navigation tree to display the Devices window,
then click the Configuration Templates tab.
2.
Select two configuration templates from the listing in the Configuration
Templates display.
3.
Click the Compare Templates button in the (component) toolbar.
4.
Ensure that the configuration templates listed in the Template Difference
Viewer are the ones that you want to compare, then click Compare!.
5.
The default display is Side-by-side, that is with one configuration template
in the right side and the other on the left. Differences in the software
configuration are highlighted with red and blue text.
As with Device configurations, you can change to the Inline View, and set
the display to view only the differences between the two configuration
templates.
9-25
Managing Device Configurations
Using Configuration Templates
Using IP Address Pools
If you plan to deploy a configuration template to multiple devices, a static IP
address cannot be used in the template. Instead, you must use an IP_POOL
statement to assign IP addresses to devices configured by the template.
The syntax for the IP _POOL statement is
<IP_POOL=PoolName,ADDRESS,"User Comment">
Where:
PoolName
Is the name of the IP address pool you want to use, or a question mark
(?). You can also leave the first field blank.
The pool name is limited to alphanumeric characters (a-Z and 0-9) and the
underscore (_). Other special characters and spaces are not allowed.
Type a question mark or leave the first field blank to assign an IP address
pool in a later wizard step, which is especially helpful when the IP address
pool will be created in a later step.
User Comment
Is a descriptive comment, enclosed in quotation marks. There is no
restriction on the length of a comment, however the comment cannot
contain embedded quotation marks and the statement must fit on one line.
An IP_POOL statement can contain blank spaces between elements. However,
the entire statement must be a single line. That is, the opening "<" must be on
the same line as the closing ">."
You can use the IP Pool Manager and IP Pool Configuration functions to create
and manage IP Pools for use in configuration templates.
IP Pool Manager
Use the IP Pool Manager to review IP Pool information used for configuration
templates, and to access the functions for creating, modifying or deleting IP
Pools. An IP address pool provides a list of IP addresses that are used to
automatically assign IP addresses to devices when configuration templates
are deployed. This is especially helpful when new devices are discovered.
Click the IP Pool Manager icon in the Configuration Templates toolbar to
launch the IP Pool Manager window.
9-26
Managing Device Configurations
Using Configuration Templates
Figure 9-21. IP Pool Manager display
This IP Pool Manager window provides the following information for each
defined IP pool:
•
Pool Name: The name assigned to the IP address pool
•
Pool Description: A brief description of the IP Pool
•
Subnet Mask: The Subnet Masked used for all IP addresses in the pool.
•
# of Addresses: The number of unassigned IP addresses in the IP pool.
When configuration templates that use the pool are deployed, this
number decreases as unique IP addresses are taken out of the pool
and added to software configuration files. A second entry will appear
in the list for the remaining available IP addresses in the pool.
When the number of available IP addresses in a pool drops below 10, a
warning event is issued. When the number of available IP addresses in a
pool drops below 3, a major event is logged.
Configuring IP Address Pools
To add an IP Pool:
1.
Click the Add IP Pool icon in the IP Pool Manager toolbar to launch the IP
Address Pool Configuration window.
9-27
Managing Device Configurations
Using Configuration Templates
Figure 9-22. IP Pool Manager, Address configuration
The IP Address Pool Configuration can also be launched from within the
Configuration Template Wizard.
The IP Address Pool Configuration window is used to create or modify an
IP address pool. This window also identifies whether the IP addresses in
a Pool have been assigned to devices. When the checkbox in the Address
Used column next to an IP address range contains a check, then the IP
addresses in that range are already in use. This can result in the original
IP address range being split into two lines, one for the IP addresses already
in use, and one for IP addresses in the pool that are still available to be
assigned.
Note:
9-28
You can change an IP address from available to unavailable by checking the
Addr Used checkbox.
2.
In the Pool Name field, type the name you want to assign to the pool.
3.
Type a Description identifying how the pool of IP addresses will be used.
An entry in this field is optional.
4.
Type the Subnet mask that will be used with the IP Addresses in the pool.
IP address ranges cannot cross the subnet boundary defined by the subnet
mask.
5.
To enter the IP addresses to be included in the pool, click the New button.
This launches the Configure IP address range dialogue.
Managing Device Configurations
Using Configuration Templates
Figure 9-23. IP Pool Manager: Configure IP address range.
a.
In the Beginning IP Address field type the lowest IP address in the
range,
b.
In the Ending IP Address field type the highest IP address in the range.
c.
To assign a single IP address to the pool, type the IP address in the
Beginning address field. (Leave the Ending address field blank.)
All IP addresses you enter must be within the subnet mask range.
d.
Click Ok to close the dialogue. The new IP range displays in the list in
the IP Pool configuration window.
Repeat the process if you want to use more than one range of IP addresses
in the Pool.
6.
To modify an IP address range, select the range in the list, then click the
Edit button to launch the Configure IP address range dialogue and change
the desired value.
7.
To delete an IP address range, select the address or address range and
click the Delete button.
8.
When you are finished configuring the IP addresses pool, click OK to save
the IP pool configuration and close the window.
9.
The new IP Pool appears in the IP Pool Manager window, and will be
available in the IP Pools listing in the Configuration Template Wizard.
9-29
Managing Device Configurations
Using Configuration Templates
Using the Configuration Template Wizard
To assist you in creating device configuration templates, PCM+ provides a
Configuration Template Wizard. The method used to launch the Wizard is
based on how you want to create the template.
■
Note:
To create a template based on an existing device configuration:
a.
Select the Device in the Navigation Tree or the Devices list.
b.
Select Config Manager -> Create Template from the toolbar, or using the
right-click menu.
A successful configuration scan must be performed on the device in order to
use it for creating a Configuration Template.
■
■
To create a new template based on an existing configuration template:
a.
Select the Device group node to display the Device Group window,
then select the Configuration Templates tab.
b.
Select the Template in the list displayed, then click the Create template
by Copying icon in the toolbar.
To create a completely new template, simply click the Create Template
icon in the Template Configuration toolbar.
The following steps define the template configuration process using the
wizard.
1.
9-30
Click Next in the Welcome window to go to the Template Name window.
Managing Device Configurations
Using Configuration Templates
Figure 9-24. Device Configuration Template, assign name
2.
Type in a Template Name for the Configuration Template, and if desired,
enter a brief Description for the template.
3.
Click Next to continue to the Template Configuration window.
The contents in the window will vary based on the configuration method
you selected.
•
If you are creating a template from a selected device configuration,
or using "Copy from Existing Template" function, the configuration
for the selected device or template will be displayed.
•
If you are creating a new template, the configuration pane will be
blank.
The Template Configuration Data window in the Wizard lets you enter or
modify the configuration. Except for IP addresses, entries must conform
to the syntax and semantic rules for the target class of device. See
“Comparing Configuration Templates” on page 9-25 for details on IP
Address statement syntax and creating IP Pools for use in configuration
templates.
9-31
Managing Device Configurations
Using Configuration Templates
Figure 9-25. Device Configuration Template, template configuration
4.
Modify the existing configuration data as desired, or
Type in the configuration details for the template.
5.
To insert an IP address substitution statement in the template, place your
cursor in the configuration window where the IP Address statement
should go, then click the link. This will launch the IP Address Substitution
dialogue.
Figure 9-26. Configuration Template, IP Address substitution
9-32
a.
Select the IP Pool Name from the drop-down menu, then enter a
comment if desired. The Comment is included in the IP Address
statement in the configuration file.
b.
If the IP Pool is not found in the drop-down menu, you can click the
link to Create a new IP address Pool. This will launch the IP Pool
Configuration window, described on page 9-27.
Managing Device Configurations
Using Configuration Templates
c.
Click OK to close the Address Substitution dialogue and return to the
Configuration window. The substitution statement appears in the
configuration template, similar to the following example.
ADDR=<IP_Pool=FOO, ADDRESS, "Use of IP Pool Example">
Repeat Step 5 for each IP Address substitution needed in the template.
6.
When the configuration data is complete, click Next to continue.
•
7.
If you did not include an IP address substitutions in the template, the
Summary Window displays. Go to step 8 for details.
If you included an IP address substitution, the Review IP Address Pools
window displays.
Figure 9-27. Configuration Template, Review IP address pool
The review window shows the Pool Name, number of IP Addresses available
in the pool, and any Comment entered for the IP address substitution.
Review the information to make sure you are using the correct IP address
pool for each statement. If any are incorrect, use the drop-down list to
select the correct pool name.
•
Click the Create a new IP Address pool link to launch the IP Address Pool
Configuration window. (See page 9-27 for details on using this window.)
•
Click the Show IP address pools link to launch the IP Pool Manager
window to review other possible IP pools.
9-33
Managing Device Configurations
Using Configuration Templates
8.
Click Next to continue. The Summary window displays.
Figure 9-28. Configuration Template Summary display
9.
Review the configuration template to ensure it is correct, then click Finish
to save the template and exit the Wizard.
Click Cancel to exit the Wizard without saving the template.
Click Back to return to the previous window in the Wizard.
Click Start Over to return to the start of the Wizard, without cancelling the
configuration.
To modify a configuration template:
1.
Select a device group in the navigation tree to display the Devices window,
then click the Configuration Templates tab.
2.
Click the Modify template icon in the toolbar to launch the Configuration
Template Wizard and edit the configuration as needed. See “Using the
Configuration Template Wizard” on page 9-30 for details.
To delete a configuration template:
9-34
1.
Select a device group in the navigation tree to display the Devices window,
then click the Configuration Templates tab to see the templates associated to
the selected device group.
2.
Select the Template from the list, then click the Delete template icon in the
Configuration Templates toolbar.
Managing Device Configurations
Using Configuration Templates
Applying Configuration Templates to Devices
A powerful feature of configuration templates is the ability to automatically
configure new devices as they are discovered by PCM+. To use this feature:
1.
Create a configuration template for the class of devices (device group)
that you want to have configured automatically when they are added (and
discovered) on the network.
2.
Before connecting the new device to the network, set the Contact or
Owner field on the device to the following:
<PCM_Template=templatename>
Where templatename is the name of template you created in step 1 above.
3.
Set up minimal connectivity information using DHCP or a temporary
static IP address and connect the device to the network. When PCM+
discovers the device, it will automatically deploy the configuration template on the device.
Using the Deploy Template Wizard
You can also apply a configuration template to device(s) on the network at
any time using the Deploy Template wizard.
1.
Select the device in the Navigation tree or the Devices list.
2.
Using the toolbar icons or right-click menu, select Config Manager-> Deploy
Template to launch the Deploy Template Wizard.
9-35
Managing Device Configurations
Using Configuration Templates
Figure 9-29. Deploy Configuration Template wizard
3.
Click Next to continue to the template selection.
Figure 9-30. Deploy Configuration, template selection
4.
Select a configuration template to deploy from the pull-down menu.
Click Next to continue to the deployment schedule selection.
9-36
Managing Device Configurations
Using Configuration Templates
Figure 9-31. Deploy Configuration, select deploy time
5.
In the When would you like to deploy? dialog:
•
If you select Deploy Now, the configuration template will be applied
to the device immediately. (after the file transfer method is selected)
•
If you select Deploy Later, you need to set the date and time (schedule)
for when the template will be applied to the device.
Deploying a configuration template causes the device to reboot. Use
Deploy Later if you do not want the device rebooted at the current time.
In the Set Policy Info and Deploy Schedule dialog, enter a Policy name and the
Start date (date and time) you want to deploy the configuration.
9-37
Managing Device Configurations
Using Configuration Templates
Figure 9-32. Deploy Configuration, Set schedule for deployment
Click Next to continue to the configuration file transfer selection.
Figure 9-33. Deploy Configuration Template: file transfer selection
6.
Select the file transfer method to use for transferring the configuration
text from the device to PCM:
•
9-38
The default method for configuration file transfer is based on what is
defined in Global Preferences for Configuration Management. At
initial PCM+ installation, the default is "Use TFTP for configuration file
transfer".
Managing Device Configurations
Using Configuration Templates
•
You can change the mode of transfer for this particular run of the Scan
Wizard by selecting "Use Secure Copy for configuration file transfer".
Secure Copy (SCP) works with SSH v1 and SSH v2 to provide a more
secure file transfer method between PCM and the managed switch.
•
If you are unsure whether all the devices in your network support the
use of SCP, select the Allow TFTP if Secure Copy is not supported, and Allow
TFTP if Secure Copy Fails options. If Allow TFTP failover options are not set,
the scan configuration operation will report errors if SCP is not
supported on the target device.
Enabling SCP modifies the device's configuration the first time it is
scanned. The option to use TFTP as a failover mode of configuration
scan applies to one single run of the scan wizard. However, if you use
this feature, every switch between TFTP and SCP subsequently modifies the configuration again.
Note:
If a switch is configured to use either RADIUS or TACACS+ for authenticating
a secure SSH session on the switch, you cannot enable SCP. The switch
displays an error message if there is an attempt to configure either option
when the other is already configured.
7.
Click Next to continue.
a.
If you chose to Deploy Now (or set the Deploy Schedule for ASAP) a
confirmation dialog displays.
Figure 9-34. Deploy Configuration Template, confirmation dialog
9-39
Managing Device Configurations
Using Configuration Templates
8.
Click Next to continue to the Review screen.
Figure 9-35. Deploy Configuration Template, target device review
9.
Click Finish to complete the configuration template deployment.
A status window displays the progress of the deployment.
•
Successful - The configuration deployed successfully.
•
Deployment Failed - The configuration was not deployed due to a bad
connection, nonexistent or invalid file, or invalid permissions.
•
Configuration files identical - No changes are made because the configuration file on the device is identical to the configuration deployed.
Click Close to exit the Deploy Wizard.
An alternate method for deploying a configuration template is to go to the
Configuration Templates window, select the template to be deployed, then
click the Deploy Template button in the toolbar to launch the wizard.
9-40
Managing Device Configurations
Exporting Device Configurations
Exporting Device Configurations
To help you document network device configurations, you can use the Export
Configurations feature in the Configuration Manager. The Export Device
Configurations wizard will save a text copy of any configuration information
found in the configuration history for a device. The exported files are stored
in the <install directory>\\PNM\server\config\devConfig\export directory with a file
extension of .cfg. You can then read and print the ASCII files using a simple
text editor such as NotePad.
To export device configuration files:
1.
Click the Device group node, or individual device node in the navigation
tree, or select the device(s) in the Devices List tab.
2.
Select the Export Configurations option in the Configuration Manager
toolbar menu, or from the Configuration Manager menu off of the rightclick menu.
This launches the Export Device Configurations wizard, with the list of
selected devices.
Figure 9-36. Export Device Configuration Wizard, Review devices
9-41
Managing Device Configurations
Exporting Device Configurations
3.
Review the list of devices to be included in the configuration export, then
click Next to begin the export operation.
Click Cancel to exit the wizard if you do not want to continue with the
configuration export, or if the devices list is incorrect.
4.
The wizard displays the status of the configuration file export process.
Figure 9-37. Export Configuration, export status display
You will see three files created for each device configuration:
•
HwCfg.cfg; contains the device hardware configuration, including
installed modules, switch fans, ports, etc.
•
SwCfg.cfg: contains the switch software configuration, including
SNMP settings, VLANs, port settings, etc.
•
OsCfg.cfg: contains a list of the Switch OS and boot ROM versions that
are installed on the device.
The exported files are stored in the <install directory>\\PNM\server\config\devConfig\export directory with a file extension of .cfg. The file names are a
concatenation of the device IP address, file scan date and time, and file
type. If there is more than one configuration for the device found in the
configuration history, a separate file is created for each configuration.
5.
9-42
After the <Export complete> message displays, click Close to exit the
wizard.
Managing Device Configurations
Importing Device Configurations
Importing Device Configurations
The exported configuration files can be saved to another system as part of a
DRP (disaster recovery plan), or they can be used to document network device
configurations for audit purposes. You can also use an exported configuration
as a template to create configurations for new ProCurve devices of the same
type. You can import a configuration through PCM to apply the configuration
to a new device, or to restore an existing device’s configuration.
The Import Device Configurations wizard lets you import an ASCII text file
for a device configuration into the PCM configuration history database. The
configuration files to be imported must use the standard configuration file
naming conventions:
IPAddr_Date_Time_Type.cfg
where:
•
IPAddr = the IP address for the device, with the "." replaced by an
underscore "_".
•
Date = The date the configuration was captured or created, given in
YYYYMMDD format.
•
Time = The time the configuration was captured or created, given in
HHMM format. Hours (HH) uses a 24 hour clock, with digits 00 to 23.
•
Type = The Configuration file type, one of the following:
– HwCfg; contains the device hardware configuration, including
installed modules, switch fans, ports, etc.
– SwCfg: contains the switch software configuration, including
SNMP settings, VLANs, port settings, etc.
– OsCfg: contains the Firmware revision code, ROM revision code,
and finally the OS revision code (not used) The file must give this
information in three lines, in the order listed here. (Firmware,
ROM, OS)
All files must have the .cfg file extension. The .cfg files to be imported must be
copied to the <install directory>\PNM\server\config\devConfig\import directory.
The contents of each file is expected to contain the device's configuration data
as ASCII text, although binary data will be accepted. The maximum data size
of an import configuration file is 4MB.
To import the .cfg files from the import directory into the PCM configuration
history database:
9-43
Managing Device Configurations
Importing Device Configurations
1.
Click the Interconnect Devices, or a device group node in the navigation
tree to display the Interconnect Devices window.
2.
Select the Import Configurations option in the Configuration Manager
toolbar menu, or from the Configuration Manager menu off of the rightclick menu.
This launches the Import Device Configurations wizard, with the list of
selected devices.
Figure 9-38. Review Import devices dialog
3.
Review the list of devices to be included in the configuration import, then
click Next to continue to the Select Import Options dialog.
Click Cancel to exit the import wizard if the list of devices is incomplete
or incorrect.
4.
In the Select Import Options dialog, click the checkbox to select the Delete
existing device scan configurations option.
This will delete all of the preexisting scanned configurations for a device
prior to importing new configuration data from the import directory. This
allows you to avoid the case where you want to import a configuration,
but that system has a configuration (via configuration scan) that is newer
that the configuration being imported, which would prevent the import of
the configuration data. The device's preexisting scanned configurations
are only deleted if one or more import files are found for the device.
9-44
Managing Device Configurations
Importing Device Configurations
Figure 9-39. Select Import Options dialog
5.
Click Next to continue the configuration import.
The wizard displays the status of the configuration file import process.
Figure 9-40. Import Configuration Wizard: import status dialog
9-45
Managing Device Configurations
Importing Device Configurations
When the import operation is launched, PCM will look for files in the
<install directory>\PNM\server\config\devConfig\import directory that have a
matching IP address in their name. PCM sorts the device files by date
and time and reads them in from oldest to newest, storing each file’s data
as the configuration for the device and using the date and time information
for the imported file as the scan time and date.
You will see up to three files imported for each device configuration:
•
HwCfg.cfg; contains the device hardware configuration, including
installed modules, switch fans, ports, etc.
•
SwCfg.cfg: contains the switch software configuration, including
SNMP settings, VLANs, port settings, etc.
•
OsCfg.cfg: contains a list of the Switch OS and boot ROM versions that
are installed on the device.
PCM will only import the file if its date is newer than the latest configuration information stored in the PCM database. If the date of the import
files are older than the last configuration a failure message is displayed
for the file import.
6.
After the <Import complete> message displays, click Close to exit the
wizard.
When reviewing the device configuration history, the Comment column will
show that the configuration file is "imported".
9-46
Managing Device Configurations
Using the Software Licensing Feature
Using the Software Licensing Feature
For those ProCurve Devices that support the use of premium software that
requires registration of the software license, you can use the License Software
wizard to automatically register the switch software license on the "My
ProCurve" Web site.
To use the PCM Software Licensing feature:
1.
Right-click the device in the Devices List, or the device Node in the Navigation tree.
2.
Select the Config Manager->License Software option. This launches the License
Software Wizard.
Figure 9-41. Premium Switch Software Licensing wizard
3.
Click Next to continue to the Enter Your License Information window.
9-47
Managing Device Configurations
Using the Software Licensing Feature
Figure 9-42. Switch Software License Information
4.
5.
9-48
Enter the License information:
a.
Select a Package from the pull-down menu.
b.
Type (or paste) the Registration ID that you received when the software
was purchased.
c.
Type a brief Description for the license, which will appear in the "My
ProCurve" portal window. This is optional, not required.
d.
Click the check box if you want to Save device configuration changes
before the device is rebooted. (When the License information is
updated, the device is rebooted and any configuration changes are
saved in the device’s flash memory).
Click Next to continue to the license confirmation window.
Managing Device Configurations
Using the Software Licensing Feature
Figure 9-43. Switch Software License Confirmation
6.
Review the Registration ID and License Agreement, then click the check box to
indicate I agree to the terms of the License Agreement.
7.
Click Next to continue to the Monitor license deployment window.
Figure 9-44. Switch Software Licensing, deployment status display
8.
The window displays the progress as the license is deployed to the device.
When Licensing is complete, click Finish to exit the wizard.
9-49
Managing Device Configurations
Using the Software Licensing Feature
To use the PCM Software Unlicensing feature:
Over time, you may need to move your licensed software from one device to
another. In order to do this, you need to first "unlicense" the software on the
device where it was originally installed.
1.
Right-click the device in the Devices List, or the device Node in the Navigation tree.
2.
Select the Config Manager->Unlicense Software option. This launches the
Unlicense Software Wizard.
Figure 9-45. Premium Switch Software, Unlicense Software wizard
3.
9-50
Click Next to continue to the Enter Your Unlicense Information window.
Managing Device Configurations
Using the Software Licensing Feature
Figure 9-46. Switch Software Unlicense Information
4.
5.
Enter the Unlicense information:
a.
Select a Package from the pull-down menu.
b.
Click the check box if you want to Save device configuration changes
before the device is rebooted. (When the License information is
updated, the device is rebooted and any configuration changes are
saved in the device’s flash memory).
Click Next to continue to the Unlicense confirmation window.
Figure 9-47. Switch Software, Unlicense Confirmation
9-51
Managing Device Configurations
Using the Software Licensing Feature
6.
Click Next to continue to the Monitor unlicense progress window.
Figure 9-48. Switch Software Unlicensing, status display
7.
9-52
The window displays the progress as the unlicensing operation is performed on the device. When Unlicensing is complete, click Finish to exit
the wizard.
Managing Device Configurations
Configuration Management Preferences
Configuration Management Preferences
To set the Configuration Manager preferences, click the Preferences icon in
the global toolbar, then select (click) the Configuration Management option
in the Global menu.
Figure 9-49. Global Preferences:Configuration Management settings
■
You can type in changes to the Configuration History Pruning and Performance
Tuning parameters, or use the buttons to increase or decrease the
parameters.
9-53
Managing Device Configurations
Configuration Management Preferences
The default entry for Maximum Configurations is 0, which allows an unlimited number of configuration. If you set a non-zero value, an attempt is
made once per day to reduce the number of saved configurations to the
specified value by deleting the oldest configurations.
The Remove Configurations default of 0 indicates that no configurations will
be removed.
The Log scan failures option is used to log an entry in the Events browser
when a configuration scan fails. The event source is Configuration Manager,
and severity is Informational. The Log scan differences option is used to log
an entry in the Events browser whenever a device configuration changes.
The Send CLI commands to option indicates the maximum number of
devices to which CLI commands can be deployed at the same time. The
default is 5. Use the buttons to increase or decrease the allowed number
of devices.
■
The Security section lets you select the default file transfer method you
want to use for transferring sensitive switch configuration files
between the switch and PCM.
The default preference is Use TFTP for configuration file transfer to transfer
configuration files between the switch and PCM.
Click to select the Use Secure Copy for configuration file transfer option to
make Secure Copy (SCP) the default configuration file transfer method.
SCP is an implementation of the BSD rcp (Berkeley UNIX remote copy)
command tunneled through an SSH connection. SCP works with SSH v1
and SSH v2 to provide a more secure file transfer method.
Note:
If a switch is configured to use either RADIUS or TACACS+ for authenticating a secure SSH session on the switch, you cannot enable SCP. The
switch displays an error message if there is an attempt to configure either
option when the other is already configured.
If you are unsure whether all the devices in your network support the use
of SCP, select the Allow TFTP if Secure Copy is not supported, and Allow TFTP
if Secure Copy Fails options. If Allow TFTP failover options are not set, the
configuration scan and deploy operations will report errors if SCP is not
supported on the target device.
■
9-54
The Software Update section lets you get the latest switch OS versions
by clicking the Download now! button. PCM will go out to the
ProCurve support Web site and download a listing of the latest switch
software versions. The Last Downloaded field will display the most
recent download date and time.
Managing Device Configurations
Configuration Management Preferences
Setting Preferred Switch Software Versions
The Switch Software window lets you select the software configuration
version you want to use for each device type. In a preferred version is not
identified, the most recent switch software version is used for software
updates.
To set the preferred software configuration version:
1.
Navigate to the Switch Software window.
[Preferences->Configuration Management->Switch Software]
Figure 9-50. Global Preferences: Switch Software settings window
2.
Scroll down the Device Types list and select the device type you want to set.
3.
To use the most recent software configuration to update devices, check
the Prefer the latest version checkbox.
To use a specific version, use the up and down arrow keys to select the
desired version from the Version field.
4.
Click OK to save the settings and close the Switch Software window.
9-55
Managing Device Configurations
Configuration Management Preferences
Network (Proxy) Settings
PCM+ needs external web access to retrieve the latest switch software files
for ProCurve network devices from the ProCurve web site. If the HTTP proxy
was not configured at installation, or if the proxy server has changed, use the
Network Settings Preferences to configure the Proxy settings.
1.
Select Preferences->Network Settings.
Figure 9-51. Global Preferences: Network Settings window
2.
3.
4.
5.
9-56
Click the Use proxy check box, if it is not already selected.
For HTTP proxy:
a.
In the HTTP Proxy field, type the DNS name or IP address of the proxy
server for the subnet.
b.
In the Port field, type the port number used to access the proxy.
For SOCKS proxy:
a.
In the SOCKS Host field, type the SOCKS server (host) name.
b.
Enter the Port number used to access the SOCKS server.
c.
Click to select the SOCKS version to use. (SOCKS v4 or SOCKS v5).
d.
For SOCKS v5 enter the Username and Password used to access the
SOCKS host.
Click OK to save the network settings and close the window.
Managing Device Configurations
Updating Switch Software
Updating Switch Software
HP provides periodic software updates for ProCurve switches via the
ProCurve Support Web site. You can use the Software update feature in PCM+
to automatically download and apply updates to devices at scheduled times.
Downloading the Software Version List
When you review the Configurations listing, the "Version" column in the
display indicates whether the device is running the preferred switch software
version (by default the most recent version of the software). This is done by
comparing the current software version found in the MIB during the configuration scan to the current software listing and the option set in the Preferences.
To download the latest listing of ProCurve Switch Software versions:
1.
Select the Configuration Management option in the Preferences menu (see
figure 9-49 on page 9-53).
2.
Click the Download now! button in the Software Update section of the
window.
This will download a listing of the current switch software revisions from
the ProCurve Web site to the PCM server.
(server/data/download/procurve_firmware.prp).
You can also sign up for the driver update notification at: http://
h30046.www3.hp.com/driverAlertProfile.php?referer=/
subprofile_summary.php.
Using the Software Index File Download Policy
You can create a Policy to check for software updates, on the ProCurve Web
site at scheduled intervals, and automatically download updates to the PCM
server. See Chapter 13, “Using Policy Manager Features” for details.
9-57
Managing Device Configurations
Updating Switch Software
Scheduling Automatic Updates
To schedule devices for automatic software updates, or to edit an existing
software update schedule:
1.
Select the Interconnect Devices node or Device Group node in the navigation tree
2.
Select the device or devices in the Devices List or Configurations tab display.
3.
Click the Software Update icon in the toolbar to launch the Software Update
Wizard.
Figure 9-52. Software Update Wizard, schedule dialogue
4.
Click in the dialogue to enable the Schedule and Skip buttons, then set the
Action to Schedule or Skip (exclude) for each device.
If the devices were not previously scheduled, the Action defaults to Schedule and you can continue with no other action set up.
If you set the Action to Skip for all devices in the list, there is no other setup
required. Click Cancel to exit the Wizard.
5.
9-58
Click Next to display the Scan devices dialogue.
Managing Device Configurations
Updating Switch Software
Figure 9-53. Software Update Wizard, Scan devices dialogue
The wizard will scan to get the current software state for each device.
6.
When the scan (Refresh) is complete, click Next to display the Select
Version dialogue.
Figure 9-54. Software Update Wizard, Select version dialogue
The Primary column lists the primary software image (primary flash) found
on the device. The Secondary column lists the secondary software image
(secondary flash) found on the device, if any. An asterisk (*) next to the
software version indicates the software image that is currently running,
or "boot flash". In some cases you may use the Secondary image until you
9-59
Managing Device Configurations
Updating Switch Software
have determined compatibility between newer software versions and
your existing device configuration. Note that secondary images are only
available in dual image devices.
7.
Click the check box to select which software image you want to update
on the device, Primary or Secondary.
8.
Click the Select Version box to enable the software version pull-down
menu, then select the version you want to upload to the device. The pulldown menu lists all software versions currently available for the device.
To update all devices to the newest software available, click Set all to latest
version.
9.
PCM will check to make sure the current switch configuration meets all
prerequisites for installing the newest software version.
If the pre-requisite software was found on the PCM server but is not
installed on the switch, a pop-up dialogue appears, informing you what
prerequisites (BootROM version and Firmware) must be met before you
can install the newest switch software version, as well as the current
software version on the switch.
Click Yes to select and install the prerequisite software, needed before
you can install the newest switch software version.
Click No if you do not want to update the switch software at this time.
If the software image was not found on the PCM server, a pop-up informs
you what prerequisites (BootROM version and Firmware) are needed,
what the currently installed software version is, and that the pre-requisite
software needs to be acquired from HP.
Click OK to close the dialogue.
If you selected the Set all to latest version option, any pre-requisite software
will be installed and the latest version will be applied to the switches.
10. Click Next to display the Setup dialogue.
9-60
Managing Device Configurations
Updating Switch Software
Figure 9-55. Software Update Wizard, Setup update dialogue
11. The software update Setup will have the Reboot option selected (checked)
by default. This indicates that the system should be automatically rebooted after the software is updated. If you do not want the system to be
rebooted, de-select the Reboot option.
12. Set the Time that you want the software update to be performed. You can
type in the date, or use the buttons to increase or decrease the entries for
date and time.
Caution:
If you enter a time that is earlier than the current date and time, and there is
a more recent software update, PCM will attempt to perform the update and
reboot the switch immediately.
The system will be rebooted on the currently running software. If you
selected to update the Secondary software image, and the Primary software image is the currently running version on the device, the device will
be rebooted using the Primary image, not the updated software version.
To reboot the device using the updated software version, you will need to
do a manual reboot with the Secondary software image.
13. Click Finish to save the Software Update schedule and exit the Software
Update Wizard.
9-61
Managing Device Configurations
Updating Switch Software
Reviewing Software Update Status
To review scheduled switch software updates, select a Device Group node in the
navigation tree, then click the Software Update Status icon in the main PCM
toolbar.
Figure 9-56. Switch Software Update Status dialogue
The Software Update Status dialogue displays the devices currently set up in
the software update schedule with the following information:
9-62
•
Device - Name or IP address of the device to be updated.
•
Image - The software image to be updated, primary or secondary.
•
Version - The version number of the software update
•
Reboot - A check mark indicates that the device will reboot automatically after the software is updated.
•
Scheduled - Date and time the software update is scheduled to occur.
•
Status - Current status of the software update. Possible status types
are: Waiting, Update Completed, Error (update failed).
Managing Device Configurations
Updating Switch Software
Deleting Scheduled Software Updates
To delete a device from a scheduled software update:
1.
Select the device in the Software Update Status dialogue.
2.
Click Delete.
3.
Click OK in the confirmation pop-up to complete the process. The device
will be removed from the software update schedule and the Software
Update Status dialogue will be updated.
To delete an entire Software update schedule, use the Software Update Status
dialogue to delete each of the devices included in the schedule.
Use the Software Update Wizard if you want to exclude (skip) a device from
a scheduled software update without deleting it from the schedule.
9-63
Managing Device Configurations
Updating Switch Software
(This page intentionally left blank)
9-64
10
Working with Custom Groups
Chapter Contents
About Custom Groups . . . . . . . . . . . . . . . . . . . 10-2
What’s new in PCM 2.2 . . . . . . . . . . . . . . 10-2
Rules of Custom Groups: . . . . . . . . . . . . . 10-2
Creating Custom Groups . . . . . . . . . . . . . . . . 10-3
Adding Devices to a Group . . . . . . . . . . . . . . . 10-5
Adding Device Ports to a Group . . . . . . . . 10-6
"Easy Add" Method for Creating a Group 10-9
Modifying Groups . . . . . . . . . . . . . . . . . . . . . . 10-8
Using the Group Membership Wizard . . 10-11
Removing Devices from Groups . . . . . . . 10-13
Deleting A Custom Group . . . . . . . . . . . 10-14
10-1
Working with Custom Groups
About Custom Groups
About Custom Groups
ProCurve comes with defined device groups for each of the managed
ProCurve device types. A custom group can contain different device types
and/or individual ports from several devices. You can create custom groups
for any reason, to define a specific network segment for application of
Policies, to simplify device management tasks, or for monitoring purposes.
When you create a custom group, it is added as another group node under the
PCM Custom Groups in the navigation tree, where other PCM components
provide the same level of functionality that applies to the default ProCurve
device groups.
What’s new in PCM 2.2
The Custom Groups feature in PCM+ now gives you the ability to create a
hierarchy of folders, each of which can contain devices or subfolders. You can
create a Group or sub-group to match your network "locations", and define a
group of devices and/or device ports that match your network structure
(logical and/or physical). For example, you can create a Group Folder with
the name Roseville, then create two custom group/location folders within the
Roseville folder, one named Bldg-R3, and one named Bldg-R4.
The custom groups can be defined with devices or individual device ports,
such that a single device spans several groups, so you can match device ports
to network locations.
Rules of Custom Groups:
■
A "Custom Group Folder" can only contain sub-folders ("Custom
Group/Location"). It cannot contain devices.
■
A Group/Location) folder can only contain Devices or ports. I cannot
have additional sub-folders.
If you want to use sub-groups, all custom groups must use the
CustomGroup->Group/Location->devices structure. You cannot create a
sub-folder in a folder that contains devices.
■
A Device:Port pair may belong to more than one custom group. For
example:
•
10-2
If you create two custom groups, Roseville and Lincoln,
•
In Roseville you create the HR-1 sub-group (Roseville.HR-1)
•
In Lincoln you create the HR-2 sub-group (Lincoln.HR-2)
•
Device 15.155.12.3 can be added in both HR subgroups.
Working with Custom Groups
Creating Custom Groups
Creating Custom Groups
To create a custom group, expand the Interconnect Devices node in the
navigation tree, then click on the Custom Groups node to display the Custom
Groups window.
Figure 10-1. Custom Groups window
1.
Click the Add Group icon in the toolbar to launch the Create Group dialog
box. (See figure 10-2 on the next page.)
2.
Type in the Group Name. This is the name that will appear in the tree for
the Group folder, or the Custom Group name. The name can contain
alphanumeric characters, spaces, and special characters.
3.
Enter a brief description for the group in the Description field.
4.
Click the radio button to select the Group type:
•
Custom Group Folder: Create a folder to which you can add sub-Group/
Location folders, or devices and/or device ports. Note that the "device
auto-add filter" is disabled for Custom Group Folders.
•
Custom Group/Location: Create a group/location (sub-folder) to which
only devices and/or device ports can be added. This will also enable
the "device auto-add" filter options.
10-3
Working with Custom Groups
Creating Custom Groups
Figure 10-2. Custom Groups, Create Group window
5.
For Custom Group/Locations, click Enable device auto-add to add newly
discovered devices that meet the group (filter) criteria, and to enable use
of the Group Membership Wizard, as described starting on page 10-11.
When using the "auto-add" feature, configure the "add" criteria by clicking
the appropriate checkbox, and selecting filter options from the pull-down
menus provided.
Any: Adds all newly discovered devices to the group.
•
10-4
Filtered: Add only devices meeting the specified filter criteria, which
can be any one or combination of the following:
– Subnet: Enter the subnet address. Only new devices with IP
addresses that are members of the specified subnet will be automatically added to the group.
– Product: Select the ProCurve product group (2800, 5300xl, etc.)
from the pull-down menu. Only new devices belonging to that
product class will be automatically added to the group.
– Device Type: Select the specific switch name (model) from the pulldown menu. Only new devices of the specified model are automatically added to the group.
Working with Custom Groups
Creating Custom Groups
–
Contact: Enter a contact name. New devices with this contact
name configured will be added automatically to the group.
Tip :
6.
Auto-membership rules can be triggered retroactively, using the
group membership wizard.
Click OK to save the new Group and exit the window.
The Custom Groups lists will be updated with the new Group information.
Adding Devices to a Group
To add devices to a group, select the device in the Devices List, then click the
Add Device to Group icon in the Device List toolbar.
You can use [Shift + click] or [Ctrl + click] to select multiple devices at once.
This launches the Add Devices to a Group dialog.
Figure 10-3. Add Devices to a Group dialog.
1.
Click the Select a Custom Group button to open the Group Selection dialog
10-5
Working with Custom Groups
Creating Custom Groups
Figure 10-4. Add Device to Group; Group Selection
2.
Click to select a location from the list.
Click Create new... to launch the Create Group window and create a new
group. (see “Creating Custom Groups” on page 10-3).
3.
Click Ok to save the group assignment and return to the "Add Devices to
Group" window.
4.
Click Ok to close the dialog and return to the main PCM (Devices List)
window.
Adding Device Ports to a Group
The simplest Group configuration is the pre-defined device groups for
ProCurve devices in the navigation tree. When you create custom groups they
can contain any combination of ProCurve managed network devices discovered by PCM. You can create a group that consists of devices, or individual
ports on a device to correspond with location specific VLANs.
To add individual ports to a custom group:
1.
10-6
Follow the procedure for adding a device, and when the device appears
in the Custom Group Devices list on the Add Devices to Group window, click
the + to expand the display to show the device ports.
Working with Custom Groups
Creating Custom Groups
2.
Click the Add to Group checkbox for the device to deselect all ports, and
clear the selection (radio buttons) for each port.
3.
Click the radio button to select the ports you want to include in the
location.
4.
Optionally, you can use the check boxes to select a port classification to
apply for inclusion in the group:
•
Only add edge ports - will include only ports classified as edge ports in
the group.
•
Only add inter-switch ports - will include only ports classified as interswitch (infrastructure) ports.
5.
Click OK to save the selections and close the window.
6.
Verify the configuration by clicking the group (location) node in the tree,
then click the Devices tab to view the list of ports included in the location.
10-7
Working with Custom Groups
Creating Custom Groups
Modifying Groups
To modify a Custom Group:
1.
Select the Custom Groups node in the navigation tree to display the Group
Name list in the Custom Groups tab.
2.
Select the Group in the Group Name list.
3.
Click the Modify Group icon in the device list toolbar.
The Modify Group dialog is displayed, (similar to Create Group) allowing
you to edit the Group Name and Description text, and the Device Autoadd options.
4.
Click Ok to save your changes and update the Group information.
The process to add devices to an existing group is the same as described
previously, see “Adding Devices to a Group” on page 10-5.
To modify a Custom Group/Location (sub-group):
1.
Navigate to the Custom Group window, Folder List tab:
a.
Select the Custom Groups node in the navigation tree to display the
Group Names list.
b.
Double-click the Custom Group in the Group Name list.
c.
Click the Folder List tab.
Alternately
a.
Expand the Custom Groups node in the navigation tree to display the
custom groups
b.
Select the Custom Group to display the Group window.
c.
Click the Folder List tab.
2.
Select the Group Name in the Folder list tab
3.
Click the Modify Group icon in the device list toolbar.
The Modify Group dialog is displayed, (similar to Create Group) allowing
you to edit the Group Name and Description text, and the Device Autoadd options.
4.
10-8
Click Ok to save your changes and update the Group information.
Working with Custom Groups
Creating Custom Groups
"Easy Add" Method for Creating a Group
You can create a group and add the devices at the same time.
1.
In the Devices List window, select all of the devices you want to include in
the group, then click the Add Devices to Group icon in the toolbar.
Figure 10-5. Add Devices to a Group dialog
2.
Click the Select a Location button to display the Location Selection dialog
3.
Click Create new... to display the Group Folder Selection dialog
10-9
Working with Custom Groups
Creating Custom Groups
Figure 10-6. Custom Group folder selection
4.
Select None, or the group folder where you want to create the group.
5.
Click Ok to launch the Create Group dialog. (See figure 10-2 on page 10-4.)
6.
Enter the Group Name and Description, then click Ok to return to the Select
Location dialog. The new group appears in the Locations list.
Select the group then click Ok to return to the Add Devices to a Group dialog.
The Location field is populated with the new Group information, and the
Device Port Selection list includes the originally selected devices.
7.
Click Ok to complete the add.
The new Group appears under the Custom Groups folder in the navigation
tree on the left.
10-10
Working with Custom Groups
Creating Custom Groups
Using the Group Membership Wizard
Use the Group Membership Wizard to take advantage of the device auto-add
feature and quickly add new devices or remove devices from the group.
1.
2.
Select the Group you want to update from the Custom Groups window, or
under the Custom Groups node in the navigation tree.
Click the Group Membership icon in the toolbar to launch the Group Member
Wizard.
3.
Review the group information. If you want to change the group to enable
device auto-add, click Modify group... to launch the Modify Group dialog
and set the Enable auto-add option and configure the filter settings.
(Refer to figure 10-2 on page 10-4)
4.
Click Next to proceed with the member add.
The Auto-select members window displays.
10-11
Working with Custom Groups
Creating Custom Groups
5.
10-12
Click to select the options you want to apply when adding members to the
group.
•
Remove devices not matching filters will cause the wizard to remove
devices that are currently members of the group but that no longer
meet the criteria of the filter. If unchecked, no members will be
removed.
•
Apply associated policies to new members will cause any policies associated with this group will be executed against the new devices that
are found and added to the group.
6.
Click Find to complete the process. The wizard will display the devices
that are found and added, and any devices that are removed.
7.
Click Close to exit the wizard
Working with Custom Groups
Creating Custom Groups
Removing Devices from Groups
To remove a device from a Group:
1.
Click the Custom Groups node in the navigation tree to display the group
names.
2.
Click the Group name in the tree, and click the Devices tab for the group.
3.
Select the device in the Devices List, then click the Remove from Group icon
in the toolbar.
4.
Click Yes in the confirmation dialog to complete the process and update
the Group devices list.
To remove a device from multiple groups at the same time, select the device
in the navigation tree or Interconnect Devices list, then use the right click menu
and select the Remove from Group option. This launches the Remove from Group
dialog.
The Remove button is enabled when you select a group or groups in the list.
When you click Remove, the dialog is closed, and the device list for the selected
groups are updated.
10-13
Working with Custom Groups
Creating Custom Groups
Deleting A Custom Group
To delete a Group:
1.
Select the Custom Groups node in the navigation tree to display the Custom
Groups table.
2.
Select the Group name in the groups table.
3.
Click the Delete Group icon in the toolbar. A confirmation dialog will be
displayed.
4.
Click Yes to update the Custom Group information.
Another dialog indicating the group has been deleted will be displayed.
Click OK to close the dialog and return to the PCM window.
An alternate method for deleting a group is:
10-14
1.
Expand the Custom Groups node in the navigation tree to display the
custom group names,
2.
Right-click on the group name and select Delete from the menu.
11
Using VLANs
Chapter Contents
About VLANs. . . . . . . . . . . . . . . . . . . . . . . . . . . . . . . . . 11-2
Viewing VLAN Groups (Maps) . . . . . . . . . . . . . . . . . . . 11-3
Creating a VLAN. . . . . . . . . . . . . . . . . . . . . . . . . . . . . . 11-6
Modifying VLANs . . . . . . . . . . . . . . . . . . . . . . . . . . . . . 11-9
Configuring Multiple IP Addresses for VLANs . . 11-9
Adding a Device to a VLAN . . . . . . . . . . . . . . . . . 11-10
Removing a Device from a VLAN . . . . . . . . . . . . 11-13
Making VLANs Static . . . . . . . . . . . . . . . . . . . . . 11-14
Making a VLAN Primary . . . . . . . . . . . . . . . . . . . 11-14
Deleting a VLAN . . . . . . . . . . . . . . . . . . . . . . . . . 11-15
Modifying VLAN Support on a Device . . . . . . . . . . . . 11-16
Port Assignments on a Device . . . . . . . . . . . . . . . 11-21
Modifying Port Assignments . . . . . . . . . . . . . . . . 11-22
Modifying GVRP Port Properties . . . . . . . . . . . . 11-23
Using IGMP to Manage Multicast Traffic . . . . . . . . . 11-24
Enabling IGMP on VLANs . . . . . . . . . . . . . . . . . 11-24
IGMP Settings for Routing Switches. . . . . . . . . . 11-28
To Modify IGMP Settings . . . . . . . . . . . . . . . . . . . 11-28
11-1
Using VLANs
About VLANs
About VLANs
A VLAN is a group of ports designated by the switch as belonging to the same
broadcast domain. That is, all ports carrying traffic for a particular subnet
address would belong to the same VLAN.
Using a VLAN, you can group users by logical function instead of physical
location. This helps to control bandwidth usage by allowing you to group highbandwidth users on low-traffic segments and to organize users from different
LAN segments according to their need for common resources.
The benefits of VLANs include:
■
Grouping users into logical networks for increased performance.
■
Providing an easy, flexible, less costly way to modify logical groups
in changing environments.
■
Preserving current investment in equipment and cabling.
■
Allowing administrators to “fine tune” the network.
■
Providing independence from the physical topology of the network.
■
Improved security for the network.
At default settings, all ports on ProCurve 2500, 2800, 4100gl, and 5300xl series
switches are members of the default VLAN, with a VLAN ID of 1 and VLAN
Name DEFAULT_VLAN. This means that, until you have defined additional
VLANs, all of the hosts connected to these switches are in the same VLAN.
The default VLAN is also the primary VLAN. The primary VLAN is the VLAN
the switch uses to run and manage DHCP or Bootp, and stacking features.
You can designate another VLAN as primary; however it must be a static VLAN,
it cannot be a dynamic (GVRP learned) VLAN.
You can use the PCM+ VLAN Manager to partition switches into multiple
virtual broadcast domains by adding one or more additional VLANs and
configuring ports for the new VLANs. You can change the name of the default
VLAN, but you cannot change the default VLAN’s ID (which is always “1”).
Although you can remove all ports from the default VLAN, this VLAN is always
present; that is, you cannot delete it from the switches that have this default
configuration.
For a more detailed description of VLANs and GVRP, please refer to the
"Management and Configuration Guide" for your switch.
11-2
Using VLANs
Viewing VLAN Groups (Maps)
Viewing VLAN Groups (Maps)
To view a listing of currently configured VLANs in your network, expand the
Network Map node in the navigation tree, then click the VLANS node.
Figure 11-1. VLAN List
You can click on the VLAN in either the navigation tree or the VLAN list to
view the VLAN Map.
Figure 11-2. VLAN Map display
11-3
Using VLANs
Viewing VLAN Groups (Maps)
The VLAN ID (VID) is shown on the tab for the display, and the Port Properties
tab is enabled. Otherwise, the map functionality is the same as described in
Chapter 4, “Using Network Maps”.
To review the port properties for the VLAN, click the Port Properties tab. This is
a view only display, you cannot alter the port properties in this screen. Refer
to the discussion of VLAN Port configuration on page 11-7, or “Modifying Port
Assignments” on page 11-22 for more information.
Figure 11-3. VLAN Port Properties display.
The VLAN Port Properties display lists
11-4
■
The device and ports
■
The port properties, one of:
•
Tagged: Port can be included in multiple VLANs.
•
Untagged: Port can be included in only one VLAN.
•
Forbidden: Port cannot be included in this VLAN.
•
Not Used: The port is not included in this VLAN.
■
IP Address if applicable
■
VLAN Name
■
VLAN Type (static or dynamic)
Using VLANs
Viewing VLAN Groups (Maps)
VLAN Configuration Detail
To review the VLANs configurations for the device:
■
Select the device in the Interconnect Devices List, then select the
Show VLANs option from the VLAN toolbar menu, or
■
Select the device in the Navigation tree and use the right-click menu
to select the VLAN Manager->Show VLAN option.
Figure 11-4. Show VLAN List for Device window.
The VLAN list includes the VLAN Name, ID, Type, and Management status for all
VLANs configured on the device.
11-5
Using VLANs
Creating a VLAN
Creating a VLAN
You can create a VLAN using the VLAN Wizard as described in this section, or
using a VLAN Policy. See Chapter 13 “Using Policy Manager Features” for
details.
To launch the Create VLAN Wizard:
1.
Select a device in the Devices List tab, then use right-click menu or toolbar
menu to select the VLAN Manager->Create VLAN.
The following examples of the Create VLAN Wizard dialogs explain the data
needed to create a VLAN.
Figure 11-5. Set VLAN ID dialog
1.
Enter VLAN ID. This is a numeric value between 2 and 4094. The number
1 is reserved for the default VLAN.
2.
In the next dialog, configure how the IP Address information for the VLAN
will be determined, and configure the ports on the device to be included
in the VLAN.
Note that the Port column lists the port number on the device, and whether
or not the port is currently active (green), or disabled (red).
11-6
Using VLANs
Creating a VLAN
Figure 11-6. VLAN Port configuration dialog
a.
Use the drop down menu to select the IP Config method for the IP
address used for the VLAN:
– Manual: Set the IP address at the console. When selected, the IP
Address and Subnet Mask fields will be enabled so you can type
in the IP Configuration information. This also enables the Add/
Remove additional IPs option.
– Disabled: IP is disabled and there is no access to management or
telnet. NOT RECOMMENDED
– DHCP/Bootp: The Bootp (or DHCP) protocol automatically sets the
IP Address. This is used for dynamic VLANs with devices that
support GVRP (IEEE 802.1Q standard)
b.
If the device supports multiple IP addresses (multinetting) and you
select Manual IP configuration, click the Add/Remove additional IP's
button and enter the IP address and related subnet mask for each
additional IP address used.
c.
Use the radio buttons to select the VLAN option for each port. If you
select the option at the top level (A, B, etc.) for a group of ports, it will
be applied to all ports in the group.
11-7
Using VLANs
Creating a VLAN
The VLAN port options are:
– Tagged: Port can be included in multiple VLANs.
– Untagged: Port can be included in only one VLAN.
– Forbidden: Port cannot be included in this VLAN.
– Not Used: The port is not included in this VLAN.
If the device does not support 802.1Q (GVRP), or GVRP on the device is
Disabled, the Forbidden button will be disabled.
For 9300 series switches, if a port has been classified as tagged in another
VLAN, the Untagged option is disabled, and vice versa (once classified as
untagged, it cannot be tagged in another VLAN).
3.
In the next screen you can review the VLAN port configurations.
Figure 11-7. VLAN Configuration Review dialog
a.
To complete the Create VLAN process, click Next. Devices shown in
the list will be rebooted when the VLAN is configured. To halt the
process before it completes, click Halt.
If you are not satisfied with the configuration, click Back to return to
the configuration screen, or Start Over to return to the Set VLAN ID
dialog.
4.
11-8
Once the VLAN configuration is complete, click Close in the final Create
VLAN dialog to exit the Create VLAN wizard. The VLAN list should be
updated with the new VLAN ID.
Using VLANs
Modifying VLANs
Modifying VLANs
To modify a VLAN’s configuration:
1.
Click the VLAN node in the navigation tree to display the list of VLANs.
2.
Select the VLAN ID in the list
3.
Use the right-click menu or toolbar menu and select the
VLAN Manager->Modify VLAN menu.
This launches the Modify VLAN Wizard, which works similarly to the
Create VLAN wizard (see Chapter page 11-6). You can change the IP
Address settings and Port settings for devices in the VLAN.
Configuring Multiple IP Addresses for VLANs
You can configure multiple IP Addresses to support "multi-netting" using the
VLAN wizard.
To use multiple IP addresses in a VLAN:
1.
Use the Create VLAN or Modify VLAN option to launch the VLAN wizard.
2.
Select the Manual option for IP config to enable the Add/Remove Additional
IPs button, then click the button to launch the Multinetting window.
Figure 11-8. Multinetting, for VLAN configuration
3.
Enter the additional IP Address and Subnet Mask that you want to associate
with the VLAN. The IP Address must be on a different network.
4.
Click Add.
The IP address that you just defined is added to the Address List.
11-9
Using VLANs
Modifying VLANs
5.
Repeat the process for any additional IP addresses you want to use.
6.
Click OK to save your changes and return to the VLAN wizard, then
continue through the screens to exit the wizard.
To remove an IP address:
1.
Use the Create VLAN or Modify VLAN option to launch the VLAN wizard.
2.
In the VLAN/Port properties dialog of the wizard, click on Add/Remove
Additional IPs.
3.
In the Address List pane of the Multiple IP Addresses window, select the IP
address you want to remove from the VLAN.
4.
Click Remove.
The IP address is deleted from the Address List.
5.
Click OK to save your changes and return to the VLAN wizard, then
continue through the screens to exit the wizard.
Adding a Device to a VLAN
To add another device to a VLAN that you have already created:
1.
Select the device in the Devices List or in the navigation tree, then use rightclick menu or toolbar menu to select the VLAN Manager->Add to VLAN option.
Figure 11-9. Add Devices to VLAN wizard
11-10
Using VLANs
Modifying VLANs
2.
Click Next to continue.
Figure 11-10. Select VLAN
3.
Click to select the VLAN where you want to add the device.
If the device is not configured for VLAN support, you will get the following
dialog prior to being allowed to add the device to a VLAN.
11-11
Using VLANs
Modifying VLANs
4.
Click Next in the VLAN selection dialogue to continue to the Port configuration dialogue.
Figure 11-11. VLAN Port Configuration dialog
5.
Configure the ports for the VLAN, then proceed through verifying and
applying the configuration as described under “Creating a VLAN” on
page 11-6.
Synchronizing the VLAN Name
If you add a new device with the wrong VLAN Name, or modify the VLAN name
and want to make sure that it appears for all devices (ports) in the VLAN, you
can use the "Synchronize" feature to apply the VLAN name to all devices
configured in the VLAN.
To synchronize the VLAN name on all devices in a VLAN:
1.
11-12
navigate to the VLAN’s Port Properties tab (Network Maps->VLANs->VLAN ID),
and click the Synchronize icon in the toolbar.
Using VLANs
Modifying VLANs
Figure 11-12. Synchronize VLAN Name dialog
2.
Enter the VLAN name to be used, then click OK.
PCM will check the VLAN name to ensure that it is not a duplicate. If it is
already used for another VLAN, you will get an error message. Otherwise, the
VLAN name will be updated on all devices in the VLAN and the new name will
appear in the Port Properties display.
Removing a Device from a VLAN
To remove a device from a VLAN,
■
Select the device in the Devices List or the VLAN map, then right click and
select Remove from VLAN on the menu or,
■
Right-click on the device in the navigation tree or Devices List, then
select the VLAN Manager –> Remove from VLAN option in the menu.
The Select VLAN dialog will be displayed.
Figure 11-13. Select VLAN, to delete from device
1.
Select the VLAN(s) from which the device is to be removed, then click OK.
You will get a confirmation dialog, click Yes to complete the process.
To complete the process and have the changes appear correctly in the VLANs
Map display, you may need to do a Manual Discovery, or Re-discover on the
device.
11-13
Using VLANs
Modifying VLANs
Making VLANs Static
You can configure a dynamic VLAN (using DHCP/Bootp), then decide at a later
time convert it to a static VLAN.
To convert a VLAN from dynamic to static:
•
Expand the navigation tree to select the VLAN,
•
Click the VLAN node to display the map.
•
Right click on a device in the VLAN map,
•
Select the Make VLAN Static option from the VLAN Manager menu.
A dynamic VLAN does not have an IP address, it moves traffic on the basis of
port membership in VLANs. However, after you convert a dynamic VLAN to a
static VLAN, it is then necessary to assign ports to the VLAN in the same way
you would for a manually configured VLAN.
Making a VLAN Primary
Because certain features and management functions run on only one VLAN in
the switch, and because DHCP and Bootp can run per-VLAN, there is a need
for a dedicated VLAN to manage these features and ensure that multiple
instances of DHCP or Bootp on different VLANs do not result in conflicting
configuration values for the switch. The primary VLAN is the VLAN the switch
uses to run and manage these features and data. In the factory-default configuration, the switch uses the default VLAN (VID 1) as the primary VLAN.
However, to provide more control in your network, you can designate another
VLAN as primary.
Designating a non-default VLAN as primary means that:
11-14
■
The stacking feature runs on the switch’s designated primary VLAN
instead of the default VLAN
■
The switch reads DHCP responses on the primary VLAN instead of
on the default VLAN.
■
The default VLAN continues to operate as a standard VLAN (except,
as noted previously, you cannot delete it or change its VID).
■
Any ports not specifically assigned to another VLAN will remain
assigned to the Default VLAN, regardless of whether it is the primary
VLAN.
Using VLANs
Modifying VLANs
Candidates for primary VLAN include any static VLAN currently configured
on the switch. (A dynamic—GVRP-learned—VLAN that has not been converted to a static VLAN cannot be the primary VLAN.)
To designate a VLAN as Primary:
a.
Expand the navigation tree to select the VLAN,
b.
Click the VLAN node to display the map.
c.
Right-click on a device in the VLAN map,
d.
Select the Make VLAN Primary option from the VLAN Manager menu.
Note that the Make VLAN Primary option is disabled if the VLAN is dynamic.
If you configure a non-default VLAN as the primary VLAN, you cannot delete
that VLAN unless you first select a different VLAN to act as primary.
Deleting a VLAN
To delete a VLAN:
1.
Select the VLAN in the navigation tree or VLANs list, then select the
VLAN Manager –>Delete VLAN option from the right-click menu, or toolbar.
Prior to deleting the VLAN, make sure that all ports are assigned to a different
VLAN. If the ports in the VLAN are all "Tagged" this should not be a problem as
they should still be included in the Default VLAN (VID 1). If the Ports are
"Untagged" the VLAN manager will re-assign the ports to the Default VLAN.
You cannot delete the Primary VLAN, and you cannot delete the Default VLAN
(VID 1).
11-15
Using VLANs
Modifying VLAN Support on a Device
Modifying VLAN Support on a Device
To modify the VLAN support on a device:
1.
Click the device node in the Navigation tree (or in the Devices List) to display
the Properties tab,
2.
Use the right-click menu or toolbar to select the
VLAN Manager –> Modify VLAN Support option.
This launches the VLAN Properties Info dialogue.
Figure 11-14. VLAN Properties (Support for VLAN on device)
3.
If the device is GVRP capable, you can select to Enable or Disable support
for GVRP.
For devices that are not GVRP capable (such as 1600 and 4000m series)
you can Enable or Disable VLAN Support.
NOTE
11-16
4.
The VLAN Value indicates the Maximum number of VLANs to which ports
on the switch can be assigned. The Current field indicates the number of
VLANs currently configured per port. You can increase or decrease the
current number of allowed VLANs.
5.
Click OK to apply the changes and close the dialogue
Enabling VLAN support can cause the selected device to reboot.
Using VLANs
Modifying VLAN Support on a Device
VLAN Support on Wireless Devices
Options specific to configuring VLAN support on ProCurve Wireless devices
are described below.
VLAN Support on 420wl Devices:
Figure 11-15. VLAN Properties for 420wl
Note:
1.
Click the Enable button to enable VLAN support.
2.
In the Native VLAN ID field, type the VLAN ID of the native VLAN for the
device.
3.
Press OK to apply these changes to the device.
Click Cancel to close the window without saving your changes.
For 420wl devices, the Telnet password must be set, or the modify VLAN
feature will not work.
11-17
Using VLANs
Modifying VLAN Support on a Device
VLAN Support on 520wl Devices:
Figure 11-16. VLAN Properties for 520wl
NOTE:
1.
To enable VLAN support, click the Enable button.
2.
In the VLAN Management ID field, type the ID of the VLAN you want to set
as the management VLAN. The management VLAN is used by PCM to
manage the network.
3.
In the VLAN ID Wireless Slot A and Slot B fields, type the VLAN ID of the
VLAN you want to associate with each slot on the device.
4.
Press OK to apply these changes to the device.
Click Cancel to close the window without saving your changes.
Enabling VLAN support can cause the selected device to reboot.
VLAN Support for 520wl With Version 2.4.5 or Newer Software
If you have installed version 2.4.5 of the 520wl switch software, the VLAN
properties dialog will appear as follows:
11-18
Using VLANs
Modifying VLAN Support on a Device
Figure 11-17. VLAN Properties for 520wl, running version 2.4.5 software
1.
In the VLAN Management ID field, type the ID of the VLAN you want to set
as the management VLAN. You can enter a number from -1 to 4094, or type
in "Untagged" ( -1 is equivalent to Untagged).
2.
You can edit the SSID (network) name. Just click in the SSID field of the
table for the interface you want to edit.
3.
To edit the VLAN ID, click in the VLAN Id field to select it then enter the
number you want to assign.
4.
Click in the Status field, then select the Status from the pull-down menu.
The options are Active, Delete or Not in Service.
If you select the Delete option, the VLAN will be removed.
5.
Click the Add VLAN button to add a SSID/VLAN pair to an interface.
11-19
Using VLANs
Modifying VLAN Support on a Device
Figure 11-18. Add VLAN for 520wl
a.
Enter the VLAN ID, either Untagged, or a number from 1-4094.
b.
Enter the SSID (network name) for the VLAN.
c.
Select the Status from the pull-down menu. "Active" or "Not In Service."
d.
Click OK to save the new VLAN configuration and close the dialog.
If the interface (network card) does not support multiple SSIDs, only the SSID
and VLAN Id fields are editable, the Status will always be Active, and the Add
VLAN button will be disabled.
11-20
Using VLANs
Modifying VLAN Support on a Device
Port Assignments on a Device
To review the current port assignments for the Device, click the Port Assignments Table tab in the Device Properties window.
Figure 11-19. Device Properties: Port Assignments table
The table lists each of the VLANs to which a port is assigned and current
configuration of the port VLAN support (tagged, untagged, etc.)
11-21
Using VLANs
Modifying VLAN Support on a Device
Modifying Port Assignments
Click the Modify Port Assignments icon in the toolbar to change the VLAN port
assignments. This will launch the Modify Port Assignments window.
Figure 11-20. Modify Port Assignments window
To modify port assignments:
1.
Click on the VLAN properties cell in the table. This will enable a pull-down
menu you can use to select the Property you want to have for the port in
that VLAN. The VLAN port options are:
•
Tagged: Port can be included in multiple VLANs.
•
Untagged: Port can be included in only one VLAN.
•
Forbidden: Port cannot be included in this VLAN.
•
No: The port is not included in this VLAN.
Change the port properties as needed, then click Apply to save the changes
and close the Modify Port Assignment Table.
11-22
Using VLANs
Modifying VLAN Support on a Device
Modifying GVRP Port Properties
To modify VLAN support by individual port on a device that supports GVRP:
1.
Click the Modify GVRP Port Properties button in the Port Assignment Table
toolbar.
Figure 11-21. Device Properties: Port Properties dialog.
2.
Select the GVRP status for the port: Blocked, Learn, or Disabled.
3.
Select the Acceptable Frame Type: All or Tagged.
4.
Click Apply to update the Port Properties display, then click OK to close
the dialog.
11-23
Using VLANs
Using IGMP to Manage Multicast Traffic
Using IGMP to Manage Multicast Traffic
This section describes how to configure IGMP controls using PCM+, to reduce
unnecessary bandwidth usage on a per-port basis in your VLANs.
In a network where IP multicast traffic is transmitted for various multimedia
applications, you can reduce unnecessary bandwidth usage on a per-port basis
by configuring IGMP (Internet Group Management Protocol controls). In the
factory default state (IGMP disabled), the switch simply floods all IP multicast
traffic it receives on a given VLAN through all ports on that VLAN (except the
port on which it received the traffic). This can result in significant and
unnecessary bandwidth usage in networks where IP multicast traffic is a
factor.
Enabling IGMP (on switches that support it) allows the ports to detect IGMP
queries and report packets, and manage IP multicast traffic through the
switch. Using IGMP, switches can be configured to direct the multicast traffic
to only the ports where needed. If multiple VLANs are configured, you can
configure IGMP on a per-VLAN basis.
For a more detailed description of using IGMP on ProCurve devices, refer to
the "Management and Configuration Guide" for your switch.
Enabling IGMP on VLANs
IGMP configuration on the switch operates at the VLAN context level. If you
are not using VLANs, then configure IGMP in VLAN 1 (the default VLAN)
context.
To enable IGMP settings on a VLAN, select the VLAN node in the navigation
tree and display the Port Properties tab.
11-24
1.
Select the IGMP option from the toolbar to launch the IGMP Settings
Wizard. (You can also select the IGMP Settings option from the right-click
menu.)
2.
Click Next in the "Welcome" dialog to continue.
Using VLANs
Using IGMP to Manage Multicast Traffic
Figure 11-22. IGMP Device Selection dialog.
3.
Click to select the device(s) on which you want to change the IGMP
settings, then click Next.
Figure 11-23. IGMP Properties dialog
11-25
Using VLANs
Using IGMP to Manage Multicast Traffic
4.
Use IGMP Settings dialog to enable or disable multicast operations. The
wizard lists the following information about ports on the selected device:
•
Port Name: The name used to identify the port
•
Port ID: The port number
•
IP Multicast: Auto/Blocked/Forward: Indicates the individual ports are
configured to one of the following states:
Auto (the default): Causes the switch to interpret IGMP packets and
to filter IP multicast traffic based on the IGMP packet information for
ports belonging to a multicast group. This means that IGMP traffic
will be forwarded on a specific port only if an IGMP host or multicast
router is connected to the port.
Blocked: Causes the switch to drop all IGMP transmissions received
from a specific port and to block all outgoing IP Multicast packets for
that port. This has the effect of preventing IGMP traffic from moving
through specific ports.
Forward: Causes the switch to forward all IGMP and IP multicast
transmissions through the port.
•
5.
Forced Fast Leave: indicates whether "Forced Fast Leave" is enabled or
disabled. Where a port is connected to multiple end nodes, this feature
improves blocking of unnecessary IGMP traffic to the port.
(Refer to the discussion of "Automatic Fast-Leave IGMP" in the "Management and Configuration Guide" for your switch for details on using
this option).
To configure IGMP settings for the device:
a.
To enable IGMP on the device, click the IGMP State checkbox.
b.
To disable the IGMP Querier on the selected device, click the IGMP
Querier Mode checkbox. (The default is "enabled")
The IGMP Querier eliminates the need for a multicast router. HP
recommends that you leave the IGMP Querier enabled even if a
multicast router is performing the querier function in your multicast
group.
NOTE: IGMP Querier can only be enabled if an IP address is configured for the VLAN.
c.
11-26
To give IGMP traffic a higher priority than other traffic, check the
IGMP Forward with High Priority checkbox. When this feature is disabled, the switch or VLAN processes IP multicast traffic and all other
traffic in the order received.
Using VLANs
Using IGMP to Manage Multicast Traffic
NOTE: The Forward with high priority setting is not available when
configuring IGMP settings for 9315, 9308, 9304, 6208, and 6308
switches.
d.
Click Next.
e.
Click in the IP Multicast column to change the setting on an individual
port. When you click in the field a drop-down menu is enabled from
which you can select Auto, Forward, or Blocked
f.
Click in the Forced Fast Leave column to select Enabled or Disabled for
individual ports.
Repeat the IGMP configuration described above for each of the VLAN
devices you selected.
After the final device is configured, the IGMP Settings Summary dialog is
displayed.
Figure 11-24. IGMP Settings Summary dialog
6.
Review the IGMP configurations.
To change the settings, click Back or Start Over, and modify the settings as
needed.
7.
If the settings are correct, click Next to download the new settings.
Click Halt to stop the download if needed.
8.
Check the results to ensure that the settings were downloaded successfully, then click Close to exit the IGMP Wizard.
11-27
Using VLANs
Using IGMP to Manage Multicast Traffic
IGMP Settings for Routing Switches
For the ProCurve Routing Switches, series 93xx, 62xx, and 63xx, the IGMP
settings are configured somewhat differently than for other supportedSwitches.
To configure IGMP on routing switches:
1.
Select the switch in the Devices list or navigation tree
2.
Use the right-click menu or toolbar menu to select VLAN Manager->IGMP
Settings.
This launches the IGMP Configuration window.
Figure 11-25. IGMP Setting for Routing Switches
3.
Click the Enable radio button.
4.
Set the IGMP Querier Interval (the frequency the device will query for group
membership). The value can be from 1 to 3600 seconds.
5.
Set the IGMP Group Membership Time (the value after which the group
membership becomes inactive). The value can range from 1 to 7200
seconds.
6.
Click OK to save the settings and close the window.
To Modify IGMP Settings:
To modify the IGMP Settings on a VLAN, use the IGMP Settings wizard as
described for “Enabling IGMP on VLANs” beginning on page 11-24.
You can also modify IGMP setting for an individual device in a VLAN.
11-28
1.
Select the device node in the navigation tree to display the device “Properties” tab.
2.
Click the IGMP icon in the toolbar to launch the IGMP Settings Wizard.
3.
Edit the IGMP settings as described for enabling IGMP, starting on page
11-24.
Using Virus Throttle
12
Using Virus Throttle
Chapter Contents
Introduction . . . . . . . . . . . . . . . . . . . . . . . . . . . . . . . . . 12-2
General Operation of Virus Throttle . . . . . . . . . . . . . 12-3
Filtering Options . . . . . . . . . . . . . . . . . . . . . . . . . 12-3
Sensitivity to Connection Rate Detection . . . . . . 12-3
Operating Notes . . . . . . . . . . . . . . . . . . . . . . . . . . . . . . 12-4
Terminology . . . . . . . . . . . . . . . . . . . . . . . . . . . . . . . . . 12-5
General Configuration Guidelines . . . . . . . . . . . . . . . 12-6
For a network operating normally:. . . . . . . . . . . . 12-6
When the network appears to be under attack:. . 12-7
VT Configuration in PCM . . . . . . . . . . . . . . . . . . . . . . 12-8
VT Configuration for Blocked Hosts . . . . . . . . . . . . . . 12-11
12-1
Using Virus Throttle
Introduction
Introduction
The PCM+ Virus Throttle feature can improve network security on the edge
of a network. It works to reduce attacks from malicious code that tries to
replicate itself using weaknesses in network applications behind unsecured
ports.
Virus Throttle (also called Virus filtering or connection-rate filtering) exploits
the network behavior of malicious code that tries to create a large number of
outbound IP connections on a routed interface in a short time. When a host
exhibits this behavior, warnings are sent, and connection requests can be
blocked or dropped to minimize the barrage of subsequent traffic from the
host. When enabled on a 5300xl switch with software version E.09.02 or
greater, virus throttling reduces the impact of malicious code attacks and
gives system administrators more time to isolate and eradicate the threat.
You still need to deploy traditional worm- and virus-signature updates to
hosts, but the network remains functional and distribution of the malicious
code is limited.
Major benefits of Virus Throttle include:
Note
•
Behavior-based operation that does not require identifying details
unique to the malicious code operation.
•
Handles unknown worms.
•
Needs no signature updates.
•
Protects network infrastructure by slowing or stopping routed traffic
from hosts exhibiting high connection-rate behavior.
•
Allows network and individual switches to continue to operate, even
when under attack.
•
Provides Event Log and SNMP trap warnings when malicious code
behavior is detected
When configured on a port, virus throttling is triggered by routed IPv4 traffic
received inbound with a relatively high rate of IP connection attempts. Virus
throttling is not triggered by such traffic when both the SA (source address)
and DA (destination address) are in the same VLAN—that is, switched traffic.
virus throttling applies only to routed traffic. Switched traffic from a blocked
or throttled host is not blocked or throttled.
For 5400zl, 3500yl, and 6200yl running switch software version K.12.02 or
later, PCM+ supports VT for switched traffic on the same VLAN (routing off).
12-2
Using Virus Throttle
General Operation of Virus Throttle
General Operation of Virus Throttle
The PCM+ Virus Throttle feature enables notification of malicious code
behavior detected in inbound routed traffic and, depending on how you
configure the feature, also throttles or blocks such traffic. This feature also
provides a method for allowing legitimate, high connection-rate traffic from
a given host while still protecting your network from suspected malicious
traffic.
Filtering Options
In the default configuration, Virus Throttle is disabled. When enabled on a
port, Virus Throttle monitors inbound routed traffic for a high rate of connection requests from any given host on the port. If a host is attempting to
establish a large number of outbound IP connections (or DAs) in a short period
of time, the switch responds in one of the following ways, depending on how
Virus Throttle is configured:
■
Notify-only: The switch generates an Event Log notice identifying
the offending host SA and (if a trap receiver is configured on the
switch) a similar SNMP trap notice).
■
Throttle: In this case, the switch temporarily blocks inbound routed
traffic from the offending host SA for a “penalty” period and generates
an Event Log notice of this action and (if a trap receiver is configured
on the switch) a similar SNMP trap notice. When the “penalty” period
expires the switch re-evaluates the routed traffic from the host and
continues to block this traffic if the apparent attack continues.
(During the re-evaluation period, routed traffic from the host is
allowed.)
■
Block: This option blocks routing of the host’s traffic on the switch.
When a block occurs, the switch generates an Event Log notice and
(if a trap receiver is configured on the switch) a similar SNMP trap
notice. Note that you must explicitly re-enable a host that has been
previously blocked.
Sensitivity to Connection Rate Detection
The switch includes a global sensitivity setting that enables adjusting the
ability of Virus Throttling to detect relatively high instances of connectionrate attempts from a given source.
12-3
Using Virus Throttle
Operating Notes
low: Sets the virus throttle sensitivity to the lowest possible sensitivity, which
allows a mean of 54 routed destinations in less than 0.1 seconds, and a
corresponding penalty time for Throttle mode (if configured) of less than 30
seconds.
medium: Sets the virus throttle sensitivity to allow a mean of 37 routed
destinations in less than 1 second, and a corresponding penalty time for
Throttle mode (if configured) between 30 and 60 seconds.
high: Sets the virus throttle sensitivity to allow a mean of 22 routed destinations in less than 1 second, and a corresponding penalty time for Throttle mode
(if configured) between 60 and 90 seconds.
aggressive: Sets the virus throttle sensitivity to the highest possible level,
which allows a mean of 15 routed destinations in less than 1 second, and a
corresponding penalty time for Throttle mode (if configured) between 90 and
120 seconds.
Operating Notes
■
When changing the configuration of virus filters in the switch, execute
the clear arp command to reset the routing table.
■
Virus Throttling is triggered by inbound IP routed traffic exhibiting
high rates of IP connections to new hosts. Inbound switched traffic
with high IP connection rates does not trigger Virus Throttling.
However, after Virus Throttling has been triggered on a port, all traffic
(switched or routed) from the suspect host is subject to the configured virus policy (notify-only, throttle, or block).
■
Where the switch is throttling or blocking inbound routed traffic from
a host, any outbound routed or switched traffic for that host is still
permitted.
■
A host blocked by Virus Throttling remains blocked until explicitly
unblocked by one of the following:
•
Using the unblock option in the VT configuration dialog.
•
Rebooting the switch
•
Deleting a VLAN removes blocks on any hosts on that VLAN.
Note that changing a port setting from Block to either Throttle or NotifyOnly, does not unblock a blocked host on any port previously set to Block.
12-4
Using Virus Throttle
Terminology
Terminology
DA: The acronym for Destination Address. In an IP packet, this is the
destination IP address carried in the header, and identifies the destination
intended by the packet’s originator.
Routed Traffic: Traffic moving from an SA in one VLAN to a DA in a different
VLAN.
SA: The acronym for Source Address. In an IP packet, this is the source IP
address carried in the header, and identifies the packet’s originator.
Switched Traffic: Traffic moving from an SA in a given VLAN to a DA in the
same VLAN. (Sometimes referred to as “bridged traffic”.)
Throttle: Means to temporarily block traffic from a host exhibiting a relatively high incidence of attempts to connect with other devices. Traffic is
blocked from the host for a calculated period of time, and then allowed to
resume. If the undesired behavior persists, the cycle is repeated.
12-5
Using Virus Throttle
General Configuration Guidelines
General Configuration Guidelines
As stated earlier, Virus Throttle is triggered only by routed, inbound traffic
generating a relatively high number of new IP connection requests from the
same host. Thus, for the switch to apply virus throttle, IP routing and multiple
VLANs with member ports must first be configured.
For a network operating normally:
Note
1.
Enable notify-only mode on the ports you want to monitor.
2.
Set global sensitivity to low.
3.
Use clear arp to clear the arp cache.
4.
If SNMP trap receivers are available in your network, use the Alerts dialog
to configure the switch to send SNMP traps.
5.
Monitor the SNMP Traps (Events) to identify hosts exhibiting high connection rates, or configure e-mail alerts that will notify you of same.
6.
Check any hosts that exhibit relatively high connection rate behavior to
determine whether malicious code or legitimate use is the cause of the
behavior.
7.
Increase the sensitivity to Medium and repeat steps 6 and 7.
On networks that are relatively infection-free, sensitivity levels above Medium
are not recommended.)
8.
12-6
Continue to monitor the Event Log or configured trap receivers for any
sign of high connectivity-rate activity that could indicate an attack by
malicious code, and if needed, apply throttle or blocking options to the
affected ports.(Refer to “Virus Throttle Log and Trap Messages” on
page 12-12.
Using Virus Throttle
General Configuration Guidelines
When the network appears to be under attack:
The major difference is in policies suggested for managing hosts exhibiting
high connection rates. This allows better network performance for unaffected
hosts and helps to identify hosts that may require updates or patches to
eliminate malicious code.
1.
Configure Virus Throttle to throttle on all ports.
2.
Set global sensitivity to medium.
3.
Use clear arp to clear the arp cache.
4.
If SNMP trap receivers are available in your network, use the snmp-server
command to configure the switch to send SNMP traps.
5.
Monitor the Event Log or the available SNMP trap receivers (if configured
on the switch) to identify hosts exhibiting high connection rates.
6.
Check any hosts that exhibit relatively high connection rate behavior to
determine whether malicious code or legitimate use is the cause of the
behavior.
7.
To immediately halt an attack from a specific host, group of hosts, or a
subnet, use the per-port block mode on the appropriate port(s).
12-7
Using Virus Throttle
VT Configuration in PCM
VT Configuration in PCM
Note:
Connection Rate Filtering is also referred to as Virus Throttling, or VT for
short. The VT acronym is used in the PCM GUI, as reflected in this text.
To view the existing Virus Throttle configuration for a switch:
1.
Select the switch in the Navigation tree, or in the Devices List.
2.
Click the VT Configuration icon in the toolbar.
If you selected in the Devices List, you can also use the VT Configuration
option from the right-click menu.
3.
The VT Configuration dialog displays.
Review and change the VT Configuration as needed by selecting the
desired option from the drop-down menus.
Figure 12-1. Virus Throttle Configuration display
12-8
Using Virus Throttle
VT Configuration in PCM
VT Status: When virus throttle is used on the switch, the VT Status field shows
the enable VT option. Use the drop-down menu to select the enable or disable
option.
VT Sensitivity: The default setting for virus throttle sensitivity is low. The
entry shown in the field indicates the current sensitivity setting in use. Use the
drop-down menu to select the sensitivity option to use:
•
low: Sets the virus throttle sensitivity to the lowest possible sensitivity, which allows a mean of 54 routed destinations in less than 0.1
seconds, and a corresponding penalty time for Throttle mode (if
configured) of less than 30 seconds.
•
medium: Sets the virus throttle sensitivity to allow a mean of 37 routed
destinations in less than 1 second, and a corresponding penalty time
for Throttle mode (if configured) between 30 and 60 seconds.
•
high: Sets the virus throttle sensitivity to allow a mean of 22 routed
destinations in less than 1 second, and a corresponding penalty time
for Throttle mode (if configured) between 60 and 90 seconds.
•
aggressive: Sets the virus throttle sensitivity to the highest possible
level, which allows a mean of 15 routed destinations in less than 1
second, and a corresponding penalty time for Throttle mode (if
configured) between 90 and 120 seconds.
VT Port Configuration: Click the device node to expand the display and
show VT configuration information for all ports on the switch. The VT Action
field indicates the current configuration applied on the switch and ports. Use
the drop-down menu to change the VT configuration option:
•
Notify-only: An Event Log notice identifying the offending host SA is
generated, and if a trap receiver is configured on the switch a similar
SNMP trap notice is sent.
•
Throttle: In this case, the inbound routed traffic from the offending
host SA is blocked for a “penalty” period and generates an Event Log
notice of this action and (if a trap receiver is configured on the switch)
a similar SNMP trap notice. When the “penalty” period expires the
routed traffic from the host is re-evaluated, and if the apparent attack
continues, the traffic block is continued. (During the re-evaluation
period, routed traffic from the host is allowed.)
•
Block: This option blocks routing of the host’s traffic on the switch or
port. When a block occurs, an Event Log notice is generated, and (if
a trap receiver is configured on the switch) a similar SNMP trap
notice.
Note that you must explicitly re-enable a host that has been previously
blocked. (See “VT Configuration for Blocked Hosts” on page 12-11)
12-9
Using Virus Throttle
VT Configuration in PCM
4.
•
No: This option lets you remove the virus throttle configuration on
the switch and/or port.
•
Unknown: This state is shown only if the VT secondary discovery fails
on the device, indicating the state of VT port configuration is not
known.
Click Apply to save the configuration information.
Click Close to exit the dialog without saving or applying the configuration
changes.
5.
When you click Apply at the bottom of the window the VT Configuration
Status dialog will display, indicating the device and configuration change
status.
Figure 12-2. VT Configuration, status display
If the configuration change process appears to hang, click the Halt button
to stop the process, then click Summary button to display the Status
Summary dialog and check for error messages or reason for failure of the
configuration change.
6.
12-10
Click Close to exit the dialog.
Using Virus Throttle
VT Configuration in PCM
VT Configuration for Blocked Hosts
The Blocked Hosts tab in the VT Configuration dialog lists the devices (SAs)
that are blocked as a result of virus throttling configured on the switch.
To review blocked hosts and, or restore (unblock) a blocked host:
1.
Select the switch in the Navigation tree, or in the Devices List.
2.
Click the VT Configuration icon in the toolbar.
If you selected in the Devices List, you can also use the VT Configuration
option from the right-click menu.
3.
Click the Blocked Hosts tab in the VT Configuration dialog.
Figure 12-3. VT Configuration, blocked hosts
The Blocked Hosts tab displays the list of devices/sources blocked due to
enabling of VT on a device or a Port, including:
4.
•
Device: The device IP on which the source is blocked
•
Source IP: The blocked source IP.
•
VLAN ID: The VLAN ID on which the Source IP is blocked
•
Unblock: Select the check-box to unblock the selected Source IP.
When you complete a VT configuration change to unblock hosts, click
Apply at the bottom of the window.
The VT Configuration Status dialog will display, indicating the device and
configuration change status.
If the Unblock Host process appears to hang, click the Halt button to stop
the process, then click Summary button to display the Status Summary
dialog and check for error messages or reason for failure of the configuration change.
12-11
Using Virus Throttle
Virus Throttle Log and Trap Messages
5.
Click Close to exit the dialog.
Virus Throttle Log and Trap Messages
These messages will appear in the switch’s Event Log. If SNMP trap receivers
are configured on the switch, it also sends the messages to the designated
receiver(s).
Message
Meaning
W < mm/dd/yy hh:mm:ss > virusfilt: Source IP
address < xxx.xxx.xxx.xxx > is exhibiting
virus-like behavior
A warning that results when a port configured for notifyonly detects a relatively high number of connection-rate
attempts from a host.
W < mm/dd/yy hh:mm:ss > virusfilt: Source IP A warning and indication of the switch’s response when a
address < xxx.xxx.xxx.xxx > has been throttled port configured for throttle detects a relatively high
number of connection-rate attempts from a host.
W < mm/dd/yy hh:mm:ss > virusfilt: Src IP
< xxx.xxx.xxx.xxx > blocked
12-12
A warning and indication of the switch’s response when a
port configured for block detects a relatively high number
of connection-rate attempts from a host.
13
Using Policy Manager Features
Contents
How the Policy Manager Works. . . . . . . . . . . . 13-2
Policy Configuration Overview . . . . . . . . 13-4
Configuring Policies . . . . . . . . . . . . . . . . . . . . . 13-5
Editing Policies . . . . . . . . . . . . . . . . . . . . 13-14
Deleting Policies. . . . . . . . . . . . . . . . . . . . 13-14
Enabling/Disabling Policies. . . . . . . . . . . 13-15
Manually Enforcing Policies . . . . . . . . . . 13-15
Policy History . . . . . . . . . . . . . . . . . . . . . . . . . 13-16
Creating Times for Policies . . . . . . . . . . . . . . 13-18
Custom Groups for Policies . . . . . . . . . . . . . . 13-21
Defining Alerts for Policies . . . . . . . . . . . . . . 13-21
Creating Event-based Alerts . . . . . . . . . . 13-21
Creating Schedule Driven Alerts . . . . . . 13-26
Configuring Policy Actions. . . . . . . . . . . . . . . 13-30
Action Type Definitions . . . . . . . . . . . . . . . . . 13-40
Setting Policy Management Preferences . . . 13-47
13-1
Using Policy Manager Features
How the Policy Manager Works
How the Policy Manager Works
As the term suggests, policy refers to settings or actions you can apply across
a range of devices or ports on the network. The PCM+ Policy Manager
component can be used to define and enforce Community Names, Trap
Receivers, Authorized Managers, and Spanning Tree settings consistently on
any Group of devices that you define. You can also use policies to test
communication parameters, manage VLANs and VLAN port settings, or automatically apply a configuration template on new discovered network devices.
The Policy Manager provide a unified toolset you can use to:
■
Configure an alert (trigger) to notify the Administrator about specific
network issues (e.g., CRF events)
■
Configure an event driven action--an action taken in response to the
alert notification (event occurrence). For example, set MAC Lockout
on a port in response to a CRF alert.
■
Schedule some action to occur at set intervals in the future. For
example, schedule configuration scans to occur on a weekly basis.
■
Define an action that can be re-used on demand. Such as: set rate limit
to DEFCON1, NORMAL.
What’s New for PCM+ 2.2
The implementation of automated policies in PCM 2.2 means that you no
longer use separate wizards to configure alerts, custom groups, and policies.
You can access all the functions needed to configure an automated policy from
within the Policy Configuration Manager windows.
In PCM 2.2, you will launch the Policy Manager Configuration dialog. Within
this dialog there is a tree of Policies, Alerts and Actions. You can either create
the alerts and actions first, then create a policy to utilize them; or start by
creating the policy and then create the desired alerts and actions in the course
of creating the policy.
Each “node” of the Policies tree (i.e., policies, alerts or actions) can be selected
to display a table on the right showing any existing items of that type. Above
that table is a “new” button you can use to create a new item of that type. You
will also see that the list of available actions looks very similar to what you
13-2
Using Policy Manager Features
How the Policy Manager Works
could create in the previous policy manager (v2.1). While the wizards are gone,
most of the individual screens previously shown in the wizards are now
available as tabs within the Policy and Action configuration.
Figure 13-1. Policy Manager configuration tabs display
One key difference in the new Policy automation system is that alerts will not
be generated until you configure an alert and attach it to a policy. The reason
for this is that the policy is where you define what locations on the network
you want to monitor, what times you want the alert to be in effect, and what
actions you want taken when an alert is generated. The same alert can now
be attached to numerous policies, alleviating the need to duplicate the same
criteria for every policy you want enforced when that event is received.
Also new is support for nested groups within the Custom Groups functionality.
Now you can create sub-groups to specify devices, or ports on a device by the
location they pertain to. For example, you can create a Group folder for the
Roseville site, with devices or ports for Sub-Group “Bldg. R10”, and “Bldg. R6”
and then enforce policies for each defined sub-group that match the needs for
your office locations.
If you have been working with IDM, you will recognize the “Times” configuration used in the PCM+ 2.2 version of automated policies. This allows you to
configure standard times, such as weekdays, weekends, evenings, etc. that a
policy will be enforced.
13-3
Using Policy Manager Features
Policy Configuration Overview
Policy Configuration Overview
Policies are configured with a combined set of parameters that you define:
■
Times - Time periods when the policy can be executed. If no time is
specified, the policy can execute at any time.
■
Sources - Devices or ports from which events are received. If no
source (Device or Custom group) is selected, the policy will match
events from any source.
■
Targets - Devices or ports on which a defined action will be performed
in response to an alert, if applicable. If no Target is selected, the Alert
will log a Policy Manager event in the event browser.
■
Alerts - A defined trigger used to launch a Policy. Alerts can be eventdriven, or scheduled to occur at a specified time.
■
Action - The action taken on Targets in response to the Alert. If no
action is specified, the alert will generate a Policy Manager event in
the Event browser.
Multiple parameters of each type can be applied to a Policy. When the Policy
is activated, it reads through each set of parameters until a match is found.
For the policy to execute, it must find a match for each defined parameter. If
there is no match the policy does not execute. For example, if you configure
a policy with Times limited to “weekdays”, defined as 9:00 am to 5:00 pm and
an alert trigger is received at 10:00 pm, the policy will not execute.
You can separately define specific Times, Alerts, Actions, and use Custom
Groups to define event sources or targets for the policy action. The "new
definitions" will be available in the selection lists in the Policy Configuration
Manager when you create your Policy. Or you can create Times, Alerts,
Actions, and Custom Groups as needed within the Policy Configuration
Manager tabs.
13-4
Using Policy Manager Features
Configuring Policies
Configuring Policies
To configure a PCM+ Policy:
1.
Click the Policy Manager icon in the toolbar to launch the Policy Configuration
Manager window.
Figure 13-2. Policy Manager: Manage Policies panel
2.
Select the Policies node in the navigation tree to display the Manage Policies
panel, then click New... to launch the Create Policy dialog.
Figure 13-3. Policy Configuration: Properties
13-5
Using Policy Manager Features
Configuring Policies
3.
Fill in the Policy information:
a.
In the Name field, type a name to identify the policy.
This name will appear as a node in the Policies navigation tree, and
in the list in the Manage Policies panel.
b.
In the Description field, type in a brief description to help you identify
the policy and what it will do.
c.
Click the Enable Policy checkbox to enable the policy.
A check in the box indicates the policy will take effect immediately
when its configuration is completed.
If the check box is empty, the Policy is disabled. It will not take effect
until you Enable it.
d.
Click OK to save the Policy Properties and display the Policy Configuration panel for your new policy.
Figure 13-4. Policy Configuration: Properties tab
4.
Click the Times tab to configure the time periods that will be applied for
your policy.
Applying “Times” to a policy restricts the application of the policy to the
defined time. If no times are selected, the policy will always be active and
can be executed at any time.
13-6
Using Policy Manager Features
Configuring Policies
Figure 13-5. Policy Configuration: Times tab
5.
To apply a time, select it in the Available Times list on the left, then click >>
to move it to the list of Selected Times.
You can apply more than one Time. When the policy is activated, it will
read each time entry until a match is found.
Click New... to launch the Configure Times dialog.
See “Creating Times for Policies” on page 13-18 for details.
6.
Click the Sources Tab to configure the device groups from which an event
trigger will be applied.
13-7
Using Policy Manager Features
Configuring Policies
Figure 13-6. Policy Configurations: Sources tab
7.
To apply a Group, select it in the Available Groups list on the left, then click
>> to move it to the list of Selected Groups on the right.
If no group is selected, the Policy will accept events from any source.
If you select Interconnect Devices, the Policy will accept events from any
of the pre-defined ProCurve Device groups.
If you select more than one group, the policy will only execute if an event
is received from a device in the Selected Groups list.
If you configured Custom Groups they will appear in the Available Groups
list. You can use a Custom Group to define a group of ports on various
devices, rather than all ports on a single device type. “Working with
Custom Groups” on page 10-1 for details.
8.
13-8
Click the Targets Tab to configure the device groups to which the policy
action will be applied.
Using Policy Manager Features
Configuring Policies
Figure 13-7. Policy Manager: Targets tab
9.
To apply a Group, select it in the Available Groups list on the left, then click
>> to move it to the list of Selected Groups on the right. The policy will be
applied to all discovered devices of that type, unless you select one of the
Target qualifiers in the bottom portion of the window.
If no group is selected, the Policy action will not be applied to any device,
and the No targets for this policy option is selected.
If you select the Interconnect Devices group, the Policy will accept events
from any of the pre-defined ProCurve Device groups.
If you configured Custom Groups they will appear in the Available Groups
list for application as monitored source. You can use a Custom Group to
define a group of ports on various devices, rather than all ports on a single
device type. See “Working with Custom Groups” on page 10-1 for details.
Click New... to launch the Create Group dialog to define a Custom Group
and add it to the list of available groups.
13-9
Using Policy Manager Features
Configuring Policies
10. Apply any target qualifiers by clicking the radio button or checkbox to
select it.
•
Target all devices in the selected groups above will apply the policy to all
devices included in the Selected Groups on the Targets tab. Selecting
this option enables the checkbox so you can:
Target any new devices added to the selected groups above. Use this option
to apply the policy to newly discovered devices. This is useful for
applying standardized configurations.
•
Target all devices and ports selected on the "Sources" tab will apply the
policy to all discovered devices included in the Selected Groups on
the Sources tab. Selecting this option enables the checkbox so you
can:
Target any new devices added to monitored groups will apply the policy
to any newly discovered devices in the Selected Groups on the
Sources tab.
•
Target all alert sources (devices & ports) that trigger this policy will apply
the policy action to any device(s) or port(s) identified by the trigger
alert. For example, if a virus throttling event triggers the policy and
the alert was configured to use the trap contents as the alert source
then the policy will target the edge port to which the host identified
by VT is connected.
11. Click the Alerts tab to configure the alerts that will trigger the policy
execution.
13-10
Using Policy Manager Features
Configuring Policies
Figure 13-8. Policy Configuration: Alerts tab
12. The Alerts tab lists the pre-configured alerts in the Available Alerts list.
To apply an Alert, select it in the Available Alerts list on the left, then click
>> to move it to the list of Selected Alerts on the right.
You can select multiple alerts, and when an event is received each of the
alerts will be evaluated until a match is found. The policy will execute on
the first matching Alert.
If you configured any custom Alerts they will appear in the Available Alerts
list.
Click New... to launch the Create Alert dialog to define an Alert and add it
to the list of available Alerts. See “Defining Alerts for Policies” on page 1321 for details.
13. Click the Actions tab to configure the actions the policy will take when it
is executed.
If you do not specify an Action for the policy, when the policy executes it
will log a Policy Manager event in the Event browser.
13-11
Using Policy Manager Features
Configuring Policies
Figure 13-9. Policy Configuration: Actions tab display
14. Select the Execution Policy options you want to apply by clicking the radio
buttons or check box.
•
Execute All - this is the default setting. Indicates all selected actions
•
Execute Until Success - this will attempt to execute each selected action
will be attempted when the Policy runs.
on each target device or port in the order listed. As soon as an action
completes successfully, the policy moves to the next target device/
port and attempts to execute the selected actions.
This can be used to create a single policy to that is applied across
multiple device types on the network. For example:
i.
13-12
Create one action for Security:VT Configuration that uses the port
supplied in the event source. Then create an action to Disable the
port (Port Settings:Enable/Disable Port action option).
Using Policy Manager Features
Configuring Policies
ii.
Create a Policy that targets all source devices/ports when an alert
is generated.
iii. In the Actions tab, select the Security:VT Configuration action and
the Port Settings:Enable/Disable Port action, in that order.
When the Policy executes, it will first attempt to use the Virus Throttle
(VT) action on the target device or port. If the target device does not
support the Virus Throttle feature, the Policy will attempt the Disable
Port action.
•
Rollback Actions - for Action types that support a rollback operation, it
will stop the action, returning the target of the action to its original
state after the time specified (in the next line). This option is not
enabled until an action that supports rollback is selected. The rollback feature is supported by the following actions:
– Port Mirroring
– MAC Lockout
– Port Status (enable/disable)
– Rate Limit
– Traffic Sampling
15. The Actions tab lists the pre-configured actions in the Available Actions
list. To apply an Action, select it in the Available Actions list on the left, then
click >> to move it to the list of Selected Actions on the right.
You can select multiple actions to apply when the Policy executes. The
actions will be applied according to the Execution Policy options you
select.
16. Click Apply to save the changes, then click Close to exit the Policy
Configuration Manager window.
If you click Close before Apply, you will be prompted to save or cancel the
changes.
The new policy appears in the Policies list in the Manage Policies window.
13-13
Using Policy Manager Features
Configuring Policies
Editing Policies
To edit a policy:
1.
Click the Policy Manager icon in the toolbar to launch the Policy Configuration
Manager window.
2.
To display the Manage Policies (modify) panel
•
Click the Policies node in the Policy Manager window, or
•
Right-click a policy in the table and select Modify policy in the menu, or
•
Double-click an entry in the table.
3.
Select the policy in the list, which enables the Edit... and Delete buttons.
4.
Click Edit... to launch the policy properties window and edit the policy
parameters as needed.
5.
Click Apply to save your changes, then click Close to exit the Policy
Manager window.
Deleting Policies
To delete a policy action:
1.
Click the Policy Manager icon in the toolbar to launch the Policy Configuration
Manager window.
2.
Click the Policies node in the Policy Manager window to display the
Manage Policies panel.
3.
Right-click a policy in the table and select Delete policy in the menu, or
Select the policy in the list, which enables the Edit... and Delete buttons,
and then click the Delete button.
4.
Click Yes in the confirmation dialog to delete the policy.
The policy is removed from the Policies list.
5.
13-14
Click Close to exit the Policy Manager window.
Using Policy Manager Features
Configuring Policies
Enabling/Disabling Policies
When you create a policy, the default configuration automatically enables the
policy so it is set to run whenever a triggering alert is received. When running
tests or reconfiguring parts of the network, you may want to temporarily
disable or stop the policy from taking any action.
To disable or enable the enforcement of a policy:
1.
Click the Policy Manager icon in the toolbar to launch the Policy Configuration
Manager window.
2.
Click the Policies node in the Policy Manager window to display the Manage
Policies panel.
3.
Select the policy in the list, which enables the Enable/Disable button.
4.
Click Enable/Disable to enable or disable the policy.
This button works as a toggle. The Status shown in the Policies list will
change from Enabled to Disabled and back, each time you click the button.
Manually Enforcing Policies
Policies use the Alert parameters to trigger actions, that is enforcement of the
policy. If the policy was disabled at the time it would normally have been
enforced, you can re-enable the policy, then manually enforce the policy,
rather than wait for the next Alert to trigger the policy action.
To enforce a policy manually at any time:
To disable or enable the enforcement of a policy:
1.
Click the Policy Manager icon in the toolbar to launch the Policy Configuration
Manager window.
2.
Click the Policies node in the Policy Manager window to display the Manage
Policies panel.
3.
Select the policy in the list, which enables the Enforce button.
4.
Click Enforce to run the policy immediately, that is execute the policy
action without waiting for the alert trigger.
The status columns for the policy will be updated with the results of the policy
enforcement, and the Progress column in the Policy History will show the
percentage (%) completion of the policy. The history will indicate a "Manual"
alert name and type to indicate manual enforcement of the policy. You can
click the Cancel Action button in the History tab to halt the policy action.
13-15
Using Policy Manager Features
Configuring Policies
Policy History
Use the History tab in the Policy Manager window to identify what Polices
have been executed, and the current status of the policy’s action.
Figure 13-10. Manage Policies: History tab
The top pane lists information for the policies that have executed.
Alert #: Unique ID number assigned to the alert. An alert is provided a unique
ID, and each action that results from that alert will have its own history
table row, thus the alert ID shows which actions resulted from which alert.
You can sort by alert ID to group together all the actions from a single alert.
Policy Name: Name assigned when the policy was configured
Trigger Date: Timestamp for when the alert trigger was generated
Alert Name: Name assigned when the alert was configured
Alert Type: Type of alert that triggered the policy (e.g., Event-driven, Scheduledriven, or Manual if policy was manually enforced)
Source: IP address of the switch, server, or UTM that generated the alert or the
device identified by the alert as the source (for example, an edge switch
connected to a host identified by a VT alert), or N/A for manually enforced
policies.
Action Taken: The name of the action executed by the policy.
Action Type: The action type of the action executed by the policy.
Action Start: Timestamp for when the action was started by the policy.
Action End: Timestamp for when the action was completed
13-16
Using Policy Manager Features
Configuring Policies
Progress: Indicates percentage of action completed. If less than 100% then the
action did not successfully complete. For example, in cases such as
Configuration Scan policy, if the action is unable to complete on all device
targets, the percentage of devices successfully scanned displays.
The details panel at the bottom displays information about the Alerts associated with the selected Policy, and the Actions taken by the policy.
Figure 13-11. Policy History: Bottom panel display
You can scroll to review all of the alert properties and action properties
associated with the selected policy.
13-17
Using Policy Manager Features
Configuring Policies
Creating Times for Policies
You can define times at the point when you create the policy, or use the Times
configuration option to define a set of times separate from the policies, that
can be applied as needed when creating automated Policies.
To create a pre-defined Time:
1.
Click the Times icon in the PCM toolbar to display the Configure Times
panel.
Figure 13-12. Configure Times window
2.
13-18
Click the Add Times icon in the Times toolbar to display the Create a new
Time dialog.
Using Policy Manager Features
Configuring Policies
Figure 13-13. Configure Times: Create New Time window
3.
Define the properties for the new time.
Name:
Name used to identify the time
Description
Brief description of the time
Time
Time of day being defined. The default is All day (24 hours).
To restrict the time to specific hours of the day, click the From
radio button and type the start (from) time, and the (end) To
times. The To time must be later than the From time. AM or
PM must be specified.
Days of week Days of the week that the Time applies. Every day is the
default. Click the radio button next to the desired days. Click
the Custom radio button to enable the day(s) of the week
check boxes.
13-19
Using Policy Manager Features
Configuring Policies
Range
4.
Dates during which the time will be in effect. Select the Start
Date and then click the No End Date radio button, or select
the End Date.
Click Ok to save the new "Time" and close the panel.
The new time appears in the Times panel.
When you create a new Time in PCM, it is automatically added to the list of
Available Times in the Times tab of the Policy Configuration Manager.
Modifying a Time
1.
Click the Times icon in the PCM toolbar to display the Configure Times
panel.
2.
Double-click on a Time in the list to display the Time details in edit mode,
similar to the Create a new Time panel.
You can also select the Time in the list then click the Modify Time icon in
the toolbar to display the modify panel.
NOTE:
3.
Modify the time parameters as described in step 3, on the previous page.
4.
Click Ok to save your changes and close the window
Before you modify or delete a Time, check to make sure that the changes do
not adversely affect an automated Policy already in use.
Deleting a Time
To remove an existing Time:
1.
Click the Times icon in the PCM toolbar to display the Configure Times
panel.
2.
Click on a Time in the list to select it.
3.
Click on the Delete Time icon in the toolbar to remove the location.
The first time you use the Delete Time option, a warning pop-up is
displayed. Click Ok to continue, or Cancel to stop the delete process.
4.
13-20
The Time is removed from the Times list.
Using Policy Manager Features
Custom Groups for Policies
Custom Groups for Policies
ProCurve comes with defined device groups for each of the managed
ProCurve device types. You can also create custom groups to define a specific
network segment or set of devices for application of Policies.
All of the device groups and custom group names are listed in the Available
Groups lists for setting Sources and Targets for Policies. For additional details
on creating Custom Groups, see Chapter 10, “Working with Custom Groups”
for details.
Defining Alerts for Policies
There are two types of Alerts you can configure to serve as policy action
triggers.
■
Use Event-driven alerts to create policies that will take an action in
response to a specific event. These can be especially useful in
detecting and mitigating possible security or process problems.
■
Use Schedule-driven alerts to enforce (apply) the policy immediately,
and/or schedule the Policy for automatic enforcement at specific,
recurring times. You can use this for running intensive scans or
discovery functions at times when it will have the least impact on
network operations.
If you are using the Network Immunity Manager, you will also see Security
Alert types in the Policy Configuration Manager tree. Refer to the Network
Immunity Manager User’s Guide for details on using Security alerts.
Creating Event-based Alerts
To configure an event-based alert type:
1.
Click the Policy Manager icon in the toolbar to launch the Policy Configuration
Manager window.
2.
Click the Alerts node in the Policy Manager window to display the Manage
Alerts panel.
13-21
Using Policy Manager Features
Defining Alerts for Policies
Figure 13-14. Policy Configuration, Manage Alerts panel
The Manage Alerts window displays the list of defined Alerts.
3.
Click New... to launch the Create Alert dialog:
Figure 13-15. Create Alert dialog, with alert type options
13-22
4.
Select the Event-based Alert option in the Alert type pull-down menu.
5.
Type in a Name for the Alert (required) and a brief Description (optional).
Using Policy Manager Features
Defining Alerts for Policies
6.
Click OK to save the Alert and display the Alert Properties tab.
The properties you set in the previous step should appear.
Figure 13-16. Policy Manager: Alert Properties example
7.
Click the Filter tab to enter the event filter criteria.
The Filter defines one or more conditions required to issue an alert. At
least one condition must be defined. You can also combine two or more
filter types, for example severity, source IP, and group. Just enter the data
for each filter to be applied for the event condition.
To configure the filter:
a.
For the Alert me when I receive field, click the up and down arrows in
the events field to set the minimum number of events (meeting all
other filter criteria) that must occur before issuing an alert.
The number of events works in conjunction with the time period
condition in the lower section of the dialog. For example, you can
issue an alert when more than five events are issued within ten
minutes. The default setting is one event within one second.
b.
Click the has OID starting with checkbox to filter events by the OID of
the trap that was received, and then type the OID for traps you want
included in the alert.
13-23
Using Policy Manager Features
Defining Alerts for Policies
Figure 13-17. Policy Manager, Event-driven Alerts filter
13-24
c.
Click the has severity checkbox to filter events by severity, then
use the pull down menus to select the operator (equal, not equal, greater
than, or less than), and the severity level (Any, Informational, Warning, Minor,
Major, and Critical). For example, to issue an alert when a Major or
Critical event occurs, select "Greater Than" and "Minor."
d.
Click the Contains checkbox to filter events by their content (text),
and type the text (1-35 characters) that you want to use as a filter. For
example, you can issue an alert when an event contains the phrase
"Error occurred when" or "port number 12."
e.
Use the Within a period of field to set the time interval used to count
the minimum number of events that must occur before an alert is
issued. Click the up and down arrows in the field to select the desired
time period, then select the interval type: second, minute, hours, or
days.
Using Policy Manager Features
Defining Alerts for Policies
If you configure a time window and the alert fires, it will not fire again
until the time since the first event that was used to trigger the alert is
greater than the time window. In other words, the alert will only fire
once per given time period, then it will go silent.
8.
Click the Source tab to set Alert Source criteria.
Figure 13-18. Policy Manager, Event-driven Alerts Source selection
9.
Click the radio button to select one of the Alert Source options:
•
Alert source as event source will include the IP address of the device
that generates the Alert as the alert source.
•
Alert source(s) as contents of event will include the IP addresses of
devices generating alerts in the description text of the event message.
10. Click Apply to save the Filter criteria.
11. Click Close to exit the Policy manager.
If you click Close before Apply, you will be prompted to save or cancel the
changes.
13-25
Using Policy Manager Features
Defining Alerts for Policies
Creating Schedule Driven Alerts
To configure a Schedule Driven alert type:
1.
Click the Policy Manager icon in the toolbar to launch the Policy Configuration
Manager window.
2.
Click the Alerts node in the Policy Manager window to display the Manage
Alerts panel.
Figure 13-19. Policy Configuration, Manage Alerts panel
The Manage Alerts window displays the list of defined Alerts.
3.
Click New... to launch the Create Alert dialog
(see figure 13-15 on page 13-22)
4.
Select the Schedule Driven Alert option in the Alert type pull-down menu.
Type in a Name for the Alert (required) and a brief Description (optional)
13-26
5.
Click OK to save the Alert and display the Alert Properties tab.
The properties you set in the previous step should appear.
6.
Click the Schedule tab to set the schedule parameters.
Using Policy Manager Features
Defining Alerts for Policies
Figure 13-20. Policy Manager, Schedule-driven Alerts filter
7.
Set the Start Date for enforcement of the policy. The default is the date and
time the policy is created.
You can type in a new date and time, or use the arrows to increase or
decrease the date and time entries. Note that the time clock uses 24 hour
format; thus a time of 22:00 is used to indicate a start time of 10:00 pm.
Check (click) the Run at first opportunity if schedule missed checkbox to
enforce a policy as soon as possible after the start date. This is especially
useful when a policy is re-enabled (after being disabled). The policy will
be enforced immediately if it missed a scheduled enforcement time while
disabled.
13-27
Using Policy Manager Features
Defining Alerts for Policies
8.
Define the alert schedule using the Recurrence pattern options:
Select...
To do this
Never
No further action is required (Use this option with event-driven
policies, to disable the recurring enforcement schedule).
One time
No further action is required (the currently scheduled time is used
with no recurrences).
Hourly
Type the number of hours and minutes to wait between
enforcements. If you do not want the policy enforced on Saturdays
and Sundays, select the Skip weekend checkbox.
Daily
Type the number of days to wait between enforcements. If you do
not want the policy enforced on Saturdays and Sundays, select the
Skip weekend checkbox.
Weekly
Select the days of the week you want to enforce the policy.
Monthly
This will enforce the schedule on the last day of the month, OR
Select the Day option and set the day of the month for enforcement.
The screen display will vary based on the Recurrence pattern you select.
For example, the figure below shows the recurrence options for hourly.
Figure 13-21. Hourly Recurrence pattern options
9.
To set the End date options, click the radio button to identify when the
schedule should end.
•
No end date—the policy will run as scheduled until it is changed or
deleted.
•
End by—set the date and time that the policy enforcement will "end by."
•
Maximum occurrences—set the number of times the policy should be
enforced before it is disabled automatically.
10. Click Apply to save the Filter criteria.
11. Click Close to exit the Policy manager.
If you click Close before Apply, you will be prompted to save or cancel the
changes.
13-28
Using Policy Manager Features
Defining Alerts for Policies
Editing Policy Alerts
To edit a policy alert:
1.
Click the Policy Manager icon in the toolbar to launch the Policy Configuration
Manager window.
2.
To display the Manage Alerts (modify) panel
•
Click the Alerts’ node in the Policy Manager navigation pane, or
•
Right-click an Alert in the list and select Modify in the menu, or
•
Double-click an entry in the list.
3.
Click the Alerts node in the Policy Manager window to display the Manage
Alerts panel.
4.
Select the alert in the list, which enables the Edit... and Delete buttons.
5.
Click Edit... to launch the action properties window and edit the Alert
parameters as needed.
The alert property tabs displayed will vary based on the Alert type.
6.
Note:
Click Apply to save your changes, then click Close to exit the Policy
Manager window.
When an alert is used by Policies, those policies will be temporarily disabled
while changes are saved, or the alert is deleted.
Deleting Policy Alerts
To delete a policy action:
1.
Click the Policy Manager icon in the toolbar to launch the Policy Configuration
Manager window.
2.
Click the Alerts node in the Policy Manager window to display the Manage
Alerts panel.
3.
Select the alert(s) in the list, which enables the Edit... and Delete buttons.
4.
Click the Delete button, then click Yes in the confirmation dialog to delete
the alert.
The alert is removed from the Alerts list in Policy Manager.
5.
Click Close to exit the Policy Manager window.
13-29
Using Policy Manager Features
Configuring Policy Actions
Configuring Policy Actions
ProCurve Manager Plus comes with a set of pre-defined actions, that you can
customize for use in your Policies. You can also create user-defined actions
using the Configurable Integration Platform (CIP) feature. See “Adding Userdefined Actions” on page 16-16 for detail on using User-defined Actions. The
basic process for configuring Actions is described below, using one of the
Policy Manager action types.
The configuration parameters for each Action type are described in the tables
under “Action Type Definitions” on page 13-40. The tables correspond to the
Action type groups (Config Manager, Device Management, Policy Manager,
etc.). Note that the "Policy Manager" action types correspond to the Alerts
configuration used in PCM+ version 2.1 and earlier.
Creating an Action
The following process describes a fairly simple Action type configuration, that
includes a single tab of action parameters:
1.
Click the Policy Manager icon in the toolbar to launch the Policy Configuration
Manager window.
2.
Click the Actions node in the Policy Manager window to display the
Manage Actions panel.
Figure 13-22. Policy Manager: Manage Actions panel
13-30
Using Policy Manager Features
Configuring Policy Actions
The Manage Actions window displays the list of defined Actions.
3.
Click New... to launch the Create Action dialog:
Figure 13-23. Create Action dialog
4.
Select the Action type from the pull-down menu.
For this example, you would need to scroll the menu to select the Policy
Manager: Display Message Dialog option.
5.
Type in a Name for the Action (required) and a brief Description (optional)
6.
Click OK to save the Action and display the Action Properties tab.
The properties you set in the previous step should appear.
13-31
Using Policy Manager Features
Configuring Policy Actions
Figure 13-24. Action Properties window
7.
Click the Message tab to configure parameters for the Display Message.
TIP: For users of PCM+ 2.1 or earlier, this is what you would do to create a
Pop-up Message Dialog for an alert.
Figure 13-25. Display Message Action: Message tab
13-32
Using Policy Manager Features
Configuring Policy Actions
Type in the message text (a string from 1-75 characters) you want to
appear in a pop-up dialog when an alert is issued. The default is to include
the variables described in the Substitution List. You can enter additional text,
and/or delete any of the default message variables.
The Substitution List describes the default variables included with the message, which will be replaced (before the message is displayed) by data
from fields in the alert that triggers the action.
8.
Click Apply to save the Action configuration.
9.
Click Close to exit the Policy Manager
If you click Close before Apply, you will be prompted to save or cancel the
changes.
Creating an Action: Multi-tab Configuration Process
The following example steps you through a more complex Action type, that
includes multiple tabs for setting the action parameters.
The first few steps are the same as before.
1.
Open the Policy Manager and select the Actions node to display the Action
Manager window.
2.
Click New... to launch the Create Action window.
3.
Select the Action type from the pull-down menu, then type in a Name and
description for the Action.
For this example, we selected the NetConsistency:Network Analyzer
action.
4.
Type in a Name for the Action (required) and a brief Description (optional)
5.
Click OK to save the Action and display the Action Properties tab.
The properties you set in the previous step will appear.
13-33
Using Policy Manager Features
Configuring Policy Actions
Figure 13-26. Network Analyzer Action:Properties tab
As you can see there are three tabs included for this Action type. You need to
set the parameters in each tab to complete the Action configuration.
6.
13-34
Click the Rules Selection tab and select the rules to include in the action.
Using Policy Manager Features
Configuring Policy Actions
Figure 13-27. Network Analyzer Action:Rules Selection tab
In this screen, you click the check boxes to select or deselect the rules
options. You can select All Rules, or any Category of rules (Mesh, Trunk,
Port), or individual test options within a category. When you select a rule
Category or individual rule, the description of the rule that will be tested
displays.
7.
Click the Format tab to select the Report format that will be used to output
the Network Analyzer test results.
Figure 13-28. Network Analyzer Action:Format tab
13-35
Using Policy Manager Features
Configuring Policy Actions
Click the Radio button to select the format. Only one option can be
selected at a time.
8.
Click the Delivery tab to set the method used to send the report to the
appropriate person.
Figure 13-29. Network Analyzer Action:Delivery tab
E-mail is the default method. It will e-mail the report to the address
specified. It also requires that you have an SMTP profile for the E-mail
address. See “Creating SMTP Profiles” on page 2-24 for details.
Use the pull-down menu to select a different delivery method.
If you select FTP, the fields in the Delivery tab will change to allow input
of the required information for FTP.
13-36
Using Policy Manager Features
Configuring Policy Actions
Figure 13-30. Network Analyzer Action: Delivery tab, FTP options
Similarly, if you select the "File" option, the displayed fields reflect requirements for delivery of the report output to a file.
Figure 13-31. Network Analyzer Action: Delivery tab, File options
In each case, enter the required data.
9.
When you have defined the parameters in each tab, click Apply to save the
Action configuration, then click Close to exit the Policy Manager window.
Each of the Actions you create under the Actions node in the Policy Manager,
and in the Manage Actions list.
13-37
Using Policy Manager Features
Configuring Policy Actions
Figure 13-32. Policy Manager: Actions list display
Editing Policy Actions
To edit a policy action:
1.
Click the Policy Manager icon in the toolbar to launch the Policy Configuration
Manager window.
2.
Click the Actions node in the Policy Manager window to display the
Manage Actions panel.
3.
Select the action in the list, which enables the Edit... and Delete buttons.
4.
Click Edit... to launch the action properties window and edit the Action
parameters as needed.
The action property tabs display will vary based on the Action type.
5.
Note:
13-38
Click Apply to save your changes, then click Close to exit the Policy
Manager window.
When an action is used by Policies, those policies will be temporarily disabled
while changes are saved, or the action is deleted.
Using Policy Manager Features
Configuring Policy Actions
Deleting Policy Actions
To delete a policy action:
1.
Click the Policy Manager icon in the toolbar to launch the Policy Configuration
Manager window.
2.
Click the Actions node in the Policy Manager window to display the
Manage Actions panel.
3.
Select the action in the list, which enables the Edit... and Delete buttons.
4.
Click the Delete button, then click Yes in the confirmation dialog to delete
the action.
The action is removed from the Actions list in Policy Manager.
5.
Click Close to exit the Policy Manager window.
13-39
Using Policy Manager Features
Action Type Definitions
Action Type Definitions
The following tables provide a description of the Action types, along with the
tabs and configurable parameters for that action.
Note that the "Properties Tab" is not listed as it is the same for all Action types;
that is, you use it to select the action type, and enter a name and description
for the configured action.
Configuration Manager Action Types
The Config Manager action types can be used in policies to automate various
device configuration tasks. The functionality provided is similar to the configuration manager functions described in Chapter 9, “Managing Device Configurations”.
Table 13-1. Config Manager Action Types
Action
Description
Tabs
Parameters
Deploy Device
Group
Used to deploy a
configuration to a
device group (all
same model)
Rollback: Used to select a
labeled (known good)
configuration to apply to
target devices.
• Select Label
Prerequisite: a labelled
configuration for the device group.
File Copy: Used to set
Secure Copy options for
transfer of configuration
files.
• Use TFTP
• Use Secure Copy*
• Allow TFTP failover options
*Must have SSH enabled on device
Deploy configuration
template to device
group
Template
• Select Template
Prerequisite: Configuration template
already created for device type.
Export Device
Configuration
Export archived
device config file
Properties only
Refer to “Exporting Device
Configurations” on page 9-41.
Group CLI
Use to execute CLI
commands on target
devices
Script
• Enter commands
• Commit to Flash
• Capture Config
Options
• Capture output to a file (enter
Filename, select Append option)
Deploy Template
to Group
Scan Device
13-40
Scan Device
Configurations
File Copy: (see above)
File Copy: (see above)
Using Policy Manager Features
Action Type Definitions
Device Manager Action Types
The functionality provided with the Device Manager action types is similar to
the device manager functions described in Chapter 6, “Managing Network
Devices”. Use these actions in a Policy to automate device management.
Note that the "Properties Tab" is not listed as it is the same for all Action types;
that is, you use it to select the action type, and enter a name and description
for the configured action.
Table 13-2. Device Manager Action Types
Action
Description
Tabs
Parameters
Authorized
Managers
Add/edit Authorized
Manager on target
device
Authorized managers
(Add, edit, delete)
See “Adding Authorized
Managers” on page 6-8 for
additional information.
• IP Address
Mask
• Access level
• Previous Device Settings:
Leave/Clear
Communication
Parameters
Set Communication
Parameters in
device for SNMP, CLI
General
• Select settings to configure:
SNMP and/or CLI
SNMP version
• select SNMP versions (V1/2, V3)
SNMP Credentials
• Community Names (add, edit,
delete)
– Community Name
– Read Access
– Write Access
– Set Management community
• SNMPV3 users– Username
– Auth Protocol, Auth password
– Group
– Priv Protocol, Priv Password
– assign Management User
See “Setting
Communication
Parameters in Devices” on
page 6-14 for additional
information.
Test
Communication
Parameters
Runs
communication
parameters test
CLI Mode
• Select Telnet and/or SSH
SSH Credentials
• Select SSH1 or SSH2, and
• Password, or Key Authentication
User Credentials
• Leave Existing settings, or
Enable Password Protection:
– Set Mgr Username, Password
– Set Opr Username, Password
Properties only
See “Using Test Communication
Parameters in PCM” on page 6-35 for
additional information on this feature.
13-41
Using Policy Manager Features
Action Type Definitions
Table 13-2. Device Manager Action Types
Action
Description
Tabs
Parameters
Trap Receivers
Add trap receiver for
target device
Trap Receivers
• Add, edit, delete trap receivers:
– IP Address
– Event log filter
Spanning Tree
Protocol
(See below)
Use to enable or
disable STP on
target devices
STP State
Enable or Disable
Using Spanning Tree Protocol: The Spanning Tree Protocol (IEEE 802.1d)
maintains a loop-free topology in networks with redundant bridges or
switches. The spanning tree devices determine which devices will be active
and which will be backups so that no two nodes in a network have more than
one active path between them at any time. The Spanning Tree Protocol uses
the most efficient path between segments. If a bridge or switch fails, the other
bridges and switches reconfigure the network automatically. When the problem is repaired, the bridges and switches automatically return to the original
network configuration.
13-42
Using Policy Manager Features
Action Type Definitions
Policy Manager Action Types
The Policy Manager action types can be used to generate alerts in response to
the triggering event. For users familiar with PCM 2.0 and 2.1 versions, these
action types replace the Alert Configuration Wizard features.
Note that the "Properties Tab" is not listed as it is the same for all Action types;
that is, you use it to select the action type, and enter a name and description
for the configured action.
Table 13-3. Policy Manager Actions
Action
Description
Tabs
Parameters
Display Message
Dialog
Use to display text pop-up
message for the alert
Message
• Message text
Can use substitution list for
variables provided.on tab.
Execute
Command on Server
Execute system command
on management server
Command
• Command text
can use substitution list for
variables provided.on tab.
Trap
• Trap Receiver (IP address)
• Port (default is 162)
• Content - enter contents to be
included in trap message, can use
substitution list for variables,
provided on tab.
Email
•
•
•
•
Forward Trap
Send Email
Fwd e-mail with alert
details
SMTP Profile*
To: email address
From: email address
Subject: text input, can use
variable substitutions.
• Message Body: text input, can use
variable substitutions shown in
tab.
* Prerequisite: Must set up SMTP
profile first. See “Creating SMTP
Profiles” on page 2-24 for details.
Content Variables for use in Policy Manager Actions: The Substitution
List in the tabs for configuring Policy Manager actions describes the variables
you can use in the Content and text fields. The variables will be replaced (before
the trap or message is forwarded) by data from fields in the event that invokes
the alert.
13-43
Using Policy Manager Features
Action Type Definitions
Port Settings Action Types
The Port Settings action types can be used to limit access, or service available
at the target port.
Table 13-4. Port Settings Actions
Action
Description
Tabs
Parameters
Port Setting:
Enable/Disable Port
Use to temporarily shut down a
port
Port Status
• Enabled
• Disbled
Port Setting:
Guaranteed Minimum
Bandwidth
(GMB)
Use to set the percentage of
Guaranteed
bandwidth allocated to the
Minimum
various priority levels of each
Bandwidth
outbound traffic priority queue of
the targeted ports on devices that
support GMB.
• Configure GMB on target port
- Disable GMB
- Enable GMB
• If enable GMB, set
Low Priority Queue %
Normal Priority Queue %
Medium Priority Queue %
High Priority Queue %
Port Setting:
Quality of Service
Used to set the priority of packets Quality of
handled by the targeted ports on Service
devices that support Quality of
Service (QoS).
• Configure source port QoS settings on
targeted port
• No override
• 802.1p Priority, priority (0 - 7)
• DSCP Priority, priority (0 -7) and
codepoint (0 - 63).
See Operating Notes for QoS below.
Port Setting:
Rate Limit
Limits the inbound bandwidth on a Rate Limit
switch port that a user or device
can utilize. Effectively enforces
maximum service level
commitments granted to network
users.
Configure Rate Limiting on target ports
• Disable Rate Limiting
• Enable Rate Limiting
• Rate Limit % : set the maximum
percentage of bandwidth to be
allocated to the targeted ports.
Operating Notes for QoS:
With No override, QoS does not affect the packet queuing priority or VLAN tagging, and packets are handled as follows:
• If received and forwarded on a tagged VLAN, the 802.1 priority is not changed.
• If received on an untagged VLAN and forwarded on a tagged VLAN, the 802.1 priority is 0 (normal).
• If forwarded on an untagged VLAN, no 802.1 priority is used.
For 802.1p Priority:
Assigns an 802.1p traffic priority setting (0-7) carried by packets moving from one device to another in an 802.1Q tagged
VLAN environment. The switch uses the 802.1p priority to determine the queue in the outbound port to use for the
packet. If the packet leaves the switch in a tagged VLAN, it carries the 802.1p priority to the next downstream device.
If the packet leaves the switch through an untagged VLAN, this priority is dropped, and the packet arrives at the next
downstream device without an 802.1p priority assignment. 802.1p priorities range from 0-7 with 7 being the highest
priority.
For DSCP Priority:
Associate a handling priority with a codepoint in an incoming IPv4 packet. DSCP priority is not dependent on tagged
VLANs to carry priority policy to downstream devices. DSCP priorities range from 0-7 with 7 being the highest priority.
Codepoints range from 0-63. The priority selected will be assigned to this codepoint regardless of its current setting.
13-44
Using Policy Manager Features
Action Type Definitions
Other Action Types
This table provides the descriptions for all other action types currently
included with the PCM+ Policy Manager. Note that the "Properties Tab" is not
listed as it is the same for all Action types; that is, you use it to select the action
type, and enter a name and description for the configured action.
Table 13-5. Other Actions
Action
Description
Tabs
Parameters
Discovery:
Device Attributes
Discovery
Used to set the attributes to
be updated from device
discovery on targets.
Select Attributes
Use check boxes to select device
attributes to be captured in discovery.
See “Using Re-Discover Device” on
page 3-12 for details.
Discovery:
Polling Policy
Use to launch Discovery
Polling
Properties
Mac Lockout
Use to block access to the
target device for the
specified MAC address.
MACs
• Select option to use MACS in
event, or
• Type in MAC addresses to be
blocked.
Rules Selection
• Use check boxes to select
network rules to be tested.
See Chapter 14, “Using the Network
Consistency Analyzer” for rule
details.
Format
• Select report format:
PDF, HTM, CSV
Delivery
• Select Delivery Method and enter
details
– Email (requires SMTP profile)
– FTP - set FTP server and
filename, username and
password
– File - set server path and
filename
Type
Format (see above)
Delivery (see above)
• See Net Consistency above for
Format and Delivery parameters.
• Refer to Chapter 15, “Using
Reports” for details on specific
report parameters and settings.
Net Consistency:
Network Analyzer
Report Manager:
Generate Report
Generate report
Additional tabs to
set report filters.
13-45
Using Policy Manager Features
Action Type Definitions
Table 13-5. Other Actions
Action
Description
Tabs
Parameters
Security:
VT Configuration
Configure Virus Throttle on
target device.
See Chapter 12, “Using
Virus Throttle” for details
on configuration.
VT Configuration
• Disable/Enable,
• Set Global sensitivity
(low, medium, high, aggressive)
• Set VT Action to take.
(notify only, throttle, block, no)
Software Update:
Download
Software Index
See “Downloading the
Software Version List” on
page 9-57 for details.
Properties
Traffic: Traffic
Sampling
(SFLOW, XRMON
Use to automatically
enable or disable traffic
sampling (sFlow, XRMON)
in response to an event.
Traffic Sampling
State
• Click to select the sampling option
– Enable traffic sampling
– Disable traffic sampling
VLAN Settings
• Click check box to select the
Ignore and reboot options:
– Ignore if VLAN not enabled on
device
– Ignore if max. VLANs reached
on device
– Ignore VLAN IDs that already
exist on device.
– Allow device reboot if needed
VLAN Information
•
•
•
•
Vlan Manager:
Create VLAN
13-46
VLAN name,
IP Config (DHCP or disabled),
Subnet Mask (for dhcp),
VLAN IDs for
– Tagged
– Untagged
– Forbidden VLAN IDs
Using Policy Manager Features
Setting Policy Management Preferences
Setting Policy Management Preferences
Use the Preferences for Global Policy Management to set the parameters that
define the number of entries to include in the Policy History, the global setting
for execution of device configuration changes by policies, and logging options
for policies in the Events browser.
To set Policy Management Preferences:
1.
Navigate to the Policy Management Preferences window.
a.
Click the Preferences icon in the toolbar (or use the Tools Menu).
b.
In the Preferences navigation Pane, select Policy Management.
Figure 13-33. Preferences, Global: Policy Management display
1.
Select the Maximum number of policy history entries to retain in thePolicy
History log. The default is 5,000. You can type in a number, or use the
buttons to increase or decrease in steps of 100.
13-47
Using Policy Manager Features
Setting Policy Management Preferences
2.
Click the radion button to select the Configuration Changes option you want
to apply to all policies:
•
Log actions that would be taken by policies but do not allow device
configuration changes
This option is useful for monitoring or testing of policies prior to full
implementation. It will log the policy activity as if all actions were
executed, but it will not actually allow any policy action to change a
device configuration.
•
Log actions that would be taken by policies and allow device configuration
changes.
This allows full implementation of the policy, including device configuration changes. Use this option when you have tested the policy
and are confident the result of a device configuration is what you
intended.
3.
Click the checkbox to enable the Policy Logging option.
The "Suppress event log messages during policy execution, only log policy
results" will trim the reporting of intermediate steps taken during the
execution of a policy, and log only the result of the final policy action.
ProCurve recommends that you do not suppress Policy Logging until you
have tested the policy and fully understand how your policy is operating.
Once you are confident the policy is operating as intended you can
suppress policy logging to reduce the number of policy activity events in
the Events browser.
4.
Click OK to save your changes and exit the window
Notes:
13-48
■
The number of Policy History entries retained is global and effects all
policy history tables (Policy Activity tab, Security Activity tab and
PolicyManager dialog). The history size chosen will impact the length
of history available, as older records will be deleted to make room for
new records.
■
Policy History entries are not archived, except in the sense that the
policy activity events shown in the event browser will be archived.
■
When you enable the Policy Logging suppression, you will not be able
to recover the suppressed policy events, they are lost forever.
14
Using the Network Consistency Analyzer
Contents
Introduction . . . . . . . . . . . . . . . . . . . . . . . . . . . . . 14-2
Creating a Network Analyzer Policy . . . . . . . . . . 14-3
The Network Consistency Analysis Report . . . . 14-9
Network Consistency Rule by Device Type . . . . 14-10
Misconfiguration Messages . . . . . . . . . . . . . . . . . 14-11
14-1
Using the Network Consistency Analyzer
Introduction
Introduction
The Network Consistency Analyzer feature helps you to find and correct
problems in the network that may be affecting network performance and
security. The Analyzer lets you check the ProCurve managed devices on the
network to ensure that the device configuration is correct for the individual
device, and according to network topology configurations. If incorrect configurations are found, the data for the specific device along with the configuration error is captured in a Network Analysis report.
PCM+ uses a "Network Consistency: Network Analyzer" Policy, that includes
a series of pre-defined rules for various network and device configuration
categories, including Port, Trunk, Mesh, STP, VLAN, ACLs, and Security. When
the Policy is run, it compares each device in the specified group against the
selected rules. It then creates a report in your choice of .PDF or HTML format
that can be saved as a file, FTP’d to a specified address, or sent via e-mail. The
Network Consistency Analysis Report:
14-2
•
Lists the configuration category,
•
Identifies the Ports, Devices, or VLANs where the problem was found,
•
Defines the required action to correct the problem
Using the Network Consistency Analyzer
Creating a Network Analyzer Policy
Creating a Network Analyzer Policy
You can use the Network Consistency:Network Analyzer action with Policy
Manager to specify the Report type and output method, specify the network
consistency checking schedule, select device groups, and rules that will be
used. Refer to “Configuring Policies” on page 13-5 for more detailed information on creating policies.
The basic steps to create a Network Analyzer Policy are:
1.
Click the Policy Manager icon in the toolbar to launch the Policy Configuration
Manager window.
2.
Select the Policies node in the navigation tree to display the Manage Policies
panel, then click New... to launch the Create Policy dialog.
3.
Fill in the Policy information:
a.
In the Name field, type a name to identify the policy, for example:
Network Analyzer.
This name will appear as a node in the Policies navigation tree, and
in the list in the Manage Policies panel.
b.
In the Description field, type in a brief description to help you identify
the policy and what it will do.
14-3
Using the Network Consistency Analyzer
Creating a Network Analyzer Policy
4.
c.
Click the Enable Policy check box to enable the policy.
A check in the box indicates the policy will take effect immediately
when its configuration is completed.
If the check box is empty, the Policy is disabled. It will not take effect
until you Enable it.
d.
Click OK to save the Policy Properties and display the Policy Configuration panel for your new policy.
Click the tabs to fill in the required information:
•
Times - Time periods when the policy can be executed. If no time is
specified, the policy can execute at any time.
•
Sources - Devices or ports from which events are received. If no
source (Device or Custom group) is selected, the policy will match
events from any source.
•
Targets - Devices or ports on which a defined action will be performed
in response to an alert, if applicable. If no Target is selected, the Alert
will log a Policy Manager event in the event browser.
•
Alerts - A defined trigger used to launch an Action. Alerts can be eventdriven, or scheduled to occur at a specified time.
•
Action - Select the NetConsistency:Network Analyzer action. You can
customize the Network Analyzer action as described below.
To customize the Network Analyzer Action:
14-4
1.
Open the Policy Manager and select the Actions node to display the Action
Manager window.
2.
Click New... to launch the Create Action window.
3.
Select the NetConsistency:Network Analyzer Action type from the pulldown menu.
4.
Type in a Name for the Action (required) and a brief Description (optional)
5.
Click OK to save the Action and display the Action Properties tab.
The properties you set in the previous step will appear.
Using the Network Consistency Analyzer
Creating a Network Analyzer Policy
Figure 14-1. Network Analyzer Action:Properties tab
Set the parameters in each tab to complete the Action configuration.
6.
Click the Rules Selection tab and select the rules to include in the action.
14-5
Using the Network Consistency Analyzer
Creating a Network Analyzer Policy
Figure 14-2. Network Analyzer Action:Rules Selection tab
In this screen, you click the check boxes to select or deselect the rules
options. You can select All Rules, or any Category of rules (Mesh, Trunk,
Port), or individual test options within a category. When you select a rule
Category or individual rule, the description of the rule that will be tested
displays.
7.
Click the Format tab to select the Report format that will be used to output
the Network Analyzer test results.
Figure 14-3. Network Analyzer Action:Format tab
14-6
Using the Network Consistency Analyzer
Creating a Network Analyzer Policy
Click the Radio button to select the format. Only one option can be
selected at a time.
8.
Click the Delivery tab to set the method used to send the report to the
appropriate person.
Figure 14-4. Network Analyzer Action:Delivery tab
Email is the default method. It will e-mail the report to the address
specified. It also requires that you have an SMTP profile for the email
address. See “Creating SMTP Profiles” on page 2-24 for details.
Use the pull-down menu to select a different delivery method.
If you select FTP, the fields in the Delivery tab will change to allow input
of the required information for FTP.
14-7
Using the Network Consistency Analyzer
Creating a Network Analyzer Policy
Figure 14-5. Network Analyzer Action: Delivery tab, FTP options
Similarly, if you select the "File" option, the displayed fields reflect requirements for delivery of the report output to a file.
Figure 14-6. Network Analyzer Action: Delivery tab, File options
In each case, enter the required data.
When you have defined the parameters in each tab, click Apply to save the
Action configuration, then click Close to exit the Policy Manager window.
14-8
Using the Network Consistency Analyzer
The Network Consistency Analysis Report
The Network Consistency Analysis
Report
After running the Network Analyzer Policy, you can review the report you
specified in the Policy for any network consistency problems that may exist,
and the action needed to correct the problem.
An HTML format report, saved to a file will appear similar to the following
figure.
Figure 14-7. Network Consistency Analysis Report example
14-9
Using the Network Consistency Analyzer
The Network Consistency Analysis Report
Network Consistency Rule by Device Type
Suite
Rule
Supported ProCurve Devices
Port
Port Speed should be same on both sides of a link All managed
or one side should be set to "Auto".
ProCurve switches.
Ports in a link should be configured the same on All managed
both sides, either Half duplex or Full duplex.
ProCurve switches.
Flow control status should be the same on ports All managed
forming a link
ProCurve switches.
Trunk
All ports in the trunk must have the same flow
control, duplex and speed.
Mesh
Meshed ports in a switch should be connected to 8000M/4000M/2424M/2400M/
a meshed port in the other switch
1600M, 5300xl series, 3400cl
series, and 6400cl series.
Switches from the same product families in a
mesh must run the same version of the OS.
All managed ProCurve
switches
8000M/4000M/2424M/2400M/
1600M, 5300xl series, 3400cl
series, and 6400cl series.
Spanning tree must be same for all switches in 8000M/4000M/2424M/2400M/
the mesh (enabled or disabled). If spanning tree 1600M, 5300xl series, 3400cl
series, and 6400cl series.
is enabled in the mesh, it must be the same
enabled/disabled on all switches in the Mesh
(STP or RSTP).
If a switch in the mesh has GVRP enabled, then
all switches in the mesh must have GVRP
enabled.
8000M/4000M/2424M/2400M/
1600M, 5300xl series, 3400cl
series, and 6400cl series.
If a switch in the mesh has a particular static
VLAN configured, then all switches in the mesh
must have that static VLAN configured.
8000M/4000M/2424M/2400M/
1600M, 5300xl series, 3400cl
series, and 6400cl series.
If a switch in the mesh has per VLAN’s IGMP
enabled/disabled, then all switches in the mesh
must have IGMP enabled/disabled for their
respective particular VLAN.
8000M/4000M/2424M/2400M/
1600M, 5300xl series, 3400cl
series, and 6400cl series.
If a switch in the mesh has CDP enabled, then all 8000M/4000M/2424M/2400M/
switches in the mesh must have CDP enabled.
1600M, 5300xl series, 3400cl
series, and 6400cl series.
If a 5300 switch is connected to older devices in 5300xl series, 3400cl series,
a mesh the "mesh backward compat" command and 6400cl series.
should be executed in that switch.
14-10
Using the Network Consistency Analyzer
The Network Consistency Analysis Report
Suite
Rule
Supported ProCurve Devices
Mesh
ABC available only on 8000M/
Automatic Broadcast Control (ABC) on HP
4000M/2424M/2400M/1600M,
Procurve 8000M/4000M/ 2424M/2400M/1600M
switches is not supported when these switches
are used in the same mesh domain with Series
5300XL switches. Thus, in a mesh domain
populated with both types of switches, ABC must
be disabled
Because paths through the mesh can vary with 8000M/4000M/2424M/2400M/
network conditions, configuring filters on meshed 1600M, 5300xl series, 3400cl
ports can create traffic problems that are difficult series, and 6400cl series.
to predict, and is not recommended.
VLAN
A VLAN assigned to a port connecting two
802.1Q-compliant devices must be configured
with the same tag-type on both sides.
All managed ProCurve
switches
If you create an IPv4 protocol VLAN, you must
5300xl series, 3400cl series,
also assign the ARP protocol option to the VLAN 6400cl series, and 9300 series.
to provide IP address resolution. Otherwise, IP
packets are not deliverable.
Misconfiguration Messages
SUITE
Items
Misconfiguration
Port
Ports:
X.X.X.X[A4],
Y.Y.Y.Y[A1]
The link ports X.X.X.X[A4] speed is 100 The port speed should be configured the same
on both ends of link, or it should be configured
and Y.Y.Y.Y[A1] speed is 200
"Auto," otherwise this may lead to network
breakdown.
Ports:
X.X.X.X [A4],
Z.Z.Z.Z[A5]
The link ports X.X.X.X[A4] is half duplex Ports duplex should be configured the same on
and Z.Z.Z.Z[A5] is full duplex.
both ends of link.
Ports:
X.X.X.X[C4],
T.T.T.T[B5]
In X.X.X.X[C4] flow control status is
disabled and T.T.T.T[B5] flow control
status is enabled.
Ports:
X.X.X.X[A3],
Y.Y.Y.Y.[C3]
All ports in the trunk must have same flow
The Ports X.X.X.X[A3], Y.Y.Y.Y[C3} in
trunk (TRK1) have different flow control control, duplex and speed configured.
settings.
Trunk
Required Action
Both ends of the link must have their flow
control set the same.
14-11
Using the Network Consistency Analyzer
The Network Consistency Analysis Report
SUITE
Items
Misconfiguration
Required Action
Mesh
Devices:
X.X.X.X, Y.Y.Y.Y,
Z.Z.Z.Z
The device(s) X.X.X.X, Y.Y.Y.Y are
running OS version 1 and Z.Z.Z.Z. is
running OS version 2 in the MESH
Switches from same product family in a mesh
must run the same version of OS
X.X.X.X, Y.Y.Y.Y
Z.Z.Z.Z, J.J.J.J
In the meshed devices X.X.X.X, Y.Y.Y.Y In a mesh all devices must enable or disable
STP is enabled, and Z.Z.Z.Z, J.J.J.J STP STP.
is disabled
X.X.X.X, Y.Y.Y.Y
Z.Z.Z.Z, J.J.J.J
In the meshed devices X.X.X.X, Y.Y.Y.Y
GVRP is enabled, and Z.Z.Z.Z, J.J.J.J
GVRP is disabled
In a mesh all devices having VLANs must
enable or disable GVRP.
X.X.X.X, Y.Y.Y.Y,
Z.Z.Z.Z, J.J.J.J
In the meshed devices X.X.X.X, Y.Y.Y.Y
static VLAN200 is configured and not
configured in Z.Z.Z.Z, J.J.J.J
The devices in the mesh must have same static
VLAN configured, if at all it's configured in one.
X.X.X.X, Y.Y.Y.Y,
Z.Z.Z.Z, J.J.J.J
In the meshed devices X.X.X.X, Y.Y.Y.Y
IGMP enabled and Z.Z.Z.Z, J.J.J.J
IGMP disabled
In a mesh all VLANs must have the same IGMP
status (enable or disable) on all the meshed
devices.
X.X.X.X, Y.Y.Y.Y,
Z.Z.Z.Z, J.J.J.J
In the meshed devices X.X.X.X, Y.Y.Y.Y
CDP enabled and Z.Z.Z.Z, J.J.J.J CDP
disabled
In a mesh all devices must enable or disable
CDP.
X.X.X.X
The "mesh backward compat"
The newer device types 5300/3400, etc., must
command is not configured on device execute "mesh backward compat" when
X.X.X.X. This is required if the device is connected to older devices in a mesh.
connected to older devices in a MESH.
X.X.X.X, Y.Y.Y.Y
The device(s) X.X.X.X, Y.Y.Y.Y in the
mesh MESH have filter FL1, FL2
Configuring filters on meshed ports can create
traffic problems and it's not recommended.
X.X.X.X, Y.Y.Y.Y,
Z.Z.Z.Z
The 802.1 Q complaint device(s)
X.X.X.X, Y.Y.Y.Y, Z.Z.Z.Z have VLANS1,
VLAN2 configured and connected but
their port tagging is not same.
A VLAN assigned to a port connecting two
802.1Q-compliant devices must be configured
with the same tag-type on both sides.
VLANs:
X.X.X.X (VLAN1,
VLAN2)
In the device X.X.X.X these IPV4
protocol VLANs VLAN1, VLAN2 ARP
protocol options is not assigned.
f you create an IPv4 protocol VLAN, you must
also assign the ARP protocol option to the
VLAN to provide IP address resolution.
VLAN
14-12
15
Using Reports
Chapter Contents
Introduction . . . . . . . . . . . . . . . . . . . . . . . . . . . . . . . . . . 15-2
Using the Reports Wizard. . . . . . . . . . . . . . . . . . . . . . . 15-3
Setting the Report Heading (Report Preferences) . . . . 15-6
Creating Report Policies . . . . . . . . . . . . . . . . . . . . . . . . 15-7
Definitions for Security Report Types . . . . . . . . . 15-14
15-1
Using Reports
Introduction
Introduction
You can create reports for auditing and regulatory compliance purposes using
the global Reports menu that provides access to pre-defined reports in PCM+.
You can select a report from the Reports->Security menu to launch the Reports
Wizard and create a single version of any one of the following reports:
■
Security History Report: Identifies devices on which the access credentials have changed. The access credentials include SNMP community
names (read and write and SNMPv3 credentials if specified), and
Telnet Manager and Operator usernames and passwords.
■
Password Policy Compliance Report: Identifies all devices (in the
selected group) whose passwords do or do not comply with a specified set of rules governing the passwords.
■
Current Credentials Report: Lists the security user names and passwords for the selected devices.
■
Port Access Security Report: Lists all ports in all devices in the selected
group and includes security configuration information for each port,
similar to data available in the Port Access tab.
■
Device Access Security Report: Lists the security (authentication)
configuration for Device Access on the selected devices, similar to
data available in the Device Access tab.
The IDM sub-menu provides access to reports for use with the Identity Driven
Manager module. The Inventory Report option creates a printable version of
the PCM Devices list display.
15-2
Using Reports
Introduction
Using the Reports Wizard
The following section describes using the Reports menu function, using the
Security History report for the example:
1.
Select the Security History option from the Reports->Security menu.
This launches the Report wizard for the selected report.
Figure 15-1. Report Wizard, Device Group selection
2.
Use the pull-down menu to select the Group (device or custom group) from
which the report data will be generated.
3.
Use the pull-down menu to select the Sort By column, that is the column
on which the report output will be sorted. The default is Device name.
Note that entries in this pull-down will vary based on the report type.
4.
Click the radio button to select whether items will be sorted in Ascending
or Descending order.
5.
Click Next to continue to the next screen to configure additional report
filters. For this example, the Security History report, the change selection
criteria screen displays.
15-3
Using Reports
Introduction
Figure 15-2. Report Wizard, data selection criteria display
6.
Note:
15-4
Click the radio button to select the report criteria:
•
Change = report on all devices in the selected group(s) where the
access credentials have changed.
•
Not Change = report on all devices in the selected group(s) where the
access credentials have not changed.
7.
Set the Period of time to be included in the report. The default is 90 days.
You can type in a number or use the buttons to increase or decrease the
number of days to be included.
8.
Click Finish to run the report.
The report output displays to the screen.
If you try to run a report on more than 1000 items, the output is limited to 40
pages. You may need to run several separate reports to get all the desired data.
Using Reports
Introduction
Figure 15-3. Report Wizard output example: Security History Report
■
Click the print button to output the displayed report to a printer, using
standard Windows print functionality.
■
Click the disc button to save the report to a file using the standard
Windows "Save" functionality.
■
Use the buttons at the bottom of the window to page forward (>) or
back (<) through multiple page reports.
To close the report window, click the Windows close button [x] in the upper
right corner.
For information on the parameters you will need to supply for the other
Security report types refer to “Definitions for Security Report Types” on
page 15-14.
15-5
Using Reports
Introduction
Setting the Report Heading (Report Preferences)
To set the heading that will be printed on your PCM reports, click the
Preferences icon in the PCM toolbar, then select the Reports option in the Global
menu. This will launch the Global Preferences Reports settings window.
Figure 15-4. Preferences, Global:Reports window
Enter the information you want to appear in your reports, then click OK to save
the changes and close the Preferences window.
15-6
Using Reports
Creating Report Policies
Creating Report Policies
You can also use the Policy Manager feature to schedule reports to be created
at regular intervals, or in response to an event. For complete details on
creating policies, refer to “Configuring Policies” on page 13-5. The basic
process for creating a Report Policy is:
■
Configure the Time periods when the report policy can be executed. If
no time is specified, the policy can execute at any time.
■
Alerts - Use the Scheduled Alert option to set a recurring schedule for a
report to be generated. Alerts serve as the trigger used to launch an
Action. Alerts can be event-driven, or scheduled to occur at a specified time.
■
Action - Configure the Report Manager:GenerateReport type(s) for the
policy. The following section describes the Report action types and
configurable parameters and filters for each report type.
You do not need to configure the Sources or Targets for a report, Policy as you
will select the device groups the policy applies to in the Report Action.
Configuring a Policy Action to Generate Reports
To configure a Policy Action to run the Security History report:
1.
Click the Policy Manager icon in the toolbar to launch the Policy Configuration
Manager window.
2.
Click the Actions node in the Policy Manager window to display the
Manage Actions panel.
15-7
Using Reports
Creating Report Policies
Figure 15-5. Policy Manager, Actions display
The Manage Actions window displays the list of defined Actions.
3.
Click New... to launch the Create Action dialog:
Figure 15-6. Policy Manager, Create Action display
15-8
Using Reports
Creating Report Policies
4.
Select the Report Manager:Generate Report Action type from the pull-down
menu.
5.
Type in a Name for the Action (required) and a brief Description (optional)
6.
Click OK to save the Action and display the Action Properties tab.
The properties you set in the previous step should appear.
Figure 15-7. Policy Manager: Report Manager Action configuration
15-9
Using Reports
Creating Report Policies
At this point the other tabs displayed are:
Type: Lets you select the Report type you want to generate. As soon as
you select a report type, additional tabs may appear in the window
depending on the filter criteria for the report.
Format: Lets you set the report output format
Delivery: lets you select where the report will be sent (to file, e-mail,
etc.)
7.
Click the Type tab and select the Security Report type you want included
in the action. In this example, the Security History Report is selected, and the
Select Device Group and Change Selection Criteria tabs are added in the window.
Figure 15-8. Report Manager Action, Report type selection
8.
15-10
Click the Select Device Group tab (shown in the following figure) and
select the device groups and sort criteria.
a.
Use the pull-down menu to select the Group (device or custom group)
from which the report data will be generated.
b.
Use the pull-down menu to select the Sort By column, that is the column
on which the report output will be sorted. The default is Device name.
Note that entries in this pull-down will vary based on the report type.
c.
Click the radio button to select whether items will be sorted in
Ascending or Descending order.
Using Reports
Creating Report Policies
Figure 15-9. Report Manager Action: Select Device Group for report
9.
Click the Change Selection Criteria tab to set the parameters for the Security
History report.
Figure 15-10. Report Manager Action: Selection Criteria for report
a.
Click the radio button to select the report criteria:
• Change = report on all devices in the selected group(s) where the
access credentials have changed.
• Not Change = report on all devices in the selected group(s) where
the access credentials have not changed.
b.
Set the Period of time to be included in the report. The default is 90 days.
You can type in a number, or use the buttons to increase or decrease
the number of days to be included in the report.
15-11
Using Reports
Creating Report Policies
10. Click the Format tab to set the report output style you want to generate.
Figure 15-11. Report Manager Action: Report format selection
• PDF
Produce the report in .pdf format. To view this file format, you
will need Adobe Acrobat Reader, which can be downloaded free
from http://www.adobe.com/products/acrobat/readstep2.html.
• HTML Produce the report in .html format, which can be viewed with
any Web browser.
• CSV
Produce the report using comma separated values with double
quotes. This report can be viewed using WordPad, NotePad, or
imported into other spreadsheet programs, such as Excel.
11. Click the Delivery tab to configure the method used to deliver the report.
Figure 15-12. Report Manager Action: Report Delivery method
15-12
Using Reports
Creating Report Policies
E-mail is the default method. It will e-mail the report to the address
specified. It also requires that you have an SMTP profile for the e-mail
address. See “Creating SMTP Profiles” on page 2-24 for details.
Use the pull-down menu to select a different delivery method.
Selecting FTP as the delivery method lets you save the report on an FTP
site. However, proxy support is not provided.
a.
In the FTP Server field, type the IP address of the FTP site where you
want to save the report.
b.
In the Path field, type the complete path to the server location where
you want to save the report.
c.
In the Filename field, type the filename you want to assign to the report.
You can automatically add a timestamp to the filename in the Filename conventions pane.
d.
In the Username field, type the username used to access the FTP site.
e.
In the Password field, type the password used to access the FTP site.
f.
Select the Filename conventions to use:
– No timestamp in file name: Name the file exactly as entered in the
Filename field.
– Prepend timestamp to file name: Add the timestamp at the beginning
of the filename entered in the Filename field
– Append timestamp to file name: Add the timestamp at the end of the
filename entered in the Filename field.
Selecting File as the delivery method lets you save the report in a file on
the PCM server.
a.
In the Path field, type the complete path to the server location where
you want to save the report.
The path is relative to the server (not to the client). To save the report
on the client, there must be a path from the server to the client. For
example, use UNC paths, since the server runs as a service and cannot
be set up easily to use mapped drives.
b.
In the Filename field, type the filename you want to assign to the
report.
c.
Select the Filename conventions to use, as described above for FTP files.
15-13
Using Reports
Creating Report Policies
12. Click Apply to save the Action Configuration.
13. Click Close to exit the Policy Manager window.
If you click Close before you click Apply, you will be prompted to save, or
discard the configuration.
Definitions for Security Report Types
The following section provides a description of the Security report types,
along with the configurable parameters for the Security Report in both the
wizard and Policy Manager action.
Note that the Properties, Type, Format, and Delivery tab options are not listed
for each Report Action as the options are the same for all report types. Refer
to the process for “Configuring a Policy Action to Generate Reports” on the
previous pages for details of parameters included in these tabs.
■
Security History Report: Identifies devices on which the access credentials have changed. The access credentials include SNMP community
names (read and write and SNMPv3 credentials if specified), and
Telnet Manager and Operator usernames and passwords.
Set the following criteria in the Change Selection Criteria tab in the Create
Action window:
■
•
Select Change to display devices with access credentials that have
changed within the selected reporting period.
•
Select No Change to display devices with access credentials that have
NOT changed within the selected reporting period.
•
Use the Period of time up or down arrows to select the number of days
to include in the report (counting backwards from the current day).
Password Policy Compliance Report: Identifies all devices (in the
selected group) whose passwords do or do not comply with a specified set of rules governing the passwords.
Set the following criteria in the Password Policy Compliance Report tab
in the Create Action window:
15-14
•
Use the Group drop-down list to select the device group for which you
want to print a report.
•
Use the Column drop-down list to select the report column that will be
used to sort rows of data.
•
To sort report data in ascending order, select Ascending.
•
To sort report data in descending order, select Descending.
Using Reports
Creating Report Policies
Set the following criteria in the Password Policy tab in the Create Action
window:
■
•
In the Minimum Length field, type the minimum length required for
passwords (used to login to the network) to be included in the report.
For example, selecting 6 means the report will include only passwords that contain at least 6 characters.
•
In the Maximum Length field, type the maximum length required for
passwords to be included in the report.
•
To report passwords that contain a minimum number of special
characters (lowercase, uppercase, numbers, spaces, or punctuation symbols),
check the desired check box and type the minimum number to be
reported.
For example, to report all passwords that contain a space, check the
Spaces check box and type 1 next to it.
Current Credentials Report: Lists the security user names and passwords for the selected devices.
Set the following criteria in the Current Credentials Report tab in the
Create Action window:
■
•
Use the Group drop-down list to select the device group for which you
want to print a report.
•
Use the Column drop-down list to select the report column that will be
used to sort rows of data.
•
To sort credential changes in ascending order based on the column
you chose, select Ascending.
•
To sort credential changes in descending order based on the column
you chose, select Descending.
Port Access Security Report: Lists all ports in all devices in the selected
group and includes security configuration information for each port,
similar to data available in the Port Access tab.
There are no parameters specific to this report, simply select the device
groups to be included in the report, and the format and delivery method.
■
Device Access Security Report: Lists the security (authentication)
configuration for Device Access on the selected devices, similar to
data available in the Device Access tab.
Set the following criteria in the Device Access Security Report tab in the
Create Action window:
•
Use the Group drop-down list to select the device group for which you
want to create the report.
15-15
Using Reports
Creating Report Policies
15-16
•
Use the Sort by drop-down list to select the column used to sort entries
in the report.
•
Check the access types (SSH, Console, Telnet) you want to report.
•
Check the authentication types (Radius, TACACS, Local, None) you want
to report.
For example, to report only user sessions initiated from 3500 switch
consoles that used RADIUS for authentication,
Group = 3500yl,
Type of access = Console, and
Type of authentication = Radius
16
Using the PCM+ Configurable Integration
Platform
Contents
Introduction . . . . . . . . . . . . . . . . . . . . . . . . . . . . . . 16-2
Coding Conventions and Syntax . . . . . . . . . . . . . . 16-3
Supporting 3rd-Party Network Devices . . . . . . . . 16-4
Managing 3rd-Party Network Devices . . . . . . 16-7
Adding User-defined Devices . . . . . . . . . . . . . . . . 16-12
Creating a User-Defined Type . . . . . . . . . . . . 16-12
Creating a User-defined Device Definition . . 16-14
Adding User-defined Actions . . . . . . . . . . . . . . . . 16-16
Adding User-defined Triggers . . . . . . . . . . . . . . . 16-18
Creating a User-Defined Trigger . . . . . . . . . . . . . 16-18
Decoding Third-Party Traps . . . . . . . . . . . . . . . . 16-26
16-1
Using the PCM+ Configurable Integration Platform
Introduction
Introduction
You can customize your PCM+ application by using the Configurable Integration Platform (CIP) to:
■
Define additional network devices (not automatically discovered by
PCM) so that you can display and monitor the device in PCM,
■
Receive SNMP traps from the user-defined devices and display related
events in PCM+ GUI,
■
Launch the user interface for other web-based applications from the
PCM+ GUI.
■
Customize PCM+ toolbars and menus to add links to additional
management tools with a single click
The CIP uses specialized configuration or "User-Defined Object" files that are
placed on the PCM+ server. The object types supported are:
Third-Party Network devices: The (.oid) device file specifies characteristics of non-ProCurve network devices (switches) to PCM. It is required to
display the device information in the PCM display, and to link the device type
to traps from the specified devices. See “Supporting 3rd-Party Network
Devices” on page 16-4 for details.
User-defined type: The user-defined type (.udt) file works to define characteristics for an entire class or group of devices in the PCM database. The file
will be scanned each time the PCM server is started. This object type is
required for creating "non-network" User-Defined devices in PCM+. See “Creating a User-Defined Type” on page 16-12 for details.
User-defined devices: The user-defined device (.udd) file works to specify
characteristics of a non-network device to PCM, (things like printers, or DNS,
DHCP and RADIUS servers). It is required to display the device information
in the PCM display, and to the device type to traps from the specified devices.
See “Creating a User-defined Device Definition” on page 16-14 for details.
User-defined actions: The user-defined action (.uda) file works to define an
action to be performed from within PCM+. These actions can be used to
launch another application. See “Adding User-defined Actions” on page 16-16
for details.
16-2
Using the PCM+ Configurable Integration Platform
Introduction
User interface trigger: The user interface trigger (.trg) file works to specify
custom toolbar buttons and menu items in PCM+. These can be used to:
•
Launch "plug-in" applications from the Tools menu or Global toolbar,
•
Launch applications on selected devices using the tab view toolbar o
right-click menu.
Refer to “Creating a User-Defined Trigger” on page 16-18 for details.
Trap Definition File: The basic user-defined trap (.trp) file definition that
provides the information PCM+ needs to decode traps from non-ProCurve
devices. See “Decoding Third-Party Traps” on page 16-26 for details.
The CIP files are simple text files that follow a hierarchical key/subkey format
with name/value pairs (known internally to PCM as "PropertyDB" files). The
files (except the .oid files) must be placed in the <PCM>/server/config/
devconfig/extern directory.
Coding Conventions and Syntax
The file definitions described in the following sections use the following
conventions:
NOTE:
■
Items inside angle brackets (< > ) are required elements. Replace the
item, including the angle brackets, with a string of your own.
■
Values in angle brackets separated by a vertical bar, "|" means you
must choose one of the specified options. For example
"Enabled=<true | false>" means you must include either "true" or
"false". If "true" the line of code will read: Enabled=true.
■
Entries shown in square brackets ( [ ] ) are optional. If the item
contains an ellipses (…) you may repeat the item.
■
Angle brackets inside square brackets [blah = <>] indicate a required
item within an optional element.
■
Text between a slash and asterisk (/* foo blah*/) are comment text
offering further instructions on the items next to or below the
comment.
Always create or edit CIP files using a simple text editor, such as Notepad. Do
not edit these files with MS Word or another high-end word processor, because
the file format created by such applications is not usable by PCM.
16-3
Using the PCM+ Configurable Integration Platform
Supporting 3rd-Party Network Devices
Supporting 3rd-Party Network Devices
Here are the steps you should follow to add support for a non-ProCurve
network (switch) device:
1.
Create a property file describing the device. A sample file is shown and
described below these instructions.
2.
Save the device property file (with a unique name ending in .oid) in the
<installdir>\PNM\server\config\devConfig directory.
3.
If you want an image associated with the device, create a .zip file containing the images (described below) for the device. If used, you must also
copy this .zip file into the <installdir>\PNM\server\config\devConfig directory.
4.
Restart the PCM services, and then use Manual Discovery to test that the
new device type can be discovered by PCM.
The following device property file (Cis3500xl.oid) example could be used to
add support for Cisco C3500xl devices.
Cisco3500xl {
WebViewEnabled=true
model=C3500xl
class=Cisco
product=C3500xl
SYSOID=.1.3.6.1.4.1.9.1.248
vendor=Cisco
Capabilities {
isCLI=true
isSwitch=true
isCDP=true
isSFLOW=false
}
ImageInfo {
jarname=ciscoimages.zip
mapIcon=ciscoicon.jpg
image=cisco3500.jpg
}
}
16-4
Using the PCM+ Configurable Integration Platform
Supporting 3rd-Party Network Devices
Description of properties
■
WebViewEnabled: Specifies whether the device supports a web-based
view that can be presented in PCM's "Live View" tab.
The default URL that PCM uses to get the "Live View" is: http://
<device_IP_address>. Some devices have the "Live View" buried deeper in the
device's UI hierarchy. For example the "Live View" for ProCurve devices
can be found at: http://<device_IP_address>/configuration/device_viewf.html. If
your device requires a special path, you can specify that path with the
property "WebViewPath" (not shown in the file above). Set the WebViewPath to the part of the URL following the IP address. For example, the .oid
file for ProCurve devices includes the property:
WebViewPath=/configuration/device_viewf.html
If a different protocol (other than http) is needed to get the live web view,
that can be specified with a property called "WebProtocol". For example, if
the device in question only supports https, you would specify the following additional property: WebProtocol=https
■
model, vendor, and product: These properties display in the "Device
Properties" tab in PCM. Note that the Model name cannot contain
spaces, use a hyphen or underscore if needed.
■
class: This value is used to create a folder within the PCM tree by that
name. All devices with the specified class will be grouped in that
folder. In this example, all these devices will appear in a folder named
"Cisco".
■
SYSOID: You must specify the SNMP system object ID here. This can
be found using the MIB browser to query for sysObjectID.
■
Capabilities: The capabilities section of the file describes to PCM the
properties that are necessary in order to enable some functionality.
These properties are described below:
•
isCLI: Indicates if the device allows Telnet access. If set to true, PCM
will enable a right-click action to launch a telnet session to the device.
•
isSwitch: The device will not appear in the PCM device tree unless
this is set to true. Any device that routes, forwards or bridges network
traffic should have it set to true.
•
is LLDP: Indicates if the device supports the Link Layer Discovery
Protocol. If set to true, PCM will attempt to read LLDP information
from the device, which allows PCM to discover the network topology
of non-ProCurve devices much more quickly, and construct more
accurate network maps.
16-5
Using the PCM+ Configurable Integration Platform
Supporting 3rd-Party Network Devices
■
•
isCDP: Indicates if the device supports the Cisco Discovery Protocol.
Works similarly to LLDP.
•
isSFLOW: Indicates if the device supports sFlow, which is used by
Traffic Monitor.
ImageInfo: This (optional) section specifies where PCM can find
images it should display when the device is selected. The images for
the device should be in a .zip or .jar file, and the "jarname" property
must be set to the name of the .zip or .jar file containing the images.
•
There are two images which you can specify for each device, the
"mapIcon" and the "image".
The "mapIcon" specifies the name of the small image used to represent
the device on the network map (it should be a small image, no larger
than 64x64 pixels).
The "image" property specifies the name of the larger image that is
displayed on the device properties tab when the device is selected in
the PCM tree.
PCM supports only jpg and gif image formats.
The .zip file should be copied into the same directory as the .oid file, that is:
<installdir>\PNM\server\config\devConfig
If you are creating several .oid files in order to support several different
types of devices, you may put all the images in the same .zip file and
reference the same .zip file in each .oid file.
Operating Notes:
The .oid files should be used to customize the appearance and properties of
third-party “interconnect devices” (basically switches). PCM’s discovery
engine will discover any device that supports MIB 2 and SNMP. The .oid file
can then be used to customize the appearance and basic behavior of these
third-party switches.
The .oid files should not be used to add non-switch devices that wouldn’t be
discovered by the PCM discovery engine. The .udt and .udd files should be
used for adding user-defined devices that are not switches (things like DNS,
DHCP and RADIUS servers). These devices will always appear in the “Userdefined devices” folder in PCM.
16-6
Using the PCM+ Configurable Integration Platform
Supporting 3rd-Party Network Devices
Managing 3rd-Party Network Devices
You can also use the PCM CIP to allow device configurations (including
templates) to be collected (scanned) and deployed to 3rd-party network
devices. This section describes how to configure PCM and the program/script
that will allow PCM to capture and manage the device configuration of 3rdparty network devices like any other supported ProCurve device.
First, you must create a program or shell script to perform one or more of the
several operations that the PCM configuration manager uses to perform its
functions on devices, for instance, scanning a device.
When scanning a device, the PCM configuration manager will invoke the
following operations:
•
get the device's software configuration,
•
get the device's hardware configuration,
•
get the device's software (OS) version number, and
•
get the device's ROM version number.
You may choose to implement one or all of these operations. The data for
operations not implemented will simply be unavailable in PCM.
When deploying a configuration or template to a device, two additional
operations must be implemented: installing configuration in device, and wait
for device to reboot. Note that a deployment action also uses the four scan
operations (following the configuration deployment).
This custom written process in combination with the device property (.oid)
file, allows you to associate configuration management actions with a set of
non-ProCurve devices and the process/shell script that will perform those
actions.
There are two files must be provided:
■
the ".dvc" file selects which devices the user supplied executable will
act on and
■
the ".pdt" file configures the process to execute and the run string
parameters to pass to it.
These files must be placed in the <PCM_Install_Location>\server\config\devConfig\extern directory and the PCM server must be restarted in order for PCM to
associate the configuration management operations with the set of devices
indicated in the files.
16-7
Using the PCM+ Configurable Integration Platform
Supporting 3rd-Party Network Devices
When you initiate a configuration management action on a device, such as
scanning for the device's configuration data that has a user supplied ".dvc" file
associated with it, PCM schedules the user specified process and passes it
information on what data to collect. The process is expected to collect the
appropriate information (e.g. ROM version, OS version number, hardware
configuration or software configuration) and return it on standard out. If an
error occurs, the process may return any textual error message it wants logged
to PCM's event log on standard error. In addition, the process must return a
non-zero error code on exit for failure and a zero (0) return code on success.
If the user is not interested in some parts of the data collected by the
configuration manager, the ROM version number for instance, the process
may return 0 on exit (success) and simply close standard out without returning
any data.
The configuration manager ".dvc" template file appears as follows:
CfgMgr3rdPartyDevs {
// OID of the device(s) - can use wild cards.
ProductClass=1.3.6.1.4.1.11.2.3.7.11.8
AppName=ConfigManagerServerComponent
CacheTimeout=60000
Image1{
Version=1
JarName=lib/devLib/Cm3rdPartyDevs.jar
Classname=com.hp.nis.drivers.cfgmgr.3rdPartyDevs.Cm3rdPartyDevs
// File specifying how to execute the process to perform the
// configuration management actions.
PrivDataName=config/devConfig/Cm3rdPartyDevs.pdt
AlwaysReturnNewInstance=true
}
}
Operating Notes:
PCM provides a template file named "CfgMgr3rdPartyDevs.dvc" in the
<PCM_Install_Location>\server\config\devConfig\extern\templates\ directory.
When customizing it for your devices, you may name the file anything you
wish, but the file extension MUST be ".dvc". The "CfgMgr3rdPartyDevs" string at
the beginning of the file should be modified to match the name chosen for the
file. This file has two parameters you must customize.
■
16-8
The ProductClass parameter specifies the OID values of the device(s)
to which the user supplied program applies. The OID value may
contain wild cards to select multiple devices.
Using the PCM+ Configurable Integration Platform
Supporting 3rd-Party Network Devices
■
The PrivDataName parameter specifies the name of the file containing
the parameters used to execute the user supplied process that
performs the configuration management actions for the specified
devices. The file name can be named anything you wish, but should
have an extension of ".pdt". All other data in this file (.dvc) must not
be changed in any way.
The other required file is the one specified in the PrivDataName parameter of
the ".dvc" file. PCM provides a ".pdt" template file, Cm3rdPartyDevs.pdt, in the
<PCM_Install_Location>\server\config\devConfig\extern\templates directory.
The template file appears as follows:
Cm3rdPartyDevs {
Version=1.0
// The full file path to the shell script or process to execute that will
// perform the required configuration management actions.
TargetProcess=
// Maximum time to allow the target process to complete tasks, in seconds.
// The default value is 5 minutes. If the process does not return within
// this time period, PCM will terminate it and display a timeout failure.
MaximumTime=300
// If the target process is a shell script, then this must contain the
// full file path to the process used to execute the shell script file.
ShellInterpreter=
// The parameters to pass to the process or shell script being executed.
// The first parameter is the operation being requested by the PCM
//configuration management module. It will be one of the following values:
//
// 1 = Capture device software configuration data.
// 2 = Capture device hardware configuration data.
// 3 = Capture the device's OS (software) version number.
// 4 = Capture the device's ROM version number.
// 5 = Deploy configuration to device.
// 6 = Wait for the device to reboot (if device requires a reboot after
//
a configuration deployment).
//
// All text data in the RunString parameter immediately follows the
// operation parameter exactly as entered with the exception of any
// tokens that have the appropriate value substituted for the token.
// The following tokens are supported:
//
// %optype- Will substitute the configuration manager operation type.
// %ip
- Will substitute the IP address of the target device.
// %oid - Will substitute the OID value for the target device.
// %wc
- Will substitute the write community name of the target device.
// %rc
- Will substitute the read community name of the target device.
16-9
Using the PCM+ Configurable Integration Platform
Supporting 3rd-Party Network Devices
// %mgmtuser- Will substitute the telnet management user name.
// %mgmtpw- Will substitute the telnet management user password.
// %opuser- Will substitute the telnet operator user name.
// %oppw- Will substitute the telnet operator user password.
//
//An example runstring might be "RunString=-s %optype,%ip,%wc,%mgtpw".If
//the user then issued a PCM configuration management device scan for a
//device with IP address 192.168.0.5 and a write community name of "private"
//with a telnet management password of "myCLIpw", the user process would
//be passed the following runstring by PCM to capture the device's software
//configuration data:
//
// "-s 1,192.168.0.5,private,myCLIpw"
//
RunString=
}
This file has four parameters that must be customized by the user.
16-10
■
The TargetProcess parameter must contain the full file path name of
the process or shell script used to perform the configuration manager
operations requested by PCM. PCM will schedule this process when
it needs information about a device targeted by the associated ".dvc"
file. The process is expected to exit with a return code of 0 on success.
If the process supports the requested operation, it must return the
data on standard out.
■
The MaximumTime parameter specifies the maximum time, in seconds,
that PCM will allow for the user process or shell to carry out the
requested configuration manager operations. The default is 300
seconds (5 minutes). If the process does not return an exit value to
PCM within this time period, PCM terminates the process and logs a
time-out failure.
■
The ShellInterpreter parameter is optional. It must only be customized
when the TargetProcess parameter specifies a shell script to execute.
It will be specific to the type of shell script (e.g. korn shell, C-shell,
Windows XP shell, etc.). Enter the full path of the shell interpreter to
use for the specified shell script.
NOTE: PCM always reads the shell script and passes it the shell
interpreter on std in.
■
The final parameter is the RunString to pass to the target process. The
runstring contents may contain PCM tokens that will be replaced with
values when the run string is passed to the process. For example, the
%ip token is replaced by the target device's IP address. If the
"%optype" token is not supplied, the first character of the run string
Using the PCM+ Configurable Integration Platform
Supporting 3rd-Party Network Devices
will contain a numeric value indicating the configuration management operation that is being requested. (See the comments in the .pdt
template file for the operation types.)
The process is not required to support all of the possible operation types.
The process may immediately close standard out and return an exit code
of 0 for unsupported operation types. Alternatively, if you would like PCM
to notify the user that this operation is not supported, an appropriate error
message should be returned on standard error and the process exits with
a non-zero return code.
When you have finished editing these files, they must be placed in the
<PCM_Install_Location>\server\config\devConfig\extern directory. The PCM
server must be restarted after installing the files.
16-11
Using the PCM+ Configurable Integration Platform
Adding User-defined Devices
Adding User-defined Devices
To support discovery and monitoring of connection status for devices not
natively supported in PCM, you need to provide:
•
An entity or type definition (.udt file) that provides general information about the device or model type
•
A device definition (.udd file) the provides specific details for a given
device. There can be multiple device definition files for a single entity
definition.
•
Display images associated that will be associated with the entity type,
in .gif or .jpg format. All images for a device type must be placed in a
.jar or .zip file in the "extern" directory.
The .udt and .udd files are intended for adding user-defined devices that are
not switches (things like printers, or DNS, DHCP and RADIUS servers). This
will allow you to display the device information in the PCM display, and to
receive traps from the specified devices and display them as events in PCM+
event browser. These devices will always appear in the “User-defined devices”
folder in PCM.
Creating a User-Defined Type
You need to create a user-defined type file to provide PCM+ with a definition
for the device type you want to support in PCM+. This file provides the general
characteristics associated with an entire group of devices. It is similar to the
entity files used in PCM to define the Device Groups in the navigation tree.
Each user-defined entity file must have a file extension of .udt. The basic file
definition is shown below:
<typename> {
product=<model number>
model=<model name>
class=<family name>
SYSOID=<sys object id>
vendor=<vendor name>
ImageInfo {
jarname=<jar name> //or zip name
image=<large image name>
mapIcon=<map icon>
}
}
16-12
Using the PCM+ Configurable Integration Platform
Adding User-defined Devices
Notes:
<typename> must be a unique string identifying the type of device. We
suggest a naming convention that will minimize the likelihood of collisions with other user-defined entity types.
SYSOID need not be a real sys object ID, but it must be a string that
uniquely identifies this type of device. This ID will be referenced in the
device definition (.udd) file.
ImageInfo defines the images associated with the entity type in the PCM
display.
•
image (large image) is the device image that will be displayed in the
lower portion of the Device Properties tab in PCM.
•
mapIcon is the image that will be displayed for devices of this type
in the PCM network maps.
If images are not supplied, a default map icon will be provided on the
network map (if mapped), however there will be no device image in the
properties tab view.
An example of the User-defined entity follows. The filename is MySwitch.udt
RADIUS-Server {
product=rxServer
model=rx6600
class=Server
SYSOID=RADIUS-1
vendor=HP
ImageInfo {
jarname=baseImages.jar
image=R-Server.jpg
mapIcon=RADIUS-1.gif
}
}
16-13
Using the PCM+ Configurable Integration Platform
Adding User-defined Devices
Creating a User-defined Device Definition
Once you have defined the type of device(s) you want to add to PCM, you need
to provide a definition for the individual device that you want to add to PCM.
This is where the characteristics of the specific device are defined. When the
file is first scanned, a "user Defined Device" model object is created and stored
in the PCM database. Properties of the device are obtained from this file.
Each user-defined device file must have an extension of .udd. The basic file
definition is shown below:
<deviceUniqueID> {
//SYSOID is same as in the entity definition(.udt)file
SYSOID=<sys object id or other device type identifier>
IP=<ip address>
Asset=<asset tag>
Location=<location tag>
Contact=<contact or owner>
SerialNo=<serial number>
SysDesc=<sysdescriptor>
SysName=<sysname>
Mac=<MAC address>
AllowTraps=<true|false>
SNMP {
Read=<SNMP read community name>
}
<OptionalProperty>=<property value>
}
Notes:
OptionalProperty is a string for any other device information you
want to display in the device Properties tab in PCM+. You may include as
many optional properties as you like. These will be displayed in the
properties tab view in the order given in the .udd file.
16-14
Using the PCM+ Configurable Integration Platform
Adding User-defined Devices
User-Defined Device Example
An example of the User-defined device follows. This would work in conjunction with the .udt file example given on page 12-5.
RADIUS-01 {
IP=180.44.184.32
Asset=A121
DBID=14595707
Model=3550
Contact=Ben
Manufacturer=HP
Location=NTC Lab
AllowTraps=true
SerialNo=J437208
SysDesc=rxServer
SYSOID=RADIUS-1
SNMP {
Read=public
}
}
Discovering User Defined Devices
If you have added user-defined devices, use the Preferences:Global:Discovery
window [Preferences->Discovery] and click the Rescan for user defined devices!
button.
This launches a scan of the <PCM>/server/config/devconfig/extern
directory for the files for user defined devices. If any new file is found, the
related device is created in PCM, and the device will show up in the userdefined devices folder in the navigation tree.
16-15
Using the PCM+ Configurable Integration Platform
Adding User-defined Actions
Adding User-defined Actions
To launch other applications from within PCM, or to create a custom Policy
in PCM+, create an action (.uda) file and place it in the "extern" directory.
Actions can be used to:
•
Run the specified command or custom script on the target.
•
Launch a WEB browser and go to the specified URL, or open the WEB
agent for the selected device(s) on the PCM Client.
•
Run the specified policy from the PCM server.
User-defined actions linked to a user-defined trigger allow you to create
custom toolbar and menu actions in PCM+. The policy option can also be used
along with alerts to automatically run the policy when the event that causes
the alert occurs.
The basic .uda (action) file definition is shown below:
<actionID> {
Name=<name>
Type=<CLI | WEB | POLICY>
Command=<commandline | url | policyname>
Target=<Server | Client>
}
Notes:
For Type=CLI, enter the full pathname of the .exe file you want to run.
For Type=WEB, the ExecTarget must be Client. Do not use the Server as
the target.
For Type=Policy, enter the name of the Policy. The Policy must be defined
in PCM+ before this option will work. Refer to “Configuring Policies” on
page 13-5 for more information. The Target must be Server when using
the Policy action type. Do not use Client as the target.
The <commandline> and <url> values may contain the following tokens
which will be substituted for the appropriate values when the action is run:
16-16
•
%ip
This will be substituted with an IP address of the device the action
was triggered from.
•
%ipl
This will be substituted with a list of IP addresses representing the
set of devices the action was triggered from (via multiple selection).
Using the PCM+ Configurable Integration Platform
Adding User-defined Actions
•
%gn
This will be substituted with the name of the group the action was
triggered from.
•
%oid
This will be substituted with the OID of the device the action was
triggered from.
A User-defined trigger for the action must be created to use any of these
options. This allows you to select a device, devices, or group in PCM+,
and then use the trigger to run the action.
User-Defined Action Examples
The following .uda file example, for Type=WEB, would launch a browser to
Google from the PCM+ Client.
Google {
Name=Launch Google
Type=WEB
Command=www.google.com
Target=Client
}
The following .uda file example, for Type=POLICY, will run "MyPolicy" on the
PCM+ server when triggered.
Policy01 {
Name=MyPolicy
Type=POLICY
Command=MyPolicy
Target=Server
}
For the example above, you must also create a Policy (MyPolicy) in PCM.
Refer to 13, “Using Policy Manager Features” for details on creating policies.
The following .uda file example, for Type=CLI, will run the mibrowser.exe
script to launch a MIB Browser window on the PCM+ Client (PC).
MibBrowser {
Name=MIB Browser
Type=CLI
Command=C:\Program Files\HP\ProCurve MIB Browser\
bin\mibrowser.exe %ip
Target=Client
}
Note the %ip at the end of the command line. When the command is activated,
the IP address for the currently selected device will be substituted here.
16-17
Using the PCM+ Configurable Integration Platform
Adding User-defined Triggers
Adding User-defined Triggers
To launch user-defined actions or to customize the PCM+ menus and toolbars,
you need to create a User-defined trigger file. A "trigger" is simply a menu item
or toolbar button that launches an action. The user-defined trigger (.trg) file
specifies:
•
whether the trigger item will appear in the PCM+ global toolbar or
Tools menu, or in the device (tab) specific toolbars and right-click
menu,
•
the Action it will deploy, and
•
the Permissions required to use the trigger.
Creating a User-Defined Trigger
There are three types of triggers possible in the PCM+ display, specified by
the Scope= parameter in your ".trg" file:
Global - Triggers that appear in the global Tools menu in PCM+, or on the
global toolbar.
Context - Triggers that appear in contextual (device specific or tab views)
toolbars or in the right-click menu.
The trigger definition will vary based on the Scope. The parameters you need
to specify are governed by the level and type of trigger. The Notes following
the file format describe the rules and parameters for the various trigger
definitions.
Each user-defined trigger file must have an extension of .trg. The .trg file must
be stored in the "extern" directory on the PCM+ server. The basic user-defined
trigger (.trg) file definition is shown below:
<uitriggerID> {
Scope=<Global | Context>
Type=<MENU | RIGHTCLICK | TOOLBAR>
Name=<name>
ImageInfo {
jarname=<jar name> //or zip name
Icon=<image name>
Global { //Define If Scope==GLOBAL
MenuPath=<menupath>
ToolGroup=<groupname>
}
Context {//Define If Scope==Context
16-18
Using the PCM+ Configurable Integration Platform
Adding User-defined Triggers
Device {// Trigger used for individual device tabs or nav
objects)
Type=<OID|IP>
Value=<sysoid|ip>
}
GroupTab {
Selection=<n>
//0=Always on, 1..9=Exact selection count,
1000=Allow arbitrary multiple selection
GroupName=<name>
}
}
ActionID=<actionID>
Permission=<PER_ADMIN_x |PER_OPERATOR_x |PER_VIEWER_x>
}
Operating Notes:
For all triggers you must specify the following parameters:
Type=MENU|RIGHTCLICK|TOOLBAR
•
If Scope=Global, use the MENU option to add an entry in the PCM+
global Tools menu. Use the TOOLBAR option to create a Global toolbar
button. The RIGHTCLICK option is not valid for the Global scope.
•
If Scope=Context, use the RIGHTCLICK option to add an entry in the
PCM+ right-click menu. Use the TOOLBAR option to create a toolbar
button in the tab views. The MENU option is not valid for the Context
scope.
Name=<name>
Enter a string for the name that will appear in the Menu (either Tools or
right-click), or on the default Toolbar icon if no icon image is supplied.
jarname=<file.jar|file.zip>
icon=<imagename>
For Type=TOOLBAR triggers you can provide an .jpg or .gif image for the
toolbar icon. The image file must be placed in a .jar or .zip file, and you
must supply the filename (.zip or .jar) and the icon image name must be
specified. If an image is not supplied, a default image will be used.
Tooltip=<tooltip text>
This is an optional parameter. Use it to provide explanatory text that will
be displayed when the user hovers over the toolbar icon.
ActionID=<actionID>
This parameter specifies the action the trigger will deploy. Use the same
actionID as specified in the .uda file.
16-19
Using the PCM+ Configurable Integration Platform
Adding User-defined Triggers
Permissions=<PER_ADMIN|PER_OPERATOR|PER_VIEWER>
This parameter specifies the permissions required to use the trigger. The
parameter must be one of the following:
•
PER_ADMIN_1 or PER_ADMIN_2
use one of these options to make the trigger available to users with
an Administrator profile.
•
PER_OPERATOR_1 or PER_OPERATOR_2
use one of these options to make the trigger available to users with
Operator or Administrator profiles.
•
PER_VIEWER_1 or PER_VIEWER_2
use one of these options to make the trigger available to users with
Viewer, Operator, or Administrator profiles.
If you set the Scope=Global, then you must define the Global parameters,
and the Action and Permission parameters. Do not use the parameters in the
Context section of the file.
SubMenu=<subname>
This parameter is optional. Use it if you want a Global-Menu trigger to
appear in a sub-menu, off of the global Tools menu.
For example, if you set Name=Custom, and SubMenu=myAction1 the
Tools menu will show Custom, and a submenu item of MyAction1. You
could then create a second Global-Menu trigger, with Name=Custom and
SubMenu=MyAction2.
ToolGroup=<groupname>
This parameter is optional. Use it if you are creating multiple toolbar
triggers and want to group them together. The default placement of userdefined triggers is to the right of the existing global toolbar buttons.
If you set the Scope=Context, then you must define the Context parameters.
Do not use the parameters in the Global section of the file.
When you set Scope=Context and Type=TOOLBAR, you must specify
either:
Device parameters–used for triggers added to the Interconnect Device
view tabs, or
GroupTab parameters–used for triggers added to the Device Group view
tabs.
When you set Scope=Context and Type=RIGHTCLICK, you must specify
the Device parameters. The GroupTab parameters will not work with rightclick menu triggers.
For Device parameters, specify the Type and Value, where:
16-20
Using the PCM+ Configurable Integration Platform
Adding User-defined Triggers
Type=<OID|IP>
Value=<sysoid|ip>
Use OID to define a trigger that works with devices of that type. When
you set the Type=OID, then you must supply the System OID (sysoid) in
the Value parameter. For example, Value=1.3.6.4.11.2.37.11.35
To create a trigger for User-defined devices, use the Sysoid you specified
in the .udt file.
Use IP to define a trigger that works for a specific device. When you set
the Type=IP, then you must supply the device IP address in the Value
parameter. For example, Value= 16.29.12.110
For GroupTab parameters, specify the Selection and GroupName, where:
Selection=<n> configures when the trigger is activated, it can be one
of the following
•
Selection=0 will configure the trigger as on at all times.
•
Selection=<1...9> will configure the trigger to be active only
when the specified number of devices are selected in the device list
of the group tab. Only one digit can be specified, this is not given as
a range, i.e., Selection=1, or Selection=2, etc.
•
Selection=1000 will configure the trigger to be activated when any
number of devices are selected in the device list of the group tab.
GroupName=<name> where the name is the same as the device group
labels found in the PCM + navigation tree, e.g., GroupName=2800
For Webtab parameters, specify the TabName and NodeName
User-Defined Trigger Examples
The following example creates an entry (Notepad) in the Tools menu, with a
sub-menu trigger (Dans Custom) that launches the "MibBrowser" action.
GlobalMenu01 {
Scope=Global
Type=MENU
Name=Notepad
Global {
SubMenu=Dans Custom
ToolGroup=UserTools
}
ActionID=MibBrowser
Permission=PER_OPERATOR_1
}
16-21
Using the PCM+ Configurable Integration Platform
Adding User-defined Triggers
The following .trg file creates a Global toolbar icon to launch the MibBrowser.
GlobalNp01 {
Scope=Global
Type=TOOLBAR
Name=Notepad
Global {
ToolGroup=UserTools
}
Tooltip=Launch MIB Browser
Icon=trigger.gif
Jarname=triggers.jar
ActionID=MibBrowser
Permission=PER_ADMIN_1
}
The following two examples create triggers to launch the WEB Agent for a
device, in the right-click menu and device Toolbar, respectively.
//rightclick webagent trigger
RgtNp02 {
Scope=Context
Type=RIGHTCLICK
Name=Custom WebAgent
Context {
Device {
DevType=IP
Value=15.255.120.253
}
}
ActionID=Web02
Permission=PER_OPERATOR_1
Tooltip=Operator
Icon=trigger.gif
Jarname=triggers.jar
}
-------------------------//device toolbar webagent trigger
TbNp04 {
Scope=Context
Type=TOOLBAR
Name=Custom WebAgent
Context {
Device {
DevType=OID
Value=.1.3.6.1.4.1.11.2.3.7.11.34
}
}
16-22
Using the PCM+ Configurable Integration Platform
Adding User-defined Triggers
ActionID=Web02
Permission=PER_OPERATOR_1
Tooltip=Operator
Icon=trigger.gif
Jarname=triggers.jar
}
Using CIP to Plug-in Other WEB-based Applications to PCM+
You can plug in the user interface for other web-based applications into the
PCM+ user interface to give you a single integrated pane of management.
Simply create a trigger file with the Scope set the "WebTab" whose contents will
be the application of your choice (as long as that user interface is a web-based
user interface supported by Internet Explorer).
Creating the interface for other web-based applications is done in three steps,
as described in the details and examples given below:
1.
Create a property file (.trg) that specifies the attributes of the application.
The format of the file is shown in the example below:
AirWaveTab {
Scope=WebTab
TabName=AirWave
NodeName=Network Management Home
URL=https://10.3.4.147
}
Operating Notes:
•
The file can be named anything you want, but it must have the
".trg" extension. For the above example it might be airwave.trg.
•
The Scope property must be set to "WebTab". That specifies that
a custom tab should be created for the new application.
•
The TabName property can be set to any value you like. Whatever
you put there will appear as the name of the tab in PCM. In this
case we chose to call it "AirWave".
•
The NodeName property specifies the name of the node in the
PCM+ navigation tree that will be associated with the tab. In the
example above, you will see that the "Network Management Home"
node in the tree is specified. The tab created for the AirWave
application will only appear when that node is selected. You may
16-23
Using the PCM+ Configurable Integration Platform
Adding User-defined Triggers
specify the name of any node in the PCM+ tree, including the
names of Custom Groups, which can be quite useful for plugging
in applications for specific groups of devices.
•
Finally, the URL property must specify a web address/path to the
server of the application. In this case the URL needed to launch
the AirWave Management Platform is
https://10.3.4.147.
2.
Save the text property (.trg) file on the PCM+ server, in the
<installdirectory>\PNM\server\config\devconfig\extern directory
3.
Restart your PCM+ client (no need to restart the server).
Be sure to create and save the file with a text editor such as Notepad. Do not
create the file with MS Word or another high-end word processor.
If the tab doesn't appear check the syntax of the file carefully to ensure it
matches the format shown in the example, and check that it was copied into
the correct location on the PCM+ server.
For example, to call the ProCurve Web site directly into PCM as a tab
associated with the root node of the tree, you would create the following “.trg”
file in the <installdir>\PNM\server\config\devconfig directory:
ProCurveTab {
Scope=WebTab
TabName=ProCurve
NodeName=Network Management Home
URL=http://www.procurve.com
}
The following figure is an example of a Webtab for ProCurve Web site added
to PCM:
16-24
Using the PCM+ Configurable Integration Platform
Adding User-defined Triggers
Custom “Webtab” added to PCM
Figure 16-1. ProCurve Website tab added to PCM "Home" window.
16-25
Using the PCM+ Configurable Integration Platform
Decoding Third-Party Traps
Decoding Third-Party Traps
The CIP feature in PCM+ also allows you to specify information on how to
decode and display SNMP traps for non-ProCurve devices not otherwise
supported by PCM. Once you have defined a trap, the PCM Event Manager
server will process it in the same manner as traps sent from ProCurve managed
devices.
In order to receive traps and log events to the PCM Event Browser for "Userdefined" or non-ProCurve network devices, you create a trap configuration
file (.trp) file that defines the attributes needed by PCM to decode the trap.
The .trp file must be placed in the <PCM>/server/config/devconfig/
extern directory.
The .trp property file should contain the following attributes:
■
16-26
•
Root node of the trap. This is the OID of the trap, with the "." delimiter
replaced by the "_" delimiter. For example, a trap OID of 1.3.4.1.6.11
is defined in the .trp file as 1_3_4_1_6_11. Trap OIDs can be found in
the device MIB.
•
SEVERITY - The severity of the event. Possible values are:
– Informational
– Warning
– Minor
– Major
– Critical
•
FRIENDLY_NAME - This is a descriptive name (string) used to identify
the event in the PCM Event Browser.
•
BASE_TEXT - This is the text that will be visible to the user from the
Event Browser. This text can have place holders in it such as
%VARIABLE_NAME_1, %VARIABLE_NAME_2, etc.
If the BASE_TEXT key entry is not included in the definition file, a
"toString" will be done on the trap PDU (Protocol Data Unit, or
packet).
There are "well known" variable names that PCM uses to extract data
from traps after they have been processed and stored in the database.
See below for more information on "well known" variable names.
VARIABLE_NAME_X - where X is the variable number, so for example
if you have 3 variables they would be named VARIABLE_NAME_1,
VARIABLE_NAME_2, VARIABLE_NAME_3. The VARIABLE_NAME key can
specify where to find the value in two ways…
Using the PCM+ Configurable Integration Platform
Decoding Third-Party Traps
■
•
The first is just by simply defining the INDEX tag. The INDEX tag
defines the index into the array of values encoded in the SNMP trap.
•
The second is by defining the INDEX tag and also defining the
TABLE_NAME tag. The TABLE_NAME tag should be used when the
value at the specified index needs to be translated to another value.
PCM will retrieve the value at the specified index of the SNMP trap,
and use it to find a matching property in the specified table. If such a
matching property is found, then the value associated with that
property is returned and substituted in the proper place in the
BASE_TEXT string.
XXX_TABLE - This is a list of name/value pairs used to translate values
located at an index of the SNMP trap to another value.
The basic user-defined trap (.trp) file definition is shown below.
1_3_1_4_6_1_11 {
SEVERITY=<Critical|Major|Minor|Warning|Informational>
FRIENDLY_NAME=<name>
BASE_TEXT=<event string> //may include VARIABLES
VARIABLES{ //optional, defines variables in base_text.
Variable_name {
INDEX=0
}
Variable_name {
INDEX=1
}
Variable_name {
INDEX=2
TABLE_NAME=<table_name>
}
)
TABLES { //optional, defines tables for variable index.
table_name {
1=value_a //a string for the translation value.
2=value_b
3=value_c
}
}
)
16-27
Using the PCM+ Configurable Integration Platform
Decoding Third-Party Traps
Well Known Variables
PCM uses several "well known" or common variables to extract information
from traps. It is not mandatory to define these names for processing thirdparty traps, but it is strongly recommended that you do to avoid problems and
simplify troubleshooting if needed. These well known variable names include:
■
END_NODE_IP_LIST – A list of one of more IP addresses that belong
to one or more end-nodes. End-nodes are defined as a Server, client
machine, printer, etc.
■
END_NODE_MAC_LIST – A list of one of more MAC addresses that
belong to one or more end-nodes. End-nodes are defined as a Server,
client machine, printer, etc.
■
PORT_LIST – A list of one or more ports
■
DEVICE_IP_LIST
■
DEVICE_MAC_LIST
■
RISING_TRESHOLD – The rising threshold that was exceeded
■
FALLING_THRESHOLD – The falling threshold that was violated
■
THRESHOLD_DELTA – The delta between the threshold and the
value that was violated
Trap Decoder Examples
The following .trp file example is for a simple trap file with no variables.
1_3_1_4_6_1_11{
SEVERITY=Informational
FRIENDLY_NAME=IDS initialization trap
BASE_TEXT=IDS started and running
}
Below is an example .trp file that can be used to decode an Airwave Management Platform event indicating that an AP has gone down.
1_3_6_1_4_1_12028_4_15_13 {
SEVERITY=Major
FRIENDLY_NAME=AP Down
BASE_TEXT=AP Down: IP=%DEVICE_IP_LIST
VARIABLES {
DEVICE_IP_LIST {
INDEX=3
}
DESC {
INDEX=2
}
}
}
16-28
: Description=%DESC
Using the PCM+ Configurable Integration Platform
Decoding Third-Party Traps
The following .trp file example is for a trap file with defined variables and
tables.
1_3_1_4_6_1_13{
SEVERITY=Critical
FRIENDLY_NAME=Rogue AP detected
BASE_TEXT= Rogue AP %IP_ADDRESS detected on radio %RADIO_NUM.
Detected by %DETECTION_METHOD
VARIABLES{
IP_ADDRESS {
INDEX=0
}
RADIO_NUM {
INDEX=1
}
DETECTION_METHOD {
INDEX=2
TABLE_NAME=DETECTION_TABLE
}
}
TABLES {
DETECTION_TABLE {
1=Scanning
2=Association
3=Attempted Authentication
DEFAULT=unknown
}
}
}
Notes:
If names in the TABLE keys contain a "." they will substituted with a "_". So if
the value in a PDU is an OID, all "." delimiters will be replaced with a "_".
All Names you specify in the .trp file must consist of an alpha-numeric string.
Special characters (except for the underscore "_" ) are not allowed.
16-29
Using the PCM+ Configurable Integration Platform
Troubleshooting CIP
Troubleshooting CIP
If you are not getting the expected results, here are some things to check.
■
Are you running the latest version of PCM? Some of the CIP features
described here are not enabled unless you have the latest release of
PCM with all the auto-update patches applied. At a minimum you
should have PCM+ 2.2 installed.
■
Did you save the property file with a plain text editor rather than a
word processor? Try opening the property files you created with
Notepad to verify that the file is readable.
■
Double check the syntax of the property files. Are all opening braces
( "{" ) matched by a closing brace?
•
■
Check the Events tab in PCM. If PCM encounters a CIP property file
with bad syntax, it will create an event indicating the file that caused
the problem. The severity level of the error will be "Warning". The
source of the event will be: CoreServer (Config.Integration),
and the detail message will read:
Syntax error parsing user-defined Trigger file (<filename>).
Is the file stored in the correct directory?
•
Most CIP files should be copied to
<installdir>\PNM\server\config\devConfig\extern.
The default install directory is: C:\Program Files\Hewlett-Packard.
•
The .oid files needed to add support for non-ProCurve devices are the
exception to the above rule. These files should be copied to
<installdir>\PNM\server\config\devConfig.
The image .zip files containing the images and icons for the nonProCurve devices must also be in the same directory as the .oid files.
■
Did you restart the PCM client? Note that for adding support to decode
new SNMP traps (events), the PCM server must be restarted as well.
■
Is the name of the main property unique? In the property files, note
that they all start with a name followed by a curly brace, for example:
MibLaunchTrigger {
...
}
In this case, the "MibLaunchTrigger" must be a unique name. If some other
property file also uses the name "MibLaunchTrigger" as the main property,
then only one of them will be acknowledged and used.
16-30
A
Using ProCurve Manager for OV-NNM
Contents
Overview . . . . . . . . . . . . . . . . . . . . . . . . . . . A-2
Starting PCMplus for OV-NNM . . . . . . . . A-3
Database User Management . . . . . . . . . . . A-5
Working with PCM for OV-NNM. . . . . . . . A-8
PCM-NNM Synchronization . . . . . . . . . . . A-11
A-1
Using ProCurve Manager for OV-NNM
Overview
Overview
ProCurve Network Manager for HP OpenView Network Node Manager integrates PCM+ with OV-NNM (ver. 6.4, 6.41, 7.01, or 7.50) on Windows XP, 2000,
and 2003 to provide a robust solution for managing ProCurve network products in a multi-vendor network environment. PCM for OV-NNM provides
ProCurve device management, schedulable software updates, group management, and traffic monitoring.
When using the PCM application with OV-NNM you start PCM from the NNM
display. PCM will read the NNM database to get ProCurve device data (IP
Address and SNMP Community name), then use it to build the device list and
nodes within the navigation tree. PCM will then run device scans to determine
device configuration, VLAN, and network topology. You can access all other
PCMplus device configuration and management features from the PCM display launched by NNM.
The most obvious difference in using PCM with OV-NNM, is that the PCM
events browser is not available. When using PCM with OV-NNM, NNM is
registered as a trap receiver for ProCurve Manager on each device, and PCM
application events are displayed in the NNM events browser.
Additional References
This document provides information on managing ProCurve devices using the
ProCurve Manager. For more information related to using HP OpenView, refer
to "Managing Your Network with HP OpenView Network Node Manager." The
HP OpenView manuals are available on the HP web at:
http://support.openview.hp.com.
A-2
Using ProCurve Manager for OV-NNM
Starting PCMplus for OV-NNM
Starting PCMplus for OV-NNM
When you install the PCMplus for OV-NNM module, the PCMplus client and
server software are installed on the same system by default. You can then
install a copy of the PCMplus client on another system running the NNM
Remote Console application.
The following directories and files will be created at install:
■
PCMplus Server (Program Files\Hewlett-Packard\PCM-NNM\server),
contains all classes needed for Server side.
■
PCMplus NNM (DIR:\Program Files\Hewlett-Packard\PCMNNM\nnm), contains configuration files.
■
PCMplus Client (Program Files\Hewlett-Packard\PCM-NNM\client),
contains all classes, images, and configuration files needed for the
PCM client application.
■
Java Runtime Environment (Program Files\Hewlett-Packard\PCMNNM\jre)
After you have installed the PCM-NNM application, the PCM server and client
will be started automatically when you start OV-NNM. Use one of the following
methods to launch the PCM Client display from the OV-NNM window:
1.
Open the Tools menu and select the ProCurve Manager option, or
2.
Click the ProCurve icon in the toolbar.
This will launch the PCM client "dashboard" display in a separate window.
A-3
Using ProCurve Manager for OV-NNM
Starting PCMplus for OV-NNM
Figure 1-1. PCM-NNM dashboard display
Please refer to “ProCurve Manager Home” on page 2-9 for more information on using the dashboard display.
3.
A third option for launching PCM is to right-click on an ProCurve switch
in the NNM map, then select the ProCurve Manager option.
This will launch the PCM dashboard, then the PCM Device Properties
window with information for the device that was targeted on the NNM
map. For more information on the Device Properties window, refer to
“Viewing Device Information” on page 2-15.
A-4
Using ProCurve Manager for OV-NNM
Starting PCMplus for OV-NNM
Database User Management
The PCM database stores the network and device information retrieved by the
PCM "Discovery" function. This PCM database can be accessed directly
through supported protocols. (JDBC, ODBC, solsql, etc.).
When using PCM in standalone mode, the User Management feature allows
you to configure access to external applications. In the PCM-NNM application
this feature is unavailable. To provide read-only access to the PCM model
database in PCM-NNM, use the User Management feature.
Adding Database User Accounts
To create a "database" user account in PCM-NNM:
1.
Click the Account Manager icon in the PCM global toolbar.
The Manage User window is displayed,
2.
Click Add... to display the Add User window.
A-5
Using ProCurve Manager for OV-NNM
Starting PCMplus for OV-NNM
3.
Enter the Username and Password, and then retype the password in the
Confirm Password field.
The Username and password is the name and password that will be used
when making an ODBC connection to the PCM database. Spaces and
punctuation characters are not allowed in the username or password
Passwords must contain a minimum of three characters.
4.
Select the user Profile from the pull down menu.
5.
Click the Grant external DB access checkbox.
6.
Click Ok. This will save the new user setup and close the Wizard.
The system will validate the username and password fields. If the password entries do not match, or the username or password do not meet
requirements, an error message will be displayed and you will be
prompted to correct the problem.
A-6
Using ProCurve Manager for OV-NNM
Starting PCMplus for OV-NNM
Editing and Deleting Database User Accounts
To edit a PCM Database user account,
1.
Select the account in the Manage Users window to enable the Edit and
Delete option.
2.
Select the Edit option to open the Edit Users window. It contains the same
parameters as defined in the Add Users window.
3.
Edit the user account parameters as desired, then click Ok.
To delete a user account,
1.
Select the account in the Manage Users window to enable the Edit and
Delete options.
2.
Click Delete.
A confirmation pop-up will be displayed indicating the edit or deletion was
successful.
A-7
Using ProCurve Manager for OV-NNM
Working with PCM for OV-NNM
Working with PCM for OV-NNM
PCM for OV-NNM provides the network device management, configuration,
and traffic monitoring functions of the PCM+ application for ProCurve devices
on your network. The following section details differences in operation when
using PCM for OV-NNM, with references to additional information provided
in earlier chapters of this book.
Device Discovery
The integration of PCM into the OV-NNM application results in the following
changes in the Device Discovery in PCM. For additional details on using the
PCM Discovery feature, refer to Chapter 3, “Discovering Devices”.
A-8
■
Because NNM has ARP and Ping "discovery" the ARP and Ping Sweep
features of PCM discovery are not used. Periodically PCM will read
the data collected in the NNM database.
■
Because PCM only gets information on ProCurve devices from NNM,
the end-nodes and unknown devices will not appear in the PCM
displays (navigation, devices list, maps). You can get information on
unknown or end-node devices in the NNM displays.
■
You can use the Manual Discovery Wizard in PCM to discover new
network devices. If a device is not found in NNM (or PCM), you will
need to troubleshoot in the NNM discovery process. (Refer to Chapter
5 of Managing Your Network with HP OpenView Network Node
Manager for details).
■
Because PCM does not get information on "unknown" devices from
NNM, the "Device Reclassification Wizard" will not work.
■
Because the initial device data must come from NNM, you will not be
able to change the "Starting Device" for PCM Discovery.
■
You can change the Topology Discovery Settings and VLAN Discovery
settings in the Global Discovery Settings. Because NNM is already
performing ARP and Ping Sweep discovery, the intervals for these
functions are set in NNM.
■
You can stop and start the PCM Discovery processes at any time, and
it will not affect NNM discovery.
Using ProCurve Manager for OV-NNM
Working with PCM for OV-NNM
NOTE:
The default configuration for the IP Discovery interval in NNM is 4 hours.
Change (reduce) this interval to improve the PCM discovery performance.
For information on NNM Discovery, refer to Chapter 5 in Managing Your
Network with HP OpenView Network Node Manager.
Network Maps
The integration of PCM into the OV-NNM application has little affect on the
PCM Network Maps feature. The only real difference is related to the fact that
PCM does not get any data on end-nodes or unknown devices, thus all devices
that appear in the maps will be properly identified.
Please refer to Chapter 4, “Using Network Maps” for more information on
using the PCM Map feature. For information on using NNM maps, refer to
Chapters 7 through 9 in Managing Your Network with HP OpenView Network
Node Manager.
Network Events and Alerts
The integration of PCM into the OV-NNM application results in the centralization of all network device and PCM application event processing within the
NNM Events database. As noted in the discussion of PCM Discovery, the NNM
server is registered as a trap receiver for all discovered ProCurve devices, and
all device and application events are sent to NNM. Thus the PCM Event
Browser and Alerts features will not appear when using PCM for OV-NNM.
Please refer to Chapter 5, “Using the Event Manager” for more information on
the PCM Events browser feature. For information on working with NNM
Events, refer to Chapters 10 through 13 in Managing Your Network with HP
OpenView Network Node Manager.
Network Device Management
The integration of PCM into the OV-NNM application results in the following
changes in the Device Discovery feature in PCM.
■
The default SNMP Community Name comes from NNM, but PCM will
not prevent you from changing the default SNMP community names.
After you change the SNMP community names in PCM, the SNMP
names will be updated in the NNM database.
A-9
Using ProCurve Manager for OV-NNM
Working with PCM for OV-NNM
■
To enable SNMP V3 support on NNM, the SNMP Security Pack
product (BRASS plug-in) from SNMP Research has to be installed.
Please refer to "SNMP Research SNMP Security Pack User's Manual"
for more information.
Please refer to Chapter 6, “Managing Network Devices” for more information
on using the PCM Device Management features.
Network Traffic Monitor
The integration of PCM into the OV-NNM application has virtually no effect
on the PCM Traffic Monitor feature. You can still monitor the network traffic
and configure ports on PCM devices as described in Chapter 8, “Monitoring
Network Traffic”.
Note that the SNMP write community name in NNM must be set the same as
in PCM for traffic monitoring to work.
Device Configuration Management
The integration of PCM into the OV-NNM application has virtually no effect
on the PCM Configuration Manager feature. You can still review and update
ProCurve device configurations as described in Chapter 9, “Managing Device
Configurations”.
VLAN Management
The integration of PCM into the OV-NNM application has virtually no effect
on the PCM VLAN Manager feature. You can create VLANs, view VLAN Maps,
and update VLAN configuration on ProCurve devices as described in Chapter
11, “Using VLANs”.
Configuration Policy Management
The integration of PCM into the OV-NNM application results in the following
changes in the Policy Manager feature in PCM.
■
Application events resulting from enforcement of policies will be sent
to the NNM events log.
All other features of PCM+ policy management operate in the same manner
as described in Chapter 13, “Using Policy Manager Features”. You will be able
to create ProCurve device groups, and create and enforce configuration
policies.
A-10
Using ProCurve Manager for OV-NNM
PCM-NNM Synchronization
PCM-NNM Synchronization
In order to avoid data conflicts, there are several synchronizations that occur
periodically between PCM and NNM.
SNMP Data Synchronization
The SNMP settings (SNMP time-out, SNMP retry, Community names, and
Status polling interval) in the NNM database and PCM device database are
synchronized as follows:
■
During start-up PCM gets the NNM SNMP and Polling settings and
updates the SNMP information in the PCM device database.
■
Whenever you change the SNMP settings using PCM, the changes are
passed to NNM, and the NNM SNMP data is automatically updated.
■
Periodically, PCM will poll NNM for changes in SNMP settings and
update the PCM device database to match information found in NNM.
You can also click the NNM-PCM SNMP synchronization icon on the toolbar
to run the synchronization process at any time. PCM will read the NNM
database to get SNMP and polling information, and then update the correlating
data within the PCM database.
Device List Synchronization
When PCM is first started, it reads the NNM database to get a list of managed
ProCurve devices. This list is used to create the initial device list in PCM. At
periodic intervals after start-up, PCM will read the NNM database to check for
new devices. The data is then used to update the PCM device lists to match
the data found in NNM.
Click the NNM Database Miner icon in the PCM toolbar to read the NNM
device database at any time and automatically update the PCM device list.
If an unmanaged subnet is changed to a managed subnet in NNM, PCM will
automatically run the NNM Database Miner to get the information on devices
in the new managed subnet. If a subnet is changed from managed to unmanaged in NNM, the change will be passed to PCM, and the unmanaged subnet
will no longer appear in the managed subnets list in PCM. However, moving a
subnet from managed to unmanaged in PCM will have no affect on the subnet
status in NNM.
A-11
Using ProCurve Manager for OV-NNM
PCM-NNM Synchronization
Setting Synchronization Intervals
You can configure the intervals at which the PCM-NNM synchronization
functions occur using the PCM-NNM Preferences option.
1.
Select Preferences -> PCM-NNM to display the Global: PCM-NNM window.
2.
Use the arrows to increase or decrease the NNM Database Mining Interval
and the NNM Community Names Synchronization interval.
Set the interval to 0 if you do not want to use the automatic synchronization feature.
3.
A-12
Click "Apply" to save the changes, and then click "OK" close the window.
B
Using ProCurve Manager Mobility Module
Contents
Overview . . . . . . . . . . . . . . . . . . . . . . . . . . . . . . . . . . . . . B-2
Mobility Manager Design . . . . . . . . . . . . . . . . . . . . . . . . B-3
Monitoring Wireless Radios . . . . . . . . . . . . . . . . . . . . . . B-6
Radio Details . . . . . . . . . . . . . . . . . . . . . . . . . . . . . . B-7
WLAN Assignments . . . . . . . . . . . . . . . . . . . . . . . . B-9
Wireless Properties Tab . . . . . . . . . . . . . . . . . . . . . B-10
Radio Ports Tab . . . . . . . . . . . . . . . . . . . . . . . . . . . B-11
Radio Management Functions . . . . . . . . . . . . . . . . . . . B-13
Enable/Disable Radio . . . . . . . . . . . . . . . . . . . . . . . B-13
Configuring Automatic Channel Selection . . . . . . B-14
Configure RF Neighbor Detection . . . . . . . . . . . . . B-14
Setting Radio Transmission Power . . . . . . . . . . . . B-17
Setting the Radio Channel . . . . . . . . . . . . . . . . . . B-18
Viewing Neighbors . . . . . . . . . . . . . . . . . . . . . . . . . B-20
Setting Radio Trust Flags . . . . . . . . . . . . . . . . . . . B-22
Viewing Unmanaged RF Neighbors . . . . . . . . . . . B-23
Viewing Station Links Information . . . . . . . . . . . B-24
Monitoring and Configuring WLANs . . . . . . . . . . . . . B-27
Using the WLANs Tab . . . . . . . . . . . . . . . . . . . . . . B-27
Using the Deploy WLAN Configuration Feature . B-31
Enable/Disable WLAN Configurations . . . . . . . . . B-35
Add/Delete WLAN Configuration . . . . . . . . . . . . . B-36
Enable/Disable Inter-station Blocking . . . . . . . . . B-38
Setting Global Preferences for Mobility . . . . . . . . . . . . B-39
B-1
Using ProCurve Manager Mobility Module
Overview
Overview
The PCM+ application discovers ProCurve wireless Access Points (APs) as
interconnect devices, but does not deal specifically with the wireless device
configuration. PCM+ provides management of software updates, device-level
configuration file management, and the ability to create and deploy configuration templates and poll for AP status. Mobility Manager (PMM) provides
more complete control over wireless configurations, including radio properties and WLAN security configuration.
The Mobility Manager (PMM) features are seamlessly integrated into the
PCM+ application. With the Mobility Manager installed, you can view details
specific to ProCurve wireless APs and Wireless Services Modules. At the radio
level, PMM discovers individual radios, including properties and configurations, RF detection data, client/station data, and assigned trust levels. PMM
also lets you perform common configuration operations across multiple
radios simultaneously— such as setting channel, transmission power, RF
detection parameters, and radio states.
The intent of the Mobility Manager features is to provide a mechanism for
simplifying tedious configuration tasks across multiple wireless devices. It is
not the intent of the Mobility features to provide an interface for all possible
wireless configuration tasks. Please refer to the Configuration Guides provided with the Wireless device for information on more complex wireless
device configuration and use of Web Agent and CLI features.
To install the Mobility Manager, simply select the Mobility Manager option
when installing the PCM application. For additional information on installing
PCM, please refer to the ProCurve Manager Getting Started Guide. A 30-day
free trial version of the Mobility Module is provided with the ProCurve
Management software package. You must purchase a valid Mobility Manager
license to continue using the Mobility features beyond 30 days. Contact your
ProCurve sales representative to purchase a Mobility Manager license, or go
to the ProCurve Web site, www.procurve.com.
B-2
Using ProCurve Manager Mobility Module
Overview
Mobility Manager Design
The ProCurve Manager (PCM) application provides basic monitoring and
configuration management for ProCurve Wireless Access Points (APs) and
ProCurve Wireless Services Modules for features that the wireless devices
have in common with regular ’wired’ ProCurve devices. ProCurve Mobility
Manager (PMM) extends this functionality with features specific to monitoring and managing the ProCurve wireless devices, including Radios and Wireless LANs (WLANs). The following section describes the functionality
included in Mobility Manager, with references to additional information provided in earlier chapters of this book.
The Mobility Manager (PMM) GUI design is based on the Wireless device
configuration. That is, a wireless device can have one or more Radios configured, and each Radio can have one or more WLANs configured.
The Radios tab provides information about the Radios configured on wireless
devices, and provides access to the tools needed to manage radios: RF
settings, transmit power, channel selection, neighbor detection settings, etc.
Security related information is organized into the WLAN configuration for the
AP or radio port. This includes SSID, VLAN, closed system, encryption,
authentication, and key management for static WEP, WPA-PSK, and RADIUS
authentication servers. Mobility Manager provides an easy to use WLAN
Deployment feature for deploying WLAN security configurations across multiple radios, and managing authentication keys (WEP, WPA-PSK, and RADIUS
secret keys).
You can also create and apply policies for Wireless devices, or selected Radios
or WLANs independent of the device where the Radio or WLAN is configured.
(see “Using Policy Manager Features” on page 13-1 for details on creating and
applying Policies)
B-3
Using ProCurve Manager Mobility Module
Overview
Viewing Wireless Device Information
Wireless devices are initially discovered and mapped via their physical
connection to the network, similar to other ProCurve devices in PCM. The
navigation tree includes an entry for ProCurve Wireless, with individual nodes
for any discovered ProCurve wireless devices found in the network.
Figure B-1. Wireless Device Group nodes
Note that the adopted Radio Ports appear under the ProCurve Wireless
Services node only if you are using PMM. The wireless Device Group panel is
similar to device group displays for other ProCurve switches.
Figure B-2. ProCurve Manager: Device List for Wireless example
The following table describes the information included in the Devices List
display for wireless devices.
B-4
Using ProCurve Manager Mobility Module
Overview
:
Column
Description
Display Name
Descriptive name used to identify the device in PCM displays.
(Naming conventions are defined in Device Access.)
DNS Name
Name of the device
IP Address
IP address of the device
Status
State of the device as of the last discovery
Model
Model number of the device
ROM
ROM revision number of the device
SW Version
Current software version number of the device
Serial No.
Serial number of the device
Sys Name
Descriptive name used to identify the device
Once a ProCurve Wireless AP or radio port is discovered, Mobility Manager
provides a secondary "discovery" cycle using the RF scan feature available in
the AP. This provides information related to Radios and WLANs configured
on the managed ProCurve Wireless AP, and any other unmanaged Radios
within the RF scanning range of the managed AP.
NOTE:
ProCurve 420 Access Points require correct CLI (Telnet or SSH) usernames
and password in order to retrieve Access Point Radio information.
ProCurve 520wl Access Points use SNMP to retrieve radio information.
The Device Access (username and password credentials) must be in sync
between the Access Point and PCM/PMM in order to retrieve Radio information. If you do not see Radios for managed APs, use the "Test Communication
Parameters in PCM" wizard to verify that PCM is communicating with the
device, and if necessary adjust the parameters using the "Communication
Parameters in PCM" wizard. Refer to “Configuring SNMP and CLI Access” on
page 6-13 for details.
B-5
Using ProCurve Manager Mobility Module
Monitoring Wireless Radios
Monitoring Wireless Radios
When a wireless group or device is selected in the navigation tree, the device
window includes a Radios tab. Use the Radios tab to review information about
the Radios discovered by Mobility Manager, and to access the Mobility Manager wireless configuration tools.
Figure B-3. Mobility Manager: Radios tab
As for standard PCM device list displays, you can remove columns you do not
want to see in the table. Simply right-click in the column headers section and
click any of the checked items to deselect them. The table display is refreshed
and the deselected data column removed.Blank spaces in any column of the
Radio listing indicates the information is unavailable, either because the radio
is unmanaged, or the radio does not support that feature.
B-6
Using ProCurve Manager Mobility Module
Monitoring Wireless Radios
The Radios tab contains three panes of information: Radios, Details, and
WLAN Assignments. The information displayed in the Details and WLAN
Assignments panes is determined by the radio selected in the Radios pane.
Radios Panel:
The top pane of the Radios tab displays the following information for each
radio in the selected device or group.
Column
Description
Device
(AP or RP)
This column is displayed only when you select a wireless device
group. It identifies the device AP or RP containing the radio. For
example selecting the AP530 group lists all 530 Access Points.
Radio
Radio number and RF frequency used by the radio
Channel
RF channel on which the radio is operating and whether the radio uses
automatic channel selection (auto)
State
Last known state of the radio: Enabled or Disabled
Tx Power
Radio transmission power used to adjust signal strength. The longer
the transmission distance, the higher the transmission power
required.
RF Detection RF neighbor detection mode used by the radio to detect neighboring
radios: Disabled, Dedicated, or Periodic
Radio Details
Select a radio in the Radios pane to display detailed information about the
radio in the Details panel on the Radios tab. The data fields displayed will vary
depending on the device type selected, and can include the following:
Column
Description
Antenna
Location
Internal or External antenna
Antenna Mode
If using an external antenna, the type of external antenna being used:
• Diversity-Two identical Diversity antenna elements used to
transmit and receive radio signals. External diversity antennas
have two pigtail connections to the Access Point or Radio Port.
Single-One antenna element with a single pigtail cable connection
to the Access Point.
• Primary-If a Radio Port uses a non-diversity external antenna, the
antenna is connected to the primary connector.
• Secondary -If a Radio Port uses a non-diversity external antenna,
the antenna is connected to the secondary connector.
B-7
Using ProCurve Manager Mobility Module
Monitoring Wireless Radios
Column
Description
Antenna Tx Limit Transmit limit of antenna in percent (%)
Antenna Type
Omni or Directional antenna.
Basic Rates
Data rates that the Access Point or Radio Port advertises to the
network for the purpose of setting up communication with other
Access Points, Radio Ports, and stations on the network.
Beacon Interval Rate at which beacon frames are transmitted from the Access Point
or Radio Port (allows wireless stations to maintain contact with the
Access Point or Radio Port).
Channel
RF radio channel used by the Access Point or Radio Port to
communicate with wireless stations
Channel
Method used to select a channel: Automatic if the Access Point
Selection Policy automatically selects the least congested channel at startup or Static
if the channel is manually selected.
Country
Country code for the radio (ensures channels being used conform to
local regulations)
Description
A text description of the radio. For some devices this is configurable
through the CLI or Web interface.
DTIM Interval
Rate at which stations in sleep mode must wake up to receive
broadcast/multicast transmissions (determined by the number of
beacons between DTIMs)
DTIM is a string of bits sent in a beacon frame to notify wireless
stations using power save that the Access Point or Radio Port has
buffered broadcast or multicast frames that it will be sending soon.
DTIMs do not require an acknowledgement, so stations sometimes
miss them. To overcome this, Access Points and Radio Ports periodic
send DTIMs until the data is sent.
Fragmentation
Threshold
Minimum packet size (in bytes) that can be fragmented when passing
through the Access Point.
Interface Index
Index in MIB2, for example on AP530 this is 3 and 6
Link Integrity
Poll Interval
Link integrity poll interval in milliseconds
Link Integrity
Retransmissions Number of link integrity retransmissions
B-8
Link Integrity
State
Link integrity state: enabled or disabled
Link Integrity
Targets
Comma separated list of IP addresses to poll in link integrity
Using ProCurve Manager Mobility Module
Monitoring Wireless Radios
Column
Description
Max Station
Data Rate
Maximum data rate at which a client can connect to the Access Point.
The maximum transmission distance is affected by the data rate. The
lower the data rate, the longer the transmission distance.
Mode
802.11 mode used; a, b, bg, g n, fh, etc.
Preamble
Length of the signal preamble at the start of a data transmission (short
preambles are typically used for VoWLAN devices).
Radio Index
Logical index of radio relative to its parent device. For example, on
AP530 it is 1 and 2, on RP1..n is relative to adoptive WESM radio index
RF Band
RF band used by the radio, 2.4 GHz or 5 GHz
RF Detection
Duration
If RF Detection Mode on the Access Point is set to Periodic, the
duration of each scan
RF Detection
Interval
If RF Detection Mode on the Access Point is set to Periodic, the time
to wait between scanning for neighbors
RF Detection
Mode
Disabled if the radio does not detect neighbors, Dedicated if the radio
is used exclusively for detecting neighbors, or Periodic if the radio
intermittently detects neighbors
RTS Threshold
Packet size threshold at which an RTS must be sent to the receiving
station prior to the sending station starting communications
State
Operating state of the radio: Disabled or Enabled
Supported Rates Data rates that the Access Point or Radio Port supports. The most
efficient rate is automatically chosen based on factors like error rates
and distance of client stations.
Transmit Power
Radio transmission power used to adjust signal strength. The longer
the transmission distance, the higher the transmission power needed.
Transmit Power
Units
The unit measure used for the transmit power field,
for example Db, or %
Tx Multicast
Data Rate
Transmit multicast data rate in Mbps
WLAN Assignments
Select a radio in the Radios tab to display the WLAN configurations for that
radio in the WLAN Assignments pane The WLAN Assignments pane consists
of a tree structure showing the selected radio as the root, the BSSIDs of the
radio, and the WLANS assigned to each BSSID. If a primary WLAN has been
designated for a BSSID, it is identified.
B-9
Using ProCurve Manager Mobility Module
Monitoring Wireless Radios
Wireless Properties Tab
Selecting an Access Point or Radio Port in the navigation tree and then clicking
the Wireless Properties tab displays available information for the selected
device.
Figure B-4. Wireless Properties tab for WES Module radio.
The information displayed in this tab is determined by the type of device you
select and the wireless configuration information available from the device.
In the example above properties include:
■
RF Detection State Indicates if RF detection is enabled or disabled.
■
Model
Model number of the Radio Port (RP210, RP220,
RP230)
■
MAC Address
MAC address of the Radio Port
■
IP Address
IP address of the Radio Port (if available)
■
Serial Number
Hardware serial number of the Radio Port
■
Parent WES
Module
IP address of the Wireless Services Module
that adopted the Radio Port
■
Software Version
Software version currently running on the Radio
Port
■
Boot Version
Software version that the Radio Port boots from.
■
Hardware Version Hardware version of the Radio Port
The data may also include information on Inter-Station blocking.
If Mobility Manager cannot obtain information from the device, the tab is
blank.
B-10
Using ProCurve Manager Mobility Module
Monitoring Wireless Radios
Radio Ports Tab
When you select the Group node level for the ProCurve Wireless Services
devices, the Device Group window includes a Radio Ports tab you can use to
review information about the Radio Ports (adopted and unadopted) discovered by Mobility Manager.
Figure B-5. Mobility Manager: Radio Ports tab
The Radio Ports tab contains two panes of information: Radio Ports and Details.
The top pane of the Radio Ports tab displays the following information for
each adopted and unadopted Radio Port discovered by Mobility Manager. (You
can select the columns of information displayed by right-clicking a column
heading and selecting a column name.)
■
Radio Port
Radio Port model number and MAC address
■
IP Address
IP address of the Radio Port
■
Serial Number
Hardware serial number of the Radio Port
B-11
Using ProCurve Manager Mobility Module
Monitoring Wireless Radios
■
Parent WES Module
IP address of the Wireless Services Module that
adopted the Radio Port. Unadopted Radio Ports
are identified in this column with "<not adopted>".
Select a Radio Port in the Radio Ports pane to display the information for that
Radio Port in the Details panel:
■
Model
Model number of the Radio Port (RP210, RP220,
RP230)
■
MAC Address
MAC address of the Radio Port
■
IP Address
IP address of the Radio Port (if available)
■
Serial Number
Hardware serial number of the Radio Port
■
Parent WES
Module
IP address of the Wireless Services Module
that adopted the Radio Port
■
Software Version
Software version currently running on the Radio
Port
■
Boot Version
Software version that the Radio Port boots from.
■
Hardware Version
Hardware version of the Radio Port
You can also double-click an Radio Port in the Radio Ports tab to display the
Wireless Properties tab for the selected Radio Port, if it has been adopted.
(Double-clicking an unadopted Radio Port has no effect.) See “Wireless Properties Tab” on page B-10 for details.
B-12
Using ProCurve Manager Mobility Module
Radio Management Functions
Radio Management Functions
You can use the toolbar in the Radios tab to:
Enable or Disable the radio
Enable or Disable automatic channel selection
Configure RF neighbor detection
Configure the radio transmission power
Configure the radio channel
View Neighbors
View Stations
Each of these functions is described in the following sections.
Enable/Disable Radio
The Enable Radio window is used to enable (activate) radios on managed
Access Point and Radio Ports. You can also disable radios with the Disable
Radio function.
To enable or disable radios:
1.
Select the radio in the navigation tree or Radios tab display. (to select
multiple radios, use the Radios tab.)
2.
Click the State icon in the toolbar and click the desired state to apply to
the radio(s), Enable or Disable.
3.
The State in the Radios display reflects the new setting.
If one of the selected radios is not part of a ProCurve managed AP, an error
message displays indicating the feature is not available, and the radio state
is unchanged.
B-13
Using ProCurve Manager Mobility Module
Radio Management Functions
Configuring Automatic Channel Selection
Auto Channel Selection is used to enable and disable automatic channel
selection on radios that support this feature. Disabling automatic channel
selection retains the current operating channel.
1.
Select the radio in the navigation tree or Radios tab display. (to select
multiple radios, use the Radios tab.)
2.
Click the Enable Automatic Channel icon in the toolbar and select (click)
an automatic channel selection option:
•
3.
Click OK in the confirmation pop-up to apply the automatic channel
setting.
The Radios list reflects the new Auto-channel setting:
•
Manual if the automatic channel selection is disabled.
•
Auto if the automatic channel selection is enabled.
Configure RF Neighbor Detection
Once an Access Point or Radio Port is discovered, Mobility Manager takes
advantage of the RF detection feature available in the device. If a radio has
RF detection enabled, Mobility Manager gathers and correlates neighboring
radio information. Mobility Manager provides the capability to configure RF
neighbor detection on the radios of managed ProCurve Access Points and
Radio Ports.
1.
Select the radio in the navigation tree or Radios tab display. (to select
multiple radios, use the Radios tab.)
If configuring multiple radios, ensure that all selected radios support the
same RF neighbor detection capabilities.
2.
Click the Configure RF Neighbor Detection button in the tab’s toolbar.
If you selected multiple radios, and any one of the selected radios does
not support the RF scan option, an error pop-up is displayed.
Click OK in the pop-up to close it, and return to the Radios list display to
re-select.
B-14
Using ProCurve Manager Mobility Module
Radio Management Functions
Figure B-6. Mobility Manager: RF Neighbor Detection configuration
3.
In the Configure RF Neighbor Detection window, use the pull-down menu
to select the System-wide RF detection State:
•
Disabled: Do not run RF neighbor detection in system-wide mode (the
default selection).
•
Enabled: Run RF Neighbor detection using the selected detection
mode.
If the radio does not support the System-wide RF Detection State, the
option is disabled and cannot be selected.
4.
Detection Mode pull-down menu to select the RF neighbor detection
properties:
•
Disabled: Do not run RF neighbor detection (the default selection)
• Dedicated: Always run RF neighbor detection.
•
Periodic: Run RF neighbor detection at scheduled intervals.
For Radio Ports (WESM) the Detection Mode options are
Dedicated or Normal.
If the radio does not support dedicated RF neighbor detection, the option
is disabled and cannot be selected.
5.
If you selected Periodic: to change the scan interval and duration defaults
on the selected radios, check the Interval and Duration check boxes and
select the desired interval. Possible values for the interval and duration
conform to the allowable values on the selected radios.
B-15
Using ProCurve Manager Mobility Module
Radio Management Functions
If you do not specify the interval and duration, the current interval and
duration settings on the selected radios are used.
6.
Click OK to apply the RF neighbor detection configuration and close the
window.
Click Cancel to close the window without applying the new configuration.
7.
The Status dialog displays, indicating the configuration is completed
successfully, or failed.
Figure B-7. Status dialog for Radio Configuration
The Status dialog title bar identifies the operation being performed and a table
lists the status of the selected operation on each device. The status can be:
• Completed successfully
• Failed
• Warning (feature not supported by device)
• Pending (a progress bar is displayed)
• Aborted
• In Progress
B-16
8.
Click the Halt button to stop an operation before completion on all devices.
(Device operations currently in progress are completed.)
9.
Click the Summary button to display any associated messages in the event
of failure.
Using ProCurve Manager Mobility Module
Radio Management Functions
Tip :
Use the Device
M an a g e r, " Te st
Communication
Parameters in
Device" featur e to
check PCM’s (PMM)
communications
with the wireless
device.
Figure B-8. Sample Status Summary dialog
Setting Radio Transmission Power
The Radio Transmission Power dialog is used to adjust the transmit power,
which is typically reset when signal strength is so strong that it causes
interference with other nearby radios, or is so weak that it causes reception
problems. The longer the transmission distance, the higher the transmission
power required.
To configure radio transmission power:
1.
To configure RF neighbor detection for a single radio, select an Access
Point or Radio Port in the navigation tree or in the Radios tab and click
the Configure Radio Transmission Power button.
To configure RF neighbor detection for multiple radios, select the radios
in the Radios tab using standard Windows conventions and click the
Configure Radio Transmission Power button.
B-17
Using ProCurve Manager Mobility Module
Radio Management Functions
Figure B-9. Mobility Manager: Radio Transmit power configuration
When configuring multiple radios, ensure that all selected radios support
the same transmission power levels.
2.
In the Configure radio transmit power dialog, use the pull-down menu to
select the desired transmission power setting. Possible values are determined by the allowed transmission power for the selected radios. The
higher the transmission power, the stronger the signal and the greater the
transmission distance.
If you selected multiple radios, and any one of the selected radios does
not support the same radio transmission power settings, only the values
common to all selected radios are available.
3.
Click OK to apply the RF transmission power configuration. This displays
the Status window (see page B-16), or
Click Cancel to close the window without applying the new configuration.
Setting the Radio Channel
The Configure Radio Channel dialog is used to select the RF channel used by
the radio for communication.
1.
Select the radio in the navigation tree or Radios tab display. (to select
multiple radios, use the Radios tab.)
2.
Click the Configure radio channel button in the toolbar.
If you selected multiple radios, and the selected radios do not support the
same radio channel settings, an error pop-up is displayed.
Click OK in the pop-up to close it, and return to the Radios list display to
re-select.
B-18
Using ProCurve Manager Mobility Module
Radio Management Functions
3.
The Configure radio channel dialog displays.
Figure B-10. Mobility Manager: Radio Channel configuration
4.
Select the desired Channel from the pull-down menu. Possible values are
determined by the allowed channels for the selected radios, and only
unassigned channels are displayed.
5.
Click OK to apply the new channel setting and close the window.
Click Cancel to close the window without applying the new configuration.
B-19
Using ProCurve Manager Mobility Module
Radio Management Functions
Viewing Neighbors
Select a radio in the navigation tree or Radios tab and then click the View
Neighbors button in the toolbar to launch the RF Neighbors window.
Figure B-11. Mobility Manager, Neighbor Radio display
The top half of the window displays all radios that have been detected by the
selected radio during RF neighbor detection scan, and the bottom half of the
window displays all radios that detected the selected radio during their RF
detection. However, some information may not be detected if the selected
radio has access point reporting limitations or does not have RF scanning
capabilities. If RF detection is disabled, or there are no neighboring radios
detected, the display is blank.
Detected Neighbors:
The top pane of the Neighbors window displays the following information for
the BSSIDs in detected neighboring radios. If the device contains multiple
SSIDs per BSSID, each detected SSID is described in a separate row.
B-20
Device
Device containing the neighboring radio
Radio ID
Identifier of the neighboring radio
Using ProCurve Manager Mobility Module
Radio Management Functions
BSSID
BSSID associated with the SSID
SSID
SSID of the neighboring radio
Channel
Channel number on which the radio is operating
Signal
Received Signal Strength Indication (RSSI), which indicates the
proximity of a neighboring radio and possible interference or
reception problems. The higher the value, the stronger the
signal. A value of 1 indicates minimal signal strength detected,
while 0 indicates no signal.
For example, on a 420wl access point, an RSSI of 30 or more
indicates a strong signal from a nearby access point that may
cause significant interference problems. An RSSI of 15 or less
indicates a weak signal from a distant access point that should
not impact wireless network performance.
Mode
IEEE wireless standard used by the radio: 802.11a, 802.11b,
802.11g or 802.11b+g
Security
Whether there is any security (encryption) on the neighboring
device. Possible values vary, depending on the reporting
device.
Trust
The trust level of the radio. Possible values include:
New
Automatically assigned trust level for newly discovered or unassigned radios
Trusted User-assigned trust level for known, managed radios
Friendly User-assigned trust level for known, unmanaged
radios
Rogue
User-assigned trust level for unknown, unmanaged
radios
Network Type Indicates if it is an ’Ad Hoc’ or ’Infrastructure’ network type.
Detected by Neighbors:
The Detected By panel displays information for the selected device, as reported
by the neighbors that have detected it (detector devices), including:
Detector Device
This column identifies the neighbor device that
detected the selected radio.
If the neighbor was detected by a Radio Port, this
column lists the model number and MAC address of the
detector.
If the neighbor was detected by an Access Point, this
column displays the IP address of the detector.
B-21
Using ProCurve Manager Mobility Module
Radio Management Functions
Detector Radio ID
Number of radio that detected the neighbor
My Signal
Signal strength of the selected device, as reported by
the detector, shown in RSSI (1 indicates the minimum
signal strength)
My BSSID
MAC address for the BSSID of the selected device as
reported by the detector device.
My SSID
Name of the SSID of the selected device as reported by
the detector device.
My Security
Type of encryption used on the selected device, as
reported by the detector device.
The data display will vary based on wireless device configuration. For
example, if the selected device is a ’closed system’, the detector device
cannot determine the SSID.
Positioning the cursor over a device displays the BSSID, radio mode, and
channel used by the detector device.
Setting Radio Trust Flags
To help track radio status, you can set the Trust flag for all Radios discovered
by the RF scan. Then you can sort the Radios list by Trust level to quickly
check for new or rogue devices.
Newly discovered radios are automatically assigned a trust level of New.
However, you can change the trust level for a radio to:
•
Trusted (known and managed radio),
•
Friendly (known radio that you do not manage), or
•
Rogue (unknown radio that you do not manage).
Once you have marked radios with a trust level, you can sort the Radios list
by trust level to quickly check for new or rogue devices.
The trust level does not perform any function other than to help you quickly
identify the degree of trust for the radio and sort radios shown in PCM radio
lists by their assigned trust level.
To set the trust level the simplest method is:
1.
B-22
Navigate to the View Neighbors window.
•
Select a radio in the navigation tree or Radios tab.
•
Click the View Neighbors button.
Using ProCurve Manager Mobility Module
Radio Management Functions
2.
Select the detected radio(s) for which you want to set or change the trust
level.
Optionally, click a column heading to sort radios by the selected column.
For example, click the Trust column heading to group New radios so you
can easily change the trust level of multiple radios at one time. Or, click
the Device column heading to group managed radios. (Managed Access
Points and Radio Ports have a Radio Identifier, and unmanaged devices
do not.)
3.
Right-click the radio to change and click the Trust option to display the
drop-down list, and then select the desired trust level from the drop-down
list:
•
Use Trusted for known, managed radios
•
Use Friendly for known radios, but that you do not manage.
•
Use Rogue for unknown, unmanaged radios.
If you are unsure about the radio, you can change the trust flag at a later
time.
4.
Repeat the process to flag the remaining radios as friendly or rogue.
5.
Now in the Radios tab display, click the Trust column heading to sort the
list by trust level.
The next time you check the display, you will be able to quickly determine any
new radios, and check on rogue radios in range of your managed APs, simply
click the Trust column heading on the Radios tab to sort radios by trust level.
Viewing Unmanaged RF Neighbors
Select View Unmanaged RF Neighbors from the Tools menu to display the
View Unmanaged RF Neighbors window, which provides the following information for all unmanaged RF Neighbors:
■
■
BSSID - The MAC address of the BSSID for the unmanaged BSS
Trust - The trust level assigned to the radio: New, Trusted, Friendly, or
Rogue
B-23
Using ProCurve Manager Mobility Module
Radio Management Functions
Figure B-12. View Unmanaged Neighbors display
You can select any of the unmanaged RF neighbors and click the toolbar
button to:
•
Mark Trust Level
•
View Neighbors
•
Delete the Unmanaged RF Neighbor
These features work the same as described for "managed" RF neighbors.
Viewing Station Links Information
The Stations linked to: window provides information on any stations (clients)
linked with and/or authenticated by the selected radio, along with known
properties for those stations. Select a Radio in the Radios tab and click the
View Stations button to launch the Stations linked to: window.
B-24
Using ProCurve Manager Mobility Module
Radio Management Functions
Figure B-13. Linked Stations display example
The following table describes the information provided for.
Column
Description
Station MAC
MAC address of the station associated with the selected radio
Station IP
IP address of the station
Signal
Received Signal Strength Indication (RSSI) of the wireless connection
between the station and radio. The higher the value, the stronger the signal.
A value of 1 indicates minimal signal strength detected.
SSID
SSID used by the station
Security
Type of encryption used by the station to link to the radio. Possible values
are:
• None: Station not using encryption keys
• static-wep: Station uses static WEP keys for encryption
• dynamic-wep: Station uses 802.1X authentication with dynamic WEP
keys.
• wpa-psk-tkip: Station uses Wi-Fi Protected Access, PreShared Key
mode, and TKIP is used for the unicast and multicast cipher
• wpa-psk-aes: Station using Wi-Fi Protected Access PreShared Key
mode. AES used for unicast and multicast ciphers.
• wpa-psk-tkip-wep: Station using Wi-Fi Protected Access PreShared
Key mode. TKIP is used for the unicast cipher, and WEP is used for the
multicast cipher
• wpa-psk-aes-tkip: Station using Wi-Fi Protected Access PreShared Key
mode. AES is used for the unicast cipher, and TKIP is used for the
multicast cipher
• wpa-tkip: Station using Wi-Fi Protected Access (dynamic mode) with
TKIP keys and TKIP is used for the unicast and multicast cipher
(continued on next page)
B-25
Using ProCurve Manager Mobility Module
Radio Management Functions
Column
Description
Security
(continued)
• wpa-aes: Station using Wi-Fi Protected Access (dynamic mode) with
AES keys and AES is used for the unicast and multicast cipher
• wpa-aes-tkip: Station using Wi-Fi Protected Access (dynamic mode),
AES is used for the unicast cipher, and TKIP is used for the multicast
cipher
• wpa-tkip-wep: Station using Wi-Fi Protected Access (dynamic mode),
TKIP is used for the unicast cipher, and WEP is used for the multicast
cipher.
Associated
Yes if the station has been successfully associated with the radio. Once
authentication is completed, stations can associate with the current radio,
or re-associate with a new Access Point or Radio Port. The association
procedure allows the wireless system to track the location of each mobile
station, and ensures that frames destined for each station are forwarded
to the appropriate radio.
No if the station has not been associated with the radio.
Authenticated
Whether the station had been authenticated: Yes or No.
Two methods of authentication are supported for 802.11 wireless networks:
open system and shared key. Open-system authentication accepts any
station attempting to connect to the access point without verifying its
identity. Shared-key uses WEP to authenticate the client with a shared key
before allowing the client to associate.
Forwarding
Yes if 802.1X is being used, the station has passed 802.1X authentication,
and traffic can be forwarded to the radio. Yes for all stations if
authentication is not required.
No if the station cannot forward traffic to the radio.
Position (hovering) the cursor over a station to display a pop-up with additional details for the station, as shown in the following figure.
Figure B-14. Mouse-over Station pop-up display
B-26
Using ProCurve Manager Mobility Module
Monitoring and Configuring WLANs
Monitoring and Configuring WLANs
A WLAN (Wireless LAN) configuration identifies the SSID, VLAN, and security
used by the wireless device(s) for communication. Mobility Manger adds a
WLANs tab to the Device and Group windows to help you manage WLANs for
the wireless devices in your network.
Using the WLANs Tab
You can use the WLANs tab to display properties for all WLAN configurations
defined on the selected wireless device group or wireless device.
Figure B-15. Mobility Manager, WLANs tab
The WLANs tab contains two panes of information: WLAN Configurations and
Details. The information displayed in the Details pane is determined by the
Device or Index (WLAN) selected in the WLANs Configuration list.
B-27
Using ProCurve Manager Mobility Module
Monitoring and Configuring WLANs
When you access the WLANs tab at the device group level, you can filter the
display by checking the Filter by SSID, and then select the SSID from the pulldown menu. The window is refreshed and only WLAN information for the
selected SSID will display.
The WLANs Configuration pane displays the following information for each
WLAN configuration.
Device
IP address of the SSID on the selected device.
This column is only available in the wireless group display.
Index
Index number used to identify the WLAN configuration
VLAN ID
VLAN ID (1-4094) configured as the default VLAN ID for the
SSID interface. (Stations connecting to the SSID use the
assigned VLAN.)
Security Type of encryption used by the SSID to encrypt transmitted
Summary data. For example: WEP:static/128, WPA-PSK/TKIP, etc.
Closed
System
Whether access is closed to stations without a pre-configured
SSID. By default, the primary SSID is configured as open
system, but it can be changed to closed system.
State
Whether the radio is Enabled or Disabled
You can select the columns of information displayed by right-clicking a
column heading and selecting or unselecting a column name.
Select a WLAN configuration in the WLAN Configurations pane to display the
Details for that WLAN in the lower pane of the window. The WLAN details
display information on the Network Settings, Security and Authentication for
the WLAN, and Additional Properties, as described below:
Network Settings: Data displayed will vary based on the wireless device
type selected, and can include:
■
Closed System: Whether WLAN has the Closed System option enabled
or disabled. When enabled, the primary assignment can broadcast an
SSID.
■
■
Description: Description of the WLAN if provided by the device
SSID: The SSID string (network name)
■
VLAN ID: ID used to identify the VLAN
■
VLAN Tagging: Indicates if the VLAN is a tagged VLAN (Enabled), if the
VLAN is untagged (Disabled), or if the tag status is Unknown.
Only one untagged VLAN can be used per Access Point. However, multiple
WLANs can be assigned to the untagged VLAN.
B-28
Using ProCurve Manager Mobility Module
Monitoring and Configuring WLANs
Security: This section lists the security configuration in use on the WLAN.
The data displayed will vary based on the security configuration. For all types
it will include:
■
■
Security Suite: The type of security used for the WLAN, one of:
•
No security: Open authentication with encryption disabled
•
Dynamic WEP: Dynamic WEP uses 802.1X for user authentication and
to pass dynamic WEP unicast session keys and static broadcast keys
(used to encrypt data) to wireless stations. A RADIUS server must be
configured and available in the wired network used by the radio.
•
Static WEP: Shared keys used for encryption (open authentication)
•
WPA 802.1X: WPA employs 802.1X for user authentication and
dynamic key management. Encryption keys are not sent to the station
and Access Point or Radio Port until a RADIUS server has authenticated a user’s credentials
•
WPA Pre-Shared Key: WPA uses RADIUS authentication or a preshared password for network access. Pre-shared key mode uses a
common password for user authentication that is manually entered
on wireless stations.
Security Summary: A text summary of the security settings applied to
the WLAN (authentication and encryption).
The remaining data fields displayed vary depending on the authentication
method, and may include:
For Static WEP type:
■
Key Index: Index used for the static WEP key
■
Key Length: Number of bits (64, 128, or 152) in the WEP key used for
data encryption on an WLAN interface
■
Key Type: Input format for the static WEP key: ASCII or Hex.
For WPA types:
■
■
Cipher: WPA cipher used by the WLAN (TKIP, CCMP (AES), or
TKIP+CCMP (AES)
Key Type: Format of WPA key (ASCII or Hexadecimal)
■
Version: WPA version to support (typically WPA, WPA2, or WPA+WPA2)
■
Pre-authentication: Whether WPA2 pre-authentication for fast secure
roaming is enabled or disabled.
B-29
Using ProCurve Manager Mobility Module
Monitoring and Configuring WLANs
Where applicable, information is provided for Primary and Secondary
RADIUS configuration for the WLAN, including:
■
IP Address: IP address of the RADIUS server
■
Port: Port number of the RADIUS server
■
Retries: Number of retries if communication fails
■
Timeout: Seconds to wait before ending an unsuccessful attempt to
communicate with the RADIUS server
Additional Properties: This section provides additional information related
to the WLAN configuration, including:
■
B-30
Index: Index number used to identify the WLAN configuration
■
State: For devices where state can be set independently per radio,
Enabled = at least one radio enabled, Disabled = all radios disabled.
May also show Unknown.
■
Inter-station Blocking: Whether inter-station blocking is enabled
(true) or disabled (false).
Using ProCurve Manager Mobility Module
Monitoring and Configuring WLANs
Using the Deploy WLAN Configuration Feature
The Deploy WLAN Configuration feature can be used with all wireless devices
to change a WLAN configuration and distribute the configuration to all devices
currently containing the configuration. All parameters in the current WLAN
configuration are overwritten when it is deployed.
To deploy a WLAN configuration:
I
1.
On the WLANs tab, using standard windows conventions select one or
more WLAN configurations that you want to deploy. All parameters in the
current WLAN configuration are overwritten when it is deployed. Therefore, only select WLAN configurations with all parameters identical when
selecting multiple configurations.
2.
Click the Deploy WLAN Configuration button.
Figure B-16. Mobility Manager, WLAN configuration display
B-31
Using ProCurve Manager Mobility Module
Monitoring and Configuring WLANs
3.
In the SSID field of the Deploy WLAN Configuration screen, type the SSID
name (1-32 ASCII characters).
4.
In the Description field, type a brief description identifying the WLAN
configuration. This field is disabled if the selected devices do not support
it. Also, the maximum length of the description is determined by the
selected devices.
5.
In the VLAN ID field, use the drop-down list to select the VLAN used for
the WLAN configuration.
6.
To use VLAN tagging, use the VLAN Tagging arrow to select Enabled. If
you enable tagging, ensure the selected devices support tagging.
7.
To deny access to stations without a pre-configured SSID, use the Closed
System arrow to select Enabled.
By default, the primary SSID is configured as open system, but it can be
changed to closed system. Secondary SSID interfaces are closed in the
default configuration.
8.
Select the Security Suite from the pull-down menu:
Dynamic WEP
Dynamic WEP uses 802.1X for user authentication and to pass
dynamic WEP unicast session keys and static broadcast keys
(used to encrypt data) to wireless stations. A RADIUS server must
be configured and available in the wired network used by the
radio.
Static WEP
Shared keys used for encryption (open authentication)
WPA 802.1X
WPA employs 802.1X for user authentication and dynamic key
management. Encryption keys are not sent to the station and
Access Point or Radio Port until a RADIUS server has
authenticated a user's credentials
WPA Pre-Shared WPA uses RADIUS authentication or a pre-shared pass word for
key
network access. Pre-shared key mode uses a common password
for user authentication that is manually entered on wireless
stations.
No security
9.
Open authentication with encryption disabled
Enter the information required for the Security Suite you have selected.
See “Operational Notes for WLAN Security Configuration” on page B-33
for details.
10. In the IP Address field for Primary RADIUS Authentication, type the IP
address of the primary RADIUS server.
11. In the Port field, type the UDP port number (1024-65535) used by the
primary RADIUS server for authentication messages.
B-32
Using ProCurve Manager Mobility Module
Monitoring and Configuring WLANs
12. In the Key field, type the shared text string (up to 20 characters with no
spaces) used to encrypt messages between the Access Point or Radio Port
and the RADIUS server. Ensure that the same text string is specified on
the RADIUS server.
13. In the Timeout field, type the number of seconds (1-60) the access point
waits for a reply from the RADIUS server before resending a request.
14. In the Retries field, type the number of times (1-30) the access point tries
to resend a request to the RADIUS server before authentication fails.
15. If using a Secondary RADIUS server, enter the parameters, as explained
for Primary RADIUS Authentication in the preceding steps.
16. In the MAC Format Delimiter field, select the format used to specify MAC
addresses on the RADIUS server
Select...
No Delimiter
Single Dash
Multi Dash
Multi Colon
If...
MAC addresses in the form xxxxxxxxxxxx
MAC addresses in the form xxxxxx-xxxxxx
MAC addresses in the form xx-xx-xx-xx-xx-xx
MAC addresses in the form xx:xx:xx:xx:xx:xx
17. In the VLAN ID Format field, select the format for specifying VLAN IDs
on the RADIUS server. Select Hex if the VLAN IDs are a hexadecimal
number or ASCII if the VLAN IDs are an ASCII string.
18. Click the OK button to save your changes and replace all instances of the
existing WLAN configuration with the updated configuration.
19. Monitor the status, display the summary if desired, and then click Close.
Operational Notes for WLAN Security Configuration
WEP is a security protocol for wireless local area networks (WLANs) that uses
the stream cipher RC4 for confidentiality and the CRC-32 checksum for
integrity. Standard WEP uses a 40-bit key, to which a 24-bit initialization vector
(IV) is concatenated to form the RC4 traffic key. WEP is used at the two lowest
layers of the OSI model - the data link and physical layers. Therefore, it does
not offer end-to-end security.
B-33
Using ProCurve Manager Mobility Module
Monitoring and Configuring WLANs
Configuring a static WEP key:
In the Key field, type in the WEP key, using the number of hexadecimal or
ASCII characters associated with the key length and type, as defined in the
following table:
Note:
Key Length, Type
Password Length and Characters
64-bit Hex
10 hexadecimal characters (0-9 and A-F)
128-bit Hex
26 hexadecimal characters (0-9 and A-F)
64-bit ASCII
5 alphanumeric characters
128-bit ASCII
13 alphanumeric characters
Only one WEP key can be applied to an SSID interface, and only if a key index
is available. If a key index is not available, the SSID interface cannot use WEP
security until a key index is released by another SSID interface. In addition,
the WEP shared key must be the same for each station associated with the
SSID interface.
Configuring WPA Pre-Shared (PSK) Keys for a WLAN:
WPA is a Wi-Fi standard that authenticates users and uses the temporal key
integrity protocol (TKIP). User authentication uses the extensible authentication protocol (EAP). EAP is built on a public-key encryption system to ensure
that only authorized network users can access the network. TKIP, which
dynamically changes keys as the system is used, scrambles the keys using a
hashing algorithm and ensures that the keys haven't been tampered with by
adding an integrity-checking feature.
Implementing Dynamic WPA on wireless clients requires a WPA-enabled
network card driver and 802.1X client software that supports the EAP authentication type that you want to use. Windows XP provides native WPA support,
but other operating systems may require additional software.
1.
Select the Cipher type that will be used, one of: CCMP(AES), TKIP, or TKIP
+ CCMP (AES)
2.
For the Cipher: Select the cipher type. This identifies the encryption
method used for broadcast (multicast) and unicast traffic.
Possible cipher types are:
•
TKIP - TKIP is used for both multicast and unicast traffic.
•
CCMP (AES) - CCMP (AES) is used for both multicast and unicast
traffic.
•
B-34
TKIP + CCMP (AES) - TKIP is used for multi-cast traffic and CCMP(AES)
is used for unicast traffic
Using ProCurve Manager Mobility Module
Monitoring and Configuring WLANs
3.
In the Version field, select the type of WPA used (WPA, WPA2, or
WPA+WPA2). If both WPA and WPA2 can be used, select WPA+WPA2.
4.
In the Key Type field, select Hex if the key is hexadecimal or ASCII if the
key is an ASCII key.
5.
In the Pre-shared Key field, type the key index (64 hexadecimal digits or 863 alphanumeric characters) used to encrypt data.
NOTE: Be sure that all wireless stations use the same pre-shared key.
Configuring RADIUS Secret keys for a WLAN:
Enter the RADIUS Secret Key information to use with the SSID:
In the Primary or Secondary RADIUS server Key field, type the key used to
encrypt messages between the access point and the RADIUS server. The key
can be up to 20 characters in length, and cannot contain any blank spaces.
The same key you enter in Mobility Manager must be configured on the
RADIUS serer. For additional information, refer to the "Management and
Configuration Guide" for your RADIUS server.
Enable/Disable WLAN Configurations
Enabling or disabling a WLAN configuration lets you turn on or turn off a
WLAN configuration on radios containing multiple WLAN configurations
without deleting the SSID configuration. If the selected WLAN configuration
belongs to a device where the configuration can be applied to a specific radio
(for example an AP520), this function is performed on all radios where this
WLAN configuration is assigned.
To Enable/Disable WLAN Configuration:
1.
Navigate to the WLANs tab.
a.
Select a wireless group or device in the navigation tree.
b.
Click the WLANs tab.
2.
Select the SSID(s) you want to enable or disable.
3.
To enable the selected WLAN security configurations, click the RF Tools
button on the toolbar and select Enable WLAN.
4.
To disable the selected WLAN security configurations, click the RF Tools
button on the toolbar and select Disable WLAN.
5.
Click Yes in the confirmation dialog to enable or disable the selected
WLAN security configurations.
B-35
Using ProCurve Manager Mobility Module
Monitoring and Configuring WLANs
6.
Monitor the status, display the summary if desired, and then click Close.
The Summary is especially useful when determining why an action failed.
Add/Delete WLAN Configuration
The Add and Delete WLAN Configuration function is used to add or delete a
WLAN security configuration on the 420 Access Points (software version 2.1.0
or greater) and 520 Access Points only.
To Add a WLAN Configuration:
1.
2.
Navigate to the WLANs tab (for a 420 or 520 Access Point).
a.
Select a wireless group or device in the navigation tree.
b.
Click the WLANs tab.
Click the Add WLANs button in the toolbar to display the Add WLAN
Configuration window.
Figure B-17. Mobility Manager, Add WLAN window.
3.
Type in the SSID (1-32 ASCII characters).
The remaining fields in the Add WLAN Configuration screen vary, depending
on the capabilities of the devices you select.
B-36
Using ProCurve Manager Mobility Module
Monitoring and Configuring WLANs
4.
In the SSID Description field, type a brief description identifying the
WLAN configuration. This field is disabled if the selected device does not
support it. Also, the maximum length of the description is determined by
the selected devices.
5.
In the VLAN ID field, use the drop-down list to select the VLAN used for
the WLAN configuration.
6.
To use VLAN tagging, check the VLAN Tagging checkbox. I
f VLAN tagging is enabled, management traffic is sent tagged with the
VLAN ID, and received management traffic must be tagged with the VLAN
ID. If you select tagging, ensure the selected device supports tagging and
that it is enabled on the device. Depending on the device, if VLAN tagging
is disabled, management traffic can be untagged and all other WLAN
traffic can be tagged.
7.
In the WLAN Index field,
•
Click the Automatic radio button to automatically assign the first
available WLAN index number, or
•
Click the Manual radio button to manually enter a specific index
number.
8.
If you elected to manually assign the WLAN index, use the WLAN Index
arrow to select the index number (possible numbers vary depending on
the device) you want to assign to the WLAN configuration.
The lowest valid number for the selected devices is displayed. The range
of valid index numbers is determined by the selected devices.
9.
Click OK to apply the WLAN configuration, OR
Click Cancel to exit the window without saving the configuration.
To Delete a WLAN:
A primary WLAN security configuration cannot be deleted. Therefore, this
feature can only be used for radios with more than one SSID.
1.
Navigate to the WLANs tab (for a 420 or 520 Access Point).
a.
Select a wireless group or device in the navigation tree.
b.
Click the WLANs tab.
2.
Select the WLAN security configurations to be deleted using standard
windows conventions.
3.
Click the Remove WLAN Security Configuration button.
4.
Click OK to confirm the deletion.
5.
Monitor the status, display the summary if desired, and then click Close.
B-37
Using ProCurve Manager Mobility Module
Monitoring and Configuring WLANs
The WLAN security configuration is removed from the list on the WLANs tab.
For more information on configuring ProCurve managed APs for VLANs and
configuring WLAN Security, please refer to the Management and Configuration Guide or User Guide for your ProCurve wireless access point.
Enable/Disable Inter-station Blocking
Use Enable/Disable Inter-Station Blocking to enable or disable inter-station
blocking (station-to-station direct communication) on one or more selected
WLANs. For WLANs on devices where inter-station blocking is set at the
system level, inter-station blocking is enabled or disabled on the system
containing the selected WLAN and applies to all other WLANs on that system.
1.
Navigate to the WLANs tab.
a. Click a wireless group node in the navigation tree.
b. Click the WLANs tab.
2.
Select the WLAN(s) for which you want to enable or disable inter-station
blocking. You can filter the display for a specific SSID by selecting the
SSID from the SSID Filter list.
3.
Click the inter-station blocking button on the toolbar to select the blocking
option.
4.
•
To enable inter-station blocking on the selected WLANs, click the
Enable Inter-Station Blocking button.
•
To disable inter-station blocking on the selected WLANs, click the
Disable Inter-Station Blocking button.
When the confirmation dialog appears, click Yes to enable or disable interstation blocking on the selected WLANs.
The confirmation dialog notifies you if one or more WLANs will apply
inter-station blocking system-wide (because inter-station blocking is set
on the device at the system level).
The radio Properties tab reflects the current setting, Enabled or Disabled.
B-38
Using ProCurve Manager Mobility Module
Setting Global Preferences for Mobility
Setting Global Preferences for Mobility
To configure Mobility global preferences:
1.
Navigate to Tools–>Preferences–>Mobility to display the Mobility Global
Preferences window.
Figure B-18. Mobility Manager, Global Preferences
2.
In the Interval field, type the interval (in minutes) to wait between collecting RF neighbor and station data from managed Access Points and Radio
ports. Enter 0 (zero) to disable RF neighbor data collection. You can also
click the up or down arrow to increase or decrease the interval.
3.
Check the Infrastructure checkbox to generate an event in PCM when a
new infrastructure radio is discovered.
4.
Check the Ad-hoc checkbox to generate an event when a new ad-hoc radio
is discovered.
(Ad-hoc means radios discover other radios within range to form a
network that can connect computers directly together without the use of
an access point.)
5.
Click Ok to save your changes and exit the window.
Click Apply to save your changes and leave the Preferences window open.
Click Cancel to exit the window without saving changes.
B-39
Using ProCurve Manager Mobility Module
Setting Global Preferences for Mobility
B-40
C
ProCurve Manager Events
PCM Trap Events
The following table lists Trap events that can occur in the PCM Event Log.
Trap Type and description
Severity
Generic Traps (Standard Traps from all devices)
Link up, port number %1
Informational
Link down, port number %1
Minor
Device has crashed or the power plug has been removed
Major
Device has been rebooted as a result of a warm start
Warning
SNMP Authentication falied
Minor
Loss of EGP Neighbor
Warning
RMON Related Trap (Standard Traps from all devices)
%2 is above threshold %5; value = %4. (Sample type = %3; alarm
index = %1)
Critical
%2 fell below threshold %5; value = %4. (Sample type = %3;
alarm index = %1)
Critical
Intruder detected
Critical
Fault Finder Traps (HP Specific)
A port that is configured for 10Mbps-only mode has a 100Mbpsonly link plugged into it
Minor
Loss of stacking member error
Major
Redundant power supply Fault
Minor
Mis-wried cable detected
Minor
Repeater loop or problem cable detected
Minor
High collision or drop rate (formerly overbandwidth)
Major
Network loop detected
Major
C-1
ProCurve Manager Events
Meshing fault
Major
Lost connection to multiple devices
Minor
A fan error has occurred
Minor
Excessive late collisions (formerly cable length/repeater hops)
Minor
Excessive broadcasts (formerly broadcast storm)
Critical
Excessive jabbering (formerly problem XCVR/NIC)
Minor
Too many undersized/giant packets (formerly problem driver/
NIC)
Warning
Excessive CRC/alignment errors (formerly problem cable)
Minor
A primary backup link port has failed and the switch/hub has
transitioned to its secondary port
Informational
A hot swap of transceiver blade is detected
Minor
Transceiver misconfigured
Warning
An Unauthorized node is detected connected on switch
Critical
Fault Finder Traps for 9300 Series
Lock address violation on Port %d with MAC Address %s
Minor
Power supply failed, error status %d
Minor
Power Supply %d, %s, failed
Minor
530 Traps (Wireless Access Point 530 specific, not yet supported)
sysSystemUp
sysSystemDown
sysRadiusServerChanged
sysConfigFileVersionChanged
dot11StationAssociation
dot11StationReAssociation
dot11StationAuthentication
dot11StationRequestFail
dot11InterfaceBFail
C-2
ProCurve Manager Events
dot11InterfaceAGFail
dot1xMacAddrAuthSuccess
dot1xMacAddrAuthFail
dot1xAuthNotInitiated
dot1xAuthSuccess
dot1xAuthFail
localMacAddrAuthSuccess
localMacAddrAuthFail
pppLogonFail
iappStationRoamedFrom
iappStationRoamedTo
iappContextDataSent
sntpServerFail
POE Traps (HP Specific POE Traps)
Power delivery status has changed to %s for port %d
Informational
Power usage for slot %d is below the set threshold. Value is %s.
Major
Power usage for slot %d has exceeded set threshold. Value is
%s.
Major
Connect Rate Traps (HP Specific)
%1 has been flagged by the connection rate filter. Action taken
= %2. VLAN ID = %3
Critical
Series 700s Traps (Series 700 Specific)
Administrator authnetication failure at %1
Minor
An event occurred of the type %1 and status is %2
Minor
Fail over to IPAddress %1
Minor
%1 fan is down
Minor
%1 fan is Up
Minor
Temperature of the CPU is %1 degree centigrade
Minor
C-3
ProCurve Manager Events
PCM Application Events
The following table lists application events that can occur in PCM.
C-4
Application Events
Severity
Category
Error binding to port 162, cannot have multiple binds on one port
Major
Event Manager
Error binding to port 514, cannot have multiple binds on one port
Major
Event Manager
Client Login Failure
??
Login Manager
No new updates available for download
Minor
Automatic Updates
Automatic Update Status
Minor
Automatic Updates
Updates applied successfully
Minor
Automatic Updates
Failed to apply updates
Minor
Automatic Updates
Updates applied. Failed to start Traffic services
Minor
Automatic Updates
Failed to stop Traffic services. Update aborted.
Minor
Automatic Updates
Unable to download index file
Minor
Automatic Updates
Unable to download updates
Minor
Automatic Updates
CIP Syntax Error
Warning
Configuration Integration
User-action policy complete
Warning
Configuration Integration
Unable to retrieve firmware versions for <device ip>
Informational
Software Update
Device information retrieved successfully
Informational
Software Update
Update complete, ready for reboot
Informational
Software Update
Intermediate image update completed, device rebooting
Informational
Software Update
Update completed, device rebooting
Informational
Software Update
<ip address> Error <status>
Major
Software Update
Firmware version information retrieved
Informational
Software Update
<ip address> Update in progress
Informational
Software Update
<ip address> Transfer complete
Major
Software Update
<ip address> Aborted, wrong file
Major
Software Update
Software update schedule status changed (to waiting, updating,
completed, or rebooting)
Informational
Software Update
Software update schedule changed to error
Major
Software Update
New Software update schedule added
Informational
Software Update
New schedule ignored, previous is currently running
Informational
Software Update
ProCurve Manager Events
Software update schedule removed
Informational
Software Update
Successfully downloaded software index file
Informational
Software Update
Unable to download software index file from the HP website
Major
Software Update
Unable to extract software image <file name>
Major
Software Update
<segment> utilization value XX% > critical threshold XX% (Segment
setting)
Major
Traffic Manager
<segment> utilization value XX% > warning threshold XX%
(Segment setting)
Warning
Traffic Manager
<segment> Frames/Sec value XX > critical threshold XX (Segment
setting)
Major
Traffic Manager
<segment> Frames/Sec value XX > warning threshold XX (Segment
setting)
Warning
Traffic Manager
<segment> Broadcasts/Sec value XX > critical threshold XX
(Segment setting)
Major
Traffic Manager
<segment> Broadcasts/Sec value XX > warning threshold XX
(Segment setting)
Warning
Traffic Manager
<segment> Multicasts/Sec value XX > critical threshold XX
(Segment setting)
Major
Traffic Manager
<segment> Multicasts/Sec value XX > warning threshold XX
(Segment setting)
Warning
Traffic Manager
<segment> Errors/Sec value XX > critical threshold XX (Segment
setting)
Major
Traffic Manager
<segment> Errors/Sec value XX > warning threshold XX (Segment
setting)
Warning
Traffic Manager
<segment> utilization value XX% > critical threshold XX% (Ethernet
setting)
Major
Traffic Manager
<segment> utilization value XX% > warning threshold XX%
(Ethernet setting)
Warning
Traffic Manager
<segment> Frames/Sec value XX > critical threshold XX (Ethernet
setting)
Major
Traffic Manager
<segment> Frames/Sec value XX > warning threshold XX (Ethernet
setting)
Warning
Traffic Manager
<segment> Broadcasts/Sec value XX > critical threshold XX
(Ethernet setting)
Major
Traffic Manager
<segment> Broadcasts/Sec value XX > warning threshold XX
(Ethernet setting)
Warning
Traffic Manager
<segment> Multicasts/Sec value XX > critical threshold XX
(Ethernet setting)
Major
Traffic Manager
C-5
ProCurve Manager Events
C-6
<segment> Multicasts/Sec value XX > warning threshold XX
(Ethernet setting)
Warning
Traffic Manager
<segment> Errors/Sec value XX > critical threshold XX (Ethernet
setting)
Major
Traffic Manager
<segment> Errors/Sec value XX > warning threshold XX (Ethernet
setting)
Warning
Traffic Manager
Started enforcing Policy, <policy name>
Informational
Policy Manager
Finished enforcing Policy, <policy name>
Informational
Policy Manager
Get subnet mask failed for starting device <ip address>. Warning
check SNMP community names for <ip address>
Informational
Discovery
<ip address>, device unreachable warning
Informational
Discovery
<ip address>, device is reachable
Informational
Discovery
<ip address>, device is unreachable
Informational
Discovery
added trap receiver failed for <ip address>, max entries reached
Informational
Discovery
trap receiver added successfully for <ip address>
Informational
Discovery
Starting device has not been specified
Informational
Discovery
Starting NNM synchronization as requested by PCM client
Informational
PCM-NNM
NM SNMP Synchronization is complete. Next schedule for NNM
SNMP Synchronization is <dat/time>
Informational
PCM-NNM
Starting NNM database mining as requested by PCM client
Informational
PCM-NNM
NNM database mining is completed. NNM database will be next
mined at <date/time>
Informational
PCM-NNM
NNM database mining is in progress, ignoring restart request
Informational
PCM-NNM
NNM SNMP Sychronization is in progress and ignoring the restart
request by PCM client
Informational
PCM-NNM
RADIUS Sever <ip address> is not responding
Major
User Manager
D
Glossary
The following terms and definitions are used in this book, and in other
ProCurve Management Software documentation.
Access Policy An IDM access policy group consists of one or more rules that govern the login
Group: times, devices, quality of service, bandwidth, and VLANs for users assigned to
the access policy group.
Access Profile: An IDM access profile sets the VLAN, quality of service, and bandwidth (ratelimits) applied when a user logs in and is authenticated on the network.
Ad Hoc: In ad-hoc wireless networks, a series of stations operate in slave mode with
no base station running in master mode. Also referred to as Independent Basic
Service Set (IBSS), these stations can communicate directly with each other.
AES: Advanced Encryption Standard (AES) is a block cipher that has a fixed block
size of 128-bits and a key size of 128, 192, or 256-bits.
Alert: An alert notifies you when certain types of events occur that meet the alert's
filter criteria.
ARP: Address Resolution Protocol (ARP) is a procedure by which TCP/IP devices
obtain MAC addresses corresponding to a desired IP address. The originator
emits a broadcast requesting the MAC address of a specific IP address, and
the responder returns a packet containing its MAC address. RARP - Reverse
Address Resolution Protocol performs the converse - obtains IP addresses
from provided MAC addresses.
BOOTP: Bootstrap Protocol (BOOTP) is a protocol used primarily on TCP/IP networks
to configure workstations.. DHCP is a later boot configuration protocol that
uses this protocol.
BSS: Basic Service Set (BSS) in the IEEE 802.11-1999 Standard is the basic building
block of an IEEE 802.11 wireless LAN. The most basic BSS is two stations in
IBSS mode. In infrastructure mode, a basic BSS consists of at least one station
and one access point. However, in infrastructure mode, groups of BSSs can
be abstracted as an ESS when the BSSs share a common Network Name or
SSID.
BSSID: Basic Service Set Identifier (BSSID) is the wireless MAC address of a detected
access point.
D-1
Glossary
CHAP:
Challenge Handshake Authentication Protocol (CHAP) is an authentication
protocol used by a remote access client to send its authentication credentials
to a remote access server in a secure form.
CIP: Configurable Integration Platform
Client: A client is a computer running an application that interacts with another
program running on a server.
Community Name: A community name defines authentication and access control between an
SNMP agent and a management station. This name is placed in SNMP messages sent between SNMP-managed devices.
Credentials: Credentials are a set of information that includes identification and proof of
identification used to access local and network resources (e.g., user names
and passwords).
Database: The database, a storage location for events, is allocated a specific size. When
the database is full, the oldest events are replaced by new events.
Default Gateway: A default gateway for the TCP/IP protocol is the IP address of a directly
reachable IP router.
Device: A device is a networking computer that includes the hubs, bridges, switches,
routers, protocol analyzers, or other LAN components in a network.
DHCP: Dynamic Host Configuration Protocol (DHCP) is software that assigns IP
addresses to devices without a permanent IP address. DHCP allows a finite
number of IP addresses to be reused quickly and efficiently by many clients.
DNS: Domain Name System (DNS) is a process and model by which IP addresses
are correlated to a naming convention or "friendly name". DNS servers typically provide a resolution service providing an IP address when a requester
supplies a host name.
Domain: A domain is a group of computers and devices on a network that are administered as a unit with common rules and procedures. Within the internet,
domains are defined by the IP Address. All devices sharing a common part of
the IP address are said to be in the same domain.
EAP: Extensible Authentication Protocol (EAP) is built on a public-key encryption
system to ensure that only authorized network users can access the network.
In wireless communications using EAP, a user requests connection to a WLAN
through an AP, which then requests the identity of the user and transmits that
identity to an authentication server such as RADIUS. The server asks the AP
for proof of identity, which the AP gets from the user and then sends back to
the server to complete the authentication.
D-2
Glossary
End Node: An end node is a device such as a computer that is directly attached
to a hub or switch. End nodes, in Hewlett-Packard's terminology, are known
by their station addresses only, not by an IP or IPX address.
Enforcement: Enforcement of a policy performs the actions defined in the policy, usually in
specific devices or device groups.
Filter: A filter defines one or more conditions required to issue an alert, or display
an event. Filtering is a process that screens incoming information for certain
characteristics, allowing only a subset of that information to pass through.
Fragmentation Fragmentation threshold sets the minimum packet size that can be fragThreshold: mented. Fragmentation of the PDUs (Package Data Unit) can increase the
reliability of transmissions because it increases the probability of asuccessful
transmission due to smaller frame size.
FTP: File Transfer Protocol (FTP) is a part of the TCP/ IP suite of Internet protocols.
It is software that lets users download files from a remote computer to their
computer's hard drive.
Gateway: A gateway device allows equipment with different protocols to communicate
with each other. It is a conceptual or logical network station that interconnects
two otherwise incompatible networks, network nodes, subnetworks, or
devices. Gateways perform a protocol-conversion operation across a wide
spectrum of communications functions or layers.
Global Toolbar:
The Global Toolbar, which is located across the top of the PCM window,
contains buttons that act as shortcuts to PCM functions.
GVRP: GARP VLAN Registration Protocol (GVRP) is a protocol designed to propagate
VLAN information from device to device. A single switch is configured with
all VLANs in the network, and other switches learn those VLANs dynamically.
HP: Hewlett-Packard
IBSS: Independent Basic Service Set (IBSS), the most basic type of IEEE 802.11
wireless LAN, is commonly referred to as an ad-hoc network. An IBSS can
consist of as few as two stations. Unlike infrastructure mode, all stations are
capable of communicating directly with each other.
IGMP: Internet Group Management Protocol (IGMP) is a protocol used by Internet
hosts to report their multicast group memberships to any immediately-neighboring multicast routers. It is required to be implemented by all hosts wishing
to receive IP multicasts. Multicast protocols are important for VLANs, or when
you are trying to reduce or limit broadcast traffic on a network.
D-3
Glossary
Infrastructure In infrastructure wireless networks, a basic BSS consists of at least one station
network: and one AP.
Ingress Filtering: Ingress filtering manages traffic flow entering your network to prohibit externally initiated inbound traffic to unauthorized services.
IP Address: An IP address consists of the network ID and a unique host ID, typically
represented with the decimal value of each octet separated by a period (for
example, 15.241.125.60)
IV: In cryptography, an initialization vector (IV) is a block of bits that is required
to allow a stream cipher or a block cipher executed in any of several streaming
modes of operation to produce a unique stream independent from other
streams produced by the same encryption key, without having to go through
a (usually lengthy) re-keying process.
Kerberos: Kerberos is a computer network authentication protocol that allows individuals communicating over an insecure network to prove their identity to one
another via a trusted third party. Kerberos prevents eavesdropping or replay
attacks, and ensures the integrity of the data. It provides mutual authentication (both the user and the service verify each other's identity).
LDAP: Lightweight Directory Access Protocol, an Internet protocol used to look up
contact information from a server.
Local Subnet: A Local Subnet is a LAN that interconnects a variety of devices within a small
area. The local subnet might connect computers on adjacent desks or within
a department. A local subnet ends at a router or a gateway.
MAC: Media Access Control (MAC) address is a data link-layer address that is unique
for each node on a LAN. MAC addresses consist of a 12-digit hexadecimal
number and are designed to be unique and contain a code identifying the
manufacturer of the network adapter or interface within the beginning of the
address.
MD5: Message-Digest algorithm 5 is a cryptographic hash function with a 128-bit
hash value. MD5 is used in a wide variety of security applications and is also
can used to check the integrity of files.
MIB: Management Information Base (MIB) is a coded, hierarchical description of
the SNMP objects that a device supports. A MIB is used by the SNMP agent
and SNMP manager to communicate. In common usage, SNMP agents and
managers support standardized MIBS that contain information offered by
most managed devices.
D-4
Glossary
Network A network resource is a server or a protocol to which you want to grant or
Resource: deny access (for example, a server running financial data that can be accessed
by financial personnel only). Also referred to as ACLs in other ProCurve
documentation.
NNM: HP OpenView Network Node Manager (OV-NNM) is a network management
platform created and distributed by Hewlett-Packard. HP Toptools for OpenView NNM integrates TopTools with NNM.
Node: A Node is a device with a network address that is the source or destination of
traffic on a network.
OV-NNM: HP OpenView Network Node Manager (OV-NNM) is a network management
platform created and distributed by Hewlett-Packard. HP Toptools for OpenView NNM integrates TopTools with NNM.
PCM: ProCurve Manager (PCM) is an advanced Windows-based network management tool that provides administrators with easy-to-use screens for configuring, updating, monitoring, and troubleshooting ProCurve devices.
Ping Sweep: During discovery every device in the subnet is sent a ping, and the devices
respond to the ping. This response is used to "discover" the device and identify
its status.
Policy: A policy is a set of actions performed (enforced) at a scheduled time, usually
on specific devices or device groups.
Pre-shared Key: A shared secret authentication key sent before other credentials such as a
username and password. Pre-shared (PSK) key mode requires each user to
enter a passphrase to access the network. The passphrase may be from 8-63
ASCII characters or 64 hexadecimal digits (256 bits).
RADIUS: Remote Authentication Dial-In User Service (security).
Read Access: Permissions that govern the community name's ability to read data on a device
RMON: Remote Monitoring (RMON) is an extension of the SNMP standard. RMON
provides for use of SNMP in monitoring detailed network traffic information.
A network traffic capture utility or network probe typically uses RMON to
collect statistics and packets for later analysis by a central monitoring console.
RSSI: Received Signal Strength Indication (RSSI) is a measurement of the strength
of a received signal in a wireless environment, A value of 1 indicates the
minimum signal strength detectable by the wireless card, while 0 indicates no
signal.
D-5
Glossary
SNMP: Simple Network Management Protocol (SNMP) is an industry standard protocol for managing network devices, such as hubs, bridges, and switches.
SNMP is a collection of specifications for network management that includes
the protocol itself, the definition of a database, and associated concepts.
SNMP minimizes network traffic and firmware code size and allows control
of retry rates and reporting of detected events, using SNMP traps.
SSID:
A Service Set Identifier (SSID) is a code (32 alphanumeric characters maximum) attached to all packets on a wireless network to identify each packet
as part of that network. All wireless devices attempting to communicate with
each other must share the same SSID. SSID also serves to uniquely identify a
group of wireless network devices used in a given service set.
STP: Spanning Tree Protocol (STP) is the IEEE bridging standard that includes
spanning tree. In a switched/bridged environment, you cannot have loops in
the topology. If you have designed loops for the sake of redundancy, then the
switches/bridges must all adhere to the same spanning tree standard (e.g.,
IEEE 802.1d) to properly break the link forming the loop, until such time that
link is needed.
Subnet Address: A Subnet Address is an extension of the IP addressing scheme that allows a
site to use a single IP network address for multiple physical networks.
Subnet Mask: A Subnet Mask is a value that tells a device the total length of the IP address
chosen for the IP network (and subnetwork) fields and the total length of the
IP address chosen for the host field. The subnet mask does this by designating
network and subnetwork fields within the IP address as 1's and the host field
as 0's.
Tagged Frame: A VLAN-tagged frame is a basic MAC data frame with a four-byte VLAN header
inserted between the SA and Length/Type fields.
TCP/IP: Transmission Control Protocol/Internet Protocol (TCP/IP) is the Routable
Network and Transport layer protocols that have become the defacto standard
for the Internet and most heterogeneous networks.
Telnet: Telnet provides DEC VT100, DEC VT52, or ANSI emulation interface to many
hardware devices such as network hubs, switches, and routers. The interface
uses a connection-based service of TCP and usually connects via port 23.
TKIP: Temporal Key Integrity Protocol (TKIP) is a security protocol used in Wi-Fi
Protected Access (WPA) to replace WEP without replacing legacy hardware.
TKIP, like WEP, uses a key scheme based on RC4, but unlike WEP, TKIP
provides a message integrity check, a re-keying mechanism, and ensures that
every data packet is sent with its own unique encryption key. TKIP also hashes
the initialization vector values with the WPA key to form the RC4 traffic key.
D-6
Glossary
TLS: Transport Layer Security, a successor of Secure Sockets Layer (SSL), is a
cryptographic protocol that provides secure communications on the Internet.
TLS provides endpoint authentication using cryptography. Typically, only the
server is authenticated. However, mutual authentication is available with PKI
deployment to clients. The protocols allow client/server applications to communicate in a way designed to prevent eavesdropping, tampering, and message forgery.
Tree: A Navigation Tree contains selectable links (e.g., devices and PCM functions)
and nodes (folders) containing related links. These links are used to access
PCM functions. Click the link to access its primary screen/function, or rightclick the link to access related functions.
VLAN: A Virtual Local Area Network (VLAN) is a location independent broadcast
domain. A VLAN is like the standard definition of a LAN without the physical
constraints. These VLAN domains are a collection of workstations that are
part of the same logical, working community but not likely part of the same
physical community. The goal of VLANs is to allow for complete mobility and
flexibility of workstation placement, yet keeping cross domain broadcast
traffic to a minimum.
WebAgent: The WebAgent is the web server application that provides device management
information to remote requesting web browsers. WebAgents may reside with
a device's firmware, or as a program running within the operating system of
a computer.
WEP: Wired Equivalent Privacy (WEP) is a security protocol for wireless local area
networks (WLANs) that uses the stream cipher RC4 for confidentiality and
the CRC-32 checksum for integrity. Standard WEP uses a 40 bit key, to which
a 24-bit initialization vector (IV) is concatenated to form the RC4 traffic key.
WEP is used at the two lowest layers of the OSI model - the data link and
physical layers. Therefore, it does not offer end-to-end security.
Wizard: A Wizard is a Windows application that automates a multi-step procedure.
WPA: Wi-Fi Protected Access (WPA) is a Wi-Fi standard that authenticates users and
uses the temporal key integrity protocol (TKIP). User authentication uses the
extensible authentication protocol (EAP). EAP is built on a public-key encryption system to ensure that only authorized network users can access the
network. TKIP scrambles the keys using a hashing algorithm and, by adding
an integrity-checking feature, ensures that the keys haven't been tampered
with.
Write Access: Permissions that govern the community name's ability to write data on a
device
D-7
Glossary
(This page is intentionally unused)
D-8
Index
A
Acknowledge events 5-6
ACL Details 7-17
Action types 13-40
Add Subnets 3-32
Add WLANs B-36
Adding User Accounts 2-19
Administrator 2-19
AES B-34
Alert Configuration 13-43
Alerts 6-48
AP Scan B-14
application menus 2-12
Architecture 1-6
Auth Status 7-15
Auth Type 7-14
authorized IP managers
precedence over other security 6-7
Authorized Managers 6-7
auto port setting 11-26
automatic device registration 2-31
B
blocked port
from IGMP operation 11-26
bridge filtering B-38
broadcasts 8-12
BW Limit 7-16
C
CDP discovery 3-2
Channel Selection B-14
CLI Credentials 6-29
CLI Settings for PCM 6-27
CLI Wizard 9-18
client password 2-33
Client permissions 2-33
client-server authentication 2-33
Communication Parameters in Devices 6-14
Communication Parameters in PCM 6-13, 6-23
Config Manager action 13-40
Configuration
detail 9-9
history 9-10
label 9-11
Configuration export 9-41
Configuration Manager 9-2
Scan Preferences 9-54
Configuration Manager preferences 9-53
configuration policy 13-2
Configuration, import 9-43
Configurations
compare 9-12
manual scan 9-3
Configurations tab 9-8
connection-rate filter 12-2
connection-rate filtering
activation 12-2, 12-4
benefits 12-2
blocked host 12-3, 12-4, 12-9
blocked host, re-enable 12-3
event log notice 12-3, 12-9
guidelines 12-6, 12-7
notify and reduce 12-3, 12-9
notify only 12-3, 12-9
operation 12-3
options 12-3
port setting change, effect 12-4
reboot, effect 12-4
re-enable blocked host 12-4
routed traffic 12-2
sensitivity level 12-3, 12-6
signature recognition 12-2
SNMP trap 12-3, 12-9
switched traffic 12-2
throttle 12-5
trigger 12-2, 12-4
VLAN delete, effect 12-4
Console Access 7-3
Console Authentication 7-3
Content Variables 13-43
Current Credentials Report 15-15
D
Dashboard 2-10
Index–1
Data Synchronization
Device List A-11
SNMP A-11
Database User A-5
Database User Management A-5
dedicated management VLAN 11-14
default gateway 3-20
default VLAN 11-2
definition 3-2
Delete device 3-22
Delete event 5-6
Delete WLAN B-37
Deploy Wizard 9-14
Detected Neighbors B-20
Device Access 7-2
Device access 6-39
device access 6-13
Device Access Security Report 15-15
Device Access tools 6-2
Device Attributes 13-45
Device Configurations 9-8
Device Discovery, with NNM A-8
device groups 10-3
Device Help 2-35
Device List Synchronization A-11
Device Log Viewer 6-51
Device Manager 6-2
Device Manager action 13-41
Device Properties
Live view 2-17
static view 2-17
Device properties 2-16
device properties 2-17
Device re-classification 3-25
Device Status 2-10
Devices List 2-16
Disable radios B-13
Discovery
CDP and FDP 3-2
default gateway, Starting device 3-20
delete 3-22
devices found 3-2
exclude 3-22
include device 3-24
intervals 3-29
Manual process 3-6
starting device 3-21
status 2-11, 3-4
Index–2
subnets 3-31
E
Enable Radio B-13
Enable radios B-13
End Nodes 2-14
Event browser 5-3
Event Browser Configuration 5-10
Event details 5-5
Event Preferences
ignore list 5-12
event-based alert 13-21
Events archive preferences 5-10
Events summary 2-10
Events, with NNM A-9
Exclude device 3-22
Export Configurations 9-41
F
FDP discovery 3-2
FIltering syslog events 6-53
Find Node 3-16
Find node 4-10
firewalls 2-34
Firmware 9-57
Firmware update status 9-62
Firmware Update Wizard 9-58
Firmware Updates
delete 9-63
firmware updates 9-58
Firmware versions 9-57
forwarding port, IGMP 11-26
frames 8-12
friendly radio B-23
G
gauges, colors described 8-4
Generate Report 13-45
group, remove device 10-13
Groups 10-3
add devices 10-5
delete 10-14
modify 10-8
GVRP Port 7-13
H
Hierarchical map 4-6
Home 2-9
I
IGMP
benefits 11-24
port states 11-26
Ignore events 5-12
Import Configuration 9-43
include device 3-24
Interconnect Devices 2-14
inter-station blocking B-38
Inventory 2-11
IP Discovery, NNM A-9
IP Managers 6-7
K
Key pairs 6-44
L
Labels 9-11
LACP
monitoring static trunk 7-6
Learn-Mode 7-15
License Software 9-47
Live view 2-17
Logging scan results 9-54
M
MAC Lockout 7-18
Management community name 6-33
Manual Discovey 3-6
Manual scans 9-3
Maps
device information 4-11
find node 4-10
hierarchical 4-6
layout options 4-6
Legend 4-8
radial tree 4-6
subnets 4-5
Toolbar icons 4-10
tools 4-10
tree layout 4-6
VLANs 4-5
meshed ports, monitoring 7-6
Mirror Port 7-7
Mobility Manager B-2
Mobility Preferences B-39
Modify Subnets 3-33
Modifying User Accounts 2-21, A-7
monitoring meshed ports 7-6
monitoring port 7-6, 7-7
monitoring, port 7-6
multicast 8-12
MyProCurve device registration 2-31
N
Navigation 2-14
Network Inventory 2-11
network monitoring
traffic overload 7-6
Network Node Manager A-2
NNM Events A-9
no contexts defined 2-34
Node search 3-16
node-to-node path 3-18
O
OpenView A-2
Operator 2-19
OV-NNM A-2
P
password
authorized IP managers, precedence 6-7
Password Policy Compliance Report 15-14
Passwords 2-19
Path trace 3-18
PCM 1-3
PCM Client 1-6
PCM Client, installing 2-2
PCM database A-5
PCM device access 6-13
PCM Server 1-6
PCM Services 2-32
PCM toolbar 2-12
PCM+ 1-4
Index–3
PCM-NNM Synchronization A-11
Setting Intervals A-12
Ping Sweep settings 3-21
Policy
Action 13-4
Alerts 13-4
Sources 13-4
Targets 13-4
Times 13-4
Policy Actions 13-30
Policy configuration 13-5
Policy History 13-16
Policy Manager action 13-43
Policy, Mac Lockout 13-45
Pollings Policy 13-45
port
auto, IGMP 11-26
blocked, IGMP 11-26
forwarding, IGMP 11-26
monitoring, static LACP trunk 7-6
monitoring, VLAN 7-6
state, IGMP control 11-26
Port Access 7-2
Port Access Security Report
15-15
Port Access tab 7-14
Port assignments 7-11, 11-21
port mirror 7-6
Port Security 7-2
port security
authorized IP managers, precedence 6-7
Port Settings actions 13-44
Port Traffic 8-14
Port-access 7-4
port-based access control
authorized IP managers, precedence 6-7
Preferences
device access 6-39
SSH Keys 6-44
Preferences, configuration 9-53
Preferences, mobility B-39
Preferences, Switch software 9-55
Primary image 9-59
primary server 2-5
Proxy settings 9-56
Public Key Authentication 6-44
Index–4
Q
QoS 7-15
R
Radial Tree map 4-6
Radio Channels B-18
Radio Details B-7
Radio Ports tab B-11
Radio transmission power B-17
Radio Trust level B-22
Radios B-6
Radios tab B-6
RADIUS
authorized IP managers, precedence 6-7
RADIUS Secret keys, configuring B-35
Re-classify device 3-25
Re-discover device 3-5
Registration, for devices 2-31
Regulatory Compliance Reports 15-2
Remove Subnets 3-33
Report Action 15-7
Report Delivery 15-12
Report format 15-12
Report Heading 15-6
Report Policy 13-45, 15-7
Reports 2-18
Reports menu 15-2
Reports Wizard 15-3
RF neighbor detection B-14
RF scan B-14
RMON
alerts 6-48
RMON Manager 6-47
rogue B-23
Rollback Actions 13-13
S
Schedule-driven alert 13-26
Secondary image 9-59
Secure Copy 9-54
Security History Report 15-14
Security Report Types 15-14
Select PCM Server 2-5
sFlow sampling 8-2
SNMP access 6-42
SNMP Community Name, NNM A-9
SNMP Data Synchronization A-11
SNMP settings for PCM, 6-24
SNMP Synchronization, NNM A-11
SNMP V2 Credentials 6-25
SNMP V3 6-13
SNMP V3 Credentials 6-26
Software Unlicensing 9-50
Software update 9-57
software updates 9-57
software, auto-updates 9-58
Sorting device lists 2-15
SSH Access 7-3
SSH Authentication 7-4
SSH Credentials 6-30, 6-41
SSH Key 6-44
Starting device 3-20, 3-21
Static view 2-17
Station Links B-24
statistics polling 8-2
Status bar 2-11
subnet discovery 3-31
Subnet maps 4-5
Substitution List 13-43
Switch software versions 9-55
synchronize VLAN name 11-12
Synchronizing device lists, NNM-PCM A-11
Syslog
Acknowledge events 6-53
Delete event 6-53
Syslog events filter 6-53
T
TACACS
authorized IP managers, precedence 6-7
Telnet Access 7-3
Telnet access 6-40
Telnet Authentication 7-3
Telnet credentials 6-29
Telnet Password 6-41
thresholds 6-48
Times
changing 13-20
delete 13-20
properties 13-19
TKIP B-34
TLS 8-29
Toolbars
map 4-10
Top Connections 8-12
Top Destinations 8-12
Top Protocols 8-12
Top Sources 8-12
Top Talkers 8-11
Trace Path 3-18
Traffic Gauge 8-7
Traffic Launching Service 8-29
Traffic metrics display 8-8
traffic monitor
color of gauges 8-4
description 8-2
troubleshooting 8-28
Traffic Overview 8-6
traffic sampling 8-2
Traffic Status 2-10
Traffic tab 8-6
traffic thresholds 8-19
Traffic, configure thresholds 8-19
Traffic, data logging 8-23
Traffic, events 8-24
Traffic, Line Speeds 8-21
Traffic, manual mode 8-21
Traffic, Preferences 8-25
Traffic, Rx-Tx 8-10
Traffic, sampling algorithm 8-18
Traffic,automatic sampling 8-18
Traffic,Port Summary 8-14
Traffic,Statistics Tab 8-14
Tree map 4-6
Trust flag B-22
Trusted B-23
U
Unknown Devices 2-14
unlicense software 9-50
user sessions 7-16
Users
adding 2-20
deleting 2-21, A-7
editing 2-21, A-7
utilization 8-12
V
Viewer 2-19
Index–5
Virus Throttle 12-2
VLAN
dedicated management 11-14
port options 7-12, 11-4, 11-8, 11-22
primary 11-14
VLAN map 4-5
VLAN Name
synchronize 11-12
VLAN Properties 11-16, 11-17, 11-18
VLANS
deleting 11-15
static,dynamic 11-14
VLANs
add device 11-10
create 11-6
definition 11-2
listing 11-3
modify 11-9
modify ports 7-12, 11-22
modify support 11-16
port assignments 7-11, 11-21
primary 11-14
remove device 11-13
VT 12-3
VT, Configuration 12-6
VT, filter 12-3
VT, rules 12-4
VT, sensitivity 12-3
W
warranty 1-ii
Web Help 2-35
WebAgent Credentials for PCM 6-32
WEP B-33
Windows Events, traffic 8-29
Wireless Device Information B-4
Wireless device manager B-2
Wireless Properties B-10
Wireless Radios B-6
WLAN Assignments B-9
WPA Pre-Shared Key B-34
WPA PSK, configure PSK key B-34
WPA-PSK B-34
X
XRMON 8-2
Index–6
© Copyright 2007 Hewlett-Packard
Development Company, L.P.
May 2007
Manual Part Number
5990-8850