1
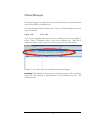
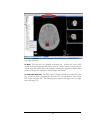
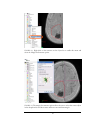
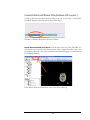
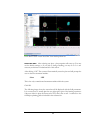
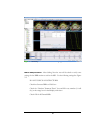
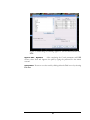
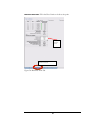
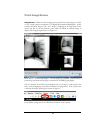
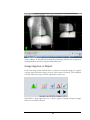
3
Manual
VIRTUAL RADIATION ONCOLOGY CLINIC (VROC) V1.1
Radiation Oncology Training
Resident User
Manual (v.1.1)
Virtual Radiation Oncology Clinic
Resident User manual
1
Chapter
Getting Started
Virtual Radiation Oncology Clinic – getting started guide
T
he Virtual Radiation Oncology Clinic is designed to provide an opportunity to
practice and care for a variety of patients that the resident may not have the
opportunity to care for in the clinical setting. Additionally, for novice users it
provides a save way for the user to see the entire radiation process and to
receive feedback about the quality of care that they give. Chapter 1 is designed as an
introduction to the Patient Manager application of Aria and to review documents and
to determine if there is a role for radiation in the care of the patient that they have been
assigned.
Overview of Software
The VROC system takes advantage of many of the Varian™ software modules that
are available in the Version 10 software. Since the software is windows based, most of
the modules can be fun from the START menu on Windows. Also, the software has
many of the same menu items that will be familiar to the user.
Helpful General Tools:
Hover over any icon and the title of the icon will be displayed.
The help menu is available on most screens and is searchable.
Most features have multiple ways to find – Either through the menu at the top of the
page or by Right Clicking on different items included within the software.
There are often many different Tabs in different screens and the menu items
sometimes change depending on what Tab you are on. You may have to look over the
whole page to become familiar with the different locations.
Windows Login for VROC
Login: admin
Pass: VARIAN01
2
The following is a list of the Software modules that will be used:
On one of the ARIA workstations:
Patient Manager – the patient EMR
Time Planer – scheduling module
RT CHART – radiotherapy record
Offline Review – radiotherapy image review
Image Manager – A platform to review various images associated with a patient.
On Eclipse workstations:
RT CHART – radiotherapy record
Eclipse – image review & treatment planning
3
Patient Manager
The patient manager is essentially the patient record and contains all of the information
that has been added to the patient chart.
For initial startup the trainee should be able to log into the Patient Manager and review
various documents.
Login: train
Pass: train
Once you have logged into the system, there are a number of tabs that are available to
review. Figure 1.1 illustrates where to look for the different tabs. While this is
designed to emulate a clinic, some of the features may not have had data entered.
FIGURE 1.1 The various tabs that are available in the Patient Manager.
The radiation oncology consult, the pathology reports, and the radiology
reports will all be included in the Documents tab and available for review. The
consultation note.
Documents:
4
2
Chapter
Image Review
T
here are a few options for image review that are available. If the user is familiar
with some of the features of the Varian™ software they are welcome to use
those features. The instructions below are for new users and describe a
method that will work for image review within the Eclipse™ treatment
planning system.
Launch Eclipse Software
Double click on the icon for the External beam planning software to launch Eclipse.
At the upper left corner is a patient selection tool. This will open a menu that will
allow the user to search for the patient you wish to open.
Login: Train
Pass: Train
Launch Contouring Tab (bottom left corner)
See the photo below for specific items to look for in the contouring tab and in the
image dataset.
On the left hand upper corner arrow indicates the various images that can be selected
for view. To select a specific image set click on the image (i.e. MRI1) and drag into the
viewing pane.
The middle of the left-hand screen you will see the word “REGISTRATION” This
will indicate of certain datasets have been registered to the primary CT data set. To
review the registration or the images overlaid on top of each other click on the word
“REGISTRATION”. IN the bottom right hand corner is a metronome with a slider
to change between the primary dataset and the secondary dataset for viewing purposes.
5
FIGURE 2.1 To view different images a list of images will be displayed in the upper left
corner. The middle section shows images sets that have been registered to the primary
dataset and in the lower left corner will be contours and/or treatment plans that have
been created.
To change datasets,
One may need to drag and drop multiple datasets at a time into
the viewing window. Additionally, this may take some practice at selecting the
registration file vs the images themselves.
To turn off contours,: If contours are displayed over the top of the image, the user can
click on the boxes next to the contours to turn them off. The box at the top of the
contour list controls all contours in the list.
6
3
Chapter
Contour & Prescription
This section describes contouring specific for the VROC training
module and also highlights specific contouring tools available in the
Eclipse™ Software.
T
o begin the treatment planning process there is a specific workflow that will
work well for the VROC system. This workflow is highlighted at the
beginning of this chapter, and if followed by a description of different
contouring tools available within the Eclipse software. The resident it welcome
to contour more structures if they wish, but for the specifics of the VROC exercises
only the CTV and the PTV structures are required. A comparison of the structure
volumes and comparison to the faculty radiation oncologist contours will be given as
feedback and learning during this phase of the training.
Launch Eclipse Software
Double click on the icon for the External beam planning software to launch Eclipse.
At the upper left corner is a patient selection tool. This will open a menu that will allow
the user to search for the patient you wish to open.
Login: Train
Pass: Train
Launch Contouring Tab (bottom left corner)
See the photo below for specific items to look for in the contouring tab and in the
image dataset.
A set of structures is shown in the left hand column. To turn on or off structures
select the checkbox. Any structure that is selected will also show up on the image set
even if there is no checkbox.
Select the CTV object in the contour list and Enable the contouring tool (contouring
toolbar is circled on the images.
7
FIGURE 3.1 Contouring toolbar is selected. The CTV structure is selected. The Pen
tool object is selected.
To Draw:
The pen tool is the simplest contouring tool. It allows the user to click
around the area to drop points and create a contour. Once a contour is closed, the pen
will also allow the user to click on the structure and drag it to expand or collapse. More
features of the pen are described in Varian Eclipse user manual.
The PTV object is already included in the object list at the
left. In order to create a margined PTV from the CTV, the user needs to select on the
PTV object and right click. The following menu options will appear once you right
click. (See image 3.2).
To create PTV from CTV:
8
FIGURE 3.2 Right click on the structure on the object list to enable this menu and
select the Margin for Structure option.
FIGURE 3.3 The margin for structure option allows the user to select the source object
in the dropdown list and then create uniform or non-uniform margin.
9
Once the CTV and PTV objects are created, the
resident/trainee should save their work, and proceed with entering a prescribed course
of treatment (see chapter4).
Contour Finalization:
Prescription Form
In order to provide opportunity to specify enough information to develop a treatment
plan a prescription form is available on the Eclipse treatment planning desktop.
Clicking on the Prescription form Icon will open a web-available form that can be
filled in with all of the appropriate information for treatment planning. The submit
button at the bottom of the form will upload the information for the VROC review.
You will receive a report comparing your data entry to that of the original attending
physician for compare. A sample of the VROC form is include below.
For more information on appropriate doses and treatment schema the user is referred
to the NCCN website (www.NCCN.org) for more information. Also additional
resources can be found through the radiation oncology wiki at
(www.wikibooks.org/wiki/Radiation_oncology)
10
11
4
Chapter
Initial Plan (if applicable)
In order for the VROC system to compare intent of the plan an
initial prescription must be entered. Because the prescription is only
saved as part of a treatment plan, the user must also enter a single
beam plan and calculate dose.
T
o compare the planning goals of the trainee after doing the contouring the
resident is also expected to be able to add a single beam and blocks if that is
required for the treatment plan.. There are many advanced features of
planning that can be used if the user wishes; however the goal here is not to
train on treatment planning, but rather to just be able to understand the treatment
planning process as well as to be able to evaluate treatment plans. More advanced
topics are covered in the resources referenced at the end of the chapter for users
wishing to spend more time. For the VROC system, please follow the following
instructions.
Launch Eclipse Software
Double click on the icon for the External beam planning software to launch Eclipse.
At the upper left corner is a patient selection tool. This will open a menu that will
allow the user to search for the patient you wish to open.
Login: Train
Pass: Train
Launch Contouring Tab (bottom left corner)
Review the contours that were completed in Chapter 3. The contours should include a
“BODY” or “EXTERNAL” (already added by the simulation director, and at least a
CTV and/or PTV. Any other contours for normal structures will already be included
but the resident and/or trainee is welcome to modify and change any contours of their
choosing.
12
Launch External Beam Tab (bottom left corner)
On the toolbar select the Menu Item Planning at the top of the screen. A dropdown
list will be displayed, select the option “Insert New Plan”
FIGURE 4.1 External Beam tab at bottom of Screen
the menu item at the top of list (FIGURE 4.2)
that will allow you to insert a new treatment plan. This is required in order to get to the
prescription panel and is also good experience for understanding the overall workflow
for treatment planning.
Add an initial treatment plan; Select
FIGURE 4.2 Select the Insert Menu item on the menu at the top
13
FIGURE 4.3 Select “Insert New Plan” from the dropdown list.
After selecting new plan – plan properties will come up. You may
use the default settings, or if you wish to change anything you may do so. It is not
necessary at this time to understand all of this section.
Select New Plan:
After clicking “OK” The system will automatically create the plan and will prompt the
user to select the treatment machine.
Select
23IX
This is the only commissioned treatment machine within the system.
Click OK:
The following image shows the screen that will be displayed with the field parameters.
It is not necessary to actually plan the case, although as part of the learning experience
if the user wishes to place the beam on the PTV that is fine as well. A reference to the
full Eclipse planning guide is included in the reference list.
14
FIGURE 4.4 Initial treatment plan parameters page.
,The field parameters include gantry and collimator angles. These
will actually be used for planning, but are simply a place-holder for the prescription
panel to be displayed.
Once you are happy with the parameters select “OK” to
complete. You will now see a single AP treatment field in place on the selected dataset.
Field parameters:
The planning goal doses should be included as part of the plan.
This is done by typing in a prescription in the prescription tab. See figure 4.5 for the
Dose Prescription panel. Note: you should still be in the EXTERNAL BEAM tab.
Initial Prescription:
FIGURE 4.5 The Dose Prescription panel at the bottom of the page
15
The user must fill in items displayed in ORANGE in the Dose
Prescription panel. The Dose/Fraction (Gy) and/or the Total dose. The system will
calculate either the Total dose or the number of fractions so that it is consistent. There
is no need to worry about the plan normalization or any other fields within this panel.
Prescription:
In order for the dose and new plan to be saved it is necessary to
calculate initial dose. This is performed by selecting the Calculate Volume icon at the
top of the screen (multi-colored icons) See figure 4.6 below. The plan should calculate
normally and if there is any problem please contact the Simulation Director.
Calculate the Beam:
FIGURE 4.6 Volume Calculation button at top of screen
Save Plan:
Save the plan by selecting the Disk icon, or by selecting file Save.
In order for the VROC system to compare the Resident contours
and the initial RX, the trainee/resident must export the patient. On the File menuselect
Export Patient:
FileÆExportÆPatient: Use the default directors and simply click through the Next
Screens until the files are exported. The file can be saved in the default directory where
it will be picked up for the contour comparison and RX comparison software.
The user will receive a notice via email about the contour comparison as
well as the RX comparison. The comparisons are to an expert or the attending who
managed the patient care.
Feedback:
16
5
Chapter
Plan Evaluation
One of the major skills that we want to be able to provide practice
is the independent review and selection of treatment plans.
T
he goal of the plan comparison and plan review section of the training is to
provide the resident/trainee with an opportunity to see a few different
treatment plan options and to learn some of the tools for comparing plans.
As with the other modules of the VROC system there are additional Eclipse
tools for treatment planning and planning evaluation that will not be covered within
this manual, but the reader is directed to other resources and helpful tools within the
RESOURCE section of this chapter. The specific instructions are outlined so that the
patient can be properly evaluated and prepped for treatment delivery. A set of
planning metrics will be calculated and sent to the resident comparing the plan they
select to a plan that was used clinically.
Launch Eclipse Software
Double click on the icon for the External beam planning software to launch Eclipse.
At the upper left corner is a patient selection tool. This will open a menu that will
allow the user to search for the patient you wish to open.
Login: Train
Pass: Train
Evaluation of Plans
Open the patient and the course that contains the treatment plans you wish to review.
The easiest way to evaluate multiple plans is with the Plan
Evaluation tool. Plan Evaluation is the tab at the bottom of the screen and opens up a
multi-window view.
Plan Evaluation:
To open multiple plans the user can select the plan in the upper left
corner and drag the plan into whichever window they want to use. See figure 5.1 for a
diagram of the different areas of the screen.
Compare plans:
17
FIGURE 5.1 Plan evaluation tool. The tab in the bottom section is the plan evaluation
panel. The top left menu indicates the treatment plans that are available – they can be
dragged into the different imaging panes. Tabs labeled Fields, Dose prescription;
Dose settings can be used to evaluate different aspects of the plan.
To scroll the images slices the user can use the mouse wheel
or use the up and down arrows. To turn on certain isodoses check on the Evaluation
menu at the top of the page.
Review Image Slices:
To review the dose volume histogram Select Evaluation
menu and select Show Dose volume Histogram View. The DVH will be displayed in
the lower section of the window. The Dose Statistics tab at the bottom panel in the
window can be used to turn on or turn off structures. In order to show any panel as
full screen select the “screen” icon in the top right corner of the box you wish to view
at full size. Figure 5.2 illustrates the DVH panel alongside the axial slices of the
treatment plan.
Dose Volume Histograms:
18
FIGURE 5.2 Evaluation panel with the DVH page shown.
In the Dose Statistics panel you can sort the objects by any of
the headers at the top of the screen. You can also display max dose and min dose for
different structures. The DVH values for the same object but the different plans will
be displayed with the same color and different symbol. For example in Figure 5.3
shows the DVH values for the Tumor Volume (PTV) in yellow with different
symbols. By reviewing the panel at the bottom of the screen the user can select the
check box to turn on or off. In the Plan section it will show you which treatment plan
is associated with that curve.
DVH display options:
19
FIGURE 5.3 Dose-Volume Histogram illustrated for spinal cord and for PTV for 4
different treatment plans.
Plan Approval
Once the trainee is satisfied with one of the plans that is
illustrated they are expected to “approve” that plan so that it can be prepped for
treatment delivery. In order to approve the plan the user is expected to select the plan
in the plan list at the upper left corner and Right Click on the plan they wish to
approve. Select the Plan Approved from the Dropdown list and select Planning
Approved.
Selecting Plan to approve:
A box will come up stating which Contours are not
approved – Click NEXT and the following screen related to the couch shifts that will
be applied for treatment. The resident can click the Use Values calculated from
user origin to populate the couch parameters to be used for the couch for the
treatment delivery. (FIGURE 5.4)
Couch Setup parameters:
20
Figure 5.4: Couch parameters screen when Planning Approval is selected.
After clicking Next the user will be asked to verify some
settings for the DRR creation as well as the SSD. Use the following settings See Figure
5.5:
DRR & SSD parameters:
DO NOT CHECK ANY STRUCTURES
Check the Generate DRRs to Fields box
Check the “Calculate Treatment Times” box and fill in any number (1.0 will
do), in the orange box for the Multiply with factor.
Check OK for all Planned SSDs.
21
Figure 5.5 Final Settings for Planning Approval – Do not select structures for
DRR
After completing the Couch parameters and DRR
screens, select Next and Approve the plan by typing the password for the trainee
account.
Approve Plan - Signature:
Save patient:
Be sure to save the work by clicking either the Disk icon or by selecting
File Save
22
Optional: Patient Export
FileÆExportÆPatient: Use the default directors and simply click
through the Next Screens until the files are exported. The file can be saved in the
default directory where it will be picked up for the contour comparison and RX
comparison software.
Export patient:
Turn on all structures of interest for all plans within the DVH Dose
Statistics window. Make sure that the plan is set for vertical axis as “Ratio of Total
Structure Volume (%) and that the horizontal axis is set for total dose (Gy). Export the
DVH as a Table by selecting FileÆExportÆDVH in Tabular Format
Export DVH:
Select the DVH folder and save with the patient name.
Optional: Treatment Prep (RT Chart).
From the menu at the top select the Quick links and then select
EMRÆ RT Chart
Quick Links:
The RT Chart application will launch
Scheduling Tab:
Right click on plan and select Fill Plan
Add any scheduling you need to complete imaging (if you have image guidance fields –
need to select the check box that says “Show Sequence Image Scheduling” and
populate the type of imaging under the specific field. By selecting the field and right
clicking you can select KV AP and KV Lateral, or CBCT.
Fill in the per Week and the per Day and the Interval days and any delay that is
scheduled.
23
To add Imaging fields check Show
Sequence checkbox.
Right click on TX plan in Yellow
bar and select Fill Plan
Scheduling tab at bottom of the
page
Figure 5.6: Scheduling Tab within RT CHART.
Figure 5.7: Scheduling Tab within RT CHART.
24
Reference Point Tab:
Fill in the Dose Limits to the dose calc point.
Complete
the Dose
Limits
Reference Point Tab
Figure 5.8: Reference Point Tab
25
To check the field parameters go to the parameters tab. Fill in some
initial couch values in for Couch VRT and Couch LNG (defaults of 10 or 100 are
good).
Parameters Tab:
Select a “Tol. Table” if it is not already filled in.
Enter a Tolerance
Table and fill in Table
values
Figure 5.9: Parameters Tab
Reference Point Tab: Once all of the parameters are ok go back to the reference point tab and select the
Approve Plan button
Figure 5.9: Parameters Tab
26
Import/Export Tab:
The plan can be exported only from this panel. These files are
required in order to build the various files for the treatment delivery. Select FileÆ
ExportÆ Wizard while in this tab. Select the correct settings for the file export and
then push the file to the default location.
Figure 5.10: Import Export Tab
Figure 5.11: Export Wizard
27
Select
Structure
Set & Image
slices ad 3D
dataset
Select
include
Images but
DO NOT
select
structures
Figure 5.12: Export Wizard Settings
Continue clicking next through all of the windows until the images are sent.
28
6
Chapter
Treatment Review
On treatment verification is performed either daily or at least
weekly depending on the imaging requirements requested by the
physician.
T
reatment verification is performed at least the resident/trainee with an
opportunity to see a few different treatment plan options and to learn some of
the tools for comparing plans. As with the other modules of the VROC
system there are additional Eclipse tools for treatment planning and planning
evaluation that will not be covered within this manual, but the reader is directed to
other resources and helpful tools within the RESOURCE section of this chapter. The
specific instructions are outlined so that the patient can be properly evaluated and
prepped for treatment delivery. A set of planning metrics will be calculated and sent to
the resident comparing the plan they select to a plan that was used clinically.
Patient Manager
The patient manager section of the software is the patient’s electronic medical record.
It contains a synopsis of all of the details of the patient treatment
Login: Train
Pass: Train
Once searching and selecting the patient of interest, the resident should review the
patient chart and documents again to make sure the patient meets all of the guidelines
and that the treatment is proceeding as expected. The dose to date is displayed in the
middle right hand section (circled in on Figure 6.1). If there are any problems please
contact the simulation director. The arrow in the picture points to the button to start
the “Offline Review” Software to review images.
29
FIGURE 6.1: Patient manager allows review of the patient chart. The user may also
launch the Offline Review from within this application.
Offline Review
If the Offline review is selected from within the patient
manager software, the patient chart remains open and the images that are available for
review are for this specific patient. Figure 6.2 shows the work list that will be displayed
if there are images to review. If the works list doesn’t display you can select it from the
Review menu at the top of the patient.
From Patient manager:
If Offline review is launched from the desktop, the user will need to
search for and select the patient that they wish to review. There are also some settings
to create work lists of images that are available so that the user will receive notification
for images that are new are ready to review. Figure 6.2 shows the work list that will be
displayed if there are images to review. If the works list doesn’t display you can select it
from the Review menu at the top of the patient.
From Desktop:
30
FIGURE 6.1: Patient manager allows review of the patient chart. The user may also
launch the Offline Review from within this application.
The work list will display all of the images that have been taken on the
patient and the status of the images. To select an image double click on the image on
the list and that image will be displayed.
Work list:
Orthogonal Image Review
If the image set is a set of orthogonal images the offline review will
display it as a fused images set with both of the images on screen at one time (One on
left – one on right). Figure 6.2 illustrates the image review screen when orthogonal
images are presented. Features that are identified are the Crosshair tool, the image
registration tool, and the image selection window.
Image review:
31
See Insert
with enlarged
toolbar view
Crosshair
View Tool
.
FIGURE 6.3: Patient review selection and crosshair selection.
Image
Registration
Tool
Image Registration: If the image registration tool is activated, the bottom right of the
screen will indicate different options. If you hover the curser over any icon in any
window the system will indicate what the tool is used for. To approve the images the
Green Check is clicked and the user can type in their password.
32
CBCT Image Review
Image Review: If the image set that is available to review is from a CBCT dataset a
fused CT scan will be displayed indicating the CBCT scan overlaid on the Treatment
CT where the image was upon completion of the Alignment process. See Figure 6.4
for an example of a poor image registration. The toolbar at the top acts the same as it
did for the orthogonal images such that the image registration tool can be selected and
the images re-positioned. Once image registration is activated the user can switch
between the position of the CBCT as it was originally taken and also where the
registration was finalized.
FIGURE 6.4: Image registration for CBCT images. The same tool bar is available for
all image registration.
33
Portal Image Review
Unlike the other imaging review methods the portal image is a review
of only a single image in comparison to a Digitally Reconstructed Radiograph. In this
situation the portal image or the “new” image is displayed in the large panel in the
screen and also on the left bottom corner, while the DRR or reference image is
displayed in the upper right corner. See Figure 6.5
Image Review:
FIGURE 6.5: Portal Image display. For this image, the crosshair is turned and the
portal image (center & bottom right) is correlated to the DRR (Upper Right).
One tool that may be useful for portal image review is to change to a side-by-side view
that is set by changing the views button circled in the image below. If the 2 panel view
is selected the images will display as shown in Figure 6.7
FIGURE 6.4: Image review tool bar with the windows views selected.
34
FIGURE 6.7: Portal Image display. Side by side view with DRR on Left and Portal
image on Right. In this particular example the portal image indicates that the patient is
mis-aligned about 4cm in the Superior/inferior direction.
Image Approve or Reject
In all of the image review methods there is an option to accept the image as is, request
a change (either shift and re-image or other), and to mark as reviewed. These different
tools are indicated in Figure 6.8 with explanations of the icons.
FIGURE 6.8: Image approval icons – Check is approve, Triangle is request Change,
and Eye is to mark as reviewed.
35
RESOURCES
A Detailed description of each of the contouring tools is found in Eclipse, External
Beam User manual that can be found at My.Varian.com. Or in the VROC training
manual folder under RESOURCES
Sample exercises for using the different contouring tools can be found in the
Contouring Exercises that is also located within the VROC training manual folder
under RESOURCES
36
7
Chapter
Resident Feedback
The utility of various feedback throughout the VROC training is
to assist the trainee in grasping concepts and evaluating the quality
of the care compared to standard treatment values.
Assesment of the competency for different tasks that are completed within the VROC
system are accomplished by use of sets of metrics to help to evaluate the user’s ability.
These are given at different stages of the training process. In some situations early in
the treatment process (for example during planning), if an error occurs, this error may
not be transmitted throughout the entire patient treatment, and the user will receive
feedback and an opportunity to make the correction. Other issues that could arise in
the course of a VROC patient treatment may cause problems but will be allowed to
progress through the normal course of treatment to help to illustrate the importance of
diligence in chart and image review.
Contour Evaluation
After the contouring phase (Chapter 3) the user will be presented with a set of metrics
that correlate to their contours for the target volumes compared to the expert
contours.
The following values are calculated: Volume, % area of PTV not included, Volume of
normal tissue irradiated, and Dice’s similarity index.
For most normal tissues the contours will not be different and most of the data will be
presented as 0.0.
Two sample contour report tables are shown below.
37
Contour Comparisons: For a palliative Spine Case
Spine Training Case
Name of Structure
spine ctv
cord
carina
Dice Similarity
0.613
0.642
0.845
Expert Volumes (cc)
2.382
38.286
14.454
Trainee Volumes (cc)
5.357
21.097
11.474
% of Target Missed
0.469
50.226
24.178
Normal Tissue included (cc)
2.986
2.041
0.514
Prostate Contour Analysis: Patient Doe, John Prostate
Prostate Training Case
Name of Structure
ptv78gy
prostate
sigmoid
0.864
0.873
0.969
Expert Volumes (cc)
194.708
107.207
91.2
Trainee Volumes (cc)
179.632
109.207
88.322
% of Target Missed
16.943
11.885
4.635
Normal Tissue included (cc)
17.913
14.741
1.349
Dice Similarity
Prescription Comparisons
The prescription comparison is a simple table with the list of your entered prescription
information alongside the expert prescription information.
Plan evaluations
For the plan evaluation a number of different treatment planning metrics will be
calculated. These same metrics will be calculated at the end of the treatment and if any
errors or issues arise in the course of the treatment, those will be accounted for within
the scoring. Normal treatment variations (up to 1cm) will not be accounted for and the
38
planning metrics that are reported will be assuming the treatment plan is delivered as
intended.
For the normal tissues EUD and NTCP will be calculated. For more information, the
user can look up the following references:
Niemierko A. Radiobiological models of tissue response to radiation in
treatment planning systems. Tumori 1998;84:140Lyman JT. Complication probability as assessed from dose-volume
histograms. Radiat Res Suppl 1985;8:S13-19.
Luxton G, Keall PJ, King CR. A new formula for normal tissue complication
probability (NTCP) as a function of equivalent uniform dose (EUD). Phys Med
Biol 2008;53:23-36.
For the target tissues the EUD and percentage coverage will be calculated.
For the overall plan, the combined normal tissue complication (NTCPtot ) will be
presented. This will be a percentage indicating the overall combined probabilities of
risk of injury. When no contours are given, this value will be less helpful in indicating a
change in the treatment plan. Also, the difference between the overall risk in the
planned treatment and the given treatment will be presented as a change in NTCPtot
The overall treatment plan conformity (J) is calculated as the Intercept of the PTV and
the prescribe dose over the union of both. This is a measure of how well the
prescription dose matches the target volume
|
|
,
|
|
If for some reason in the treatment of the Virtual patient and error occurs. The user
expected to be able to conduct a root cause analysis of that error. In doing so the user
should evaluate the plan relative to the severity of that error. In the current version of
the system the scoring system that is used is taken from the Medical physics
publication:
Ford EC, Fong de Los Santos L, Pawlicki T, et al. Consensus
recommendations for incident learning database structures in radiation
oncology. Med Phys;39:7272-7290.
Two separate error reporting scales are used for this recommendation, one is based on
dose and the other is based on medical consequences. They are reproduced below for
reference:
39
Dosimetric Severity Score
Score
Dosimetric Scale
9/10
>100% absolute dose deviation from
the total prescription for any structure
>25-100% absolute dose deviation from
the total prescription for any structure
>10-25% absolute dose deviation from
the total prescription for any structure
>5-10% absolute dose deviation from
the total prescription for any structure
<5% absolute dose deviation from
the total prescription for any structure
Not Applicable
7/8
5/6
3/4
1/2
…
Consequence Severity Score
Score
10
8/9
Consequences (actual or predicted)
Premature death
Life threatening - intervention essential.
8
7
Possible recurrence due to under dose
Permanent major disability
(or grade 3/4 permanent toxicity)
5/6
Permanent minor disability
(grade 1/2 permanent toxicity)
3/4
Temporary side effects - Major
treatment/hospitalization
2
Temporary side effects - intervention
1
Temporary side effects - no intervention
0
…
No harm
Unknown
40
EXAMPLE 1:
Patient Name: Spine Demo 1
The patient was treated a total of 15 treatments, but the first 2 treatments had the field
aligned 1 vertebral body superior to intended. The resulting errors are negligible
provided that the cord compression was not on the vertebral body that was missed and
provided there was no re-treatment or match line. Contributing issues to this error
were related to technical issues with the portal imager so it was difficult to verify the
location of the treatment field.
Score Sheet
RX Dose(Gy)
Error: Dose Metric
37.5
0
Error: Severity Metric
% Change EUD Target
% Change OAR Max
Structure for Max OAR
NTCP+ change
Conformity Change
Detrimental Dose (GY*)
0
-0.56%
-4%
Cord
-3.8%
0.00
0.6Gy*
4b. Expanded Score sheet with all OARs
PTV1
Body
Cord
EXPERT
EUD (GY)
42.81
EXPERT
EUD (GY)
24.66
46.14
DELIVERED
EUD (GY)
42.58
DELIVERED
EUD (GY)
24.01
45.69
41
EXPERT
% COV
100
EXPERT
NTCP
0.00
59.9
DELIVERED
% COV
100
DELIVERED
NTCP
0.00
56.1
Example 2:
Error That Occurred: An error occurred in the treatment of a prostate patient. For
the first 2 fractions the patient was setup incorrectly and the field was delivered
approximately 2.5 cm superior and 1.5 cm posterior the intended location.
Patient Name: PROSTATE
Score Sheet
RX Dose(Gy)
Error: Dose Metric
Error: Severity Metric
% Change EUD Target
% Change OAR Max
Structure for Max OAR
NTCP(tot) change
Conformity Change
Detrimental Dose (Gy*)
78
1
0
-1.7%
0.0
N/A
-0.4
0.46
1.4Gy*
Expanded Score sheet with all OARs
EXPERT
EUD (GY)
PTV1
81.15
EXPERT
EUD (GY)
Bladder
52.68
Rectum
59.16
Penile_bulb 32.02
Femur_R
26.59
Femur_L
29.95
Body
37.04
DELIVERED
EUD (GY)
79.77
DELIVERED
EUD (GY)
52.34
58.36
30.07
25.98
29.21
36.32
42
EXPERT
% COV
100
EXPERT
NTCP (%)
0.13
0.79
0.08
0.00
0.00
0.18
DELIVERED
% COV
100
DELIVERED
NTCP
0.11
0.64
0.03
0.00
0.00
0.13
8
Chapter
Resident Root Cause
Analysis
If an error occurs the resident, as the attending physician is responsible to conduct a
root cause analysis. Since in the VROC system there is no team of people who are
treating the patient, these team members are simulated which makes this process
somewhat more difficult to conduct, however, it is still a worthwhile exercise.
The first thing that the resident should do if an error occurs is to gather all of the
information. There will be a few forms that reflect interviews from the therapists
involved in treating the patient that will be available for the resident to review. Once
they have reviewed these forms and evaluated the error using the various metrics that
will be sent to the resident as feedback, the resident can then begin the process of
determining the root cause of the error.
The methodology that will be used for the Virtual Radiation Oncology Clinic is to ask
5 Why questions about each error. Let’s go through the process for a simple example
where One patient Mrs. Smith was called to go into the room (and her information
was loaded on the screen), but a different patient Mrs. Smart came into the room
instead. In this particular situation both patients are being treated to Right Breast and
both patients use the same immobilization devices. Also, the therapists know both
patients and talk with them calling them by their first name but don’t realize that they
have opened a different patient record than the patient who went into the room.
The first thing to do is identify the error: The error in this situation is the wrong
patient was treated. From here, then ask the 5 Whys.
Why was the wrong patient treated? - Patient ID was not compared to the record on
the screen.
Why was the record not verified? - Therapists thought they knew which patient was in
the room.
Why did the therapists think they knew which patient? - Patients have similar names
and similar treatment techniques. and wrong patient answered.
43
Why does wrong patient answer when called? Called patient by last name (similar last
names) – did not have patient state DOB or other identification
Why not use 2 forms of ID? (it is our department policy that 2 forms of ID will be
used for each patient), Therapists feel comfortable that they know the patients,
patients do not like to be asked their DOB every day.
Now that all 5 of the Why’s have been identified, the resident must now look through
the answers to the 5 Why’s and determine which one of these is something that can be
changed. In this example the last thing can be changed – even though patients may
not like to be asked to state their name and the DOB, if it prevents an error, this may
be overcome by explaining to the patient hat this is for their benefit. For this example,
this is a human action and can be changed.
One of the key aspects of the root cause analysis is to come up with some sort of
action plan and measureable outcome to prevent the error from occurring again. As
practice it is important to go through the process of identifying some process
improvements goals. For this particular example an action item could be to require the
therapists to document 2 methods of identification prior to each fraction of treatment.
In order to measure this, the therapists would be required to log this information
someplace, and/or record it in the patient chart. Another aspect may be to require a
different patient education workflow that explains to each patient the importance of
stating their name and DOB each time they come to have a treatment, or this could be
a face photo verification that is conducted prior to treatment. Whatever corrective
measure is chosen the resident will be required to state the timeframe for implementing
and who will collect the data to verify that the corrective measure is being done. In
addition any measureable end goals that are in line with error prevention should be
stated.
The form is available online and an example of this web form is shown below.
https://adobeformscentral.com/?f=3ZBXE%2AQj3ZG2aVo3QnVX1w.
For more information on how to conduct a Root Cause Analysis the user can review
the following webpages.
http://www.institute.nhs.uk/index2.php?option=com_content&task=view&id=2175
&pop=1&page=0&Itemid=4809
www.patientsafety.va.gov
For more information about the type of errors that have to be reported ot the state of
Florida, the user is referred to Florida reporting guidelines.
https://www.flrules.org/gateway/ChapterHome.asp?Chapter=64E-5
44
45
46
47
48
49