1
Using TotalView on HPCx
Adam Carter
January 2004
Contents
1 Overview
1.1 Terminology . . . . . . . . . . . . . . . . . . . . . . . . . . . . . . . .
3
3
2 Features
3
3 How to...
3.1 Compile for TotalView . . . . . . . . . . . . . . . . . . . . . . . . . .
3.2 Run TotalView on HPCx . . . . . . . . . . . . . . . . . . . . . . . .
3.2.1 On a Single Process or Single Core File . . . . . . . . . . . .
3.2.2 On Multiple Processes . . . . . . . . . . . . . . . . . . . . . .
3.2.3 To debug OpenMP codes on HPCx . . . . . . . . . . . . . .
3.3 Use the Process Window to Start and Stop Threads and Processes .
3.3.1 Context . . . . . . . . . . . . . . . . . . . . . . . . . . . . . .
3.3.2 Action Points . . . . . . . . . . . . . . . . . . . . . . . . . .
3.4 Visualise a static 2D array . . . . . . . . . . . . . . . . . . . . . . . .
3.5 Visualise a 2D array that has been dynamically allocated in C . . .
3.6 Visualise 2D allocataable arrays in Fortran 90 . . . . . . . . . . . . .
3.7 Visualise MPI calls . . . . . . . . . . . . . . . . . . . . . . . . . . . .
3.7.1 Some messages are not showing up in the main display and
some processes are shown in grey in the selection pane . . . .
4
4
4
4
4
4
5
5
5
7
7
8
8
4 Observations
9
8
5 Visualising Blocking Communications on HPCx
10
6 MPI Visulisation Case Study–
6.1 An Incorrect Version . . . . .
6.2 A Correct Version . . . . . .
6.3 A Further Incorrect Code . .
10
10
13
16
Message Round a Ring
. . . . . . . . . . . . . . . . . . . . . .
. . . . . . . . . . . . . . . . . . . . . .
. . . . . . . . . . . . . . . . . . . . . .
7 Existing Local Documentation
17
2
1
Overview
These notes describe the program TotalView – a cross-platform debugger produced
by Etnus [1]. There is already a comprehensive user guide [2]. These notes are
intended to complement this guide by providing information specific to HPCx ,
briefly highlighting the important features of TotalView in a concise form, and
providing short descriptions of how to perform various useful operations.
1.1
Terminology
We use the same terminology as TotalView’s documentation wherever possible. In
particular the concept of diving is a common one. Diving is the act of opening up a
variable or function (or whatever else you “dive on”) to obtain more information on
its current state. This is usually performed by double clicking on the name of the
variable or function, or by right-clicking on the variable name and choosing Dive.
2
Features
TotalView can:
Debug serial codes
– C
– C++ (including support for STL with some compilers)
– Fortran
– Fortran90
Debug parallel codes
– In any of the above languages
– MPI
– OpenMP
– Threads
Operate in various modes
– Attach to running process
– Attach to core file
Visualise arrays
– 1D/2D
– Statically/dynamically allocated arrays
Display function call trees
Display MPI messages
– Textual
– Graphical
– Pending Sends
– Pending Receives
– Unexpected Messages
– Generally ONLY for non-blocking communications (see Section 5)
3
3
3.1
How to...
Compile for TotalView
When compiling for TotalView the -g flag should be used so that the debugger
can associate sections of the binary executable with the correspondong lines in the
original source code. Debugging of programs compiled without the -g flag will
present you with Assembler instructions only. You should also avoid using compiler
optimisations, i.e. do not use -O.
3.2
Run TotalView on HPCx
These instructions describe how to interactively debug an executable myprog on
HPCx . All references to myprog should be replaced by the name of your executable.
Ensure TotalView is in your path:
export PATH= PATH:/usr/local/packages/totalview/
3.2.1
On a Single Process or Single Core File
This includes the possibility of running multi-threaded code on a single processor.
tv6 myprog, or
tv6 myprog corefile
3.2.2
On Multiple Processes
This requires setting up an ssh-agent (and ensuring that exactly one ssh-agent
is running on the machine from which you log into HPCx . See [3] for more
information.
Use the runtv script
runtv llfile myprog
where llfile is the normal loadleveler file used when running interactively.
3.2.3
To debug OpenMP codes on HPCx
Normally the OMP NUM THREADS environment variable can be set from inside the
loadleveler script when running interactively; however, because of the way that the
runtv script works, it is necessary to set this environment variable from inside
TotalView.
Start poe from within TotalView with Group (Control) Go.
When prompted, select Yes in the dialogue box to stop the job.
Choose Process > Startup Parameters in the Process window.
In the window that appears, click on the Environment tab and in the box
that appears, enter:
OMP NUM THREADS=n
where n is the number of threads you wish to use by default for a parallel
region. Note that, unlike the line in the loadleveller script, you must not
include the word “export”.
Click on OK.
4
3.3
Use the Process Window to Start and Stop Threads and
Processes
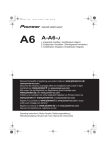
TotalView’s Process Window (see Figure 1) is the larger of the two windows that
appear when you start TotalView. It is the window in which most interaction with
the program takes place. The window includes five panes and a set of controls
along the top, beneath the menu bar. The buttons in this bar have different effects,
depending on what we shall refer to as the context. The context is selected in the
context drop-down menu, which lies directly to the left of the action buttons.
3.3.1
Context
The context defines which processes and/or threads start or stop when the buttons
are pressed. For MPI programs it is usually useful to work with individual processes
(choose the Process context) and for OpenMP programs it is usually useful to work
with an individual Thread. Note that this control is separate from another important
setting which controls how the program reacts when it hits an action point.
3.3.2
Action Points
An action point is entered by clicking on the line number of a line of code in the
process window. When a process/thread reaches this line it performs some action,
usually to stop. This kind of action point is often called a breakpoint. The user can
decide whether to stop the thread, process or group. Note that on some systems it
is not possible to start and stop individual threads. Stopping of threads is possible
on HPCx .
Notes on breakpoints:
A program will stop executing on arriving at a breakpoint, that is, before the
selected line of code is executed.
A breakpoint can usually do one of three things: (i) Stop group (ii) Stop process or (iii) Stop thread. This is a property of the individual breakpoint. Note
that the default value can be set from the Action Points tab of the Preferences dialogue (File> Preferences> Action Points> When breakpoint
hit, stop:) but this value only affects new breakpoints and has no effect
on breakpoints which have already been placed in the program. Note also
that the value of this preference remains from one run of TotalView to the
next (except sometimes when TotalView crashes). The choice of setting for
each breakpoint can be viewed and changed from the properties dialogue obtained by right-clicking on a breakpoint and choosing Properties. Please see
observation 2.
In cases where a compiler reorders instructions during the compilation process,
a single line of code can correspond to several machine code instructions,
which need not be contiguous. When TotalView sees that a compiler has done
this, it silently introduces breakpoints at both places in the machine code
corresponding to the single line of source code. Although TotalView tries
hard to respond sensibly under these conditions, the result of debugging a
code which has been optimised in this way is clearly confusing and should be
avoided wherever possible: Do not use the -O flag when compiling for
debugging!
5
Figure 1: TotalView’s process window.
6
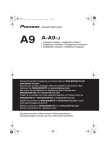
Figure 2: The result of visualising a 2D array with a checkerboard configuration.
Interpolation is performed between neighbouring cells.
3.4
Visualise a static 2D array
These instructions assume that you have run your program to the point where you
wish to visualise the contents of your array, and the process is now halted. These
instructions refer to an array myarray. All references to myarray in the text should
be replaced by the name of your array.
In the Stack Frame pane of the process window dive on myarray
In the window that appears, choose Tools>Visualise
A two-dimensional graphical representation of the data can be obtained by choosing
File>Options in the display menu and unchecking Mesh, Shade and Contour and
clicking on Apply or OK. Note that the 2D representation is not simply a colour map
with a grid of squares coloured appropriately– interpolation is performed between
the centres of neighbouring grid squares to obtain a continous variation throughout
the area of interest. This is illustrated in Figure 2.
In programs which use a data decomposition strategy it is common to find parts of a
large array stored as smaller arrays in different processes. Unfortunately, TotalView
is not able to “glue together” the different parts of the array to allow the user to
visualise it as a single entity.
3.5
Visualise a 2D array that has been dynamically allocated
in C
These instructions assume that you have run your program to the point where you
wish to visualise the contents of your array, and the process is now halted. The
instructions refer to a 2-dimentional array myarray with entries myarray[i][j] where
i runs from 0 to isize − 1 inclusive and j runs from 0 to jsize − 1 inclusive. All
references to myarray in the text should be replaced by the name of your array, and
isize and jsize should be replaced by the size of your array.
In the Stack Frame pane of the process window dive on myarray
Near the top of the window that appears, there is a line that will look something like
(at 0x2ff22920) Type:
int **
(or float **, or double **, depending on the type of your array).
7
Click on Type: int ** and replace int ** with int[isize]*[jsize]* to
tell TotalView the size of your array.
Dive on int[isize]*[jsize]*
Right click on any of the list of indices and values and choose Dive In All
This lists all the entries of the array, much like the list that appears when
you dive on a static array. This array can then be visulaised in the same way:
Tools>Visualise.
3.6
Visualise 2D allocataable arrays in Fortran 90
These “just work”; this section is just included for completeness. Unlike the C
example above, where you need to inform TotalView of the size and shape of the
array, in Fortran 90 you simply dive on the array and then choose Tools>Visualise.
3.7
Visualise MPI calls
TotalView includes a feature called the Message Queue Graph. It is possible
to obtain a graphical representation of the current state of MPI by clicking on
Tools>Message Queue Graph in the process window. This brings up a new
window (like that shown in Figure 3). The main pane in this window will either
display the message “No Message Queue data obtained.” or it will show a set of
yellow (or grey) rectangles containing numbers. These represent the different MPI
processes; the numbers correspond to the process’s rank in MPI COMM WORLD. These
rectangles may be joined by coloured arcs. By default only Unexpected messages are
shown – these are messages corresponding to a send which has no matching receive
posted, or a receive that has no matching send posted. The controls at the top of
the page can be used to select which types of message (Send, Receive, Unexpected )
will be shown. If no messages of the specified types are pending, the window just
displays the aforementioned message to that effect. Messages are colour-coded as
follows:
Send – Green
Receive – Blue
Unexpected – Red
The number by the arc corresponds to the tag given in the MPI call. It is possible to
dive on an arc, by double clicking on it, to obtain more details about the particular
message. There are certain subtleties about which messages are displayed and when
and these are discussed now:
3.7.1
Some messages are not showing up in the main display and some
processes are shown in grey in the selection pane
If a process is in a running or a mixed state (i.e. if any threads in the process are
running) it will appear as grey in the selection pane at the bottom left. Messages to
be recieved by these processes or messages sent by these processes will not be shown.
This is a general limitation of TotalView: it is only able to display information
about stopped processes. On some platforms, however, it is possible to halt the
process and see what operation was blocking at the point the process was halted.
On HPCx this is possible, but only if a certain environment variable has been set.
This environment variable must be set, from inside TotalView, before poe spawns
the processes to be used for MPI. This is done as follows:
8
Start TotalView using runtv as usual:
– runtv myprog.ll myprog
Choose Process > Startup Parameters in the Process window.
In the window that appears, click on the Environment tab and in the box
that appears, enter:
MP EUIDEVELOP=deb
Click on OK.
Click Go in the Process window to start poe under TotalView’s control in the
usual way, answering Yes to the dialogue which asks you if you want to stop
poe.
4
Observations
1. Even with no optimisation flags, the C compiler can keep variable values
in registers. The local variables show up in Totalview but with incorrect
contents. An examination of the registers1 may reveal a register with the
value in question (if this is known, otherwise this is a bit useless!). You can
force a compiler not to “cleverly” do this by declaring the variable as volatile
in the code:
main(){
int volatile mythreadnum;
#pragma omp parallel private(mythreadnum)
{
mythreadnum=omp_get_thread_num();
printf("hello from thread %d\n",mythreadnum);
printf("This is another line!\n");
}
}
2. The best way2 to debug OpenMP codes differs between platforms in the choice
of what a program should do when it hits a breakpoint.
On HPCx , it is best to stop the thread.
On HPCx , threads often don’t like being interrupted when they’re not expecting it, for instance when another thread in the process reaches a breakpoint
and stops the process. This sometimes leads to undefined behaviour. Note
that the choice to stop a thread instead of a process seems to improve stability,
it does not always remove the problem.
3. It really isn’t safe to step into or out of a parallel region or to try to let some
threads run into or out of the region while other threads are held. This leads
to unpredictable behaviour.
1 experience
suggests those named “R3” and “R4”, but any are possible
best I mean the way that is, from my experience, least likely to make TotalView unstable.
It may be that you want to see what happens when processes are stopped, in which case you
should see observation 4 for more comments.
2 By
9
4. Regarding the stability of TotalView when debugging OpenMP programs on
HPCx : I’ve spent a considerable amount of time trying to determine the
conditions under which TotalView becomes unstable. Unfortunately, there are
so many variables to consider that I’ve not been able to draw many concrete
conclusions other than the fact that it is usually better to avoid stopping and
starting processes when working with OpenMP and sticking to the threads
alternative.
5. Most compilers do not store information that lets TotalView determine the
value of parameters and therefore their values are not available in TotalView.
It is not clear why it can’t determine these from the source code. There’s a
(slightly ugly) workaround described in the TotalView user manual on page
259 (PDF Page 279).
5
Visualising Blocking Communications on HPCx
If the MP EUIDEVELOP environment variable is set as described earlier (in Section
3.7.1) for debugging on HPCx , blocking communications can be visualised. There
are however some things to bear in mind:
Only stopped processes can show their messages, so a process has to be halted
during a blocking call and the visualisation display updated before blocking
calls will show up.
Since internally this call uses more than one thread, the state of the system
when you click on Halt is not precisely defined. Subsequent actions can occasionally cause TotalView to hang with the message “Timed out, waiting
for process to settle down”. This shouldn’t happen, but occasionally does. If
you find this is happening often, you should try the following which, from my
experience, increases the stability of TotalView.
– Ensure that program was compiled without any optimisation and tuning
flags.
– Once you’ve stopped a process during a blocking call, restart it where
possible before running other processes.
6
MPI Visulisation Case Study– Message Round
a Ring
In this section we use TotalView to examine a simple MPI program in which a global
sum is performed by passing a message around a ring. Several versions of a program
sumring are examined, one of which has been deliberately written to deadlock.
These are used to illustrate the use of the Message Queue Graph in TotalView which
enables the visualisation of MPI message passing calls. All code, the Makefile and
the batchscript can be found at /usr/local/packages/totalview/examples/.
6.1
An Incorrect Version
The following procedure provides an illustration of the use of the MPI Message
Queue visualisation tool being used with a program that deadlocks.
1. Ensure totalview is in your path:
export PATH= PATH:/usr/local/packages/totalview/
10
2. cp sumring-incorrect.c sumring.c
3. make clean
4. make
5. runtv sumring.ll ./sumring
6. Ensure that Action Point preferences are set to
When breakpoint hit, stop: Process (see Section 3.3.2)
7. Set the MP EUIDEVELOP=deb environment variable as described in Section 3.7.1
8. Choose context Group (Control) and press Go
9. When prompted, choose Yes, i.e. stop the parallel job so that you can insert
breakpoints
10. Insert breakpoints at the MPI Ssend (line 63),
mydata=inbuffer;
the MPI Recv and
11. Advance all the processes to the first breakpoint with Group (Control)Go
12. Open the MPI visulisation tool with Tools>Message Queue Graph. Three
yellow boxes will appear in the bottom-left pane of this window. These correspond to the three processes which where initialised as MPI processes when
they each called MPI Init3 .
13. In the window that appears, make sure that “Send”, “Receive” and “Unexpected” are all checked so that the display shows all of the information
available to it
14. Update the Message Queue Graph window by pressing Update in this window.
The top pane still reads “No Message Queue data obtained.” since no MPI
messages have yet been sent.
15. Start the process that has rank 0 with Process Go 4 . The process will start
and continue to run. It tries to perform a blocking syncronous send and since
rank 1 has not yet posted a receive, the process will stay at this point. The
process however stays running.
16. Update the visualisation window. The yellow box corresponding to rank 0
will turn grey since this process is still running (even though it appears to
be doing nothing) and TotalView cannot display information about processes
that are running.
17. Halt process that has rank 0 with Process Halt.
18. Update the visualisation window. The grey box turns yellow again and the
yellow boxes now appear in the top pane since there are messages to show.
A green arc appears connecting rank 0 and rank 1 illustrating that there is a
pending (i.e. as yet uncompleted) send from rank 0 to rank 1.
19. Use the P+ button to advance to the process with rank 2.
3 Do individual boxes appear as each process calls MPI Init, or does an implicit barrier mean
that they always show up at the same time?
4 Note that TotalView process numbers differ from the MPI Rank. The MPI rank can be seen
in the line of text directly under the buttons in the process window. It is the number after the
point at the end of the first line. You can move between processes with the P+ and P- buttons
towards the right of the tool bar.
11
20. Process Go
21. Update visualisation. Note that rank 2 disappears from the top pane as it
continues to run and try to perform its MPI Ssend.
22. Process Halt
23. Update visualisation. Note that rank 2 reappears5. There is now a green arc
from rank 2 to rank 0.
24. Use Group (Control) Go to restart all of the processes.
25. Update visualisation. Note that when all processes are running, no processes
show up in the visualisation window.
26. Group (Share) Halt (Note that using Group (Control) Halt can lead to
instability in TotalView since it also interupts poe).
27. Update visualisation. Since all three processes have stopped, they all appear
in the top pane. In addition to the three green arcs corresponding to the
MPI Ssends made by each process, there are now a series of red arcs. These
show up when a process decides that it has an unexpected message. An unexpected message to rank i is generally detected by rank i when it next makes
an MPI call, and a send message is considered unexpected if no matching
receive has been posted. Similarly a receive is considered unexpected if there
is no matching send. Note that it is the receiver in the case of a send and the
sender in the case of a receive that notice that a message is unexpected.
28. We have arrived at a state of deadlock – every process is waiting for its send
to be received and the program cannot proceed.
An alternative illustration of unexpected messages can be obtained by proceeding
up to step (but not including) 24 in the procedure above and then continuing as
follows:
24. Use P- to move back to rank 0.
25. ProcessGo
26. ProcessHalt
27. Update visualisation. A red arc appears between rank 2 and rank 0. When
rank 0 is restarted, it “notices” that rank 2 has sent it a message for which no
matching receive has been posted. It therefore marks this message as being
unexpected. Note that since rank 1 has not been run so far, it has not yet
noticed that rank 0 has sent it an unexpected message. This should serve
to reinforce the message of the previous statement that it is the receiver in
the case of a send and the sender in the case of a receive that notice that a
message is unexpected.
5 albeit often in a strange position! If this is the case, the box can be dragged with the mouse
in the usual way
12
6.2
A Correct Version
This section describes the result of using TotalView’s Message Queue Graph on a
version of the program used in the previous section which has been corrected to
remove the deadlock.
1. Ensure totalview is in your path:
export PATH= PATH:/usr/local/packages/totalview/
2. cp sumring-correct.c sumring.c
3. make clean
4. make
5. runtv sumring.ll ./sumring
6. Ensure that Action Point preferences are set to
When breakpoint hit, stop: Process (see Section 3.3.2)
7. Set the MP EUIDEVELOP=deb environment variable as described in Section 3.7.1
8. Choose context Group (Control) and press Go
9. When prompted, choose Yes, i.e. stop the parallel job so that you can insert
breakpoints
10. Insert breakpoints at the MPI Issend (line 63), the MPI Recv, the mydata=inbuffer
line, and the MPI Wait.
11. Advance all the processes to the first breakpoint with Group (Control)Go
12. Open the MPI visulisation tool with Tools>Message Queue Graph. Three
yellow boxes will appear in the bottom-left pane of this window as before.
13. In the window that appears, make sure that “Send”, “Receive” and “Unexpected” are all checked so that the display shows all of the information
available to it.
14. Update the Message Queue Graph window by pressing Update in this window.
15. Process Go
16. Update visualisation. Since the MPI Issend is non-blocking, the process continues, stopping at the next breakpoint. The send shows up as a green arc
between rank 0 and rank 1. Note that the send is synchronous, even though
it is non-blocking so it will not complete (and hence the green arc disappear)
until a corresponding MPI Wait is called.
17. Process Go
18. Update visualisation. The following receive is blocking and so rank 0 will
continue to run waiting for this process to complete. Rank 0 therefore turns
grey in the pane at the bottom left, and since the send belonged to this process
it disappears from the display even though it has not yet completed.
19. Process Halt
20. Update visualisation. When rank 0 is stopped, it can display its messages
once again. The initial send reappears, as does the blocking receive (blue arc)
that was running when the process was stopped.
13
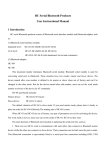
Figure 3: The Message Queue Graph (as it looks after step 23)
21. Select the process with rank 1
22. Process Go
23. Update visualisation. Rank 1 starts up. When it does this, it notices that
there is a send addressed to it, for which it hasn’t yet posted a matching
receive. This send therefore is classed as unexpected, and is shown by a red
arc between 0 and 1. Rank 1’s send shows up as the second green arc (as
shown in Figure 3).
24. Process Go
25. Update visualisation. Rank 1 continues to run, waiting at the MPI Recv. Its
send therefore disappears from the visualisation along with the unexpected
message that it noticed. Note that this reinforces the fact that the unexpected
message ‘belongs’ to rank 1, because this is the process to which it was sent.
26. Process Halt
27. Update visualisation. The send from 1 to 2 becomes visible again. The
receive from 0 to 1 was in progress when the process was halted. Note that
the receive doesn’t complete even though the matching send has already been
posted. This is probably to do with the way in which the synchronous send
is implemented; part of the message passing might be being performed by a
14
thread running in the process with rank 0 and the receive can therefore not
complete until rank 0 has been restarted. This receive (from 0 to 1) therefore
shows up as a blue arc. Even though this receive has not yet completed, it
matches the send from 0 to 1 and so the unexpected message (red arc) is no
longer visible.
28. Select the process with rank 2
29. Process Go
30. Update visualisation. Rank 2 notices that there is an unmatched message sent
from rank 1 (red arc). The send from 2 to 0 shows up (green arc).
31. Process Go
32. Update visualisation. Rank 2 waits at its receive (similarly to above, it
doesn’t show up as having completed, even though the matching send has
been posted). The two messages associated with this process disappear from
the graph.
33. Process Halt
34. Update visualisation. The messages return to the state they were in before
the previous go except for the unexpected message from 1 to 2, which is now
expected, since a receive has been posted. This receive therefore shows up as
a blue arc.
35. Select the process with rank 0
36. Process Go
37. Update visualisation. The receive and send associated with rank 0 disappear
as it continues to run, waiting at its receive.
38. Process Halt
39. Update visualisation. The messages return to the state they were in before
the previous go. Note however, that the work required of rank 0 to complete
the send from 0 to 1 is now performed, and so next time rank 1 runs it will
be able to progress past its receive. Rank 0 is still waiting at its MPI Recv.
40. Select the process with rank 1
41. Process Go
42. Update visualisation. Rank 1 can complete its receive, and the blue arc disappears. Note that the send will not complete until a corresponding MPI Wait
is called, so the green arc remains.
43. Process Go, Go
44. Update visualisation. Rank 1 reaches its MPI Wait. Since the receive has
been posted, the wait completes, and the green arc for the corresponding
send disappears.
45. Process Go
46. Update visualisation. Rank 1 starts a new send, which shows up as a green
arc.
47. Process Go
15
48. Update visualisation. The green arc disappears again while the process waits
at the MPI Wait.
49. Process Halt
50. Update visualisation. The green arc reappears, along with a blue arc for the
receive that was interrupted.
This process can be continued, clicking Process Go until a process blocks at a
receive or a wait then halting it, then moving on to the next process. The resulting
effects are generally straightforward apart from one other unusual effect which can
be observed slightly later in the process. At the stage where the enumerated steps
above end, Rank 0 is waiting at its first wait. The next time you try to advance
this process it will continue to wait, this is because although the sending process
has posted a send, and has been allowed to run since the first send was posted, the
send was posted after the receive. It seems things must happen in this order before
a receive will complete:
Sender announces that it wants to send
Receiver agrees that it can receive
Sender sends message
Receiver receives message
This is a result of the synchronous nature of MPI Issend. A similar procedure can
be followed for a version of the program with MPI Issend replaced by MPI Isend.
On HPCx this is implemented as a buffered send. Using the asynchronous version
of the code (sumring-async.c), a couple of things can be observed:
A process can advance past an MPI Recv straight away, as long as the send
has already been posted. The sending process is not required to run
An asynchronous send can complete before the message has been received.
The only requirement is that the message has been successfully buffered. An
MPI Wait can therefore complete before a message is received, so a send can
disappear from the Message Queue Graph before a receive is posted. It will
remain shown as an unexpected message, once the receiving process runs.
6.3
A Further Incorrect Code
In this section we consider a version of the code which can give both correct and
incorrect results, depending on the order in which instructions are executed. TotalView can be used to consistently reproduce the different possible orders of execution.
This version of the code (sumring-overwrt.c) includes a common mistake– to use
the same buffer for MPI sends and receives. It is instructive to run the code outside
TotalView several times and to see if the result is correct, and consistent. When the
author tried this on HPCx he found that out of 10 runs, 8 of them gave the correct
answer, and the other two runs gave two differenct wrong answers. TotalView can
be useful to debug situations like these where the result depends on the order in
which instructions are executed.
One way to obtain a wrong answer is to procede as follows:
1. Start the program, and introduce breakpoints and advance all processes to
the first breakpoint as before (Section 6.2, up to 11).
16
2. Starting with rank 0:
3. Click on Process Go until the process reaches a point where it continues
to run, and is unable to advance to its next breakpoint. Leave the process
running.
4. Click on the process button to advance to the next process (if you’re already
on the process with rank 2, return to rank 0).
5. Return to step 3
A way to obtain a correct answer is to follow this similar procedure:
1. Start the program, and introduce breakpoints and advance all processes to
the first breakpoint as before
2. Starting with rank 0:
3. Click on Process Go until the process reaches a point where it continues to
run, and is unable to advance to its next breakpoint.
4. Click on Process Halt to halt the process that is running but waiting.
5. Click on the process button to advance to the next process (if you’re already
on the process with rank 2, return to rank 0).
6. Return to step 3
7
Existing Local Documentation
HPCx User Guide [4]
HPCx TotalView FAQ [3]
References
[1] Etnus. See http://www.etnus.com.
[2] Totalview user guide.
See http://www.etnus.com/Support/docs/rel6/
pdf/user guide.pdf.
An
HTML
version
is
also
available
at
http://www.etnus.com/Support/docs/rel6/html.
[3] HPCx TotalView FAQ. See http://www.hpcx.ac.uk/support/FAQ/totalview.
[4] HPCx user guide. See http://www.hpcx.ac.uk/support/documentation/ UserGuide/HPCxuser/Tools.html#SECTION000112000000000000000.
17