1
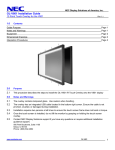
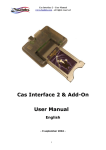
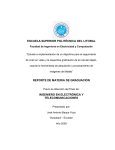
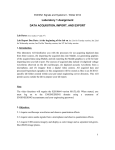
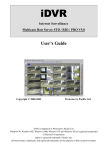
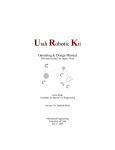
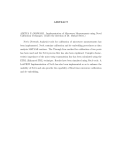
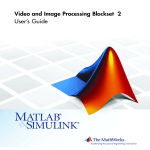
XCam User’s Manual Table of Contents Introduction Quick Tour GUI Functions Running X‐Cam Functions from the MATLAB Command Line Contact Introduction XCam is a MATLAB program created for the NASA‐Olin Research Program 2007. It is intended to be used in conjunction with a webcam that has been modified to see x‐rays. This can be done by gently removing the glass that is attached to the webcam’s CMOS or CCD detector. The four members of the XCam team were: Boris Dieseldorff, Mary Germino, Daniel Sotingco, and Andrea Striz. We are grateful to Professors Gill Pratt and Steve Holt for their help during this project, Professor Jon Stolk for letting us borrow his x‐ray gun, as well as Keith Gendreau, our primary contact at the NASA Goddard Space Flight Center. Quick Tour This tour will take you through some of the more important functions in XCam. Begin by opening up MATLAB and navigating to the directory containing XCam. Then, start the program by typing “XCam”. The XCam program has two panels. The “Functions” panel on the left shows all the functions that you can use to process an AVI movie of x‐rays. The “Raw Data” panel contains the information that the program needs to execute the specified function; this panel will change according to which function is chosen. Click on “Play movie in MATLAB” in the Functions panel. Click “Browse…”, and select “success.avi.” This video was produced in a darkroom with an x‐ray gun from the Olin Materials Science laboratory. Click “OK” to play the movie. It may take some time to load; XCam must first import the AVI file into a MATLAB movie structure. As the image shows, the x‐rays have almost completely filled up the screen. Because the webcam detector is so small, photons from the x‐ray gun are lighting up pixels all over the place. This data is not very useful; however, XCam has a solution! Click on “Process movie with a threshold” in the Functions panel. Then, click the “Browse…” button again (if necessary) to select “success.avi.” Enter 80 for the RGB threshold, and type “processedSuccess.avi” for the output file. Leave the “Color” dropbox as it is. Click “OK,” and wait. It can be useful to run XCam with the MATLAB command line interface in the background; XCam will output statements to the command line when it is finished with each task. Once XCam is done creating the processed movie file, play it again, using either XCam or your favorite media player. A much more useful video should be seen, with a distinct x‐ray spot: Now that XCam has produced a useful video using raw x‐ray data, it is possible to output x‐ray events to an ASCII file. Both the “Write all x‐ray events…” and the “Write centroid data…” functions will do this. Because the processed video still has a large number of lighted pixels, choose the “Write centroid data…” function for now. Choose the “processedSuccess.avi” file, enter 80 for the threshold, and type in whatever file name you want for the output (remember to include the “.csv” extension!). Click “OK” and wait for XCam to finish. There should now be a CSV file in your XCam folder containing lots of data; open it up using Notepad or Microsoft Excel. The file contains three columns, each displaying frame, row, and column for the centroids of the pixel events. This allows you to tell time and position of the x‐rays. GUI Functions Play movie in MATLAB : This converts an AVI file into a MATLAB movie structure and plays it. Process movie with a threshold (threshold.m): If x‐rays simply fill the screen in an AVI file, this is a useful function. All pixels under the specified RGB threshold become black, and the remaining pixels either stay their original color or turn white, according to the color option. XCam then writes the resulting movie to a new AVI file, as specified by the user. Process movie by averaging frames (RunningAverage.m): This function reads an AVI file and creates a new movie by averaging n frames at a time, as specified by the user. The movie is written to a new AVI file, as specified by the user. Write all X‐Ray events to CSV file (getAVIColors.m): XCam stores the frame number and position of all pixels that are above the specified RGB threshold to a CSV file. The RGB threshold is a number between 0 and 765, and it comes from each image consisting of three “layers”: red, green, and blue, each with a brightness that ranges from 0 to 255. The processed data is placed into a comma‐separated value (CSV) file, and can be opened with Notepad or Microsoft Excel. It can also be stored back into MATLAB with the xlsread command. The data file has three columns. The first column shows the frame number that the pixel event occurred in, while the second and third columns show its row and column, respectively. Write centroid data to CSV file (writeCentroidData.m): This function is intended to be used if an x‐ray lights up many pixels in a circular pattern. It does almost the same thing as the above function; however, it first uses a Fourier algorithm to find the centroid of all the pixel events. Therefore, each frame will only have one pixel event associated with it. This function works best if the entire x‐ray spot is on the chip. Plot the number of lighted pixels per frame (countLightPixels.m): XCam counts the number of pixels per frame that are above a certain threshold, produces a graph of this data, and prints the sum to the MATLAB command line. Maximize the graph for the best view. Graph RGB values for a single pixel (graphPixelData.m): XCam extracts the red, green, and blue values (these can range from 0 to 255) for a single pixel and graphs them over time. The user can either specify a desired pixel or choose either the centermost or random pixel. Zoom in on a single pixel (zoomPixel.m). XCam zooms in on a single pixel and plays the resulting movie. Note that the new movie is a MATLAB movie structure, and not an AVI file. Running X‐Cam Functions from the MATLAB Command Line The GUI packages everything into one program; however, it can be useful to run the X‐Cam functions from the MATLAB command line. This section provides more detailed information about each function. Note that quick help for each function can be found within MATLAB by typing help and then the function’s name (e.g. help threshold). How to analyze an AVI file in MATLAB: Be sure that the desired AVI file is in the same directory that you are working in. Use the aviinfo and aviread commands to begin. The aviinfo command displays a lot of useful information about a movie file, while the aviread command imports an AVI movie into a MATLAB movie structure. For example, to play ‘success.avi’, you could type: A=aviread(‘success.avi’); movie(A); threshold(MOVIENAME, THRESHOLD,OUTPUTFILE,COLOR) Process an AVI movie by threshold, setting anything below an RGB threshold to black, and anything above the threshold to either white or the original color. The function writes the results to an AVI file. Note that the threshold function uses Cinepak encoding to create the AVI file. To change this, open up threshold.m in the MATLAB Editor and change “Cinepak” to something else. MATLAB supports the following compression formats in Windows: Indeo3, Indeo5, Cinepak, MSVC, and “None” (using “None” will likely result in a very large AVI file). Type help movie2avi for additional help. A=threshold(MOVIENAME,THRESHOLD,OUTPUTFILE,COLOR) returns the processed frames as a MATLAB movie structure. It can be played within MATLAB by typing “movie(A)”. MOVIENAME is a string representing the name of the AVI file to be analyzed. When using this function from the command line, be sure to place single quotes around MOVIENAME, e.g. ‘success.avi’. THRESHOLD is an integer between 0 and 765, inclusive, indicating the brightness in RGB. The threshold scale comes from an image matrix containing three layers (red, green, blue), each ranging from 0 to 255. OUTPUTFILE is a string representing the name of the AVI file to be written. When using this function from the command line, be sure to place single quotes around OUTPUTFILE, e.g. ‘output.avi’. COLOR is an integer denoting color option. If COLOR=1, all pixels above the threshold will retain their original color. If COLOR≠1, all pixels above the threshold will turn white. RunningAverage(MOVIENAME,N,OUTPUTFILE): Take a running average of an AVI file every n frames, and write the new movie to an AVI file. Note that the RunningAverage function uses Cinepak encoding to create the AVI file. To change this, open up RunningAverage.m in the MATLAB Editor and change “Cinepak” to something else. MATLAB supports the following compression formats in Windows: Indeo3, Indeo5, Cinepak, MSVC, and “None” (using “None” will likely result in a very large AVI file). Type help movie2avi for additional help. A=RunningAverage(MOVIENAME,N,OUTPUTFILE) returns the processed frames as a MATLAB movie structure. It can be played within MATLAB by typing “movie(A)”. MOVIENAME is a string representing the name of the AVI file to be analyzed. When using this function from the command line, be sure to place single quotes around MOVIENAME, e.g. ‘success.avi’. N is an integer representing the number of frames to average at a time. OUTPUTFILE is a string representing the name of the AVI file to be written. When using this function from the command line, be sure to place single quotes around OUTPUTFILE, e.g. ‘output.avi’. getAVIColors(MOVIENAME,THRESHOLD,FILENAME) Extract the time and position of non‐black colors from an AVI file, and print them to a comma‐separated value (CSV) file. The CSV data file contains three columns: frame, row, column. It can be opened using Notepad or Microsoft Excel. The getAVIColors function first calls countLightPixels in order to initialize its output matrices. This decreases processing time significantly for large (i.e. with more than 10,000 entries) data sets. A=getAVIColors(MOVIENAME,THRESHOLD,FILENAME) returns the data as a MATLAB matrix. This data is identical to the information that was written to the CSV file. MOVIENAME is a string representing the name of the AVI file to be analyzed. When using this function from the command line, be sure to place single quotes around MOVIENAME, e.g. ‘success.avi’. THRESHOLD is an integer between 0 and 765, inclusive, indicating the brightness in RGB. The threshold scale comes from an image matrix containing three layers (red, green, blue), each ranging from 0 to 255. FILENAME is a string representing the name of the CSV file to be written. When using this function from the command line, be sure to place single quotes around FILENAME, e.g. ‘output.csv’. writeC entroidData(MOVIENAME,FILENAME) This function uses a Fourier algorithm and a varying threshold to extract the centroids of x‐ray events per frame. The information is then written to a comma‐separated (CSV) file that can be opened with Notepad or Excel. The file has three columns: frame, row, column. The function works by increasing the threshold until there are few enough pixels lit up that a spot is probable. A=writeCentroidData(MOVIENAME,FILENAME) returns the data as a MATLAB matrix. This data is identical to the information that was written to the CSV file. MOVIENAME is a string representing the name of the AVI file (e.g. 'movie.avi'). FILENAME is a string representing the name of the CSV file to be written (e.g. 'output.csv'). countLightPixels(MOVIENAME,THRESHOLD) The countLightPixels function counts the number of pixels per frame that are above the specified threshold and graphs this information. It can be used by itself, but is also called from within getAVIColors to speed up the program. MOVIENAME is a string representing the name of the AVI file to be analyzed. When using this function from the command line, be sure to place single quotes around MOVIENAME, e.g. ‘success.avi’. THRESHOLD is an integer between 0 and 765, inclusive, indicating the brightness in RGB. The threshold scale comes from an image matrix containing three layers (red, green, blue), each ranging from 0 to 255. graph PixelData(MOVIENAME,ROW,COLUMN) The graphPixelData function graphs the red, green, and blue (RGB) values for a single pixel in MOVIENAME that is specified by ROW and COLUMN. A=graphPixelData(MOVIENAME,ROW,COLUMN) returns the plot handle. MOVIENAME is a string representing the name of the AVI file to be analyzed. When using this function from the command line, be sure to place single quotes around MOVIENAME, e.g. ‘success.avi’. ROW is an integer representing the row position of the desired pixel. Use aviinfo to determine the maximum row position for a particular AVI file. COLUMN is an integer representing the column position of the desired pixel. Use aviinfo to determine the maximum column position for a particular AVI file. zoomP ixel(MOVIENAME,ROW,COLUMN) The zoomPixel function zooms in on a single pixel and plays the resulting video as a MATLAB movie structure (note that this new video is not an AVI file). A=zoomPixel(MOVIENAME,ROW,COLUMN) returns the handle of the generated Matlab movie. Play it again using 'movie(A)'. MOVIENAME is a string representing the name of the AVI file to be analyzed. When using this function from the command line, be sure to place single quotes around MOVIENAME, e.g. ‘success.avi’. ROW is an integer representing the row position of the desired pixel. Use aviinfo to determine the maximum row position for a particular AVI file. COLUMN is an integer representing the column position of the desired pixel. Use aviinfo to determine the maximum column position for a particular AVI file. Contact [email protected] [email protected] [email protected] [email protected] Also visit http://www.nasa.ece.olin.edu for more information on the NASA‐Olin Research Program, and to download a copy of XCam.