1
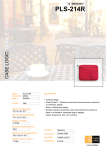
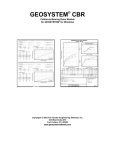
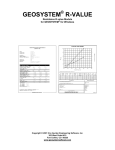
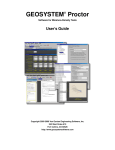
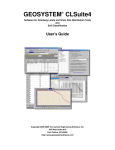
GEOSYSTEM Quality Control - Statistics
Copyright 2014 Von Gunten Engineering Software, Inc. All Rights Reserved
Table of Contents
Introduction............................................................................................................................................................. 2
Getting Started........................................................................................................................................................ 5
Take a look at the sample report .................................................................................................................... 6
Take a look at the data set for the sample report ........................................................................................ 8
Take a look at the report configuation options for the sample report...................................................... 9
Create your first report ..................................................................................................................................... 10
Selecting the Data for the Analysis...................................................................................................................... 11
Database Selection............................................................................................................................................. 12
Date Range Selection ........................................................................................................................................ 13
Project/Mix Selection......................................................................................................................................... 15
Field Data Selection ........................................................................................................................................... 16
Configuring the Appearance of the Report ........................................................................................................ 17
General Report ................................................................................................................................................... 18
Project Page........................................................................................................................................................ 20
Mix Page.............................................................................................................................................................. 23
Statistics Page..................................................................................................................................................... 27
Analysis Summary............................................................................................................................................. 29
Charts .................................................................................................................................................................. 31
Creating and Opening Reports............................................................................................................................. 33
Viewing, Printing and PDFing Reports................................................................................................................ 34
Technical Documentation...................................................................................................................................... 35
Statistics Table Calculations ............................................................................................................................. 37
Analysis Summary Calculations....................................................................................................................... 43
Chart Calculations.............................................................................................................................................. 49
Program Options .................................................................................................................................................... 50
System Requiremens ............................................................................................................................................. 51
Getting Help ............................................................................................................................................................ 52
1
Quality Control - Statistics User Manual
Introduction
GEOSYSTEM QC-Statistics
for statistical analysis of data in the QC-Concrete database
QC-Statistics Will Help You:
·
Track day to day changes in required average strength per ACI 301
·
Determine the required strength for new mix designs per ACI 301
·
Identify if the 3 test moving average falls below the design strength per ACI 301
·
Prepare reports of mix performance for ongoing quality control of structural concrete
·
Qualify additional mixes that do not have adequate history per ACI 318
·
Rate mix performance per ACI 214
·
Rate laboratory testing proficiency per ACI 214
·
Prepare quality control charts per ACI 214
·
Compare effects of variations in temperature, slump, air content and other parameters
·
Compare results during different time periods
·
Monitor strength gain from 7 to 28 days
Simple User Interface:
2
3
Data Sources:
·
QC - Statistics is designed to draw concrete break data from the GEOSYSTEM QC-Concrete database.
·
Filters can be chosen to limit the analysis to particular projects, mixes, or values of slump, air content,
temperature and other values recorded for each test.
·
Results can be limited to specific time periods as well.
QC-Statistics is the Windows version of the old GEOSYSTEM Concrete Performance
Report program
4
Quality Control - Statistics User Manual
Getting Started
A sample database and report are included with QC-Statistics. Taking a look at the sample is a great way to get
acquainted quickly with the QC-Statistics program.
Take a look at the sample report
Take a look at the data set options for the sample report
Take a look at the report configuration options for the sample report
Create your first report
5
Quality Control - Statistics User Manual
Getting Started Take a look at the sample report
A demo database and report are included with QC-Statistics. Click on Open Existing Report and open report
"Sample". The report is displayed. Here is a summary of what is in the Sample Report (typical of any report):
Page by Page - What's in the sample report "Sample.SRC"
Page
1
Content
Highlights
project information found in The layout and contents of this page are user
the database
configurable to a limited extent. The page can be
omitted if desired.
Hint: Click on Next or press PageDn to move to the next page.
2
mix information found in
the database
The layout and contents of this page are user
configurable to a limited extend. The page can be
omitted if desired.
Hint: Click on Zoom In to enlarge the report preview.
statistics on break results
(first page)
The columns on this page are user configurable. There
is one row per test with statistics. There is an option to
print reports in landscape orientation and even on legal
paper to accommodate a lot of columns - even 2 ages,
like 7 and 28 day.
statistics on break results
(second page)
Continuation of the statistics table. As many pages as
needed are printed. The last row contains some of the
cumulative values for the entire set of specimens. The
statistics pages can be omitted if desired.
selection criterion for the
report and ACI analysis for
the selected set of
specimens
Items included in the analysis results can be individually
omitted from this Analysis Results page. The analysis
summary page can be omitted if desired. If you would
like to take a detour and explore what any of the items
on this page are, go to Configuring the Analysis Summary
or Analysis Summary Calculations.
2 charts
* test results and moving
average
* strength distribution
The Strength chart can include lines denoting the
Specified Strength and Required Strength. The Strength
Distribution chart has selectable bracket width and
optional normal curve. This chart page can be omitted if
desired.
7
2 charts
* moving standard
deviation with ACI 214
ratings brackets
* withing-batch coefficient
of variation and moving
average range of test
Both with ACI ratings
Moving average span is selectable. Can plot one for 7
day and another for 28 day. Ratings based on ACI 214
tables 3.2 and 3.3. Can select either Field Control or
Laboratory Trial Batches. This chart page can be
omitted if desired.
8
1 chart
strength chart like page
6 but with field test
results
Can pick from slump, air content, and concrete
temperature and plot 1, 2 or all 3 results. This chart
page can be omitted if desired.
3
4
5
6
6
average range of test
Both with ACI ratings
8
1 chart
strength chart like page
6 but with field test
results
Can pick from slump, air content, and concrete
temperature and plot 1, 2 or all 3 results. This chart
page can be omitted if desired.
7
Quality Control - Statistics User Manual
Getting Started Take a look at the data set for the sample report
A sample database and report are included with QC-Statistics. Click on Open Existing Report and open report
Sample. The report is displayed along with some command buttons. Click on the command button Change
Data Set to see the options selected for the sample report analysis. The data set configuration options used to
select the tests included in the sample analysis are as follows:
·
Click on Database Selection and you will see that the database being used is the one in your Documents
folder, the QC-Statistics folder, database Sample.MDB, a GEOSYSTEM QC-Concrete compatible database.
·
Click on Date Range Selection and you will see a starting date of Jan. 1, 1900, and an ending date of
Jan. 20, 2014. This range covers all of the tests in the Sample database.
·
Click on Project/Mix
Selection and see that the Project being singled out for analysis is "Tidal Research
Facility" and the tests used will be limited to those using Mix Number 3000-C
·
Click on Field Data Selection to see that there are no slump, air content or mix temperature filters in
place. Also, there are no restrictions on suppliers or field technicians. It is, however, limited to specimens
which are cast cylinders.
8
Quality Control - Statistics User Manual
Getting Started Take a look at the report configuation options for the sample report
A sample database and report are included with QC-Statistics. Click on Open Existing Report and open report
Sample. The report is displayed along with some command buttons. Click on the command button CHANGE
REPORT CONFIGURATION
to see the options selected for the sample report's appearance. The report
configuration options used to design the sample report are as follows:
·
Click on General Report and the Report Name, Description, Pages Included, and Page Setup options are
shown. Pages selected to be included are white and say "Yes". All pages are selected for the sample
report, but any pages not selected would say "No" and would look a little faded.
·
Click on Project Page and the elements of that page are displayed. There are many little quirky
characters that are displayed because the report design is a script which will be interpreted when it is
displayed. The quirky characters are embedded instructions which appear only during the design of the
Project page of the report.
·
Click on Mix Page and the elements of that page are displayed. The quirky characters are the same as
described above.
·
Click on Statistics Page to see how the statistics table is designed for Sample. Click on some of the
columns in the Current Statistics Table Layout and notice how the properties shown for the columns
change.
·
Click on Analysis Summary Page then scroll the frame down to see the options in effect for the sample
report. Many of the options will always be on a typical Analysis Summary page, but all are optional
nonetheless. Descriptions of the analysis elements are user configurable, so when ACI changes a
standard like ACI 301-05 to ACI 301-10 the title is easily changed. If, of course, there are changes to
the parts of a standard used in program calculations we will post an update with the new calculations
incorporated.
·
Click on Chart Pages to view the chart settings for the sample report. Note that the various charts
themselves cannot be omitted except by omitting the entire chart page. However, many of the items
on each chart are optional.
9
Quality Control - Statistics User Manual
Getting Started Create your first report
After reviewing the sample report, start your first report by clicking on CREATE NEW REPORT . Then:
·
Enter a name for the new report then click on Create Report .
·
You will need to select the GEOSYSTEM Quality Control for Concrete database to be used by clicking on
Database Selection then navigating to the GEOSYSTEM Quality Control for Concrete database. This file is
always named CQC-CP.MDB.
Selecting the QC-Concrete Database to Statistically Analyze
·
Select a project by clicking on Project/Mix
·
Also select a mix by checking the Limit to mixes in the selected projects checkbox, then double-clicking on
Selection and double-clicking on a project.
a mix.
·
Click on SAVE .
·
Now click on General Report and give the report a name and description.
·
Now click on Project Page and click on LOAD DEFAULT
·
Now click on Mix Page and click on LOAD DEFAULT
·
Click on SAVE .
CONFIGURATION
CONFIGURATION
Your first (somewhat generic) report will be displayed. Click on HOME
10
and confirm.
and confirm.
then FINISHED
to exit.
Quality Control - Statistics User Manual
Selecting the Data for the Analysis
Whether you have a new report or an existing report, the design options used to select the data to be used are
the same. Whenever a report is displayed you can use the command button Change Data Set to access the
options for selecting a set of specimens. After clicking on Change Data Set your options are:
Database Selection - Usually there will never need to be any changes to this, unless you change the location of
your for GEOSYSTEM QC-Concrete database file or you are using a copy of the QC-Concrete database file.
Date Range Selection - Most analyses will be done on the most recent 30 days of data, but any starting and
ending date can be selected for an historical look at a mix, or for longer periods of time.
Project/Mix Selection - The database will contain many different projects and mixes. For your analysis you can
pick a specific project and mix or up to 4 projects and 4 mixes.
Field Data Selection - Sometimes you may want to compare the performance of a mix based on different
characteristics at the time of placement. You can pick different ranges of slump, air content, mix temperature,
suppliers and field technician.
11
Quality Control - Statistics User Manual
Selecting the Data for the Analysis Database Selection
When you click on Database Selection the current database folder is opened and databases displayed (usually
just one). If there is a database selected for the report it will be highlighted. Only GEOSYSTEM Quality Control Concrete databases can be opened and used by GEOSYSTEM Quality Control - Statistics. You can locate your
QC-Concrete database by opening QC-Concrete and selecting Tools->Administrator Tools. The database is in
the folder listed:
QC-Concrete Database Location
You may want to make a copy of the QC-Concrete database to use with QC-Statistics so that the data set you
are working with is not subject to changes made by QC-Concrete users during the analysis. A database must be
selected before any other data set or report configuration can be done.
12
Quality Control - Statistics User Manual
Selecting the Data for the Analysis Date Range Selection
When you click on Date Range Selection you get a dialog where you can select a starting date and ending date
for your analysis. This can be done in the following ways:
Starting Date:
·
30 days ago - makes the starting date 30 days prior to the current date
·
End - 30 - makes the starting date 30 days prior to the ending date (select ending date first)
·
First of month - makes the starting date the first of the currently displayed month
·
Day before - makes the starting date 1 day earlier than currently selected
·
Day after - makes the starting date 1 day later than currently selected
·
No starting date - makes the starting date January 1, 1900, which should be before any tests you have in
the database
Ending Date
·
Today
·
Start + 30 - makes the ending date 30 days after the starting date (select starting date first)
·
End of month - makes the ending date the last of the currently displayed month
·
Day before - makes the ending date 1 day earlier than currently selected
·
Day after - makes the ending date 1 day later than currently selected
·
No ending date - makes the ending date the current date (same as clicking Today, but it's there to
- makes the ending date the current date
aesthetically balance the options displayed on the screen)
Both Starting and Ending Date Calendars
13
Description of Elements of the Calendar
14
Quality Control - Statistics User Manual
Selecting the Data for the Analysis Project/Mix Selection
When you click on Project/Mix
Selection you get lists of the projects and mixes in the database so you can
select which ones to include in your analysis.
To select one or up to 4 projects in the database, double click on each one needed. It will be added to the list
of projects selected. To remove a selected Project, double click on it in the list of projects selected.
Note that the projects in the list can be either sorted by project name or project number. Do this by clicking on
Number first or Name first.
Likewise select the mixes to be included in the analysis, up to 4, by double clicking on each one needed. To
remove a selected mix, double click on it in the list of mixes selected.
Note that the mixes in the list can be limited to those existing in the selected projects. Do this by checking Limit
to mixes in the selected projects .
For either list you have the options to Select All or Remove All .
15
Quality Control - Statistics User Manual
Selecting the Data for the Analysis Field Data Selection
When you click on Field Data Selection you can restrict your analysis to particular test result values. You can
also select a single supplier, field technician or specimen type.
For Slump , Air Content , and Mix Temperature
fields, enter a minimum and maximum value for the result. Be
sure to use units consistent with those in the database. The Supplier , Field Technician
allow you to select from a list of values found in the database.
16
and Specimen Type fields
Quality Control - Statistics User Manual
Configuring the Appearance of the Report
Whether you have a new report or an existing report, the design options used to configure the appearance of
the report are the same. Whenever a report is displayed you can use the command button CHANGE REPORT
CONFIGURATION
to access the options for configuring how a report will look. After clicking on CHANGE
REPORT CONFIGURATION
your options are:
General Report - Use these options to select which pages to include in the report and to pick page setup options
like orientation and size.
Project Page - Configure the Project Page to include the information you want about the project.
Mix Page - Configure the Mix Page with the specifics about the mix design.
Statistics Page - This is the Table of Test Results and statistics which is arranged in rows of tests and columns of
results. You can pick which columns to include and adjust settings for how the statistics are calculated.
Analysis Summary - You can choose how to present the Summary of the statistical analysis.
Charts - There are options for what is presented on the 5 available Charts.
17
Quality Control - Statistics User Manual
Configuring the Appearance of the Report General Report
The General Report settings let you do the following:
1.
Set a report name - This can be the same as the name you use to save the file, or you can pick a
different name.
2.
Set a report description - You can describe the particular parameters and application of the report.
3.
Pages included - A report can include all the standard pages, or just the pages you want. Click on
the individual pages to add or remove them. If a report is analyzing 2 age groups, the Analysis
Summary Page, and Chart Page settings control both of them.
·
Project Page - the page with specific project information, when only a single project is selected for
the analysis.
·
Mix Page - the page with specific mix information, when only a single project is selected for the
analysis.
·
Statistics Table - the page(s) with the table of test results and calculated statistics.
·
Analysis Summary - the page with the summary of the statistics for the report.
·
Chart Page 1 - has the strength, moving average strength and the strength distribution charts.
·
Chart Page 2 - has the standard deviation and coefficient of variation charts.
·
Chart Page 3 - has the slump, air content and concrete temperature charts on a strength chart.
Pages included are white with a "Yes" on them, pages not included are off-white with a "No" on them.
To toggle between included and not included. click on the page .
4.
Page Setup - There are several report appearance options:
·
Paper size - Reports can be printed on letter or legal size paper.
·
Orientation - Reports can be printed in portrait or landscape orientation. When printed on
landscape or on legal size paper the Mix Page is combined with the Project Page.
·
Date reported placement - In either the lower left hand corner or lower right hand corner the
current date may be printed (the date reported).
·
Mix reported placement - In either the lower left hand corner or lower right hand corner the mix
ID date may be printed (the mix reported).
·
Page border - Reports can have a border around the page. Turn it on and take a look at a
report, it dresses them up a little.
18
19
Quality Control - Statistics User Manual
Configuring the Appearance of the Report Project Page
There are some limited options for designing the appearance of the Project Page (very similar to the Mix Page).
The process typically involves selecting database fields to be included on the Project Page, then giving the data
field a title, adding it to the page, then setting the spacing. There are 2 main parts to the Project Page
Configuration screen, the layout area (in the middle) and the table with the project database fields.
Configuring the Project Page
1.
Assigning Titles to Database Fields - Before adding a database field to the Project Page, the field
should be given a title. Find the field you want on the Project Page by scrolling through the project
table of the database, at the bottom the Project Page Configuration screen. Then click in the cell
for the Title for Report and enter the title.
20
Entering a Database Field Title
2.
Overriding Database Fields - You can assign permanent values to fields on the report so they do not
fetch their values from the project table in the database. You might want to do this if the data in
the database is not worded the way you would like it to be on the QC-Statistics report.
Entering an Override Value
3.
Adding Database Fields to the Project Page - First, position the cursor in the layout area where you
want the new database field added, and right click . Pick Insert Line ... Before or After . Next, find
the field you want on the Project Page by scrolling through the project table of the database, at the
bottom the Project Page Configuration screen. If it doesn't have a title, add one first. Then single
click on the Database Field cell . The title and the actual data pulled from the currently selected
project will be added to the layout area.
4.
Removing Database Fields from the Project Page - In the layout area, click anywhere on the line to
be removed then right-click and select Delete line .
5.
Setting the Tab Spacing Between the Title and the Data - You can insert a tab between the title and
the data. In the layout area, click on a title then right-click and select Tab , then Insert Tab . It will
set the tab at an appropriate position. To change the position of the tab, click on the data shown,
then right-click and select Tab , Change Tab From , and enter the new position.
6.
Changing Font Attributes - In the layout area, highlight the title or data you would like to change and
right click . Select Font then Bold , Underline , Larger or Smaller .
7.
Setting the Project Page Title - Above the layout area is a text box where the title for the project
page is entered.
8.
Loading the Default Configuration - QC-Statistics has a default Project Page configuration. It
provides a good starting point for new report designs. Click on LOAD DEFAULT CONFIGURATION
21
and confirm to load it.
8.
Loading the Default Configuration - QC-Statistics has a default Project Page configuration. It
provides a good starting point for new report designs. Click on LOAD DEFAULT CONFIGURATION
and confirm to load it.
Notes:
·
The data shown in the layout area does not update, so if you change the project the data will be out of
date. It is for illustrative purposes only and is always updated when the actual report is generated.
·
There are funny little characters in the layout area. These are the embedded tabs - they will be gone in
some future release.
·
The functions of the Project Page Configuration screen are admittedly somewhat limited, we'll look at
improving it in the future.
22
Quality Control - Statistics User Manual
Configuring the Appearance of the Report Mix Page
There are some limited options for designing the appearance of the Mix Page (very similar to the Project Page).
The process typically involves selecting database fields to be included on the Mix Page, then giving the data a
title, adding it to the page, then setting the spacing. There are 2 main parts to the Mix Page Configuration
screen, the layout area (in the middle) and the table with the mix database fields.
1.
Assigning Titles to Database Fields - Before adding a database field to the Mix Page, the field should
be given a title. Find the field you want on the Mix Page by scrolling through the mix table of the
database, at the bottom the Mix Page Configuration screen. Then click in the cell for the Title for
Report and enter the title.
23
Entering a Database Field Title
2.
Overriding Database Fields - You can assign permanent values to fields on the report so they do not
fetch their values from the mix table in the database. You might want to do this if the data in the
database is not worded the way you would like it to be on the QC-Statistics report.
Entering an Override Value
3.
Adding Database Fields to the Mix Page - First, position the cursor in the layout area where you want
the new database field added, and right click . Pick Insert Line ... Before or After . Next, find the field
you want on the Mix Page by scrolling through the mix table of the database, at the bottom the Mix
Page Configuration screen. If it doesn't have a title, add one first. Then single click on the
Database Field cell . The title and the actual data pulled from the currently selected mix will be added
to the layout area.
4.
Removing Database Fields from the Mix Page - In the layout area, click anywhere on the line to be
removed then right-click and select Delete line .
5.
Special Mix Database Fields - The 30 mix table fields, numbered 20 to 49, are used for the mixes
components, 3 per each of 10 component. They are in sets of 3 to describe the component name,
the quantity of the component, and the units of the quantity. An example is Portland Cement, 575,
lbs. When a component field is added to the mix page layout area it takes with it the quantity and
the units as well, so you get 3 fields by clicking on one. The spacing between them is set as follows:
Spacing before the Component Name field be the number of blank spaces entered as the title for the
Component
Spacing between the Component Name and the Quantity should be a \9 entered as the title for the Quantity that will be the tab
Spacing between the Quantity and the Units will be the number of blank spaces entered as the title for the Units
Then set the tab by right-clicking
on the line 24
in the layout area and selecting Tab->Change
from ...
that will be the tab
Spacing between the Quantity and the Units will be the number of blank spaces entered as the title for the Units
Then set the tab by right-clicking on the line in the layout area and selecting Tab->Change from ...
The image below illustrates this. The blue box shows the spaces that will be printed ahead of the
component name, in this case "CEMENT". The "\9" for Quan1 is the TAB character needed for
proper alignment. Also, not illustrated, are the spaces entered for the Title for Unit1, causing the
space between the quantity and the units.
The Non-standard Way the Component, Quantity, and Units Fields Use the Data Field Title
4.
Setting the Tab Spacing Between the Title and the Data - You can insert a tab between the title and
the data. In the layout area, click on a title then right-click and select Tab , then Insert Tab . It will
set the tab at an appropriate position. To change the position of the tab, click on the data shown,
then right-click and select Tab , Change Tab From , and enter the new position.
5.
Changing Font Attributes - In the layout area, highlight the title or data you would like to change and
right click . Select Font then Bold , Underline , Larger or Smaller .
6.
Setting the Project Page Title - Above the layout area is a text box where the title for the mix page
is entered.
7.
Loading the Default Configuration - QC-Statistics has a default Mix Page configuration. It provides a
good starting point for new report designs. Click on LOAD DEFAULT CONFIGURATION
and confirm
to load it.
Notes:
·
The data shown in the layout area does not update, so if you change the mix the data will be out of
date. It is for illustrative purposes only and is always updated when the actual report is generated.
·
There are funny little characters in the layout area. These are the embedded tabs - they will be gone in
some future release.
·
The functions of the Mix Page Configuration screen are admittedly somewhat limited, we'll look at
improving it in the future.
25
·
You may need to delete all the blank lines at the end of the layout area before adding Special Mix
Database fields (see #5)
26
Quality Control - Statistics User Manual
Configuring the Appearance of the Report Statistics Page
You have a number of options with the design of the statistics page:
·
Selecting which columns are printed
·
Selecting the order of the columns
·
Giving titles to the columns
·
Adding a second set of results columns for a different age, like 7 and 28 or 28 and 56
·
Adjusting the left margins for the titles and the table, and overriding the automatically determined column
width
·
Setting the sorting order for the table (normally date, but can be report number etc.)
New reports always have a standard set of columns, preset at the factory. They may be just what you need,
or some tweaking may be in order. Here are instructions for working with these columns:
1.
Add a Column to the Statistics Table - Locate the column in the Add Columns list, then double-click
on it . It will be added to the end of the Table Layout.
2.
Deleting a Column in the Statistics Table - Right-click on a column header and click on Delete Column
then Confirm .
3.
Moving a Column in the Statistics Table - Point to a Column Header and drag it left or right. A blue
line will appear denoting the selected location while dragging. Dragging it past the edge of the table
will make the table scroll. Drop the column when the blue line is between the between the 2 columns
desired.
4.
Changing Column Properties - Select a column in the Current Statistics Table Layout, then in the
Properties of Selected Column frame you can:
Enter/edit the captions for the top, middle and bottom title lines of a column
If it is a moving average result column you can set the number of tests to average
Change the default width, wider is more than 100%, narrower is < 100%
Note that grayed out data is for information only, and is changed elsewhere on the page.
5.
Changing the Specimen Age Associated with a Group - There may be 1 or 2 groups, when adding
columns be sure to keep each group together, and not confuse the two. Also, be sure to choose
relevant ages, for which there are data in the database.
6.
Changing the Left Margins - You can independently set the left margin for the heading and the table.
7.
Changing the Table Sort Order - An analysis is normally done by date. If there are numerous tests
on the same date you may with to use an alternate sort, such as Placement Date and Report
Identification.
27
7.
Changing the Table Sort Order - An analysis is normally done by date. If there are numerous tests
on the same date you may with to use an alternate sort, such as Placement Date and Report
Identification.
Notes:
If you have 2 groups it may be necessary to print using landscape mode, or even use legal size paper in
landscape mode.
28
Quality Control - Statistics User Manual
Configuring the Appearance of the Report Analysis Summary
The Analysis Summary Page has many elements which are user configurable to varying extents. They also
allow the user to omit them if so desired. Here is a description of each of these elements and their options:
1.
Number of tests - The title can be changed.
2.
Adjustment to required strength - The title and ACI reference can be changed.
3.
Average strength - The title can be changed.
4.
Standard deviation - The title can be changed.
5.
Adjusted standard deviation - The title and ACI reference can be changed.
6.
Calculation details of adjusted standard deviation - Can be omitted.
7.
Design strength - The title can be changed.
8.
Minimum required average strength - The title and ACI references can be changed.
9.
Calculation details of minimum required average strength - Can be omitted.
10. Margin of extra performance - The title can be changed.
11. Explanation of margin of extra performance - The title can be changed.
12. Probability of a test below design strength - The title can be changed. The %5d is for printing 5
digits of the strength value. The %2.2f%% is for printing the probability as percent with 2 decimal
places.
13. Probability of a test below design strength by at least 500 psi - The title can be changed. The %5d
is for printing 5 digits of the strength value. The %2.2f%% is for printing the probability as percent
with 2 decimal places.
14. Class of operation being rated - Can be either general construction testing or laboratory trial batch.
The titles can be changed.
15. Concrete performance rating - The title and ACI references can be changed.
16. Concrete performance rating details - The title can be changed. The analysis's standard deviation or
coefficient of variation will be printed following the title.
17. Laboratory testing proficiency rating - The title and ACI reference can be changed.
18. Withing test coefficient of variation - The title can be changed.
19. Average range - The title can be changed, the maximum range allowed for a good rating always
prints if the average range is selected. Titles for the 2 maximum range values cannot be changed.
29
The next 9 elements of the Analysis Summary Page pertain to an ACI provision which permits proportioning on
the basis of previous statistical analysis on similar mixes, see illustration below. This provision is found in ACI
301-10, Section 4.2.3.1 and in ACI 318-08 in Section 5.3.1.1
20. Additional qualifying mix list (first line) - The title can be changed.
21. Additional qualifying mix list (second line) - The title can be changed.
22. Mix Identification - The title can be changed.
23. Strength - The title can be changed.
24. Additional qualifying mix 1 Mix ID and Strength - Add an additional qualified mix ID and required
strength
25. Additional qualifying mix 2 Mix ID and Strength - Add a 2nd additional qualified mix ID and required
strength
26. Additional qualifying mix 3 Mix ID and Strength - Add a 3rd additional qualified mix ID and required
strength
27. Additional qualifying mix 4 Mix ID and Strength - Add a 4th additional qualified mix ID and required
strength
The Additional Qualifying Mix Section of the Report's Analysis Page
Finally there are some elements of the Analysis Summary Page called "Spare". Anticipating there will be
suggestions for additional items on the Analysis Summary Page the program has room for future expansion.
30
Quality Control - Statistics User Manual
Configuring the Appearance of the Report Charts
The Chart Pages Configuration lets you fine tune the content and appearance of the 5 QC-Statistics charts. If
charting more than one age group the settings will be the same for both groups.
1.
Strength Chart - This chart will always show the strengths (not individual cylinders, the average
strength for the set). The moving average is optional on this chart. You can also select how many
tests will be charted, up to the practical limit of 75. The data used are taken from the end (most
recent) of the data available. I.e. if you limit the chart to 50 and there are 100 tests in the data
set, all 100 will be used for the analysis, but only the last 50 will be charted. The strength comes
from the statistics table columns "Age Group 1 Test Average" and "Age Group 2 Test Average".
The moving average comes from the statistics table columns "Age Group 1 Moving Test Average"
and "Age Group 2 Moving Test Average".
2.
Strength Distribution Chart - This chart provides a way to visualize the distribution of the strength
results. The strength used come from the statistics table "Age Group 1 Test Average" and "Age
Group 2 Test Average".
·
You can set the minimum bracket width to prevent the program from choosing a width that is too
narrow.
·
It is visually desirable to have the chart centered, which may require offsetting the first bracket
left or right. This is done using the First Bracket Offset slider.
·
You can choose to have a normal distribution curve superimposed over the distribution chart.
·
You can choose to calculate and report a confidence value. This is the strength above which
some percent of results are expected to occur. This is not an ACI standard, but is just included
because if may be of interest to some users.
·
If including a confidence value, select the percent of tests you want above the calculated value
using the Confidence Value Percentage slider.
3.
Standard Deviation Chart - This is a chart of the moving average standard deviation, the values
come from the statistics table columns "Age Group 1 Moving Standard Deviation" and "Age Group 2
Moving Standard Deviation". The options are:
·
If you include the ACI 214R-02 Table 3.2 and 3.3 ratings the values for the excellent, very good
and good thresholds will be shown. Fair and poor are not shown but could be added if users so
desire. The values are taken from the cited ACI standard for overall variation.
·
The chart may be limited to some number of tests at the end of the analysis. Check the option
and select the number here.
4.
Range of Test and Coefficient of Variation Chart - This is a chart showing the within-test coefficient
of variation and the range of test or moving average range of test. The options are:
·
If you include the ACI 214R-02 Table 3.2 and 3.3 ratings the values for the excellent, very good
and good thresholds will be shown. Fair and poor are not shown but could be added if users so
31
desire. The values are taken from the cited standard for within-test variation.
·
If you include the ACI 214R-02 Table 3.2 and 3.3 ratings the values for the excellent, very good
and good thresholds will be shown. Fair and poor are not shown but could be added if users so
desire. The values are taken from the cited standard for within-test variation.
·
The chart may be limited to some number of tests at the end of the analysis. Check the option
and select the number here.
·
Select "Chart the cumulative average range" to chart the values from the statistics table "Age
Group 1 Cumulative Average Range of Test" or "Age Group 2 Cumulative Average Range of
Test".
·
Select "Chart the moving average range" to chart the values from the statistics table "Age Group
1 Moving Average Range of Test" or "Age Group 2 Moving Average Range of Test".
5.
Field Test Correlation to Strength Chart - This chart combines field test results with the strength
results. The options are:
·
Show slump
·
Show air content
·
Show concrete temp
·
The chart may be limited to some number of tests at the end of the analysis. Check the option
and select the number here.
32
Quality Control - Statistics User Manual
Creating and Opening Reports
To open a report - Start QC-Statistics and pick Open Existing Report . You can pick from the list of recent
reports that are displayed, or you can click on All Reports to display all reports and navigate to different folders.
To create a new report - New reports may be created from scratch or started as duplicates of existing reports.
·
Starting a new report from scratch - At the program's home screen select the option to Create New
Report . The folder opened and displayed on the screen is the on most recently used. Enter the new
report's name and click Create Report . Set up the data set to be used first. Select the database,
range of dates, projects, mixes, and field data filters. When done selecting the data set, click on
Save and proceed to set up the report configuration. Set up the general report, project page, mix
page, statistics page, analysis summary page, and chart pages. Click Save again and the new report
will be displayed.
·
To use an existing report as the starting point for a new report - Open an existing report. Then click
Change Data Set and click Save As , selecting the new report name. After that, configure the new
report's data set and report as desired.
Notes:
You may have noticed that when opening an existing report or creating a new report, the report selection screen
is actually the same. Selecting Open Existing Report from the home page then selecting New Report and it is
the same as selecting Create New Report on the home screen.
QC-Statistics reports are files with the extension .SRC. There is a file named QCSTemplate.SRCT. Please don't
mess with that one, it is the standard template all new reports start as.
33
Quality Control - Statistics User Manual
Viewing, Printing and PDFing Reports
To view a report, start QC-Statistics and pick Open Existing Report . You can pick from the list of recent reports
that are displayed, or you can click on All Reports to display all reports, or navigate to different folders.
QC-Statistics reports are files with the extension .SRC.
On the report preview screen you have several main options:
·
Home - Returns to the home page.
·
Show Properties - Displays a summary of the data set options.
·
Change Data Set - Enters the data set configuration area.
·
Change Report Configuration - Enters the report configuration area.
·
PDF - Writes the report in PDF (Acrobat Reader) format. The file is saved in the folder set up for PDF
files on the Options page.
·
Print - Opens the print dialog which allows the selection of the printer to use and the pages to be printed.
Also at the bottom of the report preview screen are page viewing controls. The first 2 command buttons
(Previous and Next ) navigate through the pages of the report. The other 2 command buttons Zoom In and
Zoom Out do what you would expect.
To print a report, view the report, then click on Print. You will be given a standard print dialog where you can
select the printer, pages and number of copies to be printed.
To create a PDF of a report, view the report, then click on PDF. The PDF will be created with all pages, in the
folder designated as the PDF file storage folder, and be named with the report name and the extension .PDF.
34
Quality Control - Statistics User Manual
Technical Documentation
ACI Standards 214, 301 and 318 provide the formulas for the calculations used in the QC-Statistics program:
ACI 301-10 "Specifications for Structural Concrete"
The strength specification is the minimum required strength f'cr. Determining the value for this requirement of is
the primary purpose of QC-Concrete. The specification, from section 4.2.3.3 is:
ACI 301-10 Table 4.2.3.3.a
15 or more tests available to analyze
f'c
f'cr - use whichever is greater
f'cr = f'c + 1.34 kss
5000 psi or less
f'cr = f'c + 2.33kss - 500
f'cr = f'c + 1.34 kss
Over 5000 psi
f'cr = 0.9 f'c + 2.33kss
f'c is the specified or design strength
k is the factor compensating for fewer than the statistically significant minimum of 30 tests, interpolated
from ACI 301-10 table 4.2.3.3.a.1
ss is the sample standard deviation per ACI 301-10 4.2.3.2
If there are less than 15 tests in the analysis ACI 301-10 table 4.2.3.3.b is used.
ACI 214R-11 "Guide to Evaluation of Strength Tests of Concrete"
·
QC-Statistics also provides evaluation ratings as specified in ACI 214R-11. As stated in ACI 214R-11, one
of the primary purposes of the statistical evaluation of concrete data is to identify sources of variability.
ACI 214R-11 Tables 4.3 and 4.4 are used to rate the testing lab and concrete producer.
·
ACI 214R-11 sections 4.2 and 4.4 discuss the value of the histogram and normal curve of the sample
set used for the analysis. QC-Statistics provides a chart with the histogram and normal curve.
·
QC-Statistics also partially provides the ACI 214R-11 section 5.3.2 Criterion No. 2, section 5.3.3 Criteria
Nos. 3 and 4. Partially, because only the 1 in 100 probability is used, for Criterion 3 500 psi below f'c is
used, and for Criterion 4, 90% of f'c is used.
·
QC-Statistics does not calculate the ACI 214R-11 section 5.3.1 Criterion No. 1 ,but is is easily determined
by using the standard deviation calculated by QC-Statistics, and the appropriate probability factor from
ACI 214R-11 Table 5.4.
35
·
QC-Statistics does not calculate the ACI 214R-11 section 5.3.1 Criterion No. 1 ,but is is easily determined
by using the standard deviation calculated by QC-Statistics, and the appropriate probability factor from
ACI 214R-11 Table 5.4.
ACI 318-11 "Building Codes for Structural Concrete"
Many of the requirements of ACI 318 are drawn from the ACI 214 and ACI 301 specifications which are
calculated by QC-Statistics.
For details of calculations see:
Statistics Table Calculations
Analysis Summary Calculations
Chart Calculations
36
Quality Control - Statistics User Manual
Technical Documentation Statistics Table Calculations
Many of the columns in the statistics table are calculated values. Here are the methods and formulas used. Age
Group 1 will be used in all explanations, but Age Group 2 uses the same formulas, drawing data from the
designated age specimens. Example calculations will be taken from the sample database.
Age Group 1 Test Average (ACI 214 term:
strength test result)
n
is the number of specimens in the test set
x
is the strength of the individual specimen
example calculation, report number 46 (last line): (4230 + 4330 + 4440) / 3 = 4363 psi
Age Group 1 Cumulative Average (ACI 214 term:
average of strength test results, also called the mean,
equation 4-1)
is the average of strength test results
is an individual strength test result
n
is the number of test results in the analysis
example calculation, report number 3: (4200 + 4525 + 4747 + 4050) / 4 = 4380 psi
Age Group 1 Moving Test Average
37
is the moving test average
n
is the sequential number of the final test result in the moving average analysis
m
is the number of test results included in the moving average
example calculation, report number 11, moving average of 3 tests:
(4107 + 3983 + 4383) / 3 = 4158 psi
Age Group 1 Cumulative Standard Deviation (ACI 214 term:
s sample standard deviation, an estimate of the
population standard deviation, also termed soverall, equation number 4-2b)
s
is the sample standard deviation
is the average of strength test results
is an individual strength test result
n
is the number of test results
example calculation, report number 3:
= 42002 + 45252 + 47472 + 40502 =77,052,134
= (4200 + 4525 + 4747 + 4050) / 4 = 4380.5
2
= 19,188,780.25
n
=4
s
= ( (77,052,134 - 4 x 19,188,780.25) / (4 - 1) )
Age Group 1 Moving Standard Deviation
38
1/2
= 314.65 psi
sm
is the sample standard deviation
is the average of strength test results
is an individual strength test result
n
is the sequential number of the final test result in the moving standard deviation analysis
m
is the number of test results included in the moving average
example calculation, report number 42, moving standard deviation of 3 tests:
= 43202 + 38832 + 41272 =50,772,218
=(4320 + 3883 + 4127)2 = 152,028,900
n
= 43 (43rd test in the sample)
m
= 3 (3 test moving standard deviation)
sm
=( (3 x 50,772,218 - 152,028,900) / (3 x (3 - 1)) )
Age Group 1 Cumulative Coefficient of Variation (ACI 214 term:
V
is the coefficient of variation
s
is the sample standard deviation
1/2
= 219.00 psi
V coefficient of variation, equation 4.4)
is the average of strength test results
example calculation, test number 3:
s
= 314.65 psi (see Age Group 1 Cumulative Standard Deviation for value of s)
= 4380 psi
39
V = (314.65 / 4380)
x 100 = 7.18 %
Age Group 1 Moving Coefficient of Variation
Vm
is the moving coefficient of variation
sm
is the moving sample standard deviation
is the moving average of strength test results
example calculation, report number 42, moving coefficient of variation of 3 tests:
sm
= 219.00 psi (see Age Group 1 Moving Standard Deviation for value of s)
= (4320 + 3883 + 4127) / 3 = 4110 psi
V = (219 / 4110)
x 100 = 5.32 %
Age Group 1 Range of Test (ACI 214 term:
R within-batch range, section 4.2.3.2)
The range is found by subtracting the lowest strength from the highest strength in a given test.
example calculation, report number 24: 4440 - 3990 = 450 psi
Age Group 1 Cumulative Average Range of Test (ACI 214 term:
average range)
is the cumulative average range of test
Ri
is the range for test i
n
is the number of test results
example calculation, report number 3, moving range of test for 3 tests:
40
= (100 + 90 + 50) / 3 = 80 psi
Age Group 1 Moving Average Range of Test
m
is the moving average range of test
Ri
is the range for test i
n
is the sequential number of the final test result in the moving average range analysis
example calculation, report number 24, moving range of test for 3 tests:
m
= (150 + 40 + 450) / 3 = 213 psi
Age Group 1 Within-Batch Coefficient of Variation (ACI 214 term:
V1
V1, within-batch coefficient of variation)
is the within-batch coefficient of variation
is the cumulative average range of test
d2
is a factor based on number of specimens in each test (ACI 214R-11 Table 4.1)
is the average of strength test results
example calculation, report number 24, average range of tests:
= (0 + 50 + 90 + 100 + 100 + 50 + 20 + 170 + 0 + 190 + 200 + 300 + 90 + 70 + 170 +
170 + 100 + 0 + 0 + 20 + 220 + 200 + 150 + 40 + 450 ) / 22 = 2950 / 22 = 134.09 psi
d2 = (4/22) 1.128 + (18/22) 1.693
= 1.590
= 4229.80 psi
V1 = (100) (134.09) / (1.590 * 4229.80 psi) = 1.99 %
41
42
Quality Control - Statistics User Manual
Technical Documentation Analysis Summary Calculations
ACI 301 prescribes specifications for structural concrete. Many of the specifications are related to quality control,
and performance standards based on the strength history. The QC-Statistics analysis summary provides the
performance summary given in ACI 301, as well as some additional performance ratings specified in ACI 214 for
the evaluation of strength test results. The analysis summary uses the final row of the statistics table for its
calculations.
Number of Tests: The total number of test results in the statistics table.
Standard Deviation Adjustment Factor: ACI 301-10 requires an increase to the standard deviation (s) when the
sample is less than 30 tests. QC-Statistics uses the following values, interpolated from table 4.2.3.3.a.1 to
obtain k:
Number of tests in
the sample
15
16
17
18
19
20
21
22
factor (k) for
increasing s
1.160
1.144
1.128
1.112
1.096
1.080
1.070
1.060
Number of tests in
the sample
23
24
25
26
27
28
29
30
factor (k) for
increasing s
1.050
1.040
1.030
1.024
1.018
1.012
1.006
1.000
For the sample data set there are 47 samples, so the k factor is not used.
Average Strength: The average of all the test results in the data set. It is the same as the Cumulative
Average on the last row of the data table. For the sample data set the average strength is 4232 psi.
Standard Deviation: The sample standard deviation comes from ACI 301-10 section 4.2.3.2.b or ACI 214R-11
section 4.2.2. See help for the Statistics Table for more information. For the sample data set the standard
deviation is 167.
Adjusted Standard Deviation: This is the standard deviation multiplied by the k factor. Since the sample data
set has 47 tests, the standard deviation is not changed from 167 psi.
Design Strength: This value is retrieved from the QC-Concrete database for the mix being analyzed. For the
sample report the value is 3000 psi.
Minimum Required Average Strength: This is
in Table 4.2.3.3.a and 4.2.3.3.b.
f 'cr as specified in ACI 301-10 section 4.2.3.3, and the equations
43
ACI 301-10 Table 4.2.3.3.a
·
Equation 4-3 is based on criterion 2 of ACI 214R-11 section 5, some probability that a moving average of
n tests will exceed f 'c:
f 'cr = f 'c + ( z s /
)
For ACI 301 it is a moving average of 3 tests, and a 99% probability, so criterion 2 becomes equation
4-3:
f 'cr = f 'c + (2.33 s /
)
or
f 'cr = f 'c + 1.34 s
·
Eq. 4-3
Equation 4-4 is based on criterion 3 of ACI 214R-11 section 5, some probability that tests will exceed
some value lower than f 'c for f 'c of 5000 psi or less:
f 'cr = (f 'c - k) + z s
For ACI 301 it is that 99% of tests will be greater than 500 psi below f 'c, so criterion 3 becomes equation
4-4:
f 'cr =
·
f 'c
+ 2.33 s - 500
Eq. 4-4b
Equation 4-5 is based on criterion 4 of ACI 214R-11 section 5, some probability that tests will exceed
some percentage of f 'c for f 'c of more than 5000 psi:
f 'cr = k f 'c + z s
Eq. 4-4b
For ACI 301 it is that 99% of tests will be greater than 90% of f'c, so criterion 4 becomes equation 4-5:
f 'cr = 0.90 f 'c + 2.33 k ss
Eq. 4-5
The minimum required average strength becomes the greater of the two, which in the case of the sample data
set is:
from equation 4.3:
f 'cr = 3000 + (1.34 x 167) = 3224 psi
44
or
from equation 4.4:
f 'cr = 3000 + (2.33 x 167) - 500 = 2889 psi
So the final f 'cr is rounded to the nearest higher 10 giving, for the sample data set, 3230 psi.
There is one other way to determine the minimum required average strength which is used when there are less
than 15 test results available to analyze. In this case QC-Statistics uses ACI 301-10 Table 4.2.3.3.b:
Margin of extra performance: The difference between the average strength and the minimum required average
strength is the margin of extra performance. For the sample data set it is:
4232 - 3230 = 1002 psi
Probability of a test below f 'c based on normal distribution is: and
Probability of a test below f 'c - 500 based on normal distribution is: These 2 probabilities are calculated using the
standard cumulative distribution function:
where:
x
is the strength of interest
s
is the standard deviation
is the average test result
t
=(x-
)/s
Using the sample data set is not very useful because
f 'c is 3000 psi and the average strength is 4232, a
difference of 7.4 standard deviations. The probability is effectively 0 at 4 standard deviations, so the result is 0.
Instead consider:
45
Rather than integrating, which is done by the software using a simple summing iteration, the probability of a test
below 4000 psi of 1.36% can be checked using statistical tables, spreadsheets, calculators or on-line calculators.
StatTrek.com gives:
which compares well with 1.36% given by the program.
Concrete performance: ACI 214R-11 provides a systematic way to rate concrete performance based on
standard deviation and coefficient of variation. These are found in ACI 214R-11 Tables 4.3 (f 'c <= 5000 psi)
and 4.4 (f 'c > 5000 psi) in the sections entitled Overall variation .
46
ACI 214R-11 Table 4.3 - Standards of concrete control for f 'c <= 5000 psi
ACI 214R-11 Table 4.4 - Standards of concrete control for f 'c > 5000 psi
It should be noted that the standards for general construction testing are not as strict as laboratory trial
batches. QC-Statistics includes a setup option to select which criterion should be used. See Configuring the
Appearance of the Report->Analysis Summary for setup help.
In the sample report f 'c is 3000 psi, the standard deviation is 167 psi, and laboratory trial batch criterion is
applicable. Using table 4.3 the proficiency is rated excellent.
Laboratory testing proficiency: ACI 214R-11 provides a systematic way to rate laboratory testing proficiency
based on the within-batch coefficient of variation. These are found in ACI 214R-11 Tables 4.3 (f 'c <= 5000 psi)
and 4.4 (f 'c > 5000 psi) in the sections entitled Overall Variation . Since there is no difference between the
criteria for f 'c <= 5000 psi and f 'c > 5000 psi, only table 4.3 needs to be referenced. The standards are in the
section entitled Within-batch variation .
ACI 214R-11 Table 4.3 - Standards of within-batch concrete testing control
For the sample data set the within-batch coefficient of variation is 1.93 and the class of operation that has been
selected is "Laboratory Trial Batches". 1.93 is less than 2, so the rating is Excellent.
The average range of the data set is also listed, and for comparison, the maximum ranges to attain a rating of
good. Since the within-batch coefficient of variation is dependent on the number of specimens in the test, both
47
a 2 and a 3 specimen maximum range is given. The maximum
ranges are calculated using ACI 214R-11
The average range of the data set is also listed, and for comparison, the maximum ranges to attain a rating of
good. Since the within-batch coefficient of variation is dependent on the number of specimens in the test, both
a 2 and a 3 specimen maximum range is given. The maximum ranges are calculated using ACI 214R-11
equations 6.3a and 6.3b.
m
= 0.05640 x
f 'cr
Equation (6-3a) for 2 specimen tests
m
= 0.08465 x
f 'cr
Equation (6-3b) for 3 specimen tests
For the sample data set:
0.05640 x 3230 = 182 psi for 2 specimen tests
0.08465 x 3230 = 273 psi for 3 specimen tests
48
Quality Control - Statistics User Manual
Technical Documentation Chart Calculations
Only one chart includes a calculation not discussed elsewhere. That is the confidence value on the strength
distribution chart. The value represents the strength above which some percent of tests, selected by the user,
will be expected to fall. The percent of tests is user selectable on the Change Report Configuration, Chart Pages
setup dialog. See Charts for more information.
This value is not an ACI required or specified value, but is simply based on the statistical normal distribution. It is
calculated using the equation:
Xp =
Xp
- zs
is the strength, psi, the selected percentage of tests should exceed, based on a normal
distribution
is the average strength, psi
z
is the probability factor from the normal distribution, taken from standard normal distribution
probability charts:
percent greater
90
91
92
93
94
z
1.282
1.341
1.405
1.476
1.555
percent greater
95
96
97
98
99
z
1.645
1.751
1.881
2.054
2.326
Standard Normal Distribution Table for 90 Percent of Sample Greater
s
is the standard deviation, psi
The value for the sample report, for 99% confidence, is:
Xp = 4232 - 2.326 x 167 = 3844 psi
49
Quality Control - Statistics User Manual
Program Options
Program options are accessed from the main menu by clicking on Options .
·
Printer Options: Select the desired printer. Some information about the printer is displayed.
·
PDF File Storage Folder: Select the folder to be the location for PDF reports created by the program.
There is not an option to create a new folder at this point - if you need a new folder, create it using
Windows.
·
View User Manual: The User Manual is compiled from the help screens, so it does not provide any
information not found in the help screens, however it does let you see it all together and print it.
50
Quality Control - Statistics User Manual
System Requiremens
QC-Statistics System Requirements
·
Windows 8, 7, Vista, or XP
·
No unusual memory requirement
·
No unusual hard drive storage requirement
·
To be used in tandem with the GEOSYSTEM Quality Control for Concrete software
51
Quality Control - Statistics User Manual
Getting Help
For help with Quality Control - Statistics
·
Use this built-in help system
·
Use the PDF user manual, in the QC-Statistics program folder
Contacting GEOSYSTEM Software
·
Use the Support Question submittal form on the GEOSYSTEM website (click here)
·
E-mail [email protected]
GEOSYSTEM Software
Von Gunten Engineering Software, Inc.
363 West Drake Road, Suite 8
Fort Collins, CO 80526-2882
www.GEOSYSTEMSoftware.com
[email protected]
52