1
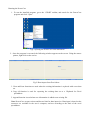
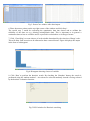
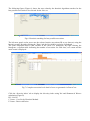
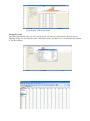
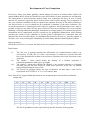
Development of Core Germplasm
PowerCore: Many gene banks globally contain untapped resources of distinct alleles which will
remain hidden unless efforts are initiated to screen these alleles for their potential use and function.
The deployment of useful diversity analysis using core collections has been an area of much
interests for researches especially those working in the field of allele mining. The prerequisite of
any core collection established is that it captures the complete diversity of the entire collection it
was derived from. A core set should not be considered a substitute of the entire collection. The
recent advancements in technological tools related to genomics and bioinformatics have made it
possible to discover new alleles for any gene of interest. These new techniques also create a further
challenge of linking traditional phenotypic information to a larger quantity of sequential and genetic
information and to complement activities carried out for germplasm enhancement. Allele mining
provides the avenue for the validation of specific gene(s) responsible for a particular trait and
mining of the most favorable alleles. A computational tool named “PowerCore” provides support to
develop a core set by reducing the redundancy of useful alleles and thus enhancing their richness.
Data preparation
Before the PowerCore is executed, the data set has to be inputted into an Excel spreadsheet.
Data Format
(i)
(ii)
(iii)
(iv)
The first row in general contains the information of variable/character names (e.g.
%Accession, VG, BP, BC, LA (Note: A percentage (%) character is placed before the
title of the Identification column of accessions to represent each of the accessions in the
collection.
The symbol ~ when placed before the identity of a variable represents a
continuous/quantitative data type (e.g. height).
The symbol ~ when placed before the identity of an accession indicates a referential
selection, wherein the user decides to retain these accessions in the core set without
being validated using the PowerCore.
The PowerCore program allows any type of character for data input - color can be
represented as YELLOW or ‘A’ or ‘a’ or a numeric data.
Note: PowerCore supports blank data but does not incorporate these into the final calculation
sample data:
%No
1
2
3
4
5
6
7
8
9
10
11
VG
1
1
1
1
1
1
1
1
1
2
1
BP
3
3
3
3
3
3
3
3
3
3
3
BC
2
3
1
3
5
3
2
4
2
2
1
LA
2
2
1
2
1
1
2
2
1
1
2
FLA
4
4
2
4
1
1
3
3
1
1
1
LC
1
1
1
1
3
1
1
3
1
1
1
CC
1
1
1
1
1
1
1
3
1
1
1
AuriC
1
1
1
1
1
1
2
1
1
1
CA
2
2
1
1
2
2
2
3
1
2
2
The Excel spreadsheet can be copied directly into the interface of the program.
Running the PowerCore
1. To run the installed program, go to the ‘START’ toolbar, and search for the PowerCore
program and click ‘Open’.
fig1: Opening the PowerCore from Start Menu
2. Once the program is executed, the following window appears on the screen. Using the mouse
pointer, right click on the screen.
Fig 2: Data import from Excel sheet
3. Clear and Paste functions are used when the existing information is replaced with a new data
set.
4. Copy all function is used for exporting the existing data set to a Clipboard for Excel
spreadsheet.
5. Append function is used when new information is added to an existing file.
Note: PowerCore accepts various and has no limit for data input size. Data input is based on the
resources are available in the user’s computer, and not according to the limit of the excel
spreadsheet.
Fig 3: PowerCore window after data import.
6. Place the mouse pointer on the top right corner of the window and click Step 1
The crucial step 1 would be converting the quantitative data into classes and to validate the
reliability of the data set (e.g. deleting missing/blank data). This is important as in general a
continuous data set has no variables and is expressed in real numbers or in integer format.
7. Click ‘Classifying’ to create classes of each variable determined by the criterion of Sturge’s rule.
This will allow each accession to be allocated to these created classes. Figure 4 displays the output
in the form of a histogram:
Fig 4: Histogram showing classes of variable
8. Click ‘Run’ to perform the heuristic search. By checking the ‘Random’ button, the search is
performed using the random method – Accessions are selected randomly instead of being selected
by the heuristic evaluation function.
Fig 5. RUN window for Heuristic searching
,
The following figure (Figure 6) shows the steps whereby the heuristic algorithm searches for the
best possible accessions to be selected for the core set.
F
I
Fig 6. Heuristic searching for best possible accessions.
The left most panel on the screen are the selected entries (accessions ID as per data set) using the
heuristic search. By right clicking the ‘Entry’ tab, the list could be copied to a clipboard.
The panel displayed shows each variable in the form of a histogram. By right clicking the
histogram, a separate table indicating the number of accession for each class, core count and the
entire count is displayed.
F
I
Fig 7. Complete accession level detail of core set generated via PowerCore
Click the ‘diversity index’ tab to display the diversity index using Nei and Shannon & Weaver
calculation (Figure 8)
PIC- Nei DI
C Count – Core Set by Heuristic Method
E Count – Entire collection
Fig 8. Display of Diversity Index.
Saving the result
Once data generated for the core set is saved, a new excel sheet is generated by the PowerCore.
Filtering of the core set from the entire collection is done, and the core set is automatically marked
‘Y’ by the software.
Fig 9. Complete accession level detail of core set generated via PowerCore
Statistical terms & formulas :
1. ‘Classifying’ to create classes of each variable determined by the criterion of Sturge’s rule
Sturge’s rule = 1 + Log2(n),
n : the observed number of accessions.
Number of Accessions : Total number of accessions from the existing collection
Number of Variables: Represents the number of characters from the data set
2. Non-heuristic Search : A search which does not use any heuristic algorithm (Note : Similar
to random search, but results are always repetitive as search is performed sequentially)
3. Max Possible Entries : It is the worst case scenario, wherein this is the limit for PowerCore
to select the maximum number of entries.
4. Efficiency Index : Effectiveness of PowerCore in comparison to the non-heuristic search.
Note: A lower value signifies a more effective search
5. Unfilled Diversity Cells: Status during the filling of the diversity index.
6. Random Branching: Selection of nodes randomly during the selection process of same
accessions with same values of minimum evaluation functions, indicating the number of its
occurrence.
Analysis with Statistical Indicators:
i) Mean difference (MD) (%) =
X 100
Me: Mean of entire collection, Mc: Mean of core collection.
ii) Variance Difference(VD) (%) =
X 100
Ve: Variance of entire collection, Vc: Variance of core collection
iii) Coincidence Rate(CR) (%) =
X 100
Re: Range of entire collection, Rc: Range of core collection
iv) Variable Rate(VR) (%) =
X 100
CVe: coefficient of variation of entire collection, CVc: coefficient of variation of core
collection, m: number of traits
References and suggested readings:
Kyu-Won Kim, Hun-Ki Chung, Gyu-Taek Cho, Kyung-Ho Ma, Dorothy Chandrabalan, Jae-Gyun
Gwag, Tae-San Kim, Eun-Gi Cho and Yong-Jin Park (2007). PowerCore: a program applying the
advanced M strategy with a heuristic search for establishing core sets Bioinformatics. 23 (16):
2155-2162.
PowerCore User Manual