1
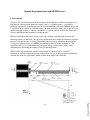
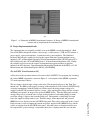
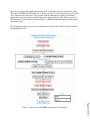
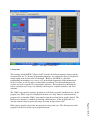
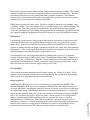
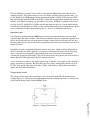
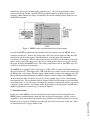
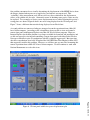
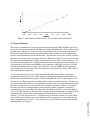
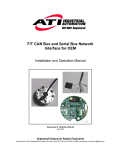
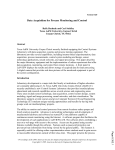
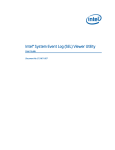
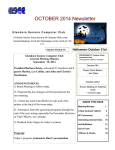
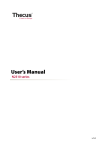
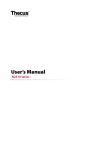
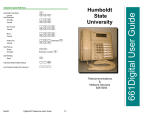
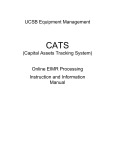
AC 2009-1053: REMOTE EXPERIMENTATION WITH MEMS DEVICES
Bill Diong, Texas Christian University
Jamie Smith, Lockheed-Martin Aeronautics
Edward Kolesar, Texas Christian University
Rene Cote, Texas Christian University
Page 14.1019.1
© American Society for Engineering Education, 2009
Remote Experimentation with MEMS Devices
I. Introduction
A project was recently initiated with the main goal of enabling those students enrolling in our
Department’s undergraduate Materials Science course – a required course – to conduct a
particular experiment via the Internet on a Microelectromechanical System (MEMS) device that
is located in an on-campus research laboratory. Broader and longer-term goals of this endeavor
include enabling students to conduct experiments on systems located in any of the University’s
Science and Engineering laboratories via the Internet.
Mid-way through this Materials Science course, the students learn about the electrical and
thermal properties of materials. The specific experiment that we intend the students to perform,
remotely over the Internet, is aimed at determining the in-plane tip deflection (displacement)
versus power characteristics of a MEMS electrothermal actuator (shown in Figure 1). This
experiment will serve to demonstrate the synergistic linkage between these topics, while
simultaneously illustrating the concept of device characterization.
While remote experimentation systems can no longer be considered to be a novelty1-5,
nevertheless, each new application seems to present its own set of often-unexpected challenges.
And this was what we experienced, which we now share with a wider audience.
Page 14.1019.2
(a)
(b)
Figure 1: (a) Schematic of MEMS electrothermal actuator, (b) Image of MEMS electrothermal
actuator and tip displacement measurement scale
II. Project Implementation Details
The equipment that was originally available to us in the MEMS research lab included: a Karl
Suss model PM-4 microprobe station, a microscope, a video camera, a VCR and TV monitor, a
power supply, a pair of microprobes, a switch box and a power amplifier. The additional
hardware that had to be acquired to develop the remote laboratory experimentation system
included: a PC, an Educational Laboratory Virtual Instrumentation Suite (ELVIS) unit, a PCI6251 DAQ board, and a PCI-1405 IMAQ board - all from National Instruments (NI). Finally,
the software needed to create the remote experimentation program and the user interface
included: the NI Laboratory Virtual Instrument Engineering Workbench (LabVIEW) v8.5, NI
Measurement and Automation Explorer (MAX), and NI IMAQ.
The LabVIEW Virtual Instrument (VI)
A flow chart of the operations that need to occur in the LabVIEW VI (or program) for executing
the remote MEMS experiment is shown in Figure 2. A description of this MEMS experiment
VI’s main operations follows.
Page 14.1019.3
The user inputs a desired input voltage value in the VI front panel and presses the “Run Test”
button icon. The IMAQ card captures an image of the unpowered device before LabVIEW DAQ
Assistant communicates with the DAQ card, which creates the analog output voltage to be
supplied to the ELVIS protoboard for five seconds. After applying this voltage for four seconds,
an IMAQ card captures an image of the powered MEMS device. Then the DAQ card reads the
analog voltage across a current-sense resistor on the protoboard, and another DAQ Assistant
reads that voltage’s digital value from the DAQ card. Subsequently, a third DAQ Assistant
forces the supplied voltage back to zero. Then the images of the unpowered and powered
MEMS device are displayed on the LabVIEW front panel. The voltage value read by the second
DAQ assistant is used to compute the current and power supplied to the MEMS device, and the
values are displayed on the LabVIEW front panel. After the values are displayed and the user
has inspected the ‘powered image’ to determine the device’s displacement, the user can then
input the test’s power and displacement values to be stored in the form of a data history graph.
The entire LabVIEW block diagram is in a ‘While’ loop that ends only when the user presses the
‘Stop’ button on the front panel. The program will run continuously, clearing data displays,
applying the desired voltage and plotting data on the graph, until the ‘Stop’ button is pressed.
The completed VI front panel is shown in Figure 3, although without the images and the powerdisplacement plot.
The VI program outlined above can be partitioned into specific areas, which will be detailed in
the following sections.
Page 14.1019.4
Figure 2: Flow chart of the MEMS experiment VI’s operations
Figure 3: LabVIEW VI front panel
VI structures
The Learning with LabVIEW 7 Express book6 describes the different structures that govern the
execution flow in a VI. In many programming languages, one controls the flow of execution by
simply typing in the desired order of commands. However, LabVIEW is a data-flow
programming environment, so as soon as a VI on the block diagram has all the information it
needs to execute, it will. In order to control when a particular VI on the block diagram will
execute, one needs to put the VIs in appropriate structures. This program for performing the
remote experiment uses loops, case structures, shift registers, sequence structures, and event
structures.
The ‘While’ loop controls repetitive operations in a VI while a specified condition is true. In this
program, one ‘While’ loop uses a Boolean in the form of a ‘Stop’ button to control when the
program ends, and another ‘While’ loop controls when the test data history graph is plotted. The
Boolean case structure is a method of executing conditional text. In this program, the case
structure controls when to capture the images by using an elapsed time node.
Page 14.1019.5
Shift registers transfer values from one iteration of a loop to the next. The shift registers in this
program store the data for the power-displacement plot.
The stacked sequence structure in this program controls when the images are taken. The stacked
sequence structure does not start to execute until all data wired to the structure arrive. The data
wired from each frame leave only when all the frames complete execution. This structure
consists of one or more frames that execute sequentially and is used instead of the flat sequence
structure to save space and to avoid using local variables.
Finally, this program is driven by events. Events are caused by actions the user performs, such
as clicking a button. The event structure allows one to add multiple cases, which can handle one
or more events. Since this program runs continuously, each of the following main program
events are controlled by the user clicking the appropriate button: running the experiment with the
user-supplied conditions, updating the history plot with the test results, and ending the program.
Initialization
It is important, for the purpose of this program, that any new user cannot see the previous user’s
results and that the new user is confident that the displayed values correspond to the selected
input voltage. Hence it is desired that all of the data displays are initially clear and, when the
program is running, that the data displays remain clear until the new values have been calculated
and displayed. Also, it is important that after the voltage has been supplied to the circuit for the
specified amount of time, that the supply voltage returns to zero.
Several methods were used to implement the above initializations as desired. To begin the
program with all of the data displays cleared, the “Clear Indicators When Called” checkbox was
selected under the “VI Properties”. Then the “Select” function was used to implement the midexperiment re-initialization task. Finally, to cause the supply voltage to return to zero, a third
DAQ Assistant was used to force the supply voltage to zero volts.
Error handling
To prevent the user from inputting an invalid supply voltage, the “Prompt User Input” VI was
integrated into the program to show an error message and stop the program if the input voltage
value is typed in as greater than 10 volts or less than 0 volts.
Image acquisition
Page 14.1019.6
An IMAQ PCI-1405 board was used to perform the image acquisition by LabVIEW. The
National Instruments Web site was first consulted to determine how other universities have set
up remote laboratories, including the Stanford University Cyberlab. It was discovered that there
are actually three image feedback implementations for such remote laboratories: (1) imbed live
images into the actual VI front panel, (2) place the picture on a Web page created by LabVIEW,
and (3) use a separate Web page to display the picture. For this project, it was decided that 2
images – captured shortly before and after power was applied to the device – would be
imbedded into the VI front panel. While this means that the experiment will not exactly be
performed in real-time, it’s actually an improvement of the real-time situation: the actuator does
not have to be subjected to a long interval of thermal stress while its displacement is being
measured by the experimenter. The following describes how we accomplished this.
First, the LLSnap.vi example VI was used to verify that the IMAQ board and software were
working properly. The captured images were very blurry, and almost had a shadow effect. To
fix this problem, the NI Measurement and Automation Explorer (MAX) VCR output on CH 0
had to be changed from the CCIR to the NTSC setting, and the acquisition window had to be set
to 640 x 480. Finally, the Image_to_Spreadsheet_no_vision_LV60[1].vi example VI was used
to create a sub-VI, called ISS.vi to make sure that the image on the user’s remote panel appears.
It should be noted that there is a delay of a few seconds between having the image display on the
server and having it display on the remote panel; i.e., there is a communications delay.
Data history plot
Our solution to implementing the MEMS power versus tip displacement plot was to use shift
registers rather than local variables. The waveform chart has a history length and it appends new
data to the old data until the end of the history length is reached; then it overwrites the old data.
By using shift registers, one has the ability to append the new data to the old data for any desired
number of points.
Originally, the plot was graphing with lines between the points, which would be undesirable in
the case when the user didn’t apply the test voltages in monotonically increasing or decreasing
order, so the plot was changed by right-clicking in the lower left corner of the graph and
selecting the appropriate plot format. This can also be done by the program user if she wishes to
change the look of the graph while the VI is running remotely.
A case structure was added to the ‘update graph’ loop so that the ‘clear graph’ and the ‘initialize
graph’ operations are separate. By doing this, the ‘clear graph’ default point could be set to (0,
0). The ‘clear graph’ loop looks at the outer ‘While’ loop iteration. When that loop iteration
equals one, the graph will initialize.
Voltage divider circuit
The voltage divider circuit shown in Figure 4 was constructed on the ELVIS protoboard for
testing purposes, as a precursor to the final implementation with R1 being used as a current-sense
resistor and R2 being replaced by the MEMS device.
Page 14.1019.7
Figure 4: Voltage divider circuit
To avoid having the analog output voltage source (from the DAQ card) be loaded down, the
values of the voltage divider resistors were selected as 100 Ψ and 1 kΨ (as an approximation of
the intended MEMS device’s input resistance), respectively. The circuit and VI were then
verified to be operating correctly in supplying the square voltage pulse at the desired amplitude
and for the desired length of time.
User interface
Once it was verified that the program was running properly, there were several things done to
make the program more user-friendly. Step-by-step user instructions were added to the front
panel. The front panel was re-arranged, organized, and made more pleasing to the eye.
III. Remote Access
LabVIEW features the capability to have a VI viewed and controlled remotely over the Internet
by a user’s Web browser. This is enabled by a Web server on the VI server PC that’s connected
to the experiment equipment. The Web Server has a built-in tool that allows one to enable access
and specify the time limit of the remote user. If there is only one remote user, there is no time
limit. As soon as someone else tries to access the VI, the timer starts. The controlling user can
view the time remaining by right-clicking and requesting to show the control time remaining.
Anyone who does not have control can still view what the controlling user is doing. There is
also a Web Publishing Tool that allows one to modify the look of the HTML document
displaying the VI front panel, including its title, header, and footer text, that will be seen in the
user’s Web browser. That .htm file (with its embedded interface to the VI) has a specific URL,
which is what the remote user needs view and control that particular VI from a Web browser on
their computer. If the computer does not already have LabVIEW installed on it, then the
LabVIEW Run-Time Engine, which can be downloaded for free from www.ni.com/download,
must be installed on the remote user’s computer.
Access issues
Because the Web publishing tool described above does not allow the access limiting desired for
this experiment, some modifications needed to be made. With the built-in capabilities, either all
users can view the VI front panel or none can. But for our purposes, when one student has
access to the remote experiment VI, no other student should be able to view the first student’s
work during his/her experiment.
A second access issue that needed addressing was that University computer security policy
prohibits direct public access to the LabVIEW Web server on the MEMS lab computer. The
experiment VI needs to be accessed indirectly through one of the University’s main Web servers.
Page 14.1019.8
One option explored to solve the access problems was to use a ‘gatekeeper’ VI. This would be a
simple VI that would either link an accessing user to the experiment VI or link that user to
another VI that explains that the experiment VI is currently busy, and that the user should try
again later. One possible implementation was to use property nodes to control access. The
“Connection to Clients” property node has a “VI Name” extension that supplies the name of the
VI on the server that the client is viewing or controlling. This extension would detect whether
someone was connected to the experiment VI or not. Using this property node and extension
along with an “equals” Boolean and a case structure, the access limiting problem was somewhat
solved with this gatekeeper VI that linked to either the experiment VI or a ‘Busy, please try again
later’ VI. The problem with this solution was that the remote VIs ran very slowly because of all
the interconnections.
The second solution to the access limiting problem was much more successful. Using the HTML
code generated by the LabVIEW Web publishing tool, the code was altered slightly and
imbedded in an ASPX file. This type of file requires the Microsoft .NET framework, so the
University’s staff set aside a specific space on one of their main Web servers for this purpose.
Basically, the provided MEMS Experiment URL links the user to a gatekeeper Web page (as
constructed by the ASPX file) where the user must press a “Start Test” button. Pressing that
button causes the ASPX file to call the experiment VI, which is on the MEMS lab computer, by
using that computer’s IP address. If someone is already using the VI, the gatekeeper page then
displays a message that asks the user to try again later. Otherwise, the user is connected to the
experiment VI, and the time limit countdown begins for completion of the experiment. It is also
very important that the user presses the “End Test” button when the experiment has been
completed rather than simply closing the browser window, or else the experiment VI will still
appear to be in use (by others seeking access) until the time limit, which we had set to 12
minutes, is reached. Note that the time limit, button labels, width and height of the VI graphics
block, and user prompts can be changed in the ASPX code by changing the appropriate lines of
code. Furthermore, it is absolutely necessary for the LabVIEW program to be already running
on the lab computer, as well as for the experiment hardware to be powered ON, in order for the
remote user to succeed in accessing and performing the experiment.
IV. Interfacing the MEMS Equipment with LabVIEW, NI ELVIS, and IMAQ Card
The MEMS lab at our University is fully equipped to perform experiments on all types of MEMS
devices, but this particular experiment uses an in-plane electrothermal actuator. Several of these
devices are located on a small die equipped with actuator tip displacement micron-resolution
measurement scales for each device. As shown in Figure 1, each polysilicon line on these
measurement scales is 2 microns wide and the gap (space) between adjacent edges of these lines
is also 2 microns.
The instructor will set up the die with the selected MEMS device in the lab and make appropriate
connections to it before the experiment is to be performed by the students. When the experiment
is complete, the instructor will disconnect everything.
Integrating LabVIEW, ELVIS, and IMAQ with the MEMS setup
Page 14.1019.9
After the initial software and hardware development and testing proved satisfactory, the first
integration task was to merge the voltage divider circuit on the ELVIS protoboard with the
MEMS power circuit with the MEMS device replacing R2 in the circuit of Figure 4 and the other
(100 Ψ+ resistor being used as the current sense resistor. The final circuit diagram is shown in
Figure 5. Note that the circuit connection to the MEMS device goes through a switch box that
connects the selected pair of microprobes with the device. Also, the analog output voltage
(between AO 0 and Ground)7 from the ELVIS protoboard must be amplified by the power
amplifier, which doubles the voltage and amplifies the current coming from the DAQ card via
the ELVIS protoboard.
Figure 5: MEMS remote experiment hardware circuit diagram
Next, the LabVIEW program had to be modified since the voltage across the MEMS device
cannot be read directly. Instead, the voltage across the sense resistor (between AI0+ and AI0-,
which are the positive and negative differential inputs to analog input (AI) channel 0,
respectively) is measured. This not only yields the device current, it can be subtracted from the
input voltage to yield the voltage across the device, and then these values are used to calculate
the power drawn by the MEMS device. The voltage calculations done by LabVIEW were also
verified by oscilloscope measurements.
The MEMS lab is equipped with a video camera, VCR, and TV to capture and display images of
the devices under test. The output of the VCR (with the video camera as input) was connected to
the IMAQ card’s video input. Then the image capture window settings were changed in the NI
Measurement & Automation Explorer (MAX) program so that the image of the MEMS device
on the front panel of the VI showed a good view of the actuator device and its corresponding
measurement scale. The acquisition window settings in MAX will be unique to each individual
experiment setup, so it is necessary to determine the optimized settings each time the experiment
is prepared for the students. An example of the desired image at the appropriate magnification
(highest magnification on microscope) is shown in Figure 1.
V. Unresolved issues
Page 14.1019.10
By the start of the 2006 Fall semester, the hardware and software needed to implement our
MEMS remote experimentation system had been developed and integrated, and the system’s
capability to allow the intended experiment to be performed over the Internet had been verified.
But there were a couple of remaining issues that still have not been resolved at this time. These
are briefly discussed to suggest further work.
One problem encountered was visually determining the displacement of the MEMS device from
the images obtained when power was supplied to it and when it was unpowered. This
‘eyeballing’ of the measurement scale did not yield very fine resolution for the displacement
values, even with the aid of a ruler. Alternative means of obtaining more precise values need to
be explored. Two examples of device power-displacement curves achieved during this project’s
testing phase are shown: Figure 6 shows one curve being displayed on the VI front panel, and
Figure 7 shows a different characteristic being displayed on an Excel chart.
A second problem was uncovered when we attempted to run the experiment from a Mac OSbased client computer. According to NI, it should have been possible to view and control a
remote front panel with Internet Explorer on a Mac OS X-based client computer. However,
Internet Explorer for the Mac platform is no longer available for download and installation, and
we did not succeed in viewing and controlling a remote front panel with either Safari, Firefox,
Netscape or Mozilla in spite of consultations with NI’s technical support staff. But some time
after these consultations were held, NI updated the LabVIEW Run-Time Engine for Mac OS X
that supposedly rectifies this problem. However, we still have not yet succeeded in running this
remote experiment from a Mac OS X-based client computer. We will continue to work with
National Instruments to resolve this issue.
Page 14.1019.11
Figure 6: VI front panel with device power-displacement plot
Figure 7: Excel chart of another device’s power-displacement characteristic
VI. Project Evaluation
This remote experiment has now been performed during the Spring 2007 and 2008 semesters as
part of the series of experiments for our Materials Science laboratory class. The students worked
in small teams. There were 3 teams per lab session and three lab sessions were held each year.
Each team worked with the remote experimentation system for about one hour, with guidance
from the online instructions and the lab instructor. The first time it was done, students assumed
that they were working with a computer simulation. When they realized it was a real device that
they were actually manipulating, another element of interest was added to their experience. To
assure that the subsequent year’s students understood what was happening, before starting this
experiment, they were taken to the MEMs research laboratory where they were able to see the
actual device (through the microscope) and observe the size of the MEMs and the equipment
used to probe, power and measure the device that they would actually be testing. This added to
their overall positive experience.
Page 14.1019.12
A survey instrument was given to each student after they had performed the experiment to
evaluate their experience as well as their thoughts regarding this experiment in particular and
about remote experimentation in general. We then tabulated and evaluated the responses of 55
students in total. Each question was multiple-choice with five possible outcomes. The five were
given numerical values of 0 to 4, corresponding to responses that were most unfavorable to most
favorable, and the scores for each question were averaged. Question 5 “What is your rating of
the concept of remote experimentation systems allowing students to perform experiments
asynchronously (at a time of their choosing) from outside the actual lab?” received the highest
score: 3.34/4.00. Question 9 “Would you be supportive of the development of additional remote
experimentation systems if that would require an additional lab fee to be collected from
students?” received the lowest score: 1.74/4.00; however, when the students were asked “How
much would you be willing to pay as an additional lab fee to support the development of more
remote experimentation systems?”, the average answer was $12 with a majority of the students
choosing $20 as their answer.
They were also asked to write lab reports and to provide qualitative reactions to supplement the
quantitative results of the questionnaire. These responses indicate their overall reactions were
positive although certain reservations were expressed. Several students felt that it was an
interesting concept to be able to control and perform an experiment in the laboratory from an
outside computer anytime and anywhere. They reported that they are looking forward to seeing
the growth of this technology in running laboratory experiments in the future. A typical positive
written comment would be “The lab was ok, but it was the technology behind the MEMS
laboratory experiment that made this very interesting, since I have never worked with something
like this before. I also like the fact that this lab could be performed at home and I am interested
to see the growth in this technology.”
During the experiment, they were able to watch the experiment happen (to a limited extent) yet
perform it somewhere else. They felt that this opens up a world of different possibilities without
having to supply all the materials to perform the experiment. Also, the remote experiment
process may allow less well-equipped laboratories the capability to perform the same experiment
as other more privileged laboratories.
Typical reservations concerned the shortcomings of specific aspects of this remote experiment’s
implementation rather than the fundamental concept, e.g., “see the changes of the MEMS occur
in real time versus [snapshots],” and “need [a better, more accurate] way to measure changes in
deflection.”
VII. Project Impact
This project is making a positive contribution to the infrastructure for research and education.
Both students and researchers are, or will be, benefiting from the MEMS remote experimentation
system. We also plan to use it to increase the public’s awareness of how science and technology
affects our daily lives. These points are elaborated upon in the following discussion.
This project impacts students in the following ways. First, it benefits an average of about 30
undergraduate students per year enrolling in the Materials Science class. Additionally, the 3
undergraduate students who helped develop and test the hardware/software of the remote
experimentation system all gained valuable training and experience because of this project.
Moreover, demonstrations of this system and dissemination of related material will hopefully
motivate pre-Engineering students and influence pre-college students to study Engineering.
This project also positively impacts faculty and other researchers. First, the project director and
co-director had the opportunity to investigate how to improve distance education using the
Internet and to exercise their project management skills in carrying out a plan for doing so.
Furthermore, it is under active consideration for other faculty and other researchers who are offcampus to use this system for conducting remote experiments on MEMS devices.
Page 14.1019.13
Additionally, the infrastructure for research and education has been enhanced by this project.
The hardware and software system developed that comprises the MEMS remote experimentation
setup allows our students to conduct experiments on a MEMS device located in a University
laboratory while off-campus via the Internet and a Web browser. The system description,
developed materials and evaluation results, made available through publications and over the
Internet, will be useful for the development of similar projects elsewhere. In the near future,
enhanced versions of this prototype will allow students and researchers who are off-campus to
conduct experiments on systems located in any of our Science and Engineering laboratories via
the Internet. Such infrastructure enhancements will eventually enable remote experimentation to
become a ubiquitous component of distance education, and act as a means to maximize the
availability of scarce hardware resources in an era of declining budgets.
Finally, this newly developed remote experimentation setup provides additional opportunities to
educate the public on how science and technology affects our daily lives. We plan to achieve
this through presentations/demonstrations during public events and by making information about
this project and its results available on our Department’s Web-site.
VIII. Summary
The main goal of this project was to enable the students enrolled in our Materials Science course
to work with MEMS devices, by creating a program and some circuitry that integrate with an
established MEMS research laboratory experiment setup to facilitate remote experimentation.
What has been accomplished includes a program written in LabVIEW that incorporates data
acquisition using an NI DAQ card, image acquisition utilizing an NI IMAQ card, and error
(including human input errors) and access handling. The program and hardware have been
integrated with the existing MEMS laboratory equipment, and the remote laboratory experiment
can presently be accessed via the Internet by any Windows-based computer that has a Web
browser and the free LabVIEW Run-Time Engine installed. The remote access capabilities
include a means for access limiting so that only one user can have control of the experiment and
view its results at a time. The user is also time-limited for his/her experiment session.
One improvement that can be made to the VI is to incorporate an “Undo” feature on the data
graph so the user can change the graph if a mistake has been made. Another improvement is to
have a more accurate method or means of determining the MEMS actuator’s tip displacement.
In conclusion, the results of this project now afford our Department’s students the unique
educational opportunity of experimenting with MEMS devices. The project’s success has also
laid a firm foundation of the technical infrastructure and expertise necessary for reaching the
ultimate goal of allowing our students to conduct experiments via the Internet on systems located
in any of the University’s Science and Engineering laboratories.
Acknowledgments
This project was supported by an Instructional Development Fund program grant from the
University. Several National Instruments’ staff also provided helpful technical assistance during
various stages of this project.
Page 14.1019.14
Bibliography
1. Diong, B., Perez, M., Kubo Della-Piana, C. and Wicker, R., Remote experimentation with a wind tunnel system
for Controls education. Intl. J. Engineering Education - Special issue on distance controlled laboratories and
learning systems, volume 19, number 3, pages 460-467, June 2003.
2. Siegwart, R. & Goldberg, K. (Guest Eds.), Robots on the web. Special issue of IEEE Robotics & Automation
Magazine , volume 7, issue 2, June 2000.
3. Siegwart, R. & Goldberg, K. (Guest Eds.), Robots on the web. Special issue of IEEE Robotics & Automation
Magazine , volume 7, issue 1, March 2000.
4. Overstreet, J.W. & Tzes, A., An Internet-based real-time control engineering laboratory. IEEE Control Systems
Magazine, volume 19, issue 5, pages 19–34, October 1999.
5. Poindexter, S.E. & Heck, B.S., Using the Web in your courses: what can you do? what should you do? IEEE
Control Systems Magazine , volume 19, issue 1, pages 83–92, February 1999.
6. Bishop, R. H., Learning with LabVIEW 7 Express. Pearson Education, Inc. Upper Saddle River, NJ. 2004.
7. NI Educational Laboratory Virtual Instrumenation Suite (ELVIS) user manual, pages 3-1 to 3-14. Austin, TX.
2004.
Page 14.1019.15